Exhibit 99.1 |
Investment Considerations 1 Quality retail properties located in supply constrained communities in major coastal markets of the United States Capital recycling plan divesting lower tier non-core assets will be substantially completed by the end of 2014 - Approximately $2 billion of acquisitions in target markets since 2009 - Approximately $1 billion of dispositions of non-strategic, non-core assets since 2011 Upgraded portfolio provides attractive pipeline of re/development investment opportunities Diversified tenant mix provides stable and growing stream of cash flow Strong balance sheet with modest leverage, ample liquidity and well-laddered debt maturities Financial capacity and proven ability to execute on opportunistic acquisitions and re/developments We are a premier operator of quality retail properties and are well positioned for continued growth |
Portfolio Well Diversified in Major Supply Constrained Coastal Markets 2 (1) Includes acquisitions and dispositions completed and under contract as of 10/29/2014, and includes development and redevelopment properties. Excludes land, non-retail assets (except Westwood in MD), and unconsolidated JV properties. Estimated fair market values are based on IFRS values as of 9/30/2014. Maryland base rent is retail only. (2) In millions of square feet. ($ Millions, Except Avg. Base Rent) Estimated FMV: $681 % of FMV: 17% Estimated FMV: $214 % of FMV: 6% Estimated FMV: $1,306 % of FMV: 34% Estimated FMV: $201 % of FMV: 5% Estimated FMV: $974 % of FMV: 25% Estimated FMV: $403 % of FMV: 10% $ FMV (1) % FMV # of Prop. GLA (2) Avg. Prop. Value Avg. Base Rent PSF Florida $1,377 35% 57 7.1 $24 $15 California $895 23% 11 2.4 $81 $23 New York $699 18% 8 1.1 $87 $39 Connecticut $330 9% 8 1.0 $41 $20 Georgia $201 5% 9 1.0 $22 $16 Maryland $142 4% 1 0.5 $142 $19 Massachusetts $135 3% 7 0.6 $19 $19 Louisiana $74 2% 7 0.9 $11 $10 North Carolina $23 1% 3 0.4 $8 $7 Total $3,876 100% 111 14.9 $35 $18 |
Corporate Snapshot 3 We own, manage, acquire, develop and redevelop quality retail properties located in supply constrained communities in major coastal markets of the United States As of September 30, 2014, we owned 111 operating properties in 9 states Our capital recycling program has significantly improved our geographic diversification and portfolio demographics Our largest geographic markets as measured by approximate fair market values are New York Metro (27%), South Florida (25%), and California (23%) Our properties have average population within 3 miles of 214k and average household income within 3 miles of $102k The grocer sales in our portfolio average in excess of $625 per square foot As of September 30, 2014, our total equity market capitalization and total enterprise value were $2.9 billion and $4.3 billion, respectively We have investment grade credit ratings of Baa2 (stable) from Moody’s and BBB- (positive) from S&P (4) (1) (3) (2) (5) (1) Includes acquisitions and dispositions completed and under contract as of 10/29/2014, and development and redevelopment properties. Excludes land, non- retail assets, and unconsolidated JV properties. Additionally, we have joint venture interests in 18 retail properties and two office buildings totaling approximately 3.2M sf. (2) Based on total estimated fair market value of operating property portfolio as of 9/30/2014. Includes acquisitions and dispositions completed and under contract as of 10/29/2014, and development and redevelopment properties. Excludes land, non-retail assets, and unconsolidated JV properties. (3) Demographic data based on weighted estimated fair market value of assets. Includes acquisitions and dispositions completed and under contract as of 10/29/2014, and development and redevelopment properties. Source: Sites USA. (4) Grocer sales based on most recent available data as of 6/30/2014 and weighted by GLA. Excludes grocers who have vacated but are still paying rent. (5) Based on diluted shares of 134.4M. |
3Q14 Summary Highlights Earnings 3Q14 Recurring FFO was $0.31/share, up 3% vs. 3Q13. YTD Recurring FFO was $0.98/share, up 5% vs. prior year, and benefitted by $0.04/share from the 1Q14 pick-up from the Loehmann’s below market lease liability write-off and a bad debt expense reversal. Operating fundamentals Same property NOI increased 2.5% vs. 3Q13, driven primarily by new lease rent commencements and contractual increases. Adjusted to include two redevelopment assets with stabilized NOI but pending reentry to the SS pool, SS NOI increased 3.9% vs. 3Q13 Consolidated shopping center occupancy was 94.4%, up 20 bps vs. 2Q14 and up 200 bps vs. 3Q13. Consolidated shop occupancy was 85.5%, up 70 bps vs. 2Q14, and the highest level in six years. SS occupancy was unchanged at 94.4% vs. 2Q14, and up 10 bps to 94.4% vs. 3Q13 Executed 122 new leases, renewals and options, totaling 596k sf at an average rent spread of 9.2% on a same space basis, including 177k sf of new leases at an average rent spread of 2.3% on a same space basis Average base rents were $17.00/sf, up 1.9% vs. 2Q14 and up 9.5% vs. 3Q13 Disposition activities Sold eight non-core assets for $64M during 3Q14. YTD through 10/29/2014, sold twenty non-core assets for $142M, and had an additional $8M of non-core assets under contract. The capitalization rate for assets sold and under contract for sale was 7.9% (1) Development and redevelopment activities Ended 3Q14 with a $134M active gross re/development pipeline, $52M of which remained to be incurred At Broadway Plaza Phase I, The Sports Authority, TJ Maxx, Aldi and Party City have opened, and a new lease was signed with Five Below. Phase II (33k sf) is under construction and leases have been signed with Blink Fitness (16k sf) and Starbucks (1.4k sf). At Alafaya Commons, demolition work ongoing for the 63k sf Academy Sports, which is expected to open in 1Q15 At 101 7th Avenue, work ongoing to prepare the space for a new Barneys New York flagship store, which is expected to be delivered by 1Q15 so that Barneys may commence its build-out. Barneys New York is expected to open late 1Q16. Other re-tenanting / expansion projects underway at Ambassador Row Courtyards, South Beach Regional, Compo Acres and Darinor Financing activities and balance sheet Raised $105M net proceeds in a common stock offering to fund re/development and repay near-term debt maturities 4 (1) Capitalization rate is weighted average and excludes an asset which was sold via short-sale transaction for $5.4M. |
Quality of Earnings Has Been Upgraded via Capital Recycling 5 Strategy to upgrade and diversify asset base commenced in 2009 and will be substantially complete by year end 2014 Increased concentration of rents in supply constrained markets characterized by superior demographics, and reduced exposure to lower quality assets Population density and average household income of asset base have increased 164% and 34%, respectively, since 2008 Average base rents have increased 22% since 4Q11 and 37% since 4Q10 Average base rents of Top 25 tenants have increased 48% since 4Q11 and 65% since 4Q10 Top 25 tenants are a well diversified mix of leading retailers including Trader Joe’s, The Container Store, Nordstrom, CVS Pharmacy, Dick’s Sporting Goods, and TJX Companies, paying rents commensurate with the high quality of our real estate Publix exposure reduced from 11% of annual minimum rents in 2010 to 3% in 3Q14 YTD 3Q14, 50% of NOI was generated from high barrier northeast and west coast markets vs. 15% in 2010 |
Improved Portfolio Quality Shows in Operating Fundamentals 6 (1) NOI growth is presented on a same property cash basis for each respective period end. (2) For the consolidated shopping center portfolio as of each respective period end. Excludes development and redevelopment properties, and non-retail assets. (3) If adjusted for two redevelopment assets (Boca Village Square and Dick’s Sporting Goods at Serramonte Shopping Center), which have stabilized cash NOI but are not yet included in the same property pool, YTD SS NOI increased 3.3% vs. same period of 2013. Consolidated Occupancy (2) SS NOI Growth % (1) Average Base Rent (2) • Full year target: +2.5% to +3.25% • If adjusted for Redev: 3.3% YTD (3) • 2.4% YTD impacted by small number of low value assets that are targeted for disposition • +200 bps YTD • Goal at beginning of year: 95% 3.3% • +22% since 2011 1.3% 3.3% 3.1% 2.4% 0% 1% 2% 3% 4% 5% 6% 2011 2012 2013 YTD 2014 $13.97 $14.58 $16.16 $17.00 $10 $11 $12 $13 $14 $15 $16 $17 $18 $19 $20 2011 2012 2013 YTD 2014 90.7% 92.1% 92.4% 94.4% 90% 91% 92% 93% 94% 95% 96% 97% 98% 2011 2012 2013 YTD 2014 |
Improved Portfolio Quality Shows in Operating Fundamentals 7 Rent Spread – Total New Leases, Renewals & Options (1) Rent Spread – New Leases (1) • Negotiated renewal spreads were 9.0% YTD and 15.7% for the 3Q 6.3% 12.7% 8.4% 0% 2% 4% 6% 8% 10% 12% 14% 16% 18% 2012 2013 2014 YTD 6.6% 11.1% 6.8% 0% 2% 4% 6% 8% 10% 12% 14% 16% 18% 2012 2013 2014 YTD (1) Rent spreads for new leases reflect same-space leasing where amount of rent paid by prior tenant is available regardless of the amount of time the space has been vacant. Including the Barneys New York lease at 101 7 Ave, new lease rent spreads were 57.6% for 2013. Including the Roses lease at Park Promenade, new lease rent spreads were negative 1.1% for 2014 YTD. Including the Barneys New York lease at 101 7 Ave, total rent spreads were 23.0% for 2013. Including the Roses lease at Park Promenade, total rent spreads were 4.8% for 2014 YTD. th th |
Progress Against 2014 Strategic Goals 8 Meet or exceed fundamental operating goals Increase SS NOI +2.5% to 3.5% Year-end SS occupancy of 95% Recurring FFO of $1.23 to $1.28 per fully diluted share Continue to upgrade portfolio quality and demographic profile through strategic transactions Core acquisition activity of $100 to $200M, in addition to the $103M closed in January 2014 JV acquisition activity of $100 to $200M Non-core asset dispositions of $125 to $175M Continue to strengthen development and redevelopment pipeline Complete construction of Broadway Plaza Phase I, four anchors commence rent by year-end Substantially complete construction of redevelopment projects at Boca Village, Lake Mary Centre, and Boynton Plaza Substantially advance construction of Broadway Plaza Phase II and Willows Shopping Center Establish additional redevelopment and densification plans at Serramonte and Potrero in the West Coast Establish redevelopment plans at Westwood in Bethesda, MD Maintain low leverage and ample liquidity Continue to strengthen credit metrics and maintain large unencumbered asset base Operating Fundamentals Capital Recycling Value Creation Balance Sheet Management 2014 Goals 3Q14 Progress Assessment YTD SS NOI +2.4%, revised guidance range 2.5% to 3.25% SS Occupancy 94.4% at 3Q14, year-end goal still 95% Raised guidance to range of $1.27 to $1.28/share Reduced core guidance to zero for 4Q14 Reduced JV guidance to zero for 4Q14 $142M non-core assets sold YTD, an additional $8M under contract, raised guidance to $150 to $175M All four anchors at Broadway Plaza Phase I opened, new lease with Five Below signed bringing leased rate to 78% Boca Village and Lake Mary Centre (phase I) completed. Boynton will be substantially completed 1Q15. Broadway Plaza Phase II construction underway, two leases signed, center to open 3Q15; Ulta and UFC at Willows opened Planning progressing for Serramonte next phase and Potrero Re-zoning process commenced for Westwood redevelopment Strong balance sheet with improved leverage and liquidity, YTD net debt/ EBITDA 5.6x 77% unencumbered cash NOI (same property pool) |
Disciplined Capital Allocation Has Preserved A Strong Balance Sheet 9 Key balance sheet statistics as of September 30, 2014: In Millions (1) Excludes any amounts drawn under the revolving credit facility which expires on 9/30/15. The revolving credit facility was undrawn at 9/30/2014. Note: Debt maturity schedule as of 9/30/2014. Secured Debt amounts include scheduled principal amortization. Rates for Secured Debt exclude principal amortization and are based on weighted average of balances as of 9/30/2014. Credit facility is presented as due on the initial maturity date. $575M revolving credit facility which matures September 30, 2015 with a one year extension option - In the process of renewing facility sized at $600M with improved pricing, more favorable covenants, and increased value from unencumbered asset pool Strong lending relationships with both traditional banks and life insurance companies Demonstrated access to the public markets Modest leverage, ample liquidity and well-laddered debt maturities 5.38% 6.00% 6.12% 3.75% 3.17% 5.29% 5.96% 5.58% 6.25% 6.48% 6.14% 6.39% $2 $174 $234 $289 $62 $274 $6 $18 $306 $23 $0 $50 $100 $150 $200 $250 $300 $350 2014 2015 2016 2017 2018 2019 2020 2021 2022 Thereafter Secured Debt Senior Notes Term Loan Credit Facility - Net Debt to Adjusted EBITDA: 5.6x - Adjusted EBITDA to Interest Expense: 3.6x - Adjusted EBITDA to Fixed Charges: 3.2x - Net Debt to Total Market Cap: 30.6% - Net Debt to Gross Real Estate: 39.9% - Weighted average term for total debt: 4.3 years (1) - Weighted average interest rate on total debt: 4.96% (1) |
Below market leases Significant below market leases recently recaptured - 1175 Third Avenue (New York, NY) - Food Emporium paid $42 psf, paying $105 psf since 2Q13 - Aventura Square (Aventura, FL) - Old Navy paid $18 psf, lease expired 1/2014, executed renewal during 2Q13 at $45 psf which commenced 2/2014 - 101 7th Avenue (New York, NY) - Loehmann’s paid $25 psf, Barneys will pay ~$80 psf starting 1Q16 Circle Center West (Long Beach, CA) - Marshalls pays $10 psf, lease expires 1Q16, executed renewal during 3Q14 at $21 psf starting 1Q16 Additional below market leases to be captured in coming years are significant - Aventura Square (Aventura, FL) - DSW pays $20 psf, lease expires 2018 - Westwood (Bethesda, MD) - Giant Food pays $2 psf, lease expires 2019 - Copps Hill (Ridgefield, CT) - Kohl’s pays $2.40 psf, lease expires 2021 - Circle Centers (Long Beach, CA) - two additional anchor tenants expiring 2018 and 2022, ~50% of market - The Village Center (Westport, CT) - in process of re-tenanting spaces with previous below market leases - Pleasanton Plaza (Pleasanton, CA) - several below market leases rolling in next several years Increase shop occupancy Shop occupancy was 85.5% at 9/30/2014, up 10 bps Q/Q same site, driven by 120 bps gains in Florida Leadership is focused on Florida, which has the greatest opportunity to drive shop occupancy gains Redevelopment and site densification Acquired properties provide opportunity for redevelopment and densification - Serramonte (CA) - entertainment wing and restaurants will be next phase - Westwood (MD) - opportunity to increase density, will likely include residential component - Pleasanton (CA) / Darinor Plaza (CT) - expansion and additional outparcel opportunities Selective core acquisitions We will continue to seek acquisitions in our core urban markets Focus on assets with highly-productive anchors, below market anchor rents, and redevelopment opportunities Expense control Intense focus on managing general and administrative costs throughout organization, and on cost recovery and careful management of non-recoverable costs Our Path to Sustained NOI Growth 10 |
Our Path to Increased Occupancy 11 Key strategic goal heading into 2014 was to increase occupancy from 92.4% at 4Q13 to 95% by 4Q14 through a combination of capital recycling and organic leasing - 3Q14 consolidated shopping center occupancy increased to 94.4%, up 200 bps vs. 4Q13 - 3Q14 Florida same property occupancy increased 50 bps vs. 2Q14, driven by 35k sf of net lease-up, primarily shop space (Florida sequential quarter shop occupancy up 120 bps) - Continued organic lease-up and disposition of a few non-core assets is expected to further raise consolidated occupancy by year-end to near 95% Organic growth expected to be driven by - Targeting tenants benefitting from improved local economic conditions (food users, value oriented/ discounters, franchise operators, health and fitness users, specialty grocers, and mobile phone stores) - Investment in site redevelopment and anchor re-tenanting, as new and better anchor tenants drive traffic to shop space and increase demand for shop space - Focus on attracting stronger shop operators, including national franchise operators Continued emphasis is on Florida which contains the greatest opportunity |
Leadership is Focused on Leasing Execution 12 Consolidated shopping center occupancy trends (1) New leadership has implemented changes focused on driving occupancy - Added four new agents focused on the southeast and Florida assets - New leasing commission structure to incent shop leasing - Process changes focused on increasing speed of decision making - New lease tracking system focused on getting quicker rent commencements Tenant concentration is well diversified, no tenant generates more than 3.7% of AMR - ~75% of AMR generated from national / franchise tenants - ~60% of shopping centers are grocery-anchored Total Anchor Shop September 30, 2014 94.4% 99.0% 85.5% March 31, 2014 93.9% 99.3% 83.6% December 31, 2013 92.4% 97.8% 82.1% September 30, 2013 92.4% 98.1% 81.5% (1) Data for occupancy is for the consolidated portfolio, and excludes development and redevelopment properties, non-retail properties, and unconsolidated joint ventures. |
Florida comprises 47% of operating portfolio GLA, 39% of YTD total cash NOI, and 35% of estimated fair value Vacant GLA in Florida accounts for approximately 60% of total company vacant GLA, and 98% of vacant Florida GLA is shop space Florida occupancy was adversely affected by the economic downturn in 2009, but has been showing signs of steady recovery (1) Future lease-up in Florida is focused on the following - Shop lease-up in targeted food use categories (fast casual, coffee/breakfast, specialty restaurants) - Service use categories related to health care, urgent care and dental offices - Combining vacant shop space to facilitate new junior anchors - Lack of new construction starts provides more opportunities to replace weaker retailers - Targeting tenants least impacted by e-commerce (convenience and value oriented users) Improving Florida shop occupancy, at 80.9% at 9/30/2014 including redevelopment properties, has a meaningful impact to NOI (2) - Total “lost revenue” due to Florida shop vacancy is approximately $11.5M annually (2) - Every 100 basis point increase in shop occupancy adds approximately $600k revenue annually (2) GLA Total Occupancy Avg. Base Rent September 30, 2014 6,304,360 92.9% $15.02 September 30, 2013 7,137,706 90.5% $13.78 September 30, 2012 7,518,394 90.3% $13.43 September 30, 2011 9,362,192 89.7% $12.82 Florida – Past Risk and Drag, Now an Attractive Opportunity 13 (1) Data for Florida occupancy and average base rents is for the consolidated portfolio, and excludes redevelopment properties. (2) Florida shop space lost revenue and occupancy sensitivity analysis is based on the Florida operating portfolio including redevelopment properties, as presented in the appendix. “Lost revenue” includes estimated base rents and estimated NNN reimbursements. |
South Florida 14 |
Jacksonville 15 |
Orlando 16 |
Tampa 17 |
Sun Coast 18 |
Significant Development and Redevelopment Opportunities Will Help Drive Future Growth 19 Large scale expansions and new ground up construction Broadway Plaza - based on retail demand, expanded project and building new 33k sf two-story building adjacent to existing Phase I development. Blink signed as anchor for second level. Serramonte Center - restaurant outparcels, entertainment wing, new anchors (e.g., Dick’s) Westwood Center - redevelop “1950s” neighborhood center to capitalize on superior demographics Potrero Center - further densify site and consider multi-family component Consolidate poorly utilized shop space for junior and mid box anchors Kirkman Shoppes - L.A. Fitness (41k sf) backfilling poorly configured corner space, also adding new free-standing 16k sf Walgreens outparcel Pablo Plaza - identified 30k sf of shops that can be backfilled with junior boxes Replace underperforming anchor stores with stronger operators 101 7th Avenue - replacing Loehmann’s with Barneys New York Lake Mary Centre (phase II) - backfilling Kmart box with Academy Sports and another junior anchor Charlotte Square - have backfilled local furniture operator with Wal-Mart Neighborhood Market Expand successful anchor tenants Boynton Plaza - building Publix a new 54k sf store Ambassador Row Courtyards - adding Cost Plus World Market in reconfigured space South Beach Regional - adding Trader Joe’s to backfill poorly configured shop space, also adding Ulta Countryside Shops - build new Publix and backfill existing box with value-oriented retail / restaurants Add outparcels / expand existing food users Darinor Plaza - adding new Starbucks pad Our upgraded portfolio of larger dominant assets contains a pipeline of attractive redevelopment opportunities |
Several Significant Re/Development Assets Will Help to Drive Growth from In-Place Cash NOI to Future Cash NOI 20 Re/Development Asset Market 2014E NOI Future NOI (1) Estimated Timing Estimated Cap Rate (2) The Gallery At Westbury Plaza Long Island, NY ~ $12M $14M + 2016 5.0% Broadway Plaza Bronx, NY < $0.5M $5M + 2016-2017 5.0% Willows Shopping Center Concord, CA < $5M $6M + 2016 5.0% 101 7 th Avenue New York, NY $0M ~ $3.9M 2016-2017 4.0% Boynton Plaza Boynton Beach, FL ~ $1.1M ~ $2M 2016 5.5% Lake Mary Centre Lake Mary, FL ~ $2.8M $4M + 2016 6.0% Kirkman Shoppes Orlando, FL ~ $1.1M ~ $2.4M 2016 6.5% Boca Village Square Boca Raton, FL ~ $1.2M ~ $2M 2016 5.0% (1) Estimated future NOI represents annual run rate upon stabilization of anchor rents and, if applicable, other expected center lease-up. (2) Estimated capitalization rate for similar quality assets in similar markets in today’s transaction environment. |
The Gallery at Westbury Plaza Garden City, NY 21 Location Garden City, NY GLA 312k sf Development budget (1) $128.6M Estimated cost to complete as of 9/30/2014 $4.9M Lease-up and operating status Opened Fall 2012. Project was substantially completed 4Q13 and was 94% leased as of 9/30/2014. Will enter the same property pool in 1Q15. Key tenants Saks Off Fifth, Bloomingdale’s, Nordstrom Rack, Old Navy, Trader Joe’s, Ulta, Home Goods, GAP, Banana Republic, The Container Store, Shake Shack, Starbucks, SA Elite, Verizon, Bank of America, Famous Footwear, Charming Charlie, GNC, Lane Bryant, Noodles, Ruby & Jenna, Red Mango Expected stabilized yield ~11% (1) Net estimated cost including estimate of tax refunds for eligible costs incurred as part of participation in New York State’s Brownfield Cleanup Program. |
The Gallery at Westbury Plaza Garden City, NY (Continued) 22 |
Broadway Plaza Development Bronx, New York 23 |
Broadway Plaza Development Bronx, New York (Continued) 24 (1) Includes land cost. Location Bronx, NY GLA 148k sf total project GLA, with Phase I comprising 115k sf and Phase II comprising an additional 33k sf on corner of Broadway and West 230th. Development budget $66.5M Incurred as of 9/30/2014 (1) $52.2M Estimated cost to complete $14.3M Phase I All four anchors including The Sports Authority (30k sf), TJ Maxx (24k sf), Aldi (18k sf), and Party City (10k sf), representing 72% of GLA, opened for business. Recently signed lease with Five Below (9k sf), and in discussions on remaining space. Lease-up - Phase II Leases signed with Blink Fitness (16k sf) for the entire second level, and Starbucks (1.4k sf) on the ground floor. Phase II is under construction and is expected to begin opening in stages in 3Q15. Target NOI stabilization 1Q16 Expected stabilized yield 8% - 9% |
Broadway Plaza Development Bronx, New York (Continued) 25 Broadway View |
Broadway Plaza Development Bronx, New York (Continued) 26 |
Serramonte Shopping Center Daly City, California 27 Expansion (1) The budget was increased by $2M from the original budget due to the tenant’s request for modifications to the space in exchange for increased rent. Dick’s redevelopment • The new Dick’s Sporting Goods was completed within budget and turned over to the tenant, and a successful grand opening occurred in April • Dick’s is the mall’s fourth anchor, joining Target, JC Penney, and Macy’s • Phase I of a multi-year, multi-phase plan to re- brand and expand the property Dick’s GLA 84k sf Dick’s budget / incurred (1) $19M Dick’s expected stabilized yield ~10% Expected to enter SS NOI pool in 3Q15 Future redevelopment • Future phases at Serramonte may add 100k to 200k sf of additional GLA including a grocery store, pharmacy, discounters, a theater, more restaurants, and entertainment |
Serramonte Shopping Center Daly City, California (Continued) 28 Expansion Projects |
Potrero Shopping Center San Francisco, California 29 Background Future redevelopment goals • Densify the site with additional retail and potentially residential units • 200 Potrero Avenue, an adjacent 30k sf building acquired in 4Q12 for $6M, provides additional flexibility to relocate tenants and improve Potrero Center over time • Potrero Shopping Center was acquired in March 2012 for $111M |
Westwood Shopping Center Bethesda, Maryland 30 Description • 22 acre property in Bethesda, Maryland comprised of seven parcels, including 214k sf of retail space and 252k sf of residential space • Superior demographics with 3 mile population of 140k and average household income of $200k+ • Closed on final two parcels in January 2014, bringing total investment in property to $140M Opportunity • Redevelop “1950s” shopping center in heart of highly affluent D.C. suburb, including upgrading tenant mix • Significant below market lease with anchor Giant Food expiring 2019 with no options • Re-zoning process has commenced |
Westwood Shopping Center Bethesda, Maryland (Continued) 31 |
Willows Shopping Center Redevelopment Concord, CA 32 Redevelopment Plan Challenges Too many interior facing shop spaces Poor traffic patterns limiting shopping in the rear of the center Insufficient gathering spaces and amenities to take advantage of the center’s longstanding connection to the community Architectural design is unconventional and outdated Create new access road to improve circulation and visibility for shop tenants New architectural design to improve roof lines, refresh color scheme and use modern materials Create a community plaza with play areas and green space well suited to host events and drive ancillary income Prior Site Plan |
Willows Shopping Center Redevelopment Concord, CA (Continued) 33 Proposed Site Plan Location Concord, CA GLA total center 252k sf GLA redevelopment 49k sf (19%) Redevelopment budget / to be incurred $13.5M / $5.8M Project • ~$1M has been invested to replace a 12k sf dated restaurant building with a popular new concept, Lazy Dog, occupying 9k sf • An additional $12M will be invested to construct 20k sf of new buildings for a new Ulta junior anchor, an expanded UFC Gym, and new shop space; renovate facades on 20k sf of challenging shop space; and construct two new vehicular roads and an open pedestrian area • New 10k sf Ulta and 5k sf UFC expansion recently opened • Interior courtyard reconfiguration and road started in 2Q14, expected to complete early 2015 Target stabilization date 3Q 2015 Expected stabilized yield ~8% |
101 7th Avenue New York, New York 34 Background • 57k sf four-story retail condominium acquired 2Q11 with Loehmann’s as sole tenant • Lease expiration date was March 2016 • $25 psf, $1.4M per year, well below market • Loehmann’s filed bankruptcy 4Q13 Barneys New York • Executed lease in 4Q13 with Barneys • Barneys returns “home” to location of original flagship store in Manhattan • Barneys plans to invest significant capital to redevelop store • New rent of $4.5M per year commencing by 2Q16, 221% spread • 20-year term with option increases Total Redevelopment Budget $12.5M |
Florida Redevelopment Opportunities 35 Lake Mary Centre, Lake Mary, FL Boynton Plaza, Boynton Beach, FL Budget (1) $7.6M Incurred as of 9/30/2014 $4.4M Target stabilization (2) 2Q15 Description • Publix expansion • 54k sf project GLA, 107k sf property GLA Budget $12.5M Incurred as of 9/30/2014 $5.6M Target stabilization (2)(3) 2Q15 Description • The Fresh Market and Ross opened for business 2Q14 in the former Albertson’s space • Signed 63k sf lease with Academy Sports for majority of former Kmart space, expected to be delivered in 1Q15 (1) Net estimated project cost. (2) Date that construction is expected to be complete and the anchor(s) commence rent. (3) The first phase comprised of The Fresh Market and Ross was stabilized in 2Q14, and the second phase comprised of Academy Sports is expected to stabilize in 2Q15. |
Florida Redevelopment Opportunities (Continued) 36 Kirkman Shoppes, Orlando, FL Budget $13.1M Incurred as of 9/30/2014 $6.8M Target stabilization (1) 3Q15 Description • Anchor re-tenanting with 41k sf L.A. Fitness under construction, expected to open 1Q15 and commence rent 3Q15 • 16k sf free-standing Walgreens with construction well underway and the store is expected to open 1Q15 (1) Date that construction is expected to be complete and the anchor(s) commence rent. |
Florida Redevelopment Opportunities (Continued) 37 Boca Village Square, Boca Raton, FL Budget (1) $10.9M Incurred as of 9/30/2014 $9.1M Target stabilization (2) 3Q14 Description • Redevelopment of CVS Pharmacy adding a drive-thru • Eliminating interior courtyard space and enhancing shop visibility • 42k sf project GLA, 92k sf property GLA • Property is pending twelve month stabilization and is expected to enter the SS NOI pool in 4Q15 (1) Net estimated project cost. (2) Date that construction is expected to be complete and the anchor(s) commence rent. |
4Q 2013 Acquisition: Pleasanton Plaza Pleasanton, CA 38 Acquisition Date October 2013 Price $30.9M Debt Assumed $20.0M due 6/2015 Total GLA 163k Leased Rate at 9/30/2014 95% 3 Mile Avg. Income >$120k Asset Strategy • Anchors significantly below market • Expansion and redevelopment opportunities • Potential to add one or more outparcels • Upgrade facade, parking lot, and add amenities and restaurants |
4Q 2013 Acquisition: The Village Center Westport, CT 39 Acquisition Date October 2013 Price $54.3M Debt Assumed $15.7M due 6/2019 Total GLA 89k Leased Rate at 9/30/2014 86% 3 Mile Avg. Income >$220k Asset Strategy • Forcing vacancy of selected shop spaces in preparation for an upscale redevelopment that will entail a complete remerchandising with improvement to tenant mix and upgraded retailer quality • Create new shopping destination in Westport with own identity and brand on self contained 7 ½ acre site • Offer “main-street” quality shopping experience, but with greater convenience for consumers |
Appendix • Summary of Pro Forma Portfolio Metrics 40 |
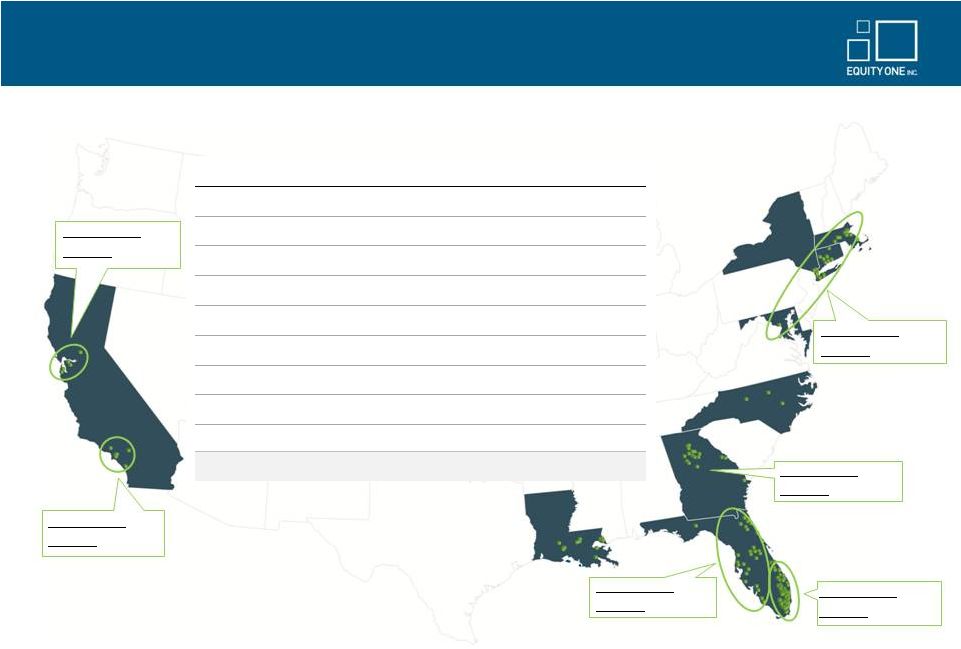
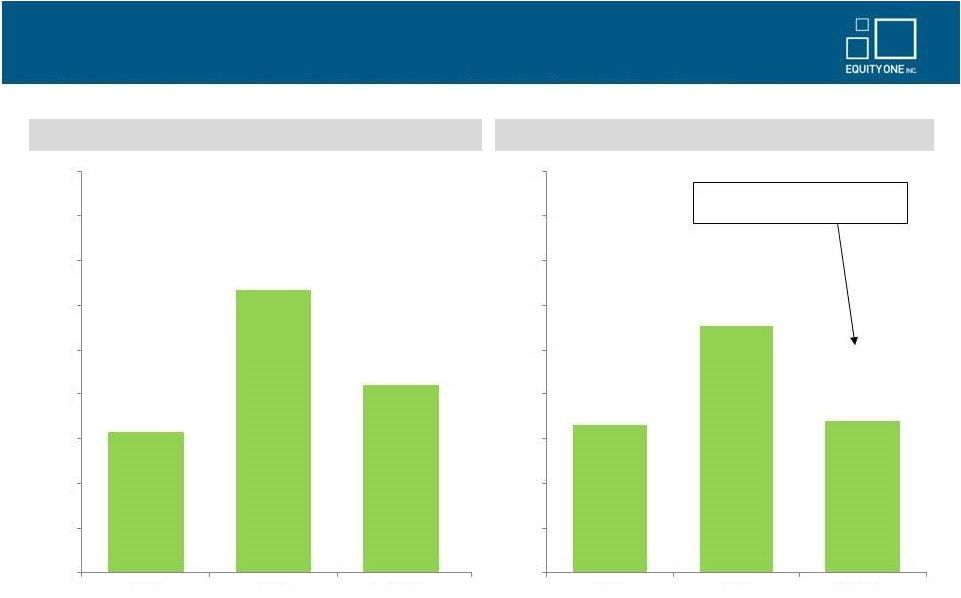
9/30/14 Occupancy In-Place Debt (9/30/14) No. of Centers 3Q14 Fair Value ($000) Value per Property ($000) GLA Total Anchor Shop Base Rent PSF Avg 3-mi Population Avg 3-mi HH Income Grocer Sales PSF Balance ($000) Interest Rate Years to Maturity CONSOLIDATED PORTFOLIO Florida South Florida 33 973,607 $ 29,503 $ 4,331,675 94.1% 99.6% 85.4% 16.02 $ 133,146 77,481 $ 626 $ 95,326 $ 6.33% 4.9 Jacksonville 7 130,067 $ 18,581 $ 929,403 91.0% 100.0% 72.7% 12.63 $ 42,854 87,826 $ 336 $ - $ - - Orlando 7 118,619 $ 16,946 $ 926,265 85.4% 95.3% 74.3% 13.81 $ 78,356 77,913 $ 207 $ - $ - - Tampa 4 86,325 $ 21,581 $ 454,761 87.3% 100.0% 70.4% 17.29 $ 45,514 96,273 $ 519 $ 15,595 $ 5.75% 1.7 Sun Coast 6 68,400 $ 11,400 $ 426,891 92.1% 100.0% 79.8% 12.43 $ 40,357 65,077 $ 756 $ 4,378 $ 6.50% 9.4 Florida Total 57 1,377,018 $ 24,158 $ 7,068,995 92.0% 99.2% 80.9% 15.17 $ 109,795 79,057 $ 609 $ 115,299 $ 6.26% 4.7 California San Francisco 6 680,946 $ 113,491 $ 1,790,587 97.1% 100.0% 90.8% 22.86 $ 214,319 98,936 $ 800 $ 73,713 $ 5.74% 1.7 Los Angeles 5 214,467 $ 42,893 $ 593,939 98.1% 100.0% 95.0% 22.38 $ 240,280 95,327 $ 513 $ 85,138 $ 5.46% 4.5 California Total 11 895,413 $ 81,401 $ 2,384,526 97.3% 100.0% 92.1% 22.74 $ 220,537 98,071 $ 619 $ 158,850 $ 5.59% 3.2 New York 8 698,322 $ 87,290 $ 1,092,227 97.8% 100.0% 85.3% 39.05 $ 570,823 107,919 $ 1,550 $ 22,877 $ 6.52% 2.5 Connecticut 8 330,067 $ 41,258 $ 983,845 96.4% 98.5% 92.1% 20.27 $ 37,399 154,164 $ 912 $ 95,972 $ 5.72% 3.7 Georgia 9 200,871 $ 22,319 $ 983,592 93.3% 100.0% 82.8% 15.83 $ 99,107 114,596 $ 536 $ 6,937 $ 7.94% 6.6 Maryland 1 142,131 $ 142,131 $ 466,173 97.0% 100.0% 86.2% 19.35 $ 142,569 216,130 $ 832 $ - $ - - Massachusetts 7 135,230 $ 19,319 $ 602,929 98.1% 100.0% 84.3% 18.71 $ 187,219 91,408 $ 348 $ 6,654 $ 8.07% 9.9 Louisiana 7 74,098 $ 10,585 $ 883,066 93.9% 93.3% 95.1% 9.90 $ 65,310 82,217 $ 218 $ - $ - - North Carolina 3 23,200 $ 7,733 $ 436,511 95.1% 100.0% 80.9% 6.71 $ 28,591 52,509 $ 367 $ - $ - - Pro Forma Consolidated Portfolio 111 3,876,349 $ 34,922 $ 14,901,864 94.2% 99.1% 84.6% 18.26 $ 214,278 102,244 $ 626 $ 406,589 $ 5.94% 3.9 (1) Fair value of Broadway Plaza is based on the budgeted construction cost, as it is currently in development. (2) New York occupancy rates exclude Broadway Plaza (in development). (3) Pro forma for dispositions completed and under contract as of 10/29/2014. Includes development and redevelopment properties. Excludes land, non-retail assets (with exception of Westwood in Bethesda, MD), and unconsolidated JV properties. Maryland base rent is retail only. Summary of Pro Forma Portfolio Metrics 41 (1) (2) (3) |
Certain matters discussed by Equity One in this presentation constitute forward-looking statements within the meaning of the federal securities laws. Forward-looking statements can be identified by the use of forward-looking terminology such as “may,” “will,” “might,” “would,” “expect,” “anticipate,” “estimate,” “could,” “should,” “believe,” “intend,” “project,” “forecast,” “target,” “plan,” or “continue” or the negative of these words or other variations or comparable terminology. Although Equity One believes that the expectations reflected in such forward-looking statements are based upon reasonable assumptions, it can give no assurance that these expectations will be achieved and actual results could differ materially from current expectations. Factors that could cause actual results to differ from expectations are described in Equity One’s filings with the Securities and Exchange Commission. This presentation also contains non-GAAP financial measures, including Funds from Operations, or FFO. Reconciliations of these non-GAAP financial measures to the most directly comparable GAAP measures can be found in Equity One’s quarterly supplemental information package and in filings made with the SEC which are available on its website at www.equityone.net. Forward-Looking Statements 42 |