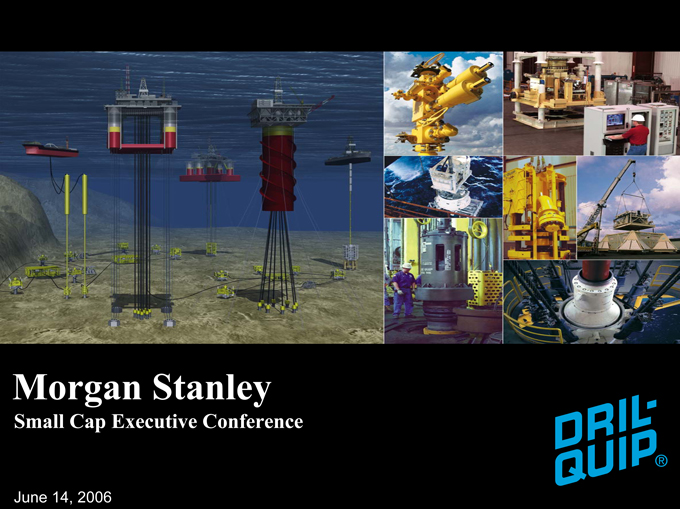
Exhibit 99.1
Forward-Looking Statements
The information furnished in this presentation contains “forward-looking statements” within the meaning of the Federal Securities laws. Forward-looking statements include projections, estimates, expectations, forecasts, plans and objectives, and are based on assumptions, estimates and risk analysis made by management of Dril-Quip in light of its experience and perception of historical trends, current conditions, expected future developments and other factors. No assurance can be given that actual future results will not differ materially from those contained in the forward-looking statements in this presentation. Although Dril-Quip believes that all such statements contained in this presentation are based on reasonable assumptions, there are numerous variables of an unpredictable nature or outside of Dril-Quip’s control that could affect Dril-Quip’s future results and the value of its shares. Each investor must assess and bear the risk of uncertainty inherent in the forward-looking statements contained in this presentation. Please refer to Dril-Quip’s filings with the SEC for additional discussion of risks and uncertainties that may affect Dril-Quip’s actual future results. Dril-Quip undertakes no obligation to update the forward-looking statements contained herein.

Company Overview
Founded in 1981 and listed on the NYSE in 1997, Dril-Quip designs, manufactures, and markets proprietary equipment used in the exploration and production of oil and gas reserves throughout the world.
| • | Profitable every year since 1983 |
| • | 100% internally generated growth |
| • | Co-CEO’s have over 100 years of combined industry experience |
Experienced Management Team
LARRY REIMERT Co-CEO | GARY SMITH Co-CEO | MIKE WALKER Co-CEO | ||
• Engineering | • Sales | • Manufacturing | ||
• Product | • Service | • Facilities | ||
Development |
• Administration | • Purchasing | ||
• Finance | ||||
JERRY BROOKS CFO | ||||
Strong Growth Profile
| • | Pure Play on Rapidly Growing Offshore Market |
| • | Significant Operating Leverage to Up-Cycle |
| • | Vertically Integrated, Low Cost Manufacturer |
| • | Available Capacity to Capitalize on the Market |
| • | Consistent Track Record of New Product Innovation |
| • | Highly Motivated, Experienced Management Team |
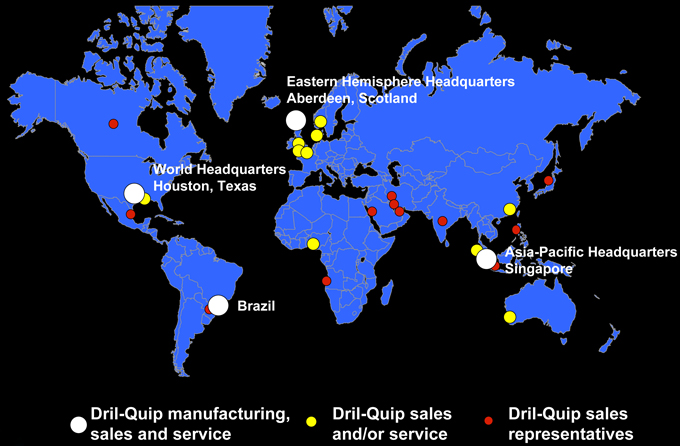
Strong Global Presence
Worldwide offices located near key demand centers
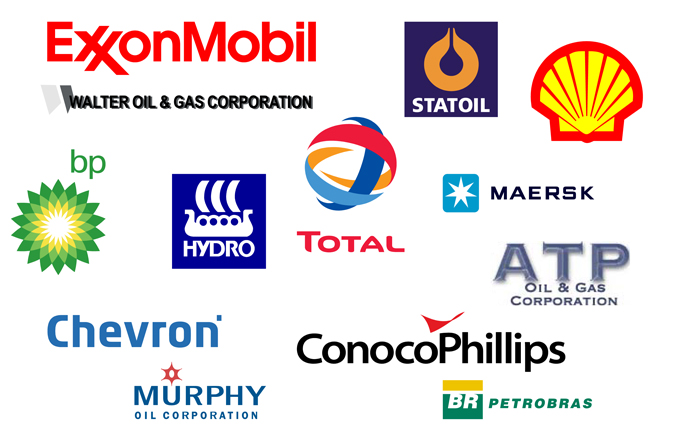
Supplier to Key Offshore Operators
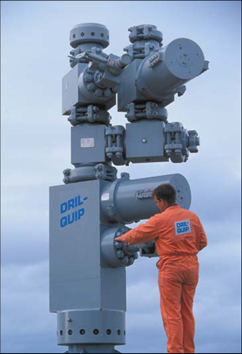
Products and Services Summary
Products | ||||
Subsea Equipment | Surface Equipment | Offshore Rig Equipment | ||
• Subsea Wellheads | • Platform Wellheads | • Wellhead Connectors | ||
• Mudline Suspension | • Platform Trees | • Diverters | ||
• Specialty Connectors | • Drilling Riser | |||
• Tieback Connectors | • Completion Riser | |||
• Subsea Trees | Services | |||
• Production Risers | ||||
• Template Systems | • Reconditioning | |||
• Liner Hangers | • Rental Tools | |||
• Subsea Control Systems | • Field Installation | |||
• Subsea Manifolds | ||||
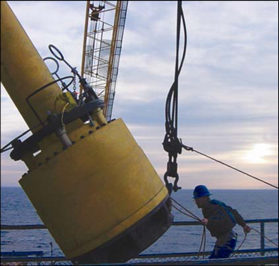
Product Utilization / Installations
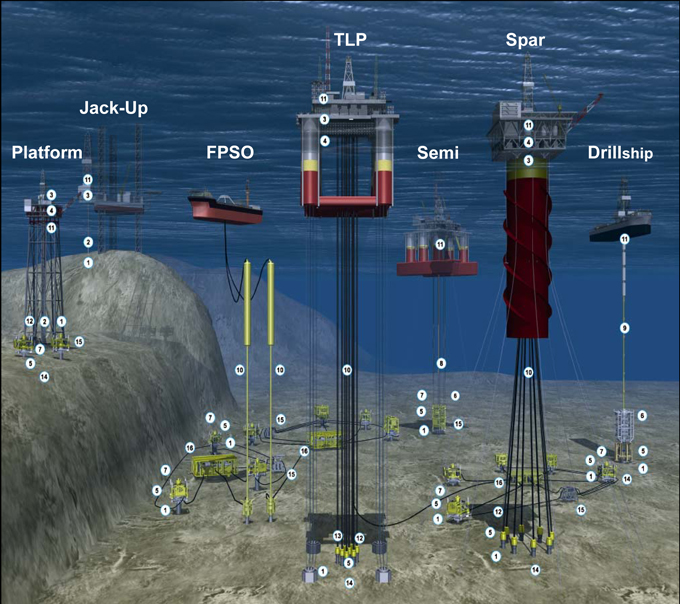
| 1 | Specialty Connectors |
| 2 | Mudline Suspension |
| 3 | Surface Wellheads |
| 4 | Surface Trees |
| 5 | Subsea Wellheads |
| 6 | Wellhead Connectors |
| 7 | Subsea Trees |
| 8 | Completion Riser |
| 9 | Drilling Riser |
| 10 | Production Riser |
| 11 | Diverters |
| 12 | Tie-Back Connectors |
| 13 | Template Systems |
| 14 | Liner Hangers |
| 15 | Control Systems |
| 16 | Subsea Manifolds |
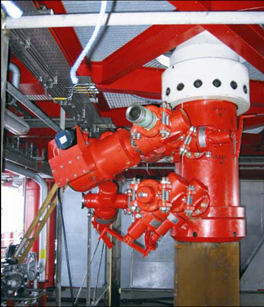
Selected Products
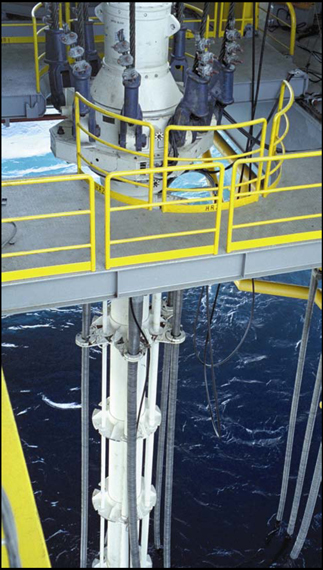
Drilling Riser
Subsea Trees
Tie-Back Connector
Subsea Controls
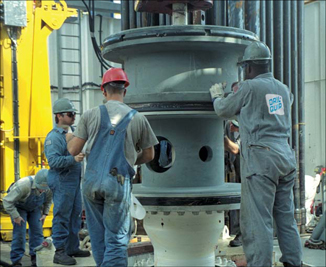
Diverter
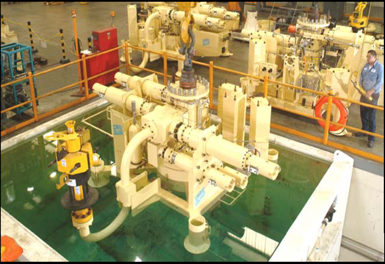
Selected Products
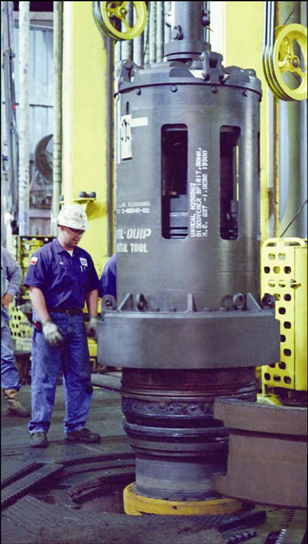
Subsea Wellhead
Subsea Manifold
Surface Tree
Surface Wellhead
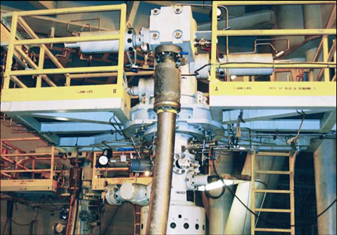
Surface Wellhead and Tree
World Oil Consumption and Spare Capacity
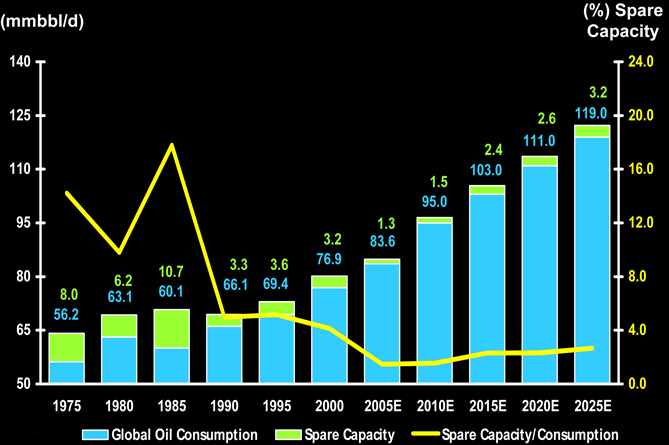
Source: Energy Information Administration
Offshore Rig Count
Current1 | Jackups | Semis | Drillships | Total | ||||
Active | 360 | 153 | 34 | 547 | ||||
Non-Active | 30 | 10 | 3 | 43 | ||||
Total Supply | 390 | 163 | 37 | 590 | ||||
Newbuilds2 | ||||||||
2006 | 11 | — | — | 11 | ||||
2007 | 21 | — | 1 | 22 | ||||
2008 | 25 | 15 | 2 | 42 | ||||
2009+ | 7 | 10 | 1 | 18 | ||||
Total | 64 | 25 | 4 | 93 |
| 1Source: ODS Petrodata March 02, 2006 | 2Source: Morgan Stanley Research May 29, 2006 |
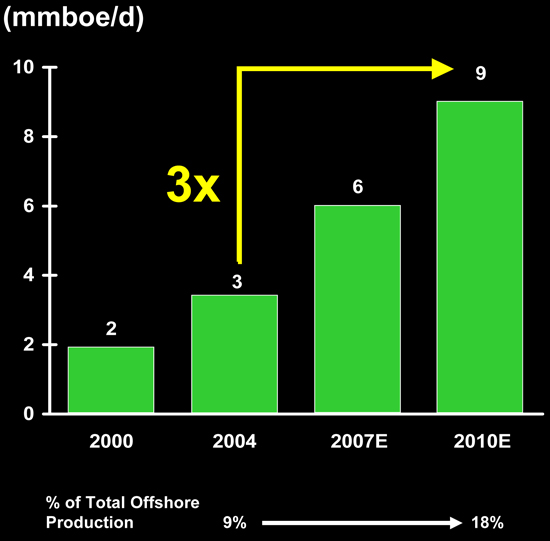
Deepwater (500m+) Growth
| • | Focus on deepwater regions as the primary remaining source of large incremental reserves |
| • | Pressure on majors to invest growing cash balances to replace reserves |
Oil and Gas Production
Source: Douglas-Westwood — World Offshore
Oil and Gas Forecast (2005)
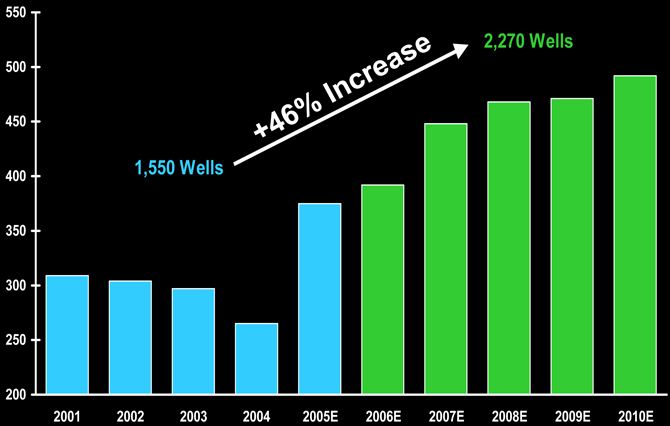
Subsea Tree Forecast (Well Completions)
Source: Quest Offshore Resources, Inc. (August 2005)
Normalized Case
Floating Production Units Forecast
(New Installations)
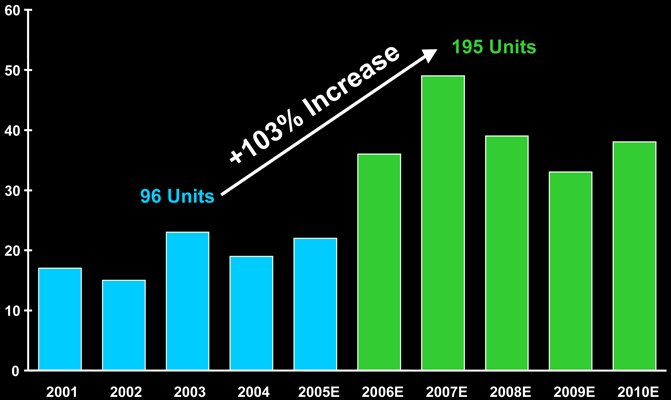
Source: Quest Offshore Resources, Inc. (August 2005)
All Opportunities Case
Growth Strategy
| • | Increase market share - existing products |
| • | Continued introduction of new products |
| • | Pursue large integrated projects |
| • | Expand into new geographic areas |
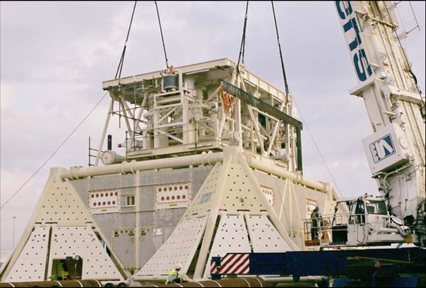
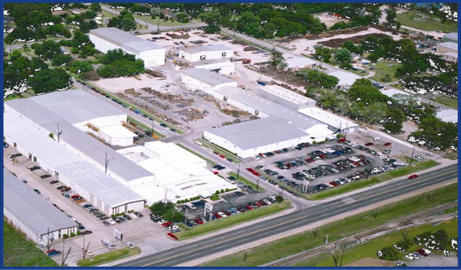
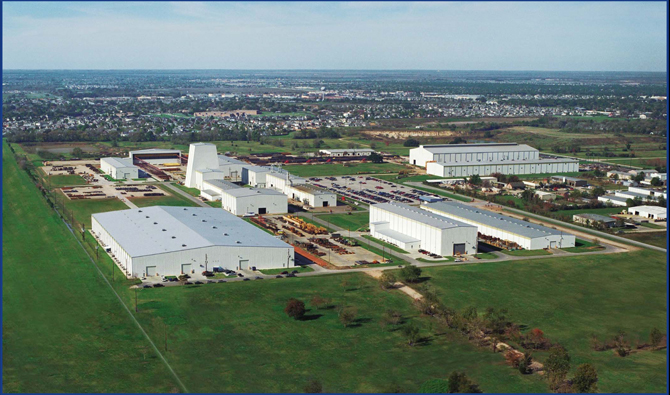
Manufacturing Locations
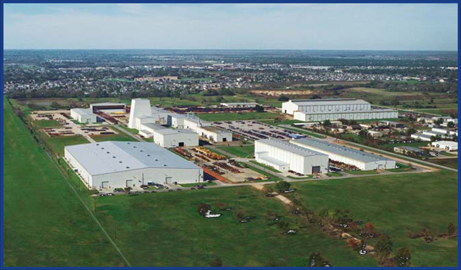
Houston Eldridge (218 ac. / 886,500 sq.ft.)
Houston Hempstead (15 ac. / 175,000 sq.ft.)
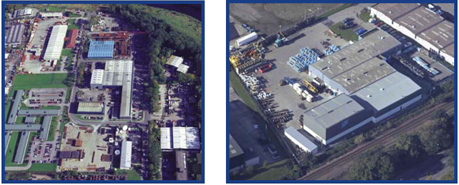
Aberdeen (14 ac. / 192,000 sq.ft.)
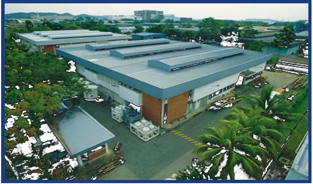
Singapore (3.4 ac. / 56,140 sq.ft.)
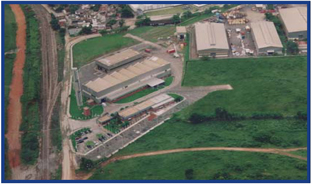
Brazil (10.0 ac. / 35,400 sq.ft.)
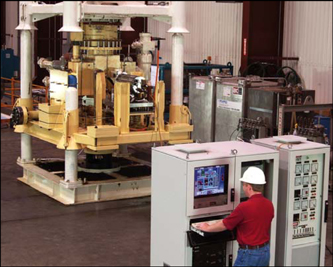
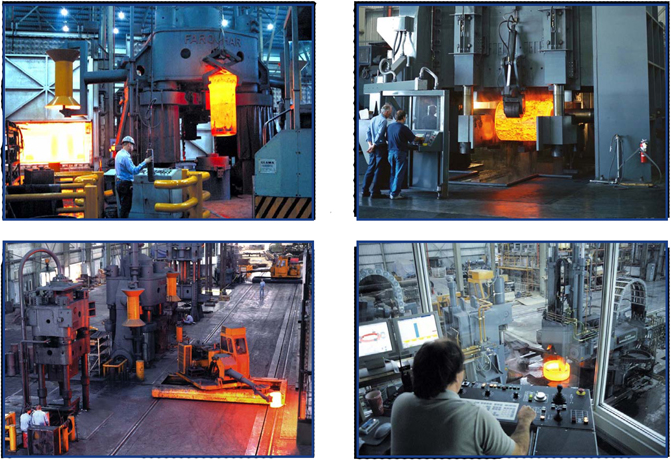
Houston Eldridge Manufacturing Facility
Vertically Integrated Manufacturing
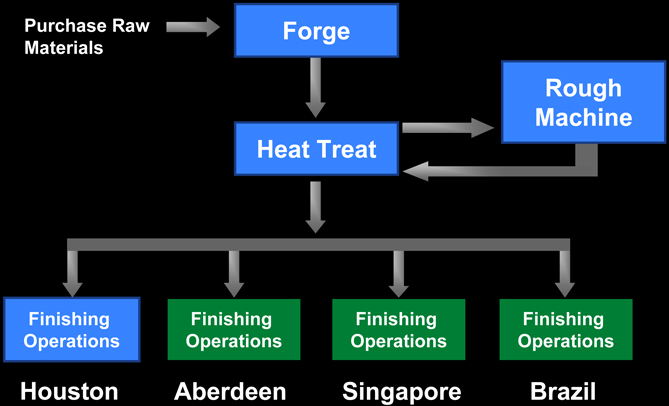
Forge / Heat Treat
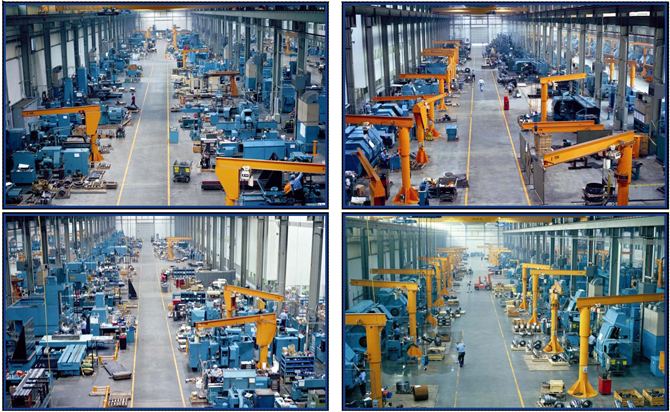
Houston Finish Machine Shop
Machine Rebuild Photos
Before
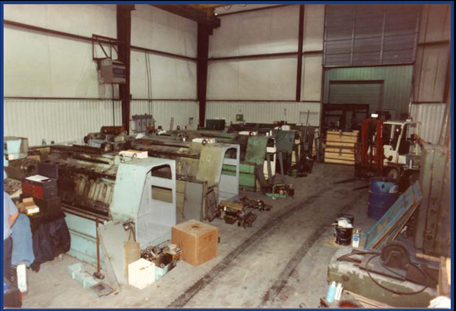
Warner & Swasey SC-28’s
After

Warner & Swasey SC-28’s
Used machines rebuilt in-house to as new condition =lower capitalization costs
Manufacturing Capacity
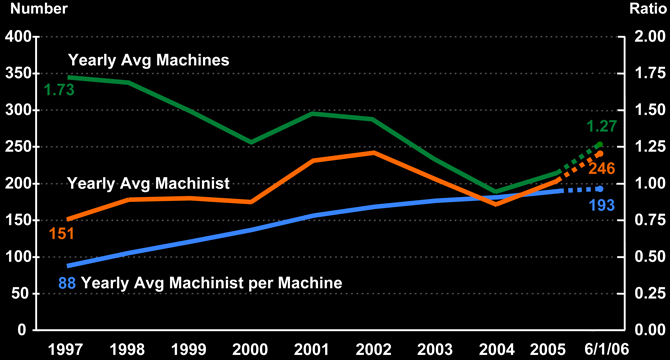
| • | 2006 First Quarter average machinists per machine was 1.17 |
| • | 2006 First Quarter revenue was $98.2mm |
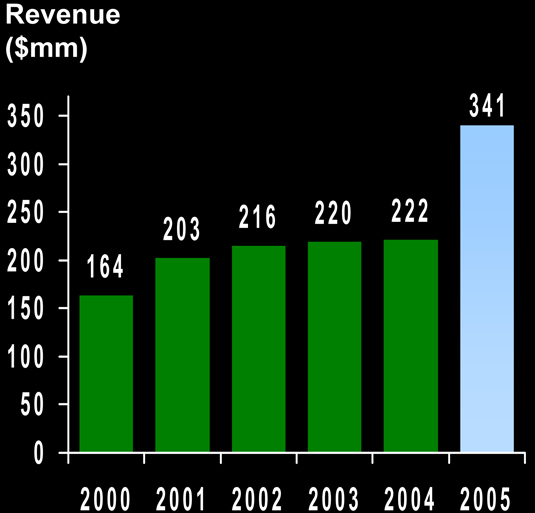
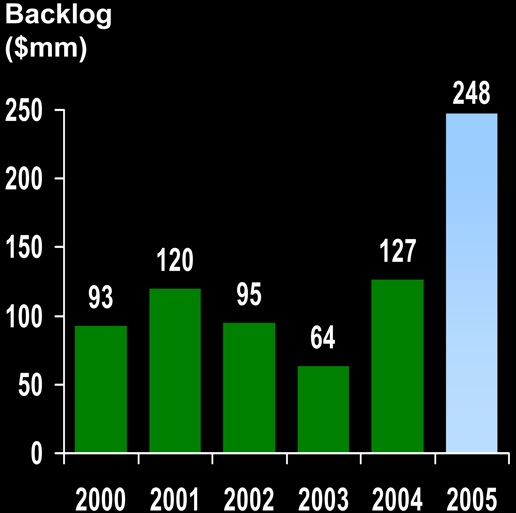
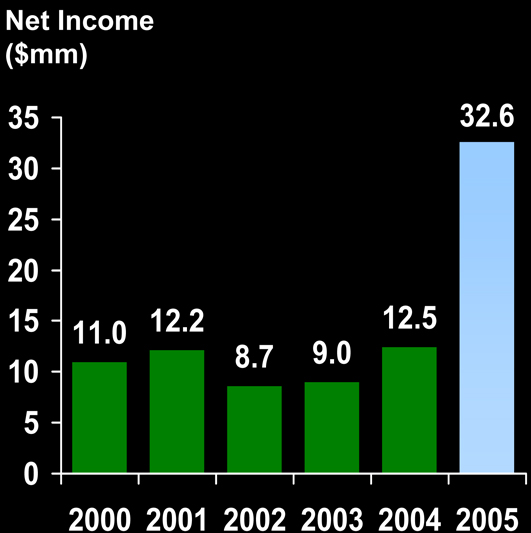
Consistent Track Record of Growth
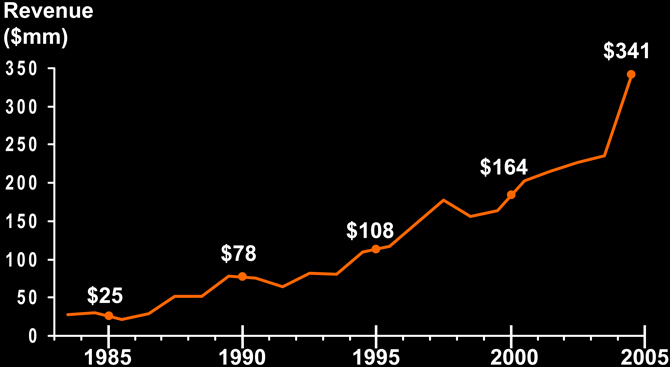
Demonstrated Track Record of Growth
Proven Track Record of Profitability
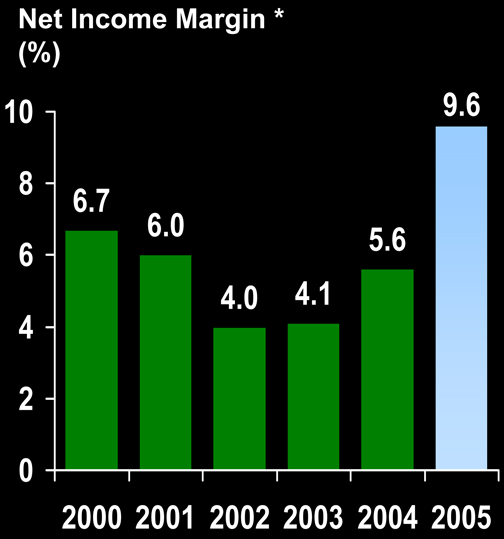
| * | Net Income divided by Revenue |
Quarterly Track Record of Profitability
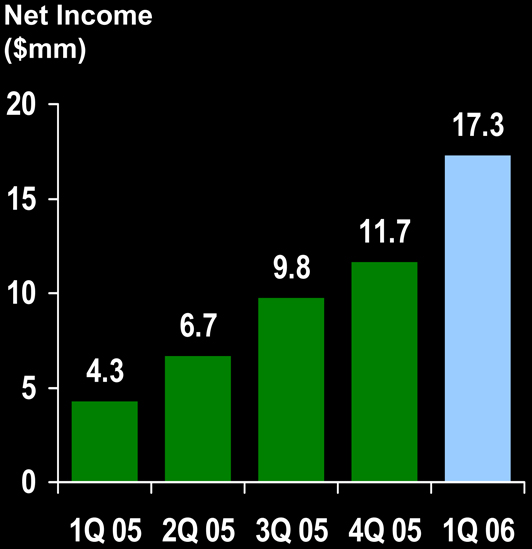
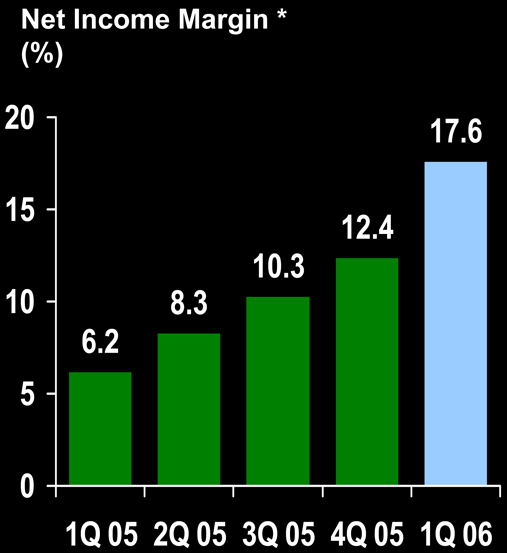
| * | Net Income divided by Revenue |
Condensed Consolidated Statements of Income
| Quarter Ended March 31, | ||||||||||||
(Millions of USD) | 2005 | 2006 | ||||||||||
Revenues | $ | 70.0 | $ | 98.2 | ||||||||
Cost and Expenses: | ||||||||||||
Cost of sales | 69.9 | % | 48.9 | 58.1 | % | 57.1 | ||||||
S,G&A expenses | 9.5 | 11.2 | ||||||||||
Engineering expenses | 5.0 | 4.9 | ||||||||||
| 63.4 | 73.2 | |||||||||||
Operating Income | 9.4 | % | $ | 6.6 | 25.5 | % | $ | 25.0 | ||||
Condensed Consolidated Balance Sheets
(Millions of USD) | Mar. 31, 2005 | Mar. 31, 2006 | ||||
Assets | ||||||
Current assets | $ | 203 | $ | 322 | ||
Property, plant and equipment, net | 114 | 119 | ||||
Total assets | $ | 317 | $ | 441 | ||
Liabilities and Stockholders’ Equity | ||||||
Current liabilities | $ | 57 | $ | 75 | ||
Long-term debt | 30 | 3 | ||||
Deferred taxes | 7 | 6 | ||||
Total liabilities | 94 | 84 | ||||
Stockholders’ equity | 223 | 357 | ||||
| $ | 317 | $ | 441 | |||
Capitalizing on the Up-Market
| • | Pure Play on Rapidly Growing Offshore Market |
| • | Significant Operating Leverage to Up-Cycle |
| • | Vertically Integrated, Low Cost Manufacturer |
| • | Available Capacity to Capitalize on the Market |
| • | Consistent Track Record of New Product Innovation |
| • | Highly Motivated, Experienced Management Team |

Strong Growth Profile