 Exhibit 99.1 |
 Forward-Looking Statements The information furnished in this presentation contains “forward- looking statements” within the meaning of the Federal Securities laws. Forward-looking statements include projections, estimates, expectations, forecasts, plans and objectives, and are based on assumptions, estimates and risk analysis made by management of Dril-Quip in light of its experience and perception of historical trends, current conditions, expected future developments and other factors. No assurance can be given that actual future results will not differ materially from those contained in the forward-looking statements in this presentation. Although Dril-Quip believes that all such statements contained in this presentation are based on reasonable assumptions, there are numerous variables of an unpredictable nature or outside of Dril-Quip’s control that could affect Dril-Quip’s future results and the value of its shares. Each investor must assess and bear the risk of uncertainty inherent in the forward-looking statements contained in this presentation. Please refer to Dril-Quip’s filings with the SEC for additional discussion of risks and uncertainties that may affect Dril- Quip’s actual future results. Dril-Quip undertakes no obligation to update the forward-looking statements contained herein. |
 • Pure Play on Rapidly Growing Offshore Market • Significant Operating Leverage to Up-Cycle • Vertically Integrated, Low Cost Manufacturer • Available Capacity to Capitalize on the Market • Consistent Track Record of New Product Innovation • Highly Motivated, Experienced Management Team Strong Growth Profile |
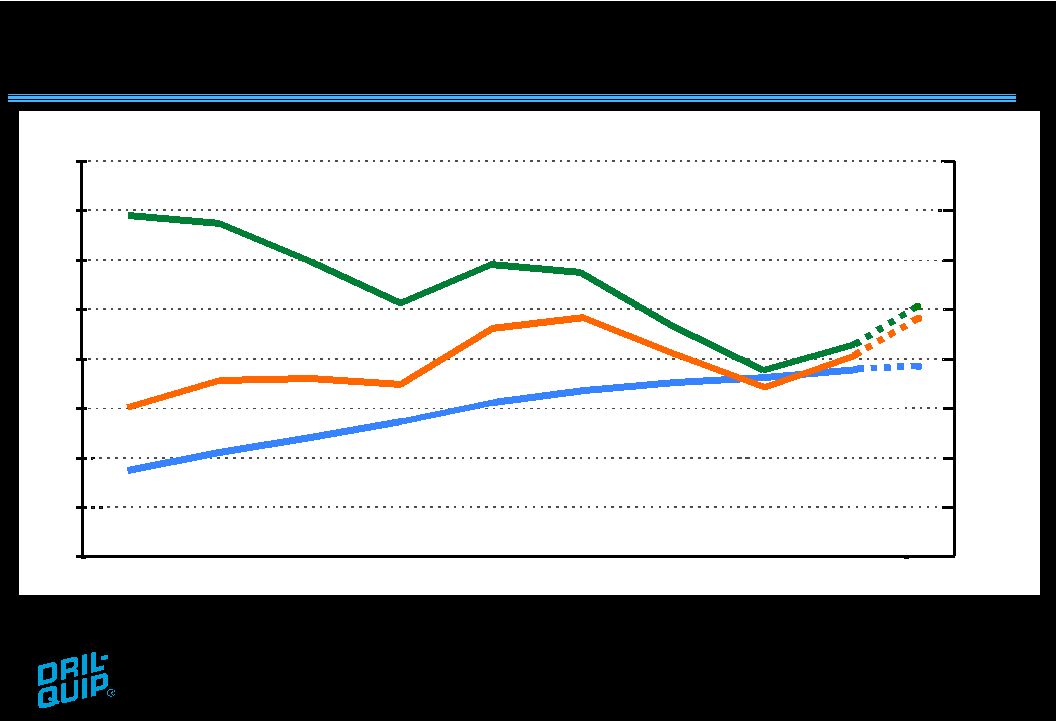
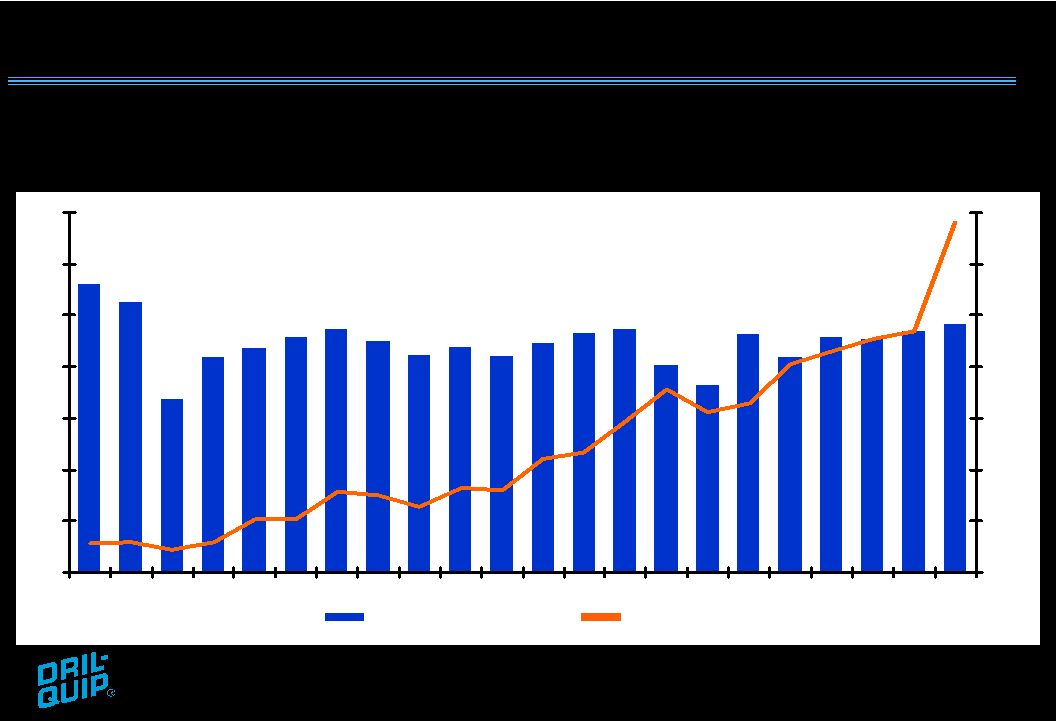 Consistent Track Record of Growth Active Offshore Mobile Rig Count Dril-Quip Revenue ($mm) Source: Offshore Rig Locator 0 100 200 300 400 500 600 700 84 85 86 87 88 89 90 91 92 93 94 95 96 97 98 99 00 01 02 03 04 05 $0 $50 $100 $150 $200 $250 $300 $350 Active Rigs DRQ Revenue |
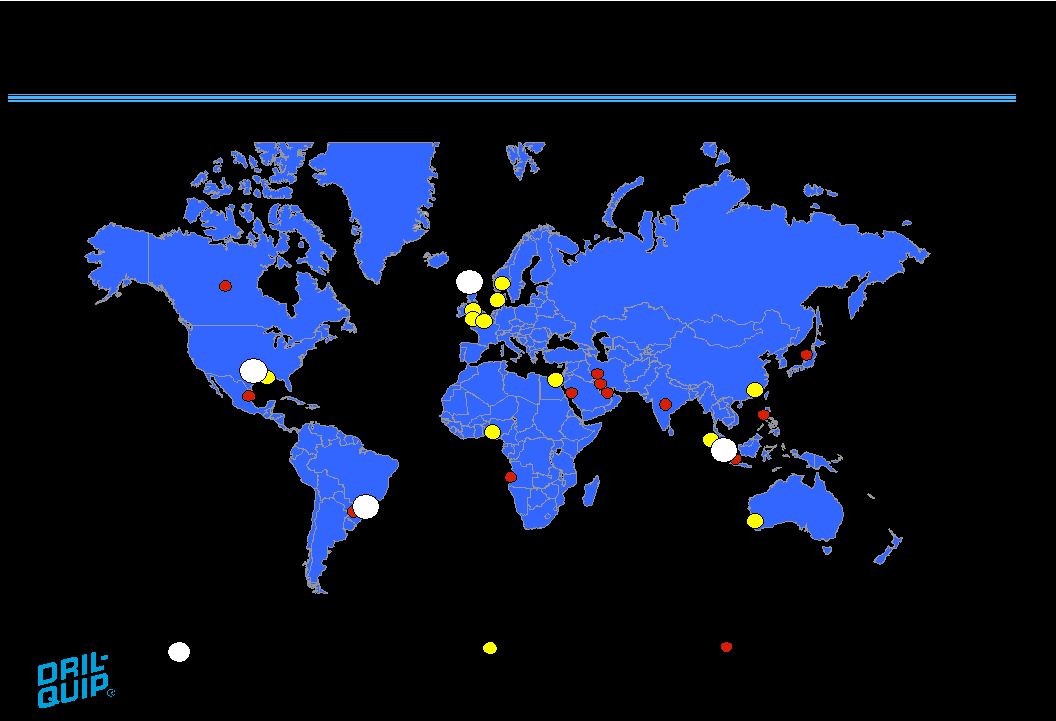 Strong Global Presence Dril-Quip manufacturing, sales and service Dril-Quip sales and/or service Dril-Quip sales representatives Worldwide offices located near key demand centers World Headquarters Houston, Texas Eastern Hemisphere Headquarters Aberdeen, Scotland Asia-Pacific Headquarters Singapore Brazil |
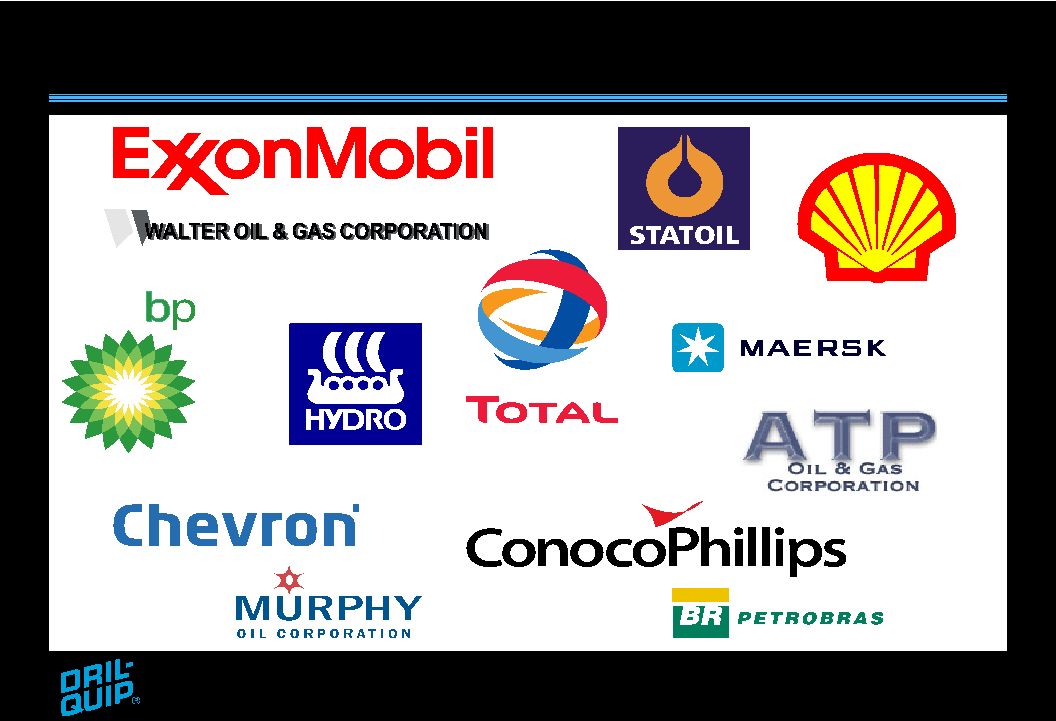 Supplier to Key Offshore Operators |
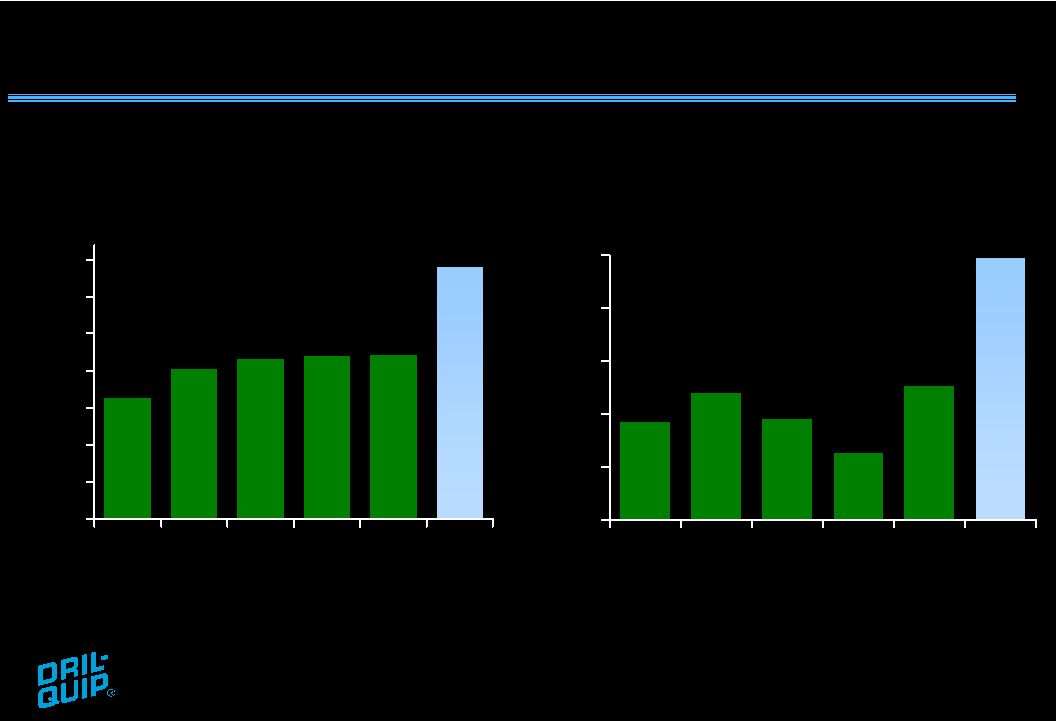 Proven Track Record of Growth Revenue ($mm) Backlog ($mm) 93 120 95 64 127 248 0 50 100 150 200 250 2000 2001 2002 2003 2004 2005 164 203 216 220 222 341 0 50 100 150 200 250 300 350 2000 2001 2002 2003 2004 2005 |
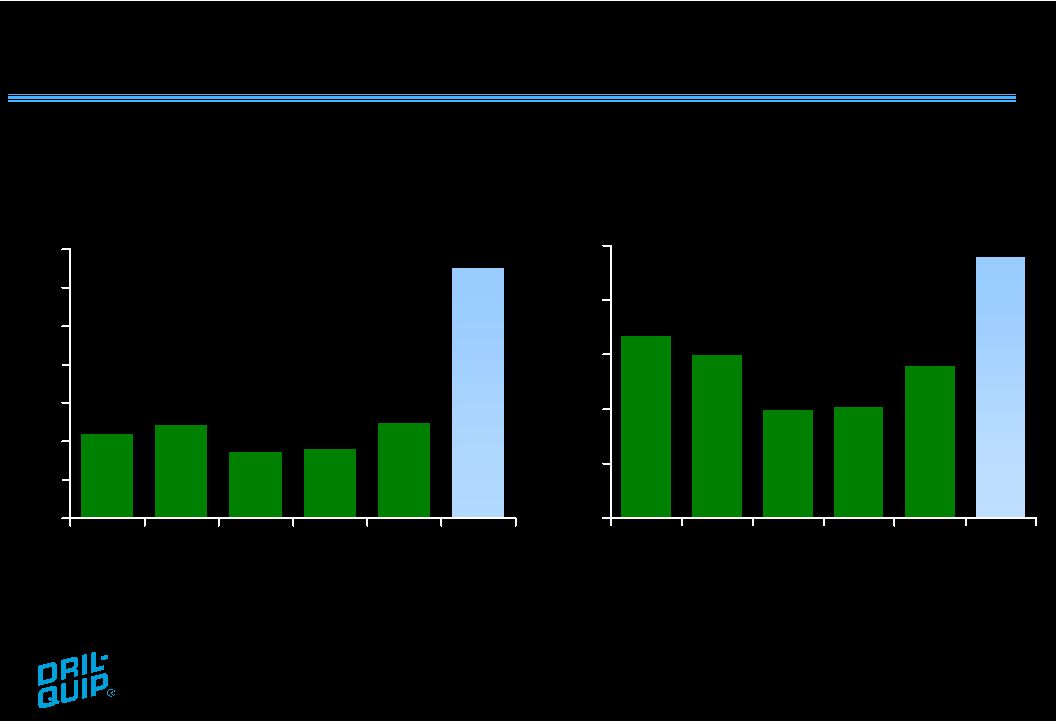 Net Income Margin (2) (%) Notes: (1) Last twelve months as of 9/30/05 (2) Represents Net Income divided by Revenue Proven Track Record of Profitability 6.7 6.0 4.0 4.1 5.6 9.6 0 2 4 6 8 10 2000 2001 2002 2003 2004 2005 11.0 12.2 8.7 9.0 12.5 32.6 0 5 10 15 20 25 30 35 2000 2001 2002 2003 2004 2005 Net Income ($mm) Net Income Margin * (%) * Represents Net Income divided by Revenue |
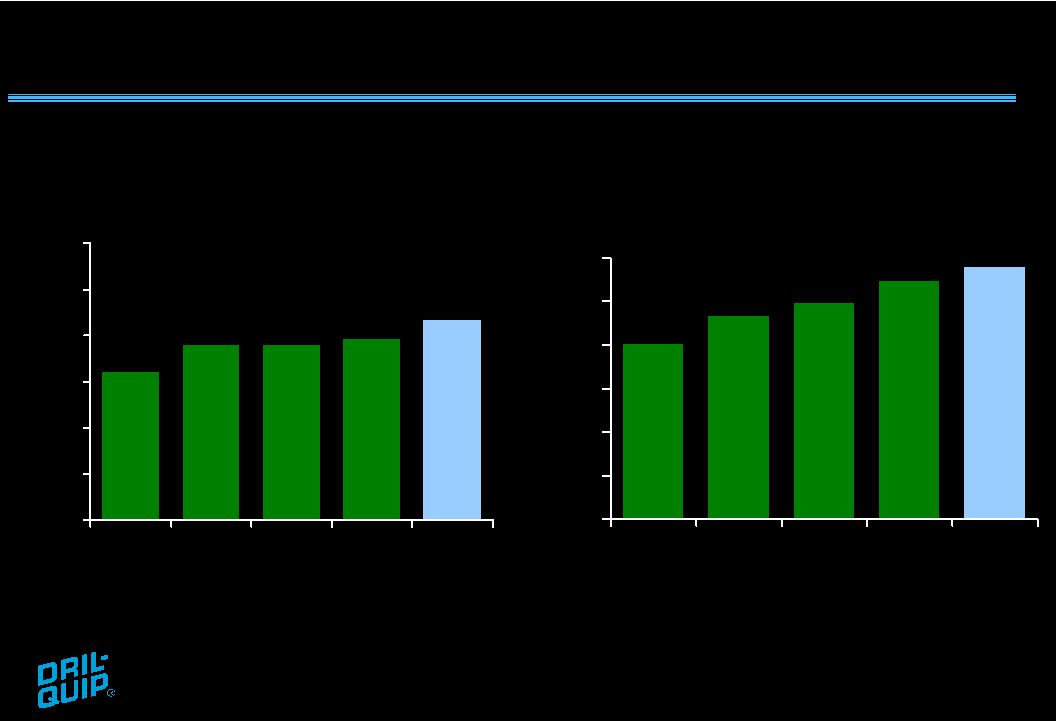 Quarterly Track Record of Growth Revenue ($mm) Backlog ($mm) 202 234 248 290 274 0 50 100 150 200 250 300 2Q 05 3Q 05 4Q 05 1Q 06 2Q 06 80.6 95.3 94.9 98.2 108.5 0 25 50 75 100 125 150 2Q 05 3Q 05 4Q 05 1Q 06 2Q 06 |
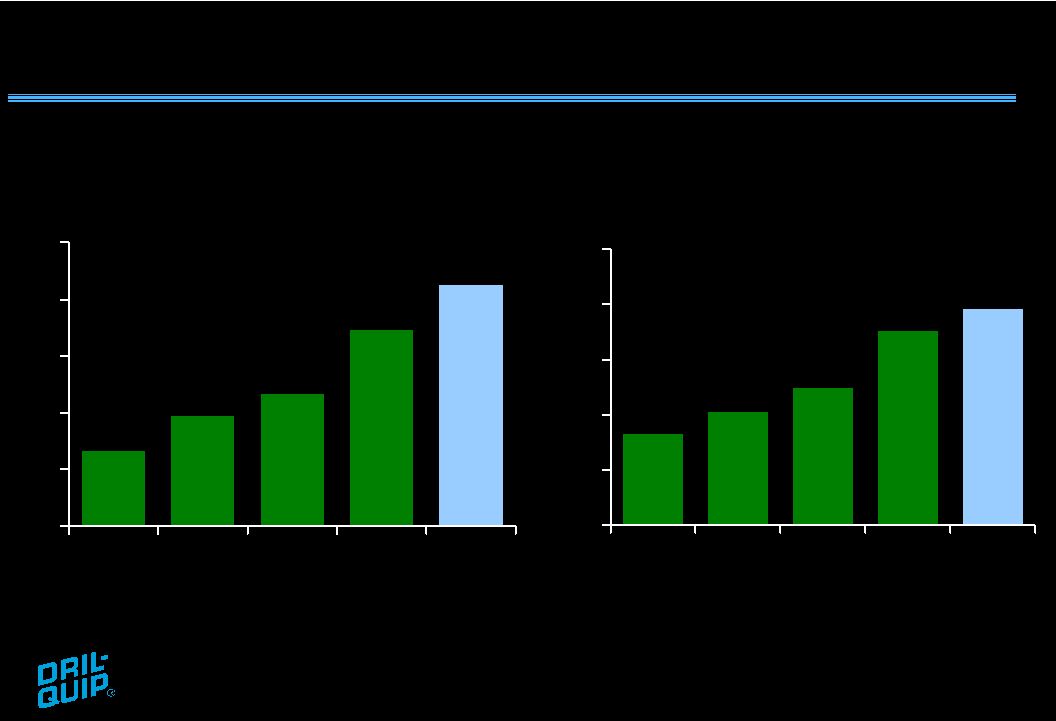 Net Income Margin (2) (%) Notes: (1) Last twelve months as of 9/30/05 (2) Represents Net Income divided by Revenue Quarterly Track Record of Profitability 8.3 10.3 12.4 17.6 19.6 0 5 10 15 20 25 2Q 05 3Q 05 4Q 05 1Q 06 2Q 06 6.7 9.8 11.7 17.3 21.3 0 5 10 15 20 25 2Q 05 3Q 05 4Q 05 1Q 06 2Q 06 Net Income ($mm) Net Income Margin * (%) * Represents Net Income divided by Revenue |
 Revenues $ 150.6 $ 206.7 Cost and Expenses: Cost of sales 104.7 121.1 S, G & A expenses 19.0 20.4 Engineering expenses 10.7 9.7 134.4 151.2 Operating Income $ 16.2 $ 55.5 Revenues $ 150.6 $ 206.7 Cost and Expenses: Cost of sales 104.7 121.1 S, G & A expenses 19.0 20.4 Engineering expenses 10.7 9.7 134.4 151.2 Operating Income $ 16.2 $ 55.5 Condensed Consolidated Statements of Income Condensed Consolidated Statements of Income (Millions of USD) (Millions of USD) Six months ended June 30, 2005 2005 2006 2006 58.6% 69.5% 10.8% 26.9% |
 June 30, June 30, Assets 2005 2006 Current assets $ 220 $ 367 Property, plant and equipment, net 114 124 Total assets $ 334 $ 491 Liabilities and Stockholders’ Equity Current liabilities $ 64 $ 98 Long-term debt 36 3 Deferred taxes 7 5 Total liabilities 107 106 Stockholders’ equity 227 385 $ 334 $ 491 June 30, June 30, Assets 2005 2006 Current assets $ 220 $ 367 Property, plant and equipment, net 114 124 Total assets $ 334 $ 491 Liabilities and Stockholders’ Equity Current liabilities $ 64 $ 98 Long-term debt 36 3 Deferred taxes 7 5 Total liabilities 107 106 Stockholders’ equity 227 385 $ 334 $ 491 Condensed Consolidated Balance Sheets Condensed Consolidated Balance Sheets (Millions of USD) (Millions of USD) |
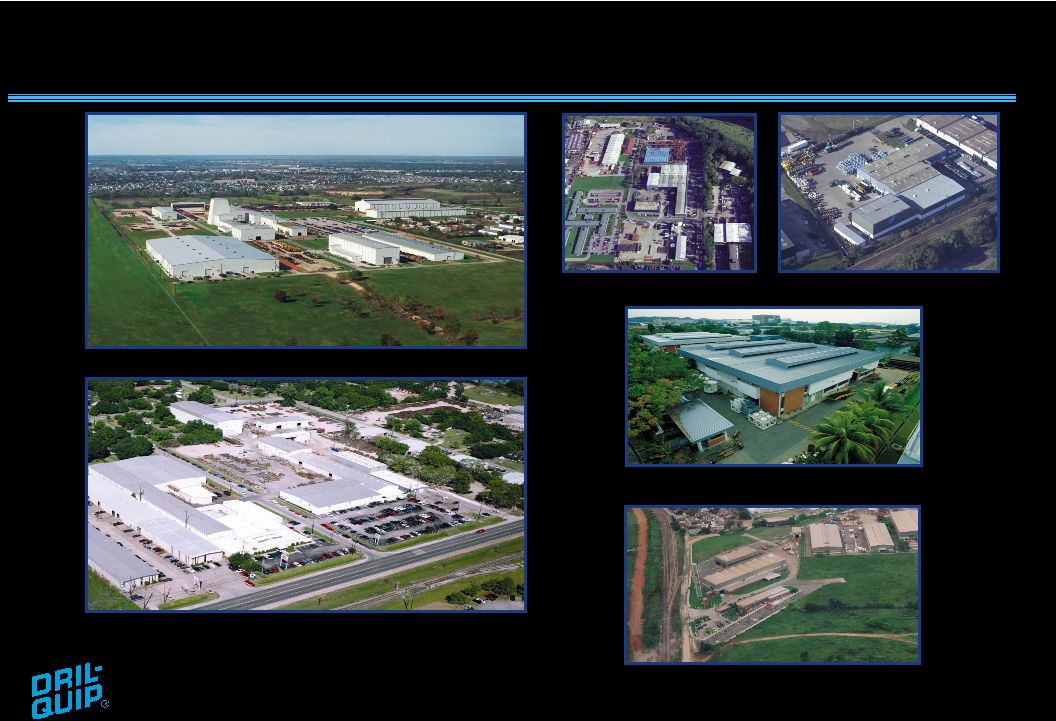 Manufacturing Locations Singapore (3.4 ac. / 56,140 sq.ft.) Brazil (10.0 ac. / 35,400 sq.ft.) Aberdeen (14 ac. / 192,000 sq.ft.) Houston Eldridge (218 ac. / 886,500 sq.ft.) Houston Hempstead (15 ac. / 175,000 sq.ft.) |
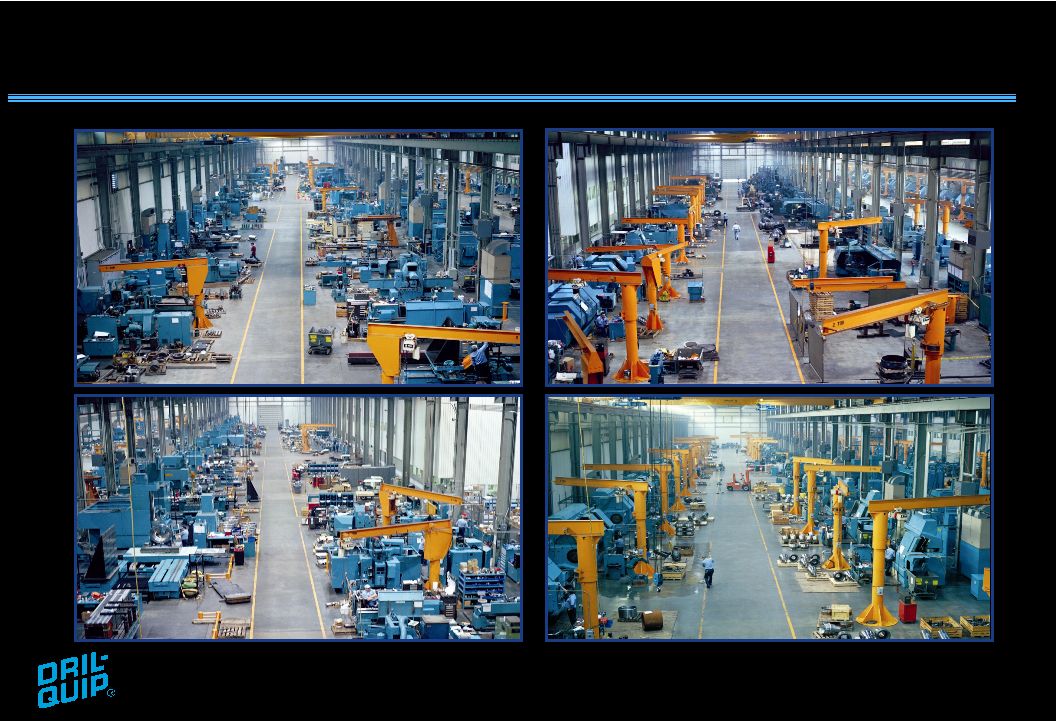
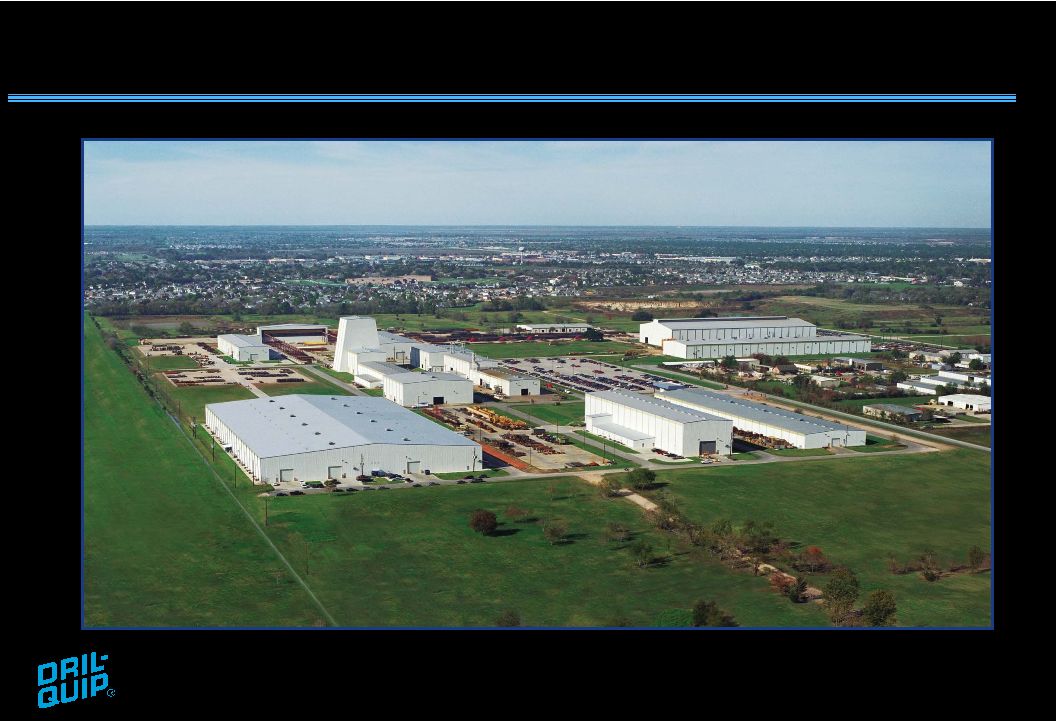 Houston Eldridge Manufacturing Facility |
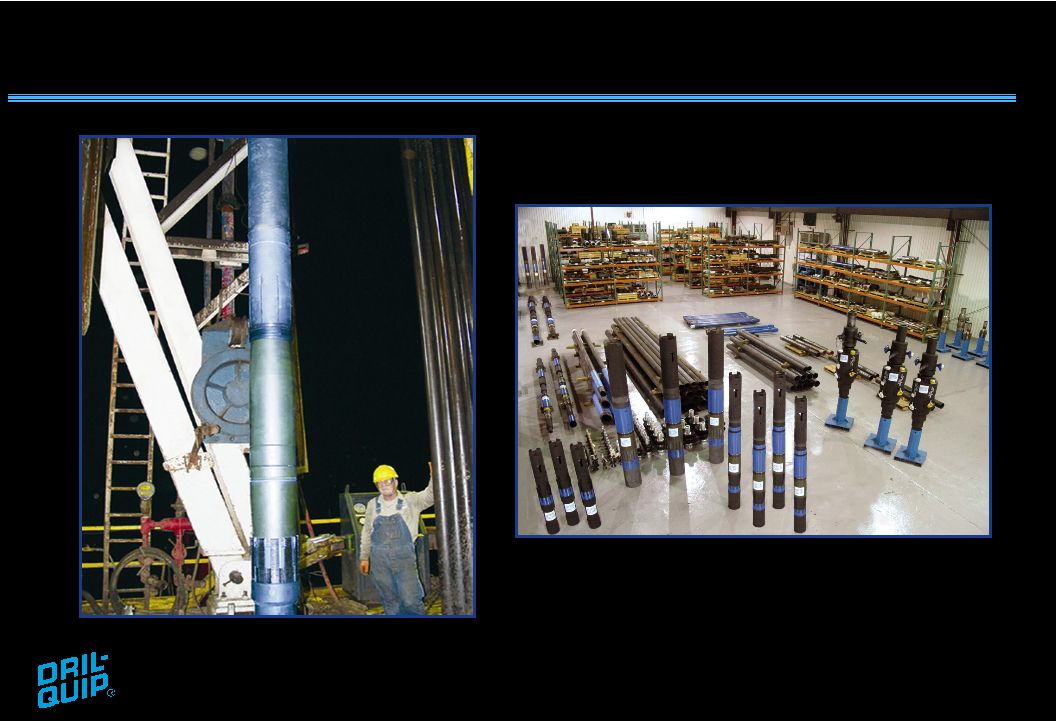
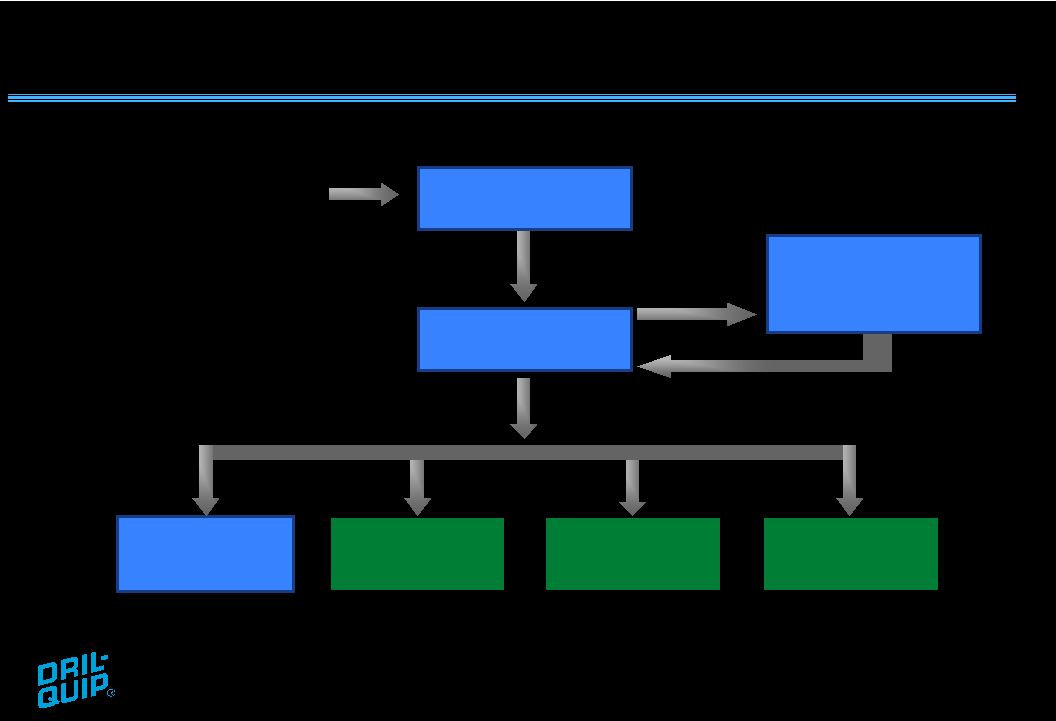 Finishing Operations Houston Finishing Operations Finishing Operations Finishing Operations Vertically Integrated Manufacturing Purchase Raw Materials Forge Heat Treat Rough Machine Aberdeen Singapore Brazil |
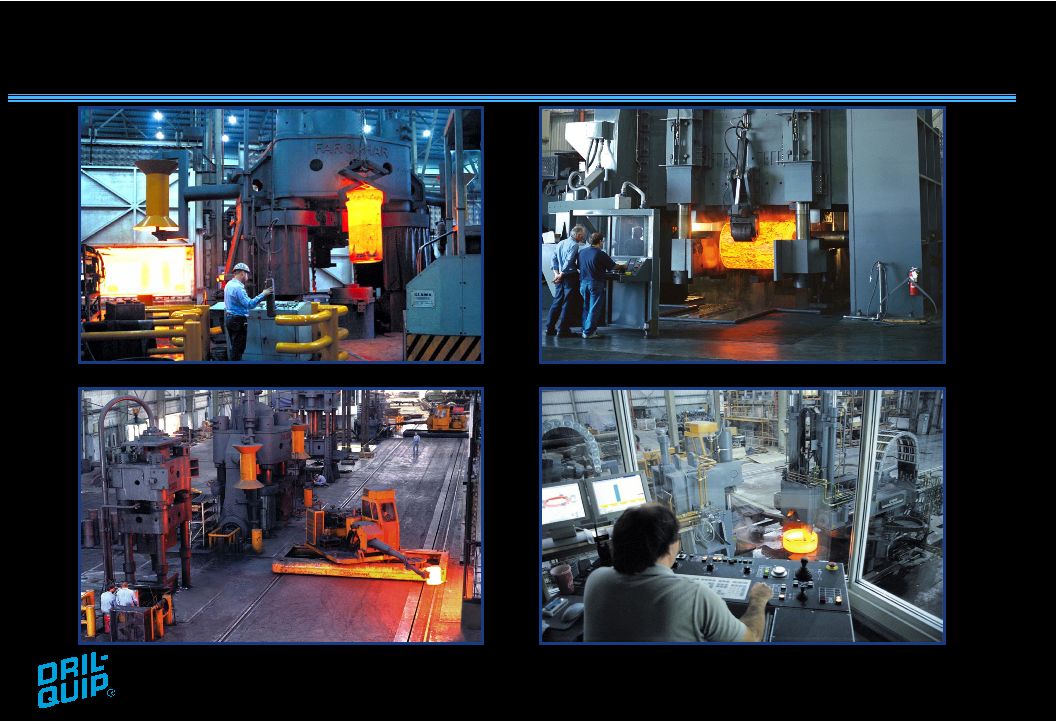 Forge / Heat Treat |
 Houston Finish Machine Shop |
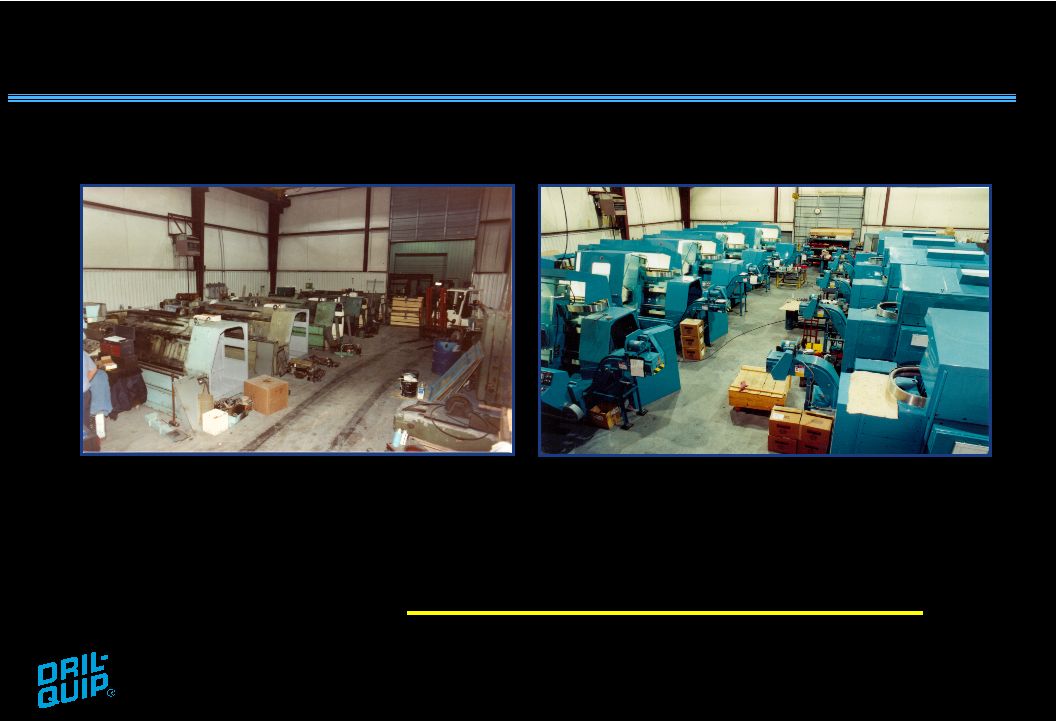 Machine Rebuild Photos Before After Warner & Swasey SC-28’s Warner & Swasey SC-28’s Used machines rebuilt in-house to as new condition = lower capitalization costs |
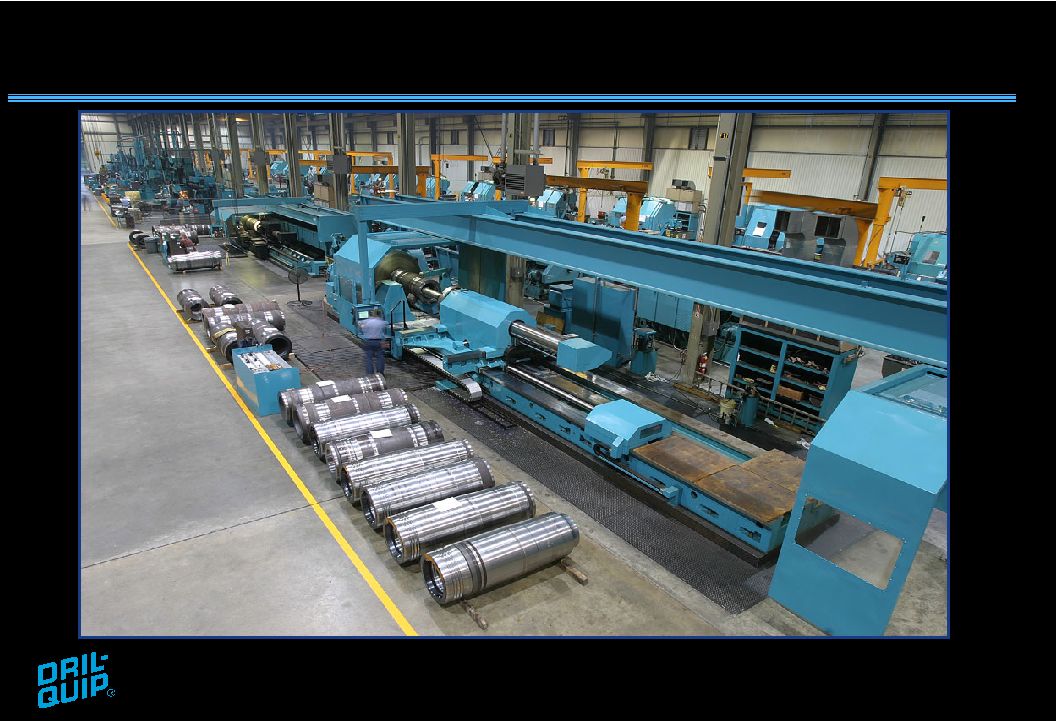 Wellhead Machine #2 |
 Manufacturing Capacity Yearly Avg Machines Number Ratio Yearly Avg Machinists per Machine • 2006 Second Quarter average machinists per machine was 1.28 • 2006 Second Quarter revenue was $108 mm 88 151 1.72 0 50 100 150 200 250 300 350 400 0.00 0.25 0.50 0.75 1.00 1.25 1.50 1.75 2.00 194 249 1.28 1997 1998 1999 2000 2001 2002 2003 2004 2005 6/30/06 Yearly Avg Machinists |
 Product and Services Summary 100% Internally Developed Products; 16 New Products over 24 Years Reconditioning Rental Tools Field Installation Existing Products New Products Subsea Equipment Offshore Rig Equipment Platform Wellheads Platform Production Trees Subsea Wellheads Mudline Suspension Systems Specialty Connectors Tieback Connectors Subsea Production Trees Production Risers Template Systems Liner Hangers Subsea Control Systems Subsea Manifolds Wellhead Connectors Diverters Drilling Risers Completion Risers Services Surface Equipment |
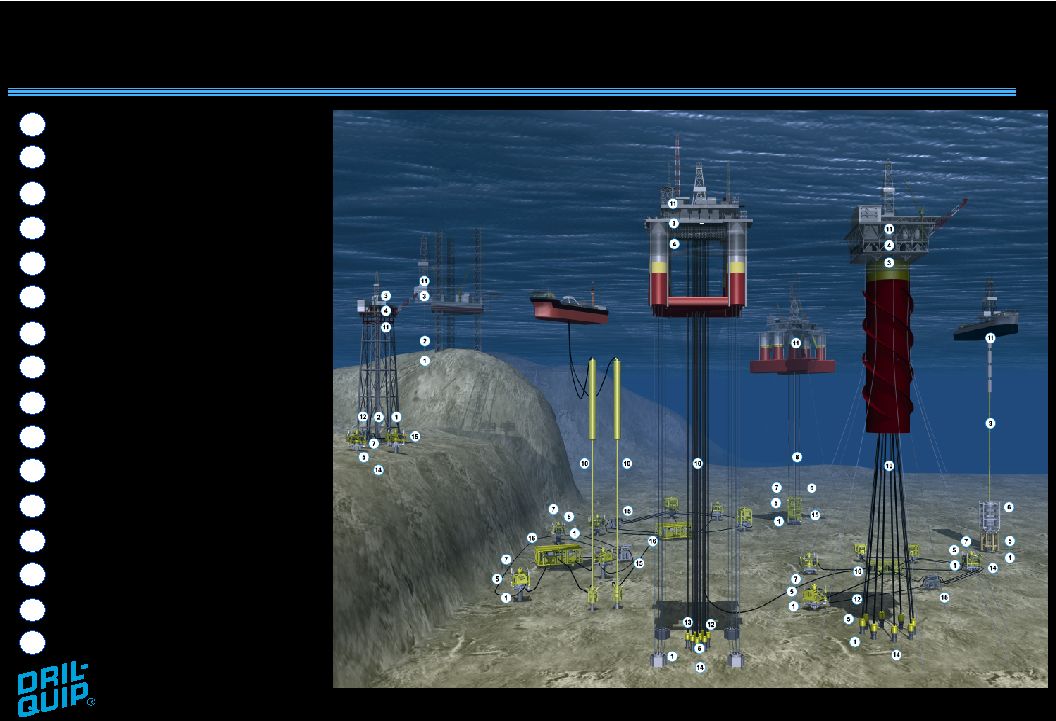 Product Utilization / Installations Specialty Connectors Mudline Suspension Surface Wellheads Surface Trees Subsea Wellheads Wellhead Connectors Subsea Trees Completion Riser Drilling Riser Production Riser Diverters Tie-Back Connectors Template Systems Liner Hangers Control Systems Subsea Manifolds 1 2 3 4 5 6 7 8 9 10 11 12 13 14 15 16 Platform Jack-Up FPSO TLP Spar Drillship Semi |
 New Products • Liner Hangers • Subsea Control Systems • Subsea Manifolds Production Exploration Used In |
 Liner Hangers |
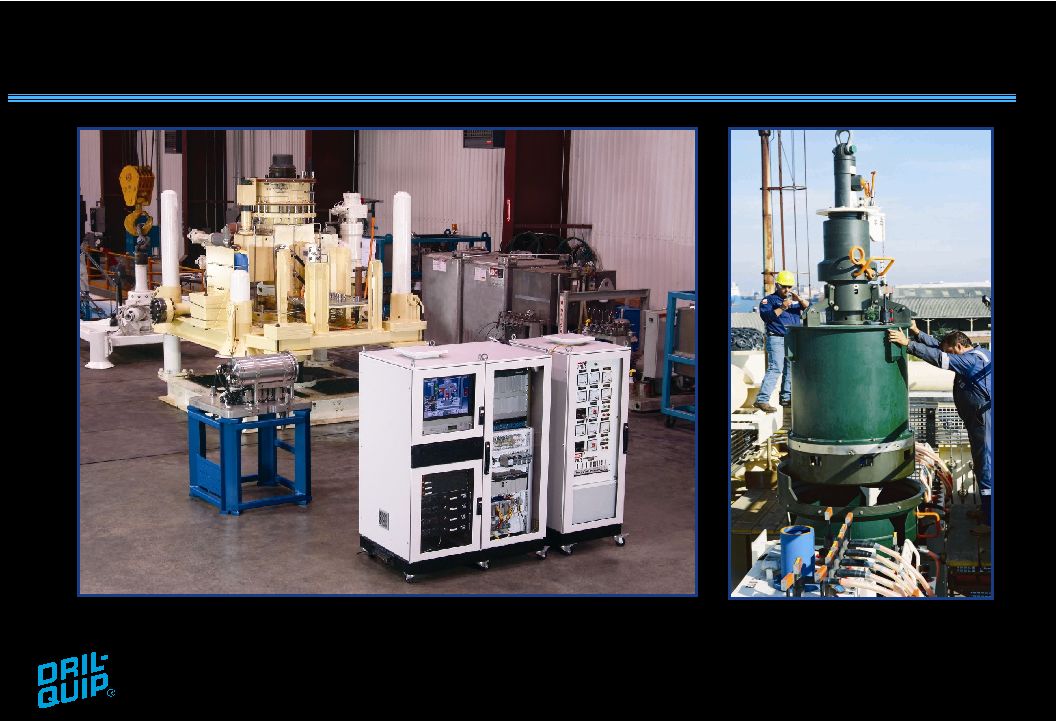 Subsea Control Systems |
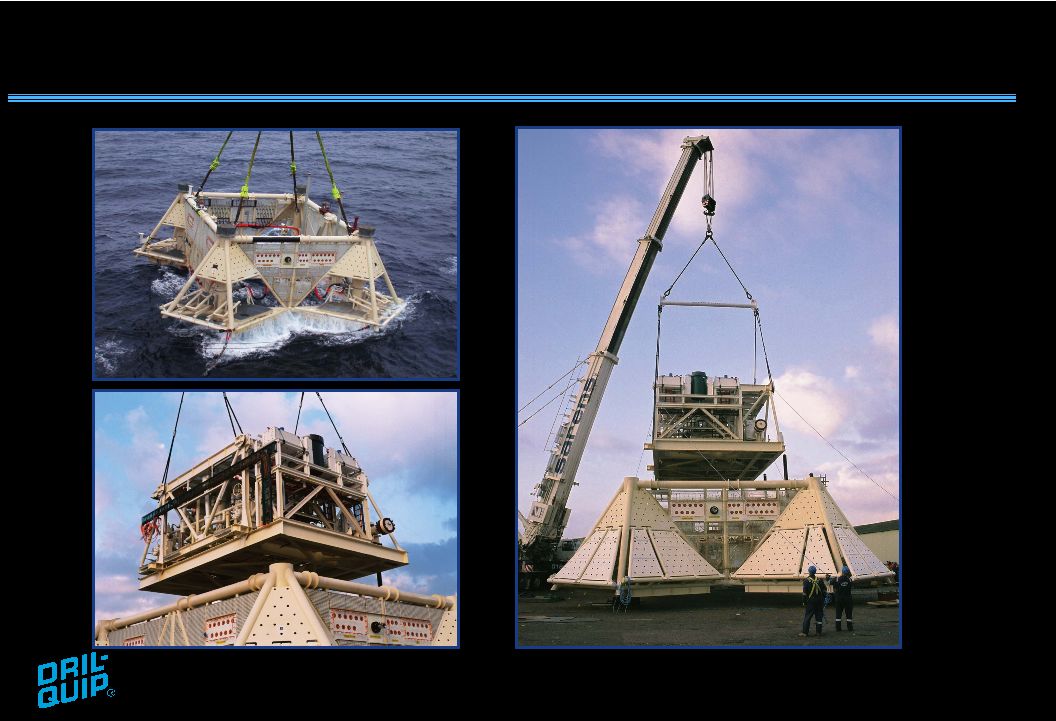 Subsea Manifolds |
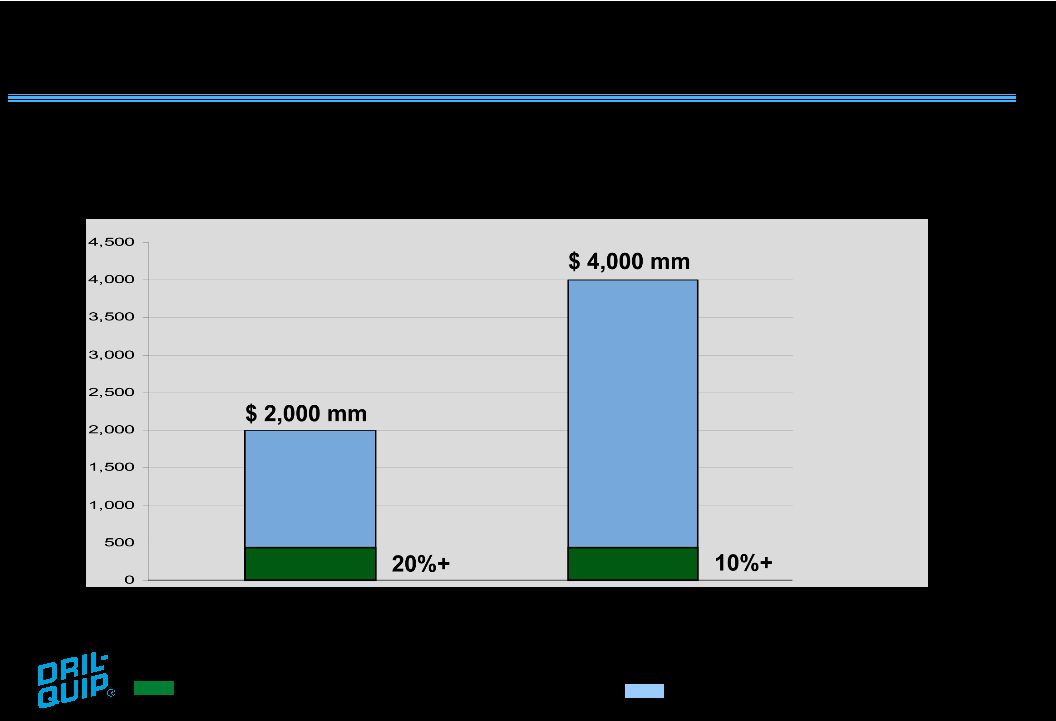 Increased Market Opportunities We believe our new product line expansions will increase the size of the market we serve Existing and New Products Existing Products Market Size ($mm) Approximate DRQ Market Share Approximate Total Market Size Source: Management estimates |
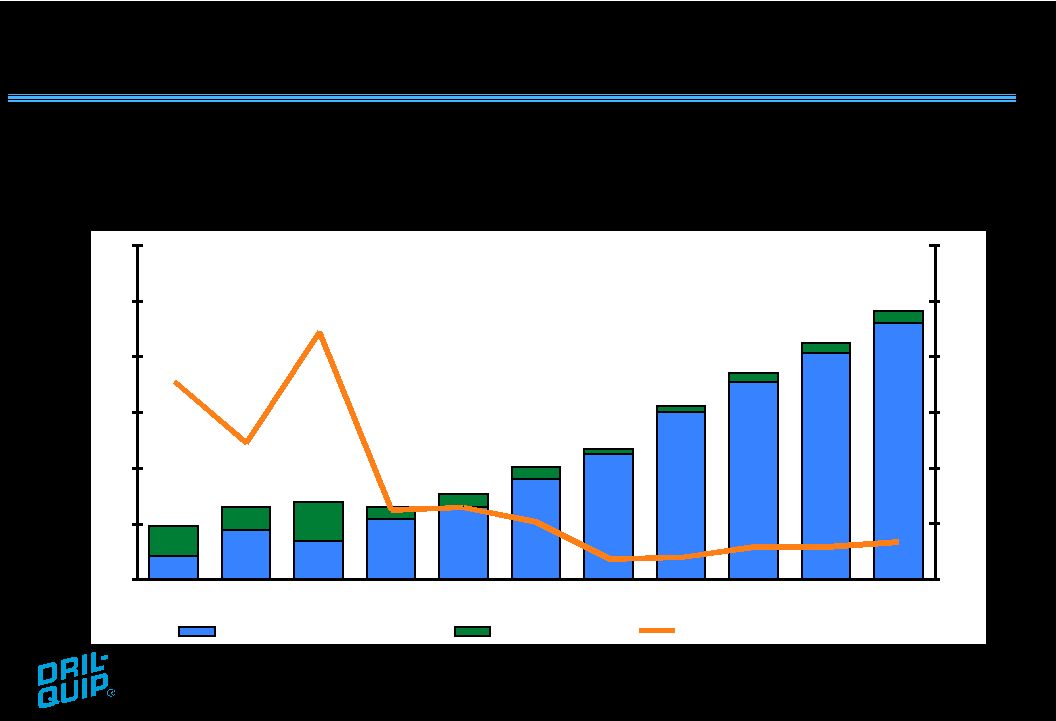 Global Supply and Demand Global oil consumption expected to remain strong with tight spare capacity World Oil Consumption and Spare Capacity Source: Energy Information Administration (%) Spare Capacity (mmbbl/d) 119.0 111.0 103.0 95.0 83.6 76.9 69.4 66.1 60.1 56.2 63.1 3.2 2.6 2.4 1.5 1.3 3.2 3.6 3.3 10.7 6.2 8.0 50 65 80 95 110 125 140 1975 1980 1985 1990 1995 2000 2005E 2010E 2015E 2020E 2025E 0.0 4.0 8.0 12.0 16.0 20.0 24.0 Global Oil Consumption Spare Capacity Spare Capacity/Consumption |
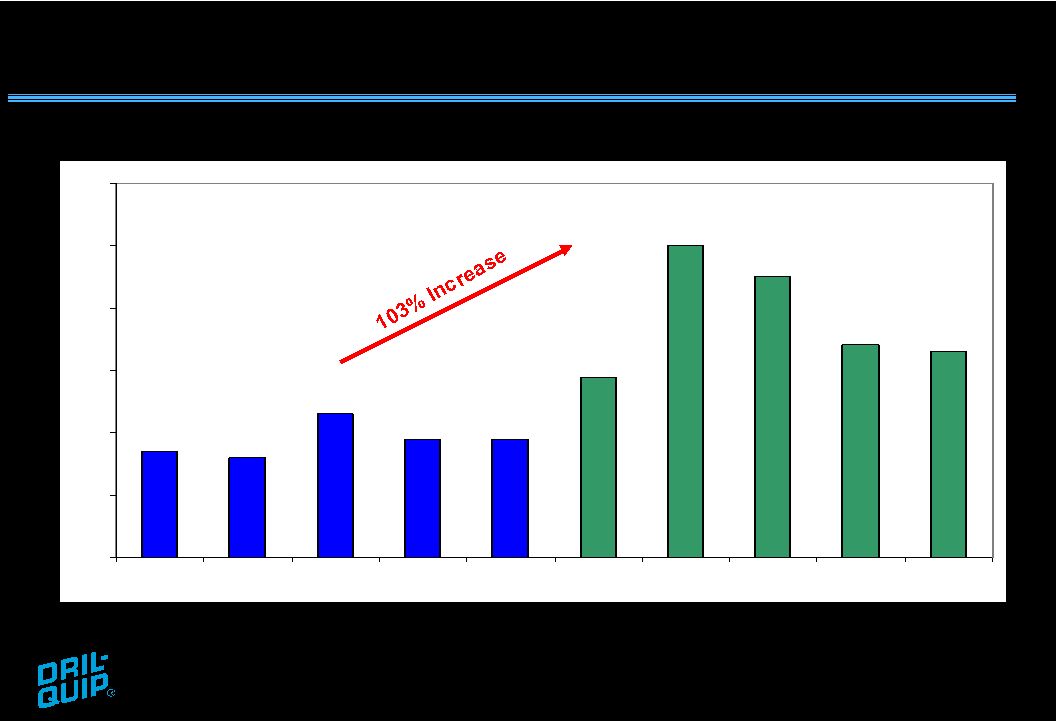 Floating Production Units Forecast 0 10 20 30 40 50 60 2001 2002 2003 2004 2005 2006E 2007E 2008E 2009E 2010E Worldwide Floating Production Units (New Installations) Source: Quest Offshore Resources, Inc. (August 2005) Normalized Case 94 Units 191 Units |
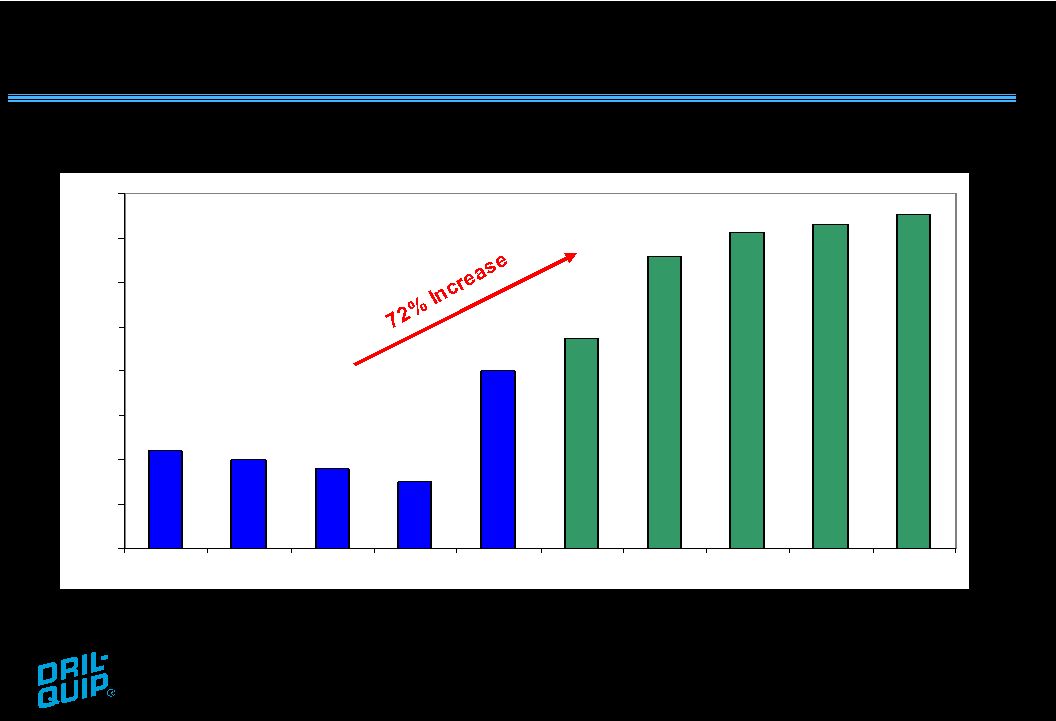 Subsea Tree Forecast 200 250 300 350 400 450 500 550 600 2001 2002 2003 2004 2005 2006E 2007E 2008E 2009E 2010E Worldwide Subsea Trees (Well Completions) Source: Quest Offshore Resources, Inc. (August 2005) Normalized Case 1,550 Wells 2,663 Wells |
 Growth Strategy • Increase market share – existing and new products • Continued introduction of new products • Pursue large integrated projects • Expand into new geographic areas |
 Capitalizing on the Up-Market Strong Growth Profile • Pure Play on Rapidly Growing Offshore Market • Significant Operating Leverage to Up-Cycle • Vertically Integrated, Low Cost Manufacturer • Available Capacity to Capitalize on the Market • Consistent Track Record of New Product Innovation • Highly Motivated, Experienced Management Team |