Exhibit 99.1
Lehman Brothers
CEO Energy/Power Conference
September 4, 2007
Forward-Looking Statements
The information furnished in this presentation contains “forward-looking statements” within the meaning of the Federal Securities laws. Forward-looking statements include goals, projections, estimates, expectations, forecasts, plans and objectives, and are based on assumptions, estimates and risk analysis made by management of Dril-Quip in light of its experience and perception of historical trends, current conditions, expected future developments and other factors. No assurance can be given that actual future results will not differ materially from those contained in the forward-looking statements in this presentation. Although Dril-Quip believes that all such statements contained in this presentation are based on reasonable assumptions, there are numerous variables of an unpredictable nature or outside of Dril-Quip’s control that could affect Dril-Quip’s future results and the value of its shares. Each investor must assess and bear the risk of uncertainty inherent in the forward-looking statements contained in this presentation. Please refer to Dril-Quip’s filings with the SEC for additional discussion of risks and uncertainties that may affect Dril-Quip’s actual future results. Dril-Quip undertakes no obligation to update the forward-looking statements contained herein.
Strong Growth Profile
Pure Play on Rapidly Growing Offshore Market
Significant Operating Leverage to Up-Cycle
Vertically Integrated, Low Cost Manufacturer
Increasing Capacity to Capitalize on the Market
Consistent Track Record of New Product Innovation
Highly Motivated, Experienced Management Team
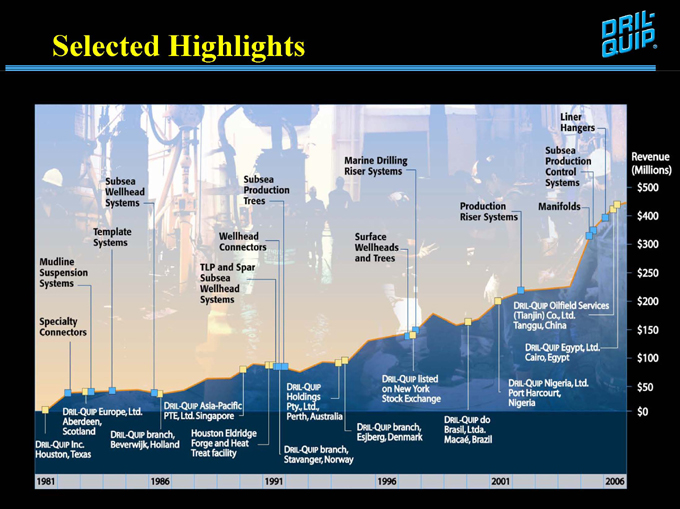
Selected Highlights
Specialty Connectors
Mudline Suspension Systems
Template Systems
Subsea Wellhead Systems
TLP and Spar Subsea Wellhead Systems
Wellhead Connectors
Subsea Production Trees
Marine Drilling Riser Systems
Surface Wellheads and Trees
Production Riser Systems
Liner Hangers
Subsea Production Control Systems
Manifolds
DRIL-QUIP Inc. Houston, Texas
DRIL-QUIP Europe, Ltd. Aberdeen, Scotland
DRIL-QUIP branch, Beverwijk, Holland
DRIL-QUIP Asia-Pacific PTE, Ltd. Singapore
Houston Eldridge Forge and Heat Treat facility
DRIL-QUIP Holdings Pty., Ltd., Perth, Australia
DRIL-QUIP branch, Stavanger, Norway
DRIL-QUIP branch, Esjberg, Denmark
DRIL-QUIP listed on New York Stock Exchange
DRIL-QUIP do Brasil, Ltda. Macaé, Brazil
DRIL-QUIP Oilfield Services (Tianjin) Co., Ltd. Tanggu, China
DRIL-QUIP Egypt, Ltd. Cairo, Egypt
DRIL-QUIP Nigeria, Ltd. Port Harcourt, Nigeria
1981
1986
1991
1996
2001
2006
Revenue (Millions)
$500
$400
$300
$250
$200
$150
$100
$50
$0

Strong Global Presence
Worldwide offices located near key demand centers
Eastern Hemisphere Headquarters Aberdeen, Scotland
World Headquarters Houston, Texas
Asia-Pacific Headquarters Singapore
Brazil
Dril-Quip manufacturing, sales and service
Dril-Quip sales and/or service
Dril-Quip sales representatives
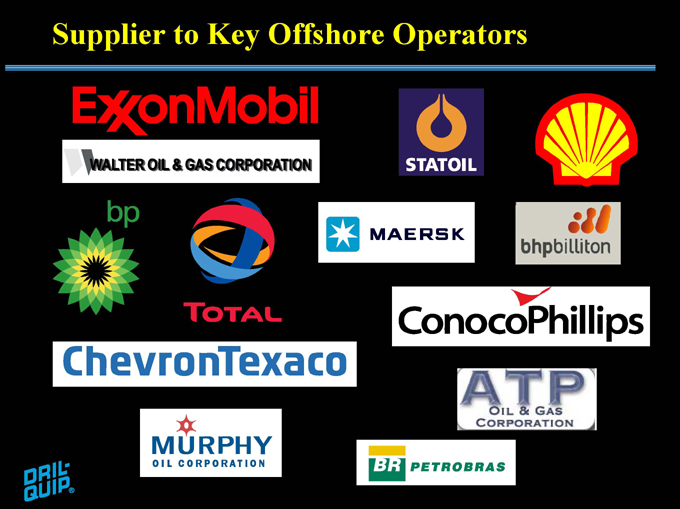
Supplier to Key Offshore Operators
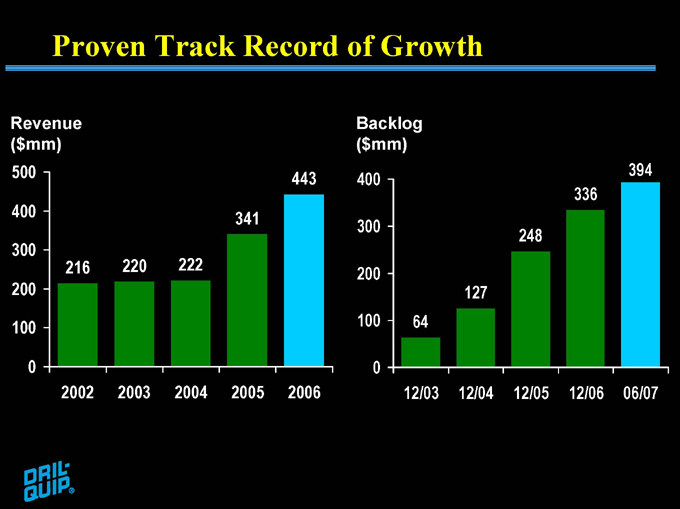
Proven Track Record of Growth
Revenue ($mm)
500 443 400 341 300 216 220 222 200
100
0
2002 2003 2004 2005 2006
Backlog ($mm)
394 400 336 300 248
200
127 100 64
0
12/03 12/04 12/05 12/06 06/07
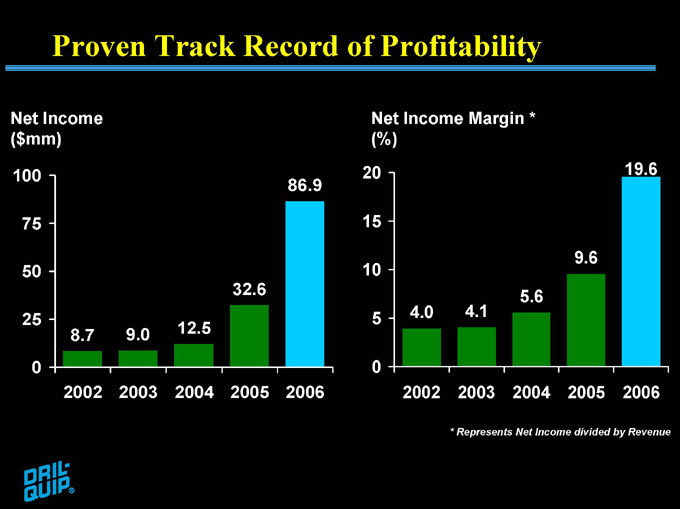
Proven Track Record of Profitability
Net Income ($mm)
100
86.9
75
50
32.6 25 8.7 9.0 12.5 0 2002 2003 2004 2005 2006
(%) Net Income Margin * (%)
20 19.6 15
9.6 10 5.6
5 4.0 4.1
0
2002 2003 2004 2005 2006
* Represents Net Income divided by Revenue

Condensed Consolidated Statements of Income
Year Ended December 31,
(Millions of USD) 2005 2006
Revenues $ 340.8 $ 442.7
Cost and Expenses:
Cost of sales 67.4% 229.8 58.0% 256.7
S, G & A expenses 40.9 44.1
Engineering expenses 20.9 19.5
291.6 320.3
Operating Income 14.4% $ 49.2 27.6% $ 122.4
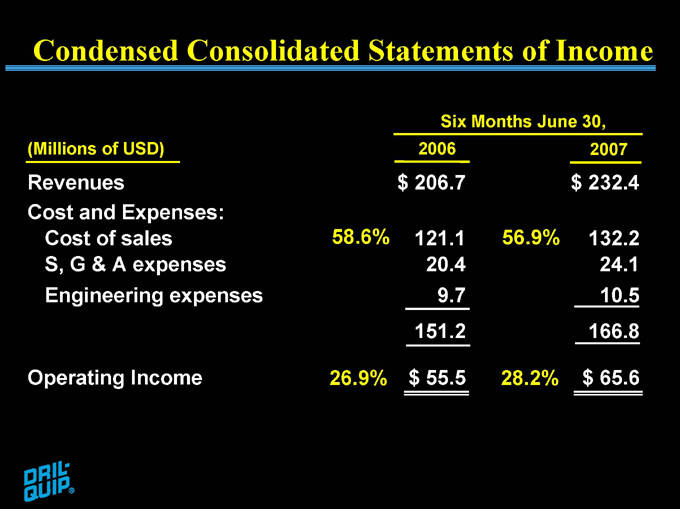
Condensed Consolidated Statements of Income
Six Months June 30,
(Millions of USD) 2006 2007
Revenues $ 206.7 $ 232.4
Cost and Expenses:
Cost of sales 58.6% 121.1 56.9% 132.2
S, G & A expenses 20.4 24.1
Engineering expenses 9.7 10.5
151.2 166.8
Operating Income 26.9% $ 55.5 28.2% $ 65.6
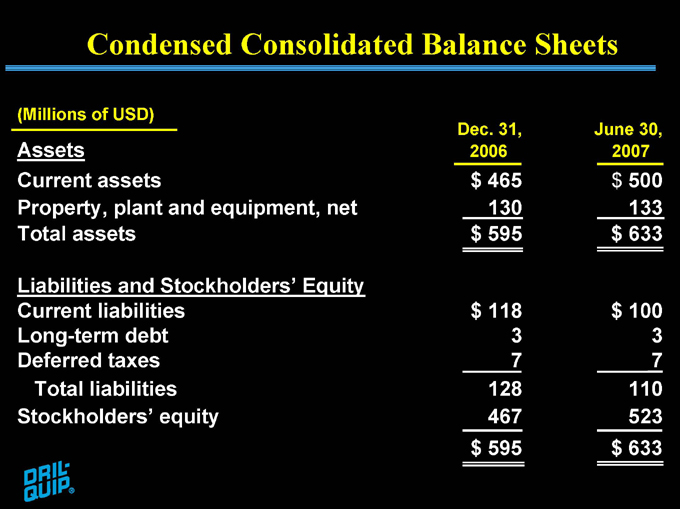
Condensed Consolidated Balance Sheets
(Millions of USD)
Assets Dec. 31, . 2006 June 30, 2007
Current assets $ 465 $ 500
Property, plant and equipment, net 130 133
Total assets $ 595 $ 633
Liabilities and Stockholders’ Equity
Current liabilities $ 118 $ 100
Long-term debt 3 3
Deferred taxes 7 7
Total liabilities 128 110
Stockholders’ equity 467 523
$ 595 $ 633
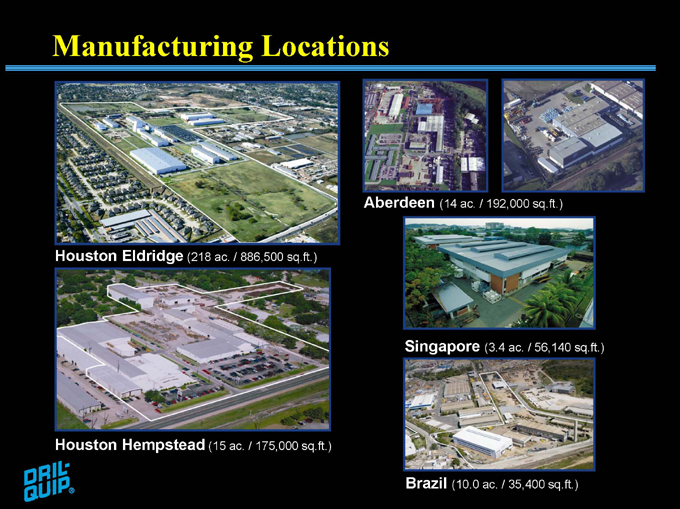
Manufacturing Locations
Houston Eldridge (218 ac. / 886,500 sq.ft.)
Houston Hempstead (15 ac. / 175,000 sq.ft.)
Aberdeen (14 ac. / 192,000 sq.ft.)
Singapore (3.4 ac. / 56,140 sq.ft.)
Brazil (10.0 ac. / 35,400 sq.ft.)
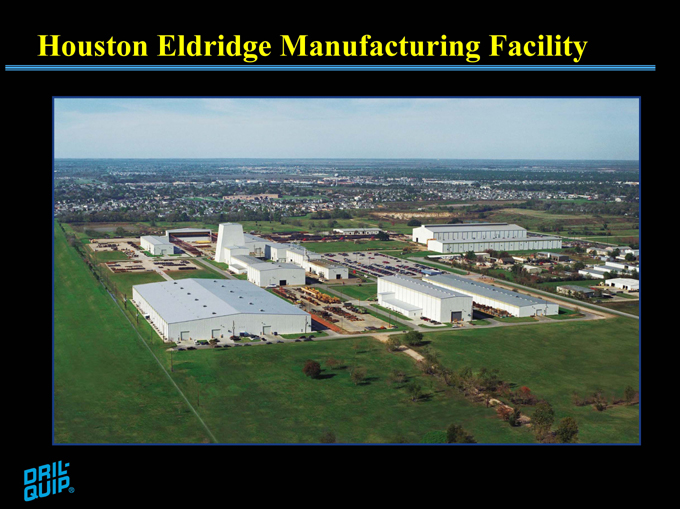
Houston Eldridge Manufacturing Facility
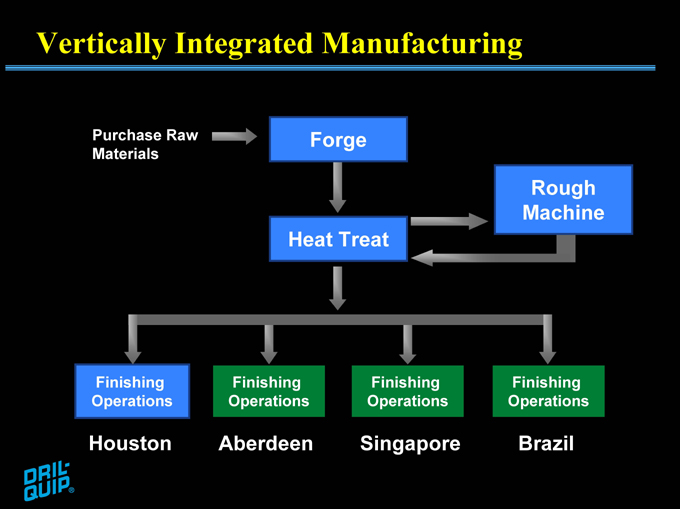
Vertically Integrated Manufacturing
Purchase Raw Materials
Forge
Heat Treat
Rough Machine
Finishing Operations
Houston
Finishing Operations
Aberdeen
Finishing Operations
Singapore
Finishing Operations
Brazil

Forge / Heat Treat
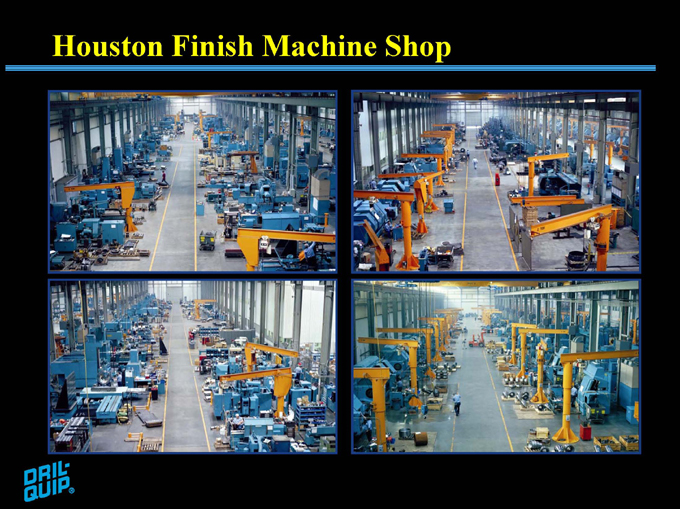
Houston Finish Machine Shop
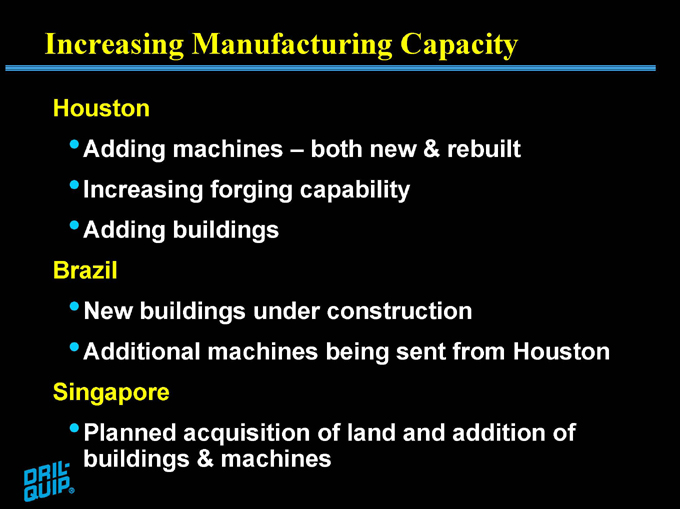
Increasing Manufacturing Capacity
Houston
Adding machines – both new & rebuilt Increasing forging capability Adding buildings
Brazil
New buildings under construction
Additional machines being sent from Houston
Singapore
Planned acquisition of land and addition of buildings & machines
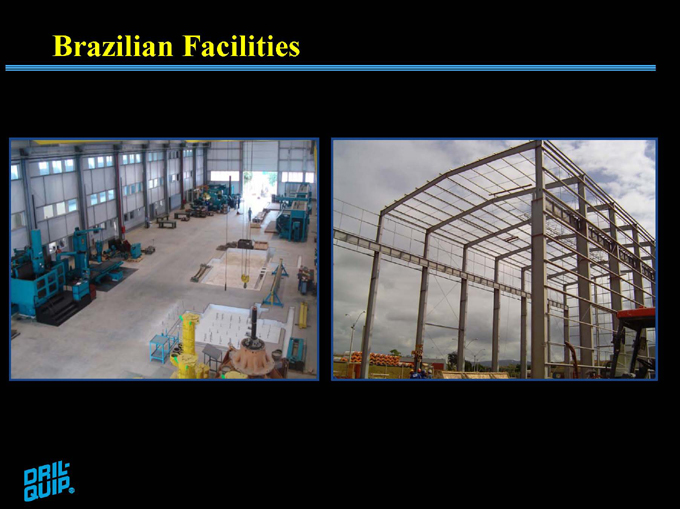
Brazilian Facilities
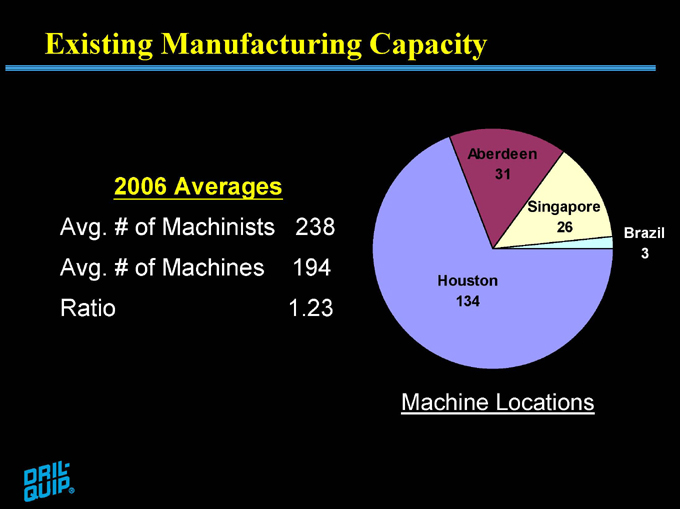
Existing Manufacturing Capacity
2006 Averages
Avg. # of Machinists 238
Avg. # of Machines 194
Ratio 1.23
Aberdeen 31
Singapore
26 Brazil 3 Houston 134
Machine Locations
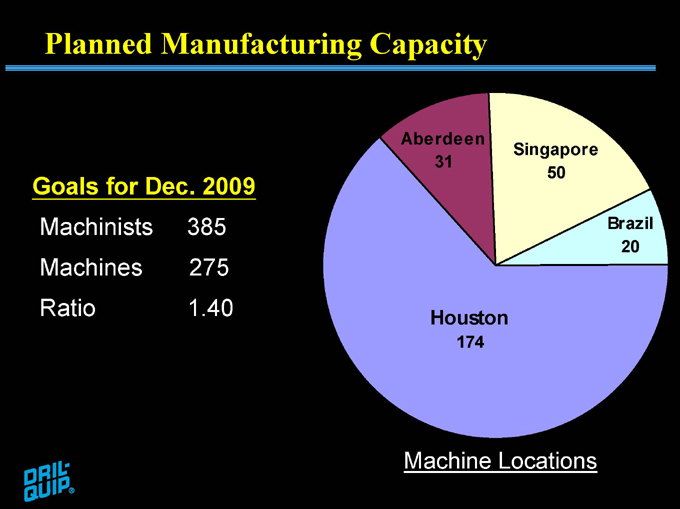
Planned Manufacturing Capacity
Goals for Dec. 2009
Machinists 385
Machines 275
Ratio 1.40
Aberdeen
Singapore 31 50
Brazil 20
Houston
174
Machine Locations
Future Revenues will be influenced by:
Increased number of machinists
Increased number of machines
Pricing
Product mix
Expanding Markets
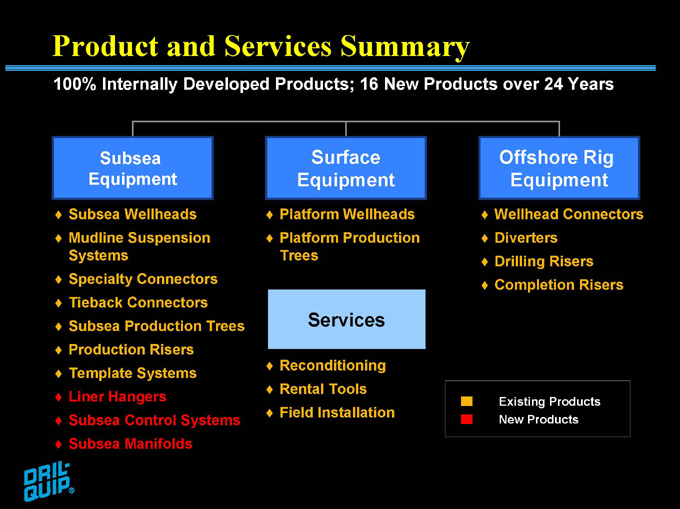
Product and Services Summary
100% Internally Developed Products; 16 New Products over 24 Years
Subsea Equipment
Subsea Wellheads Mudline Suspension Systems Specialty Connectors Tieback Connectors Subsea Production Trees Production Risers Template Systems Liner Hangers Subsea Control Systems Subsea Manifolds
Surface Equipment
Platform Wellheads Platform Production Trees
Services
Reconditioning Rental Tools Field Installation
Offshore Rig Equipment
Wellhead Connectors Diverters Drilling Risers Completion Risers
Existing Products New Products
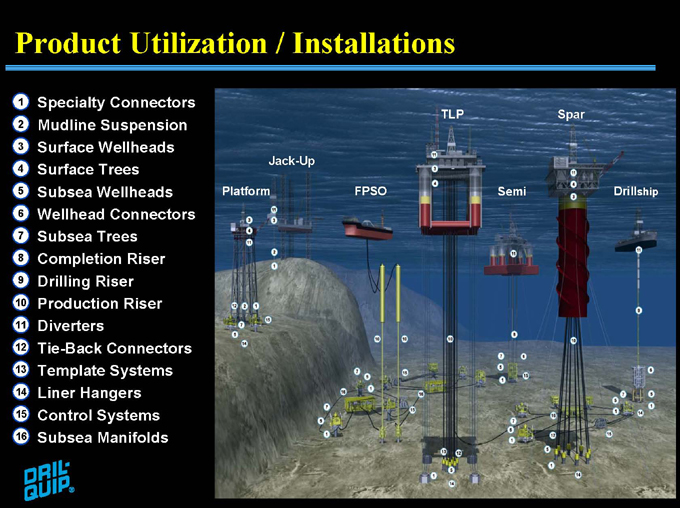
Product Utilization / Installations
1 Specialty Connectors
2 Mudline Suspension
3 Surface Wellheads
4 Surface Trees
5 Subsea Wellheads
6 Wellhead Connectors
7 Subsea Trees
8 Completion Riser
9 Drilling Riser
10 Production Riser
11 Diverters
12 Tie-Back Connectors
13 Template Systems
14 Liner Hangers
15 Control Systems
16 Subsea Manifolds
Platform
Jack-Up
FPSO
TLP
Semi
Spar
Drillship
1 2 3 4 5 6 7 8 9 10 11 12 13 14 15, 16
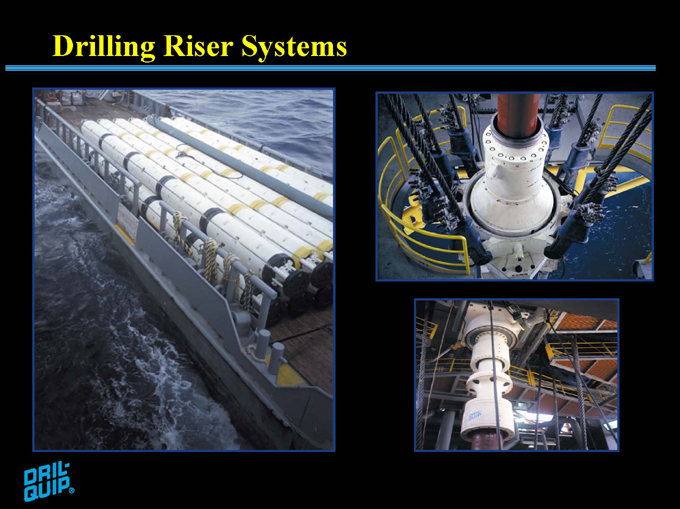
Drilling Riser Systems
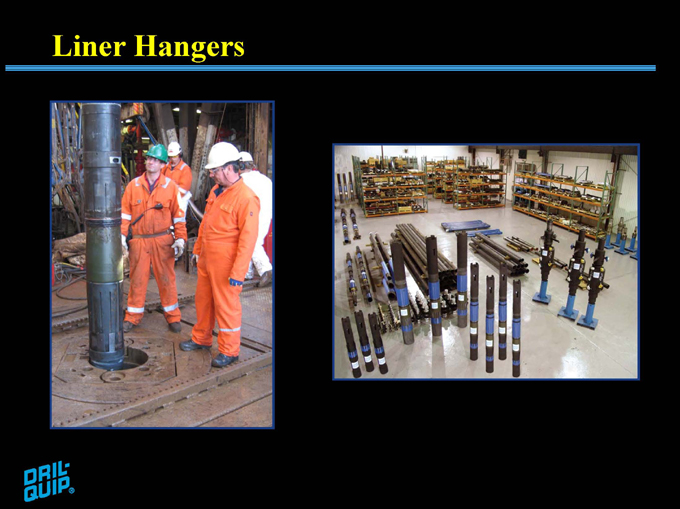
Liner Hangers
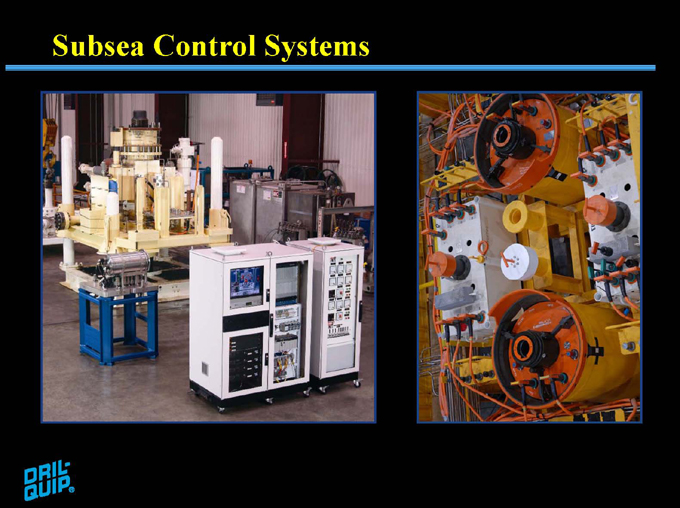
Subsea Control Systems
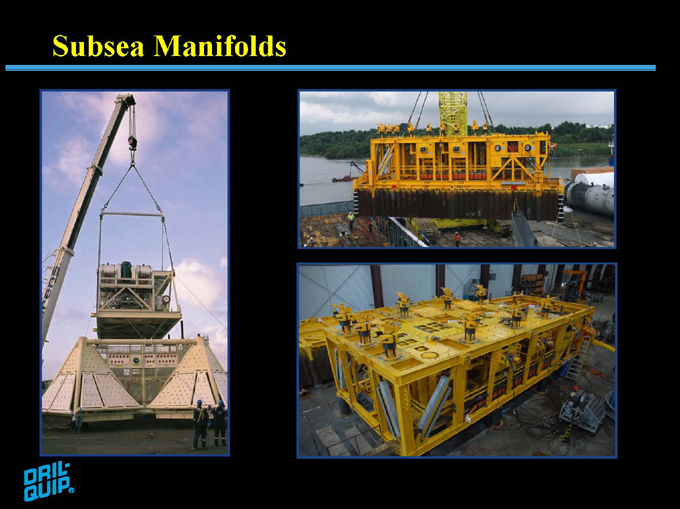
Subsea Manifolds
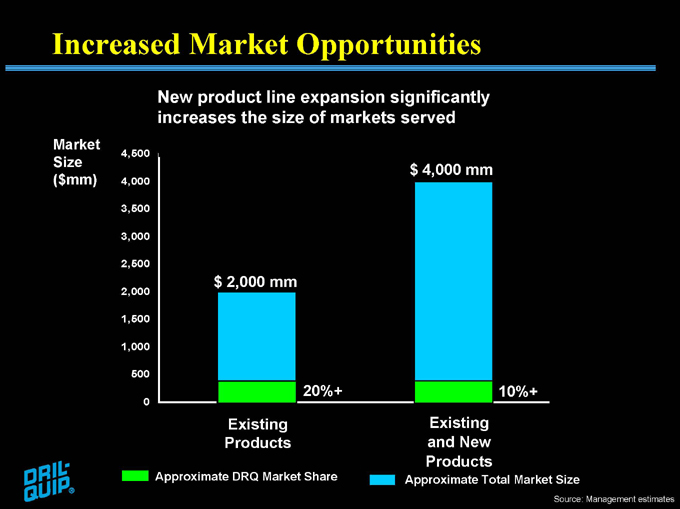
Increased Market Opportunities
New product line expansion significantly increases the size of markets served
Market
4,500
Size $ 4,000 mm
($mm) 4,000
3,500
3,000
2,500
$ 2,000 mm
2,000
1,500
1,000
500
20%+ 10%+
0
Existing Existing Products and New Products
Approximate DRQ Market Share
Approximate Total Market Size
Source: Management estimates
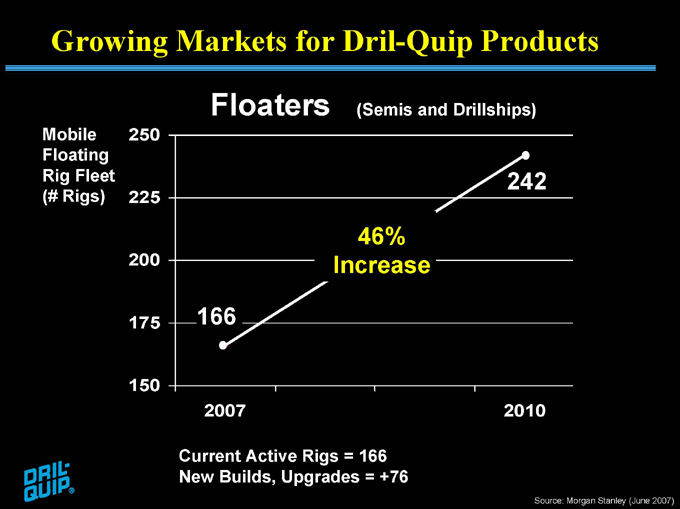
Growing Markets for Dril-Quip Products
Floaters (Semis and Drillships)
Mobile Floating Rig Fleet (# Rigs)
250
242
225
46% Increase
200
175 166
150
2007 2010
Current Active Rigs = 166 New Builds, Upgrades = +76
Source: Morgan Stanley (June 2007)
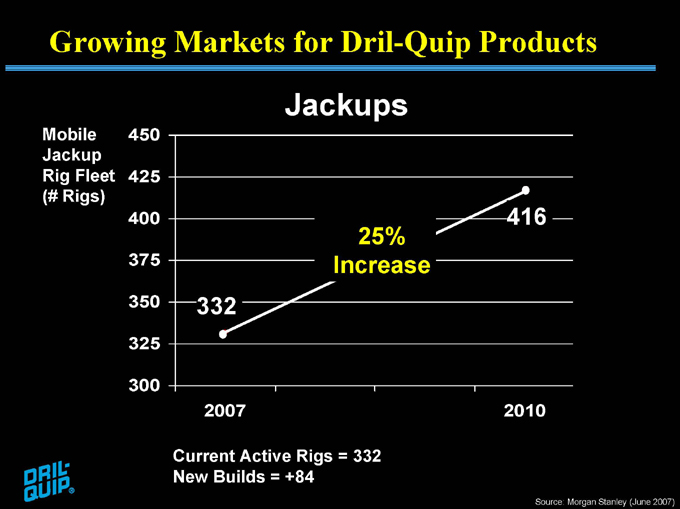
Growing Markets for Dril-Quip Products
Jackups
Mobile 450 Jackup Rig Fleet 425 (# Rigs)
400 416
25% Increase
375
350 332 325
300
2007 2010
Current Active Rigs = 332 New Builds = +84
Source: Morgan Stanley (June 2007)
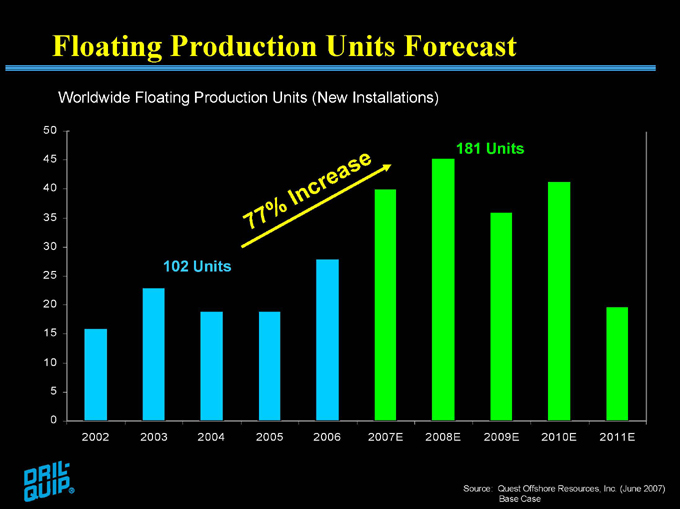
Floating Production Units Forecast
Worldwide Floating Production Units (New Installations)
50
181 Units
45
40
35
77% Increase
30
102 Units
25 20 15
10
5 |
|
0
2002 2003 2004 2005 2006 2007E 2008E 2009E 2010E 2011E
Source: Quest Offshore Resources, Inc. (June 2007) Base Case
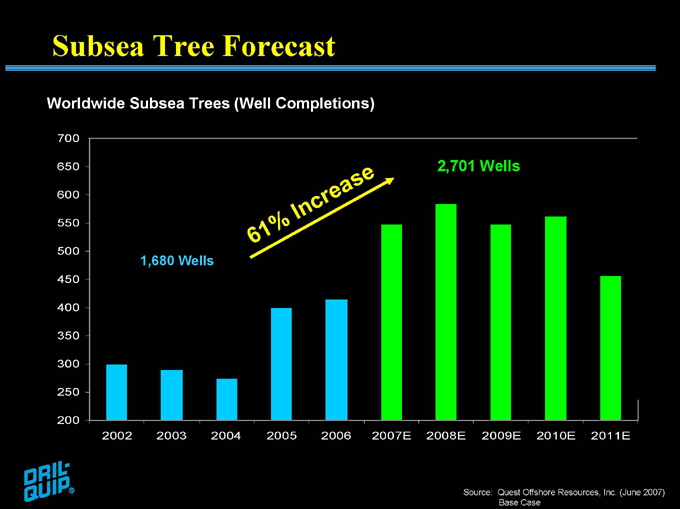
Subsea Tree Forecast
Worldwide Subsea Trees (Well Completions)
700
650
2,701 Wells
600
550
61% Increase
500
1,680 Wells
450 400 350 300 250
200
2002 2003 2004 2005 2006 2007E 2008E 2009E 2010E 2011E
Source: Quest Offshore Resources, Inc. (June 2007) Base Case
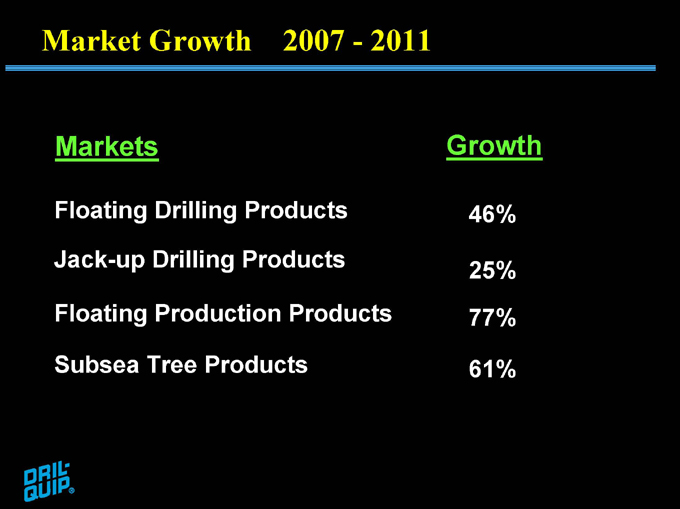
Market Growth 2007 - 2011
Markets Growth
Floating Drilling Products 46%
Jack-up Drilling Products 25%
Floating Production Products 77%
Subsea Tree Products 61%
Growth Strategy
Increase market share – existing and new products
Continued introduction of new products
Continued expansion of manufacturing capacity.
Pursue large integrated projects
Expand into new geographic areas
Capitalizing on the Up-Market
Pure Play on Rapidly Growing Offshore Market Significant Operating Leverage to Up-Cycle
Vertically Integrated, Low Cost Manufacturer Increasing Capacity to Capitalize on the Market
Consistent Track Record of New Product Innovation Highly Motivated, Experienced Management Team
Strong Growth Profile