 Howard Weil 40 th Annual Energy Conference March 26, 2012 Howard Weil 40 th Annual Energy Conference March 26, 2012 Exhibit 99.1 Dril-Quip, Inc. |
 The information furnished in this presentation contains “forward-looking statements” within the meaning of the Federal Securities laws. Forward-looking statements include goals, projections, estimates, expectations, forecasts, plans and objectives, and are based on assumptions, estimates and risk analysis made by management of Dril-Quip in light of its experience and perception of historical trends, current conditions, expected future developments and other factors. No assurance can be given that actual future results will not differ materially from those contained in the forward-looking statements in this presentation. Although Dril-Quip believes that all such statements contained in this presentation are based on reasonable assumptions, there are numerous variables of an unpredictable nature or outside of Dril-Quip’s control that could affect Dril-Quip’s future results and the value of its shares. Each investor must assess and bear the risk of uncertainty inherent in the forward-looking statements contained in this presentation. Please refer to Dril-Quip’s filings with the SEC for additional discussion of risks and uncertainties that may affect Dril-Quip’s actual future results. Dril-Quip undertakes no obligation to update the forward-looking statements contained herein. Forward-Looking Statements |
 • Pure play in worldwide offshore market • Emphasis on deep water • Strong balance sheet • Strong backlog • Superior margins • Positioned for growth DRQ - Investment Highlights |
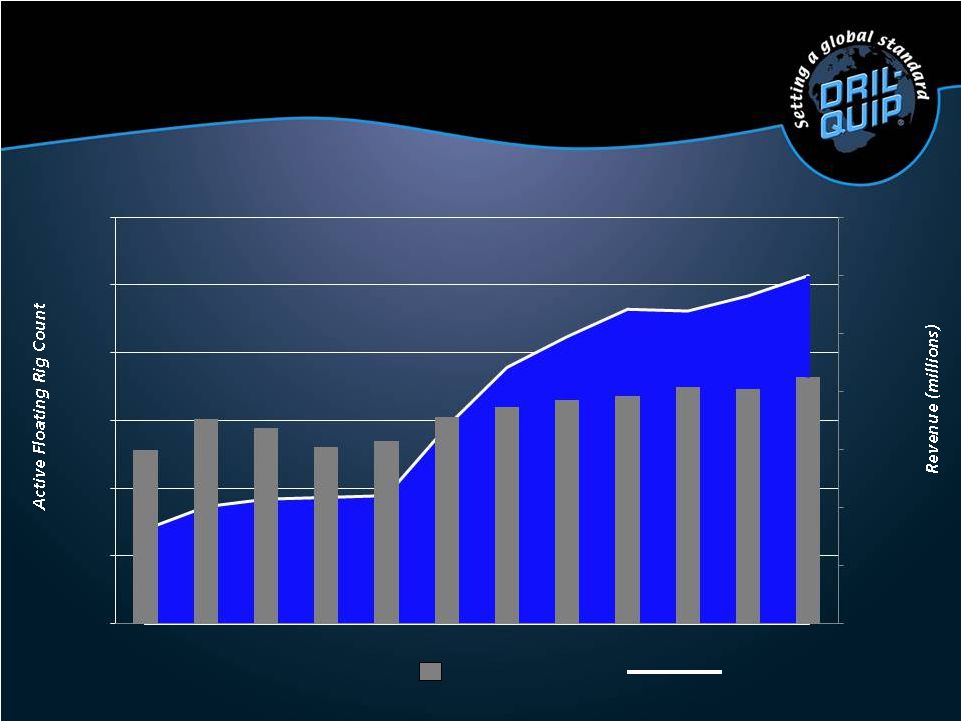 Rig Count Source: ODS-Petrodata Active Floating Rigs Revenue Consistent Track Record of Growth $0 $100 $200 $300 $400 $500 $600 $700 - 50 100 150 200 250 300 2000 2001 2002 2003 2004 2005 2006 2007 2008 2009 2010 2011 |
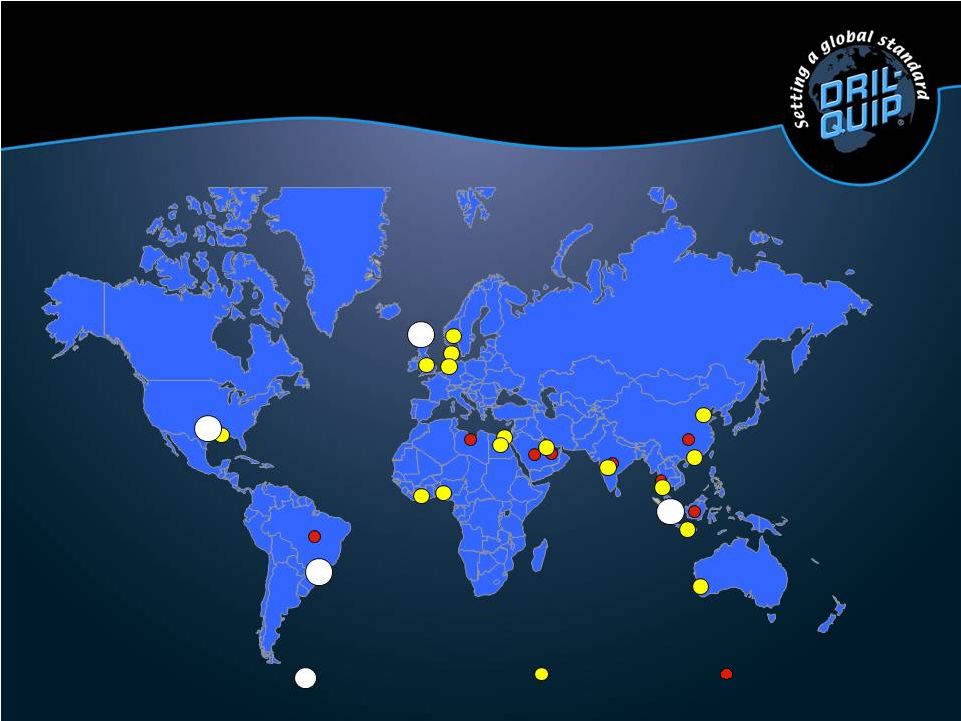 Strong Global Presence Worldwide offices located near key demand centers Worldwide offices located near key demand centers Dril-Quip manufacturing, sales and service Dril-Quip sales and/or service World Headquarters Houston, Texas Asia Pacific Headquarters Singapore Brazil Dril-Quip sales representatives Eastern Hemisphere Headquarters Aberdeen, Scotland |
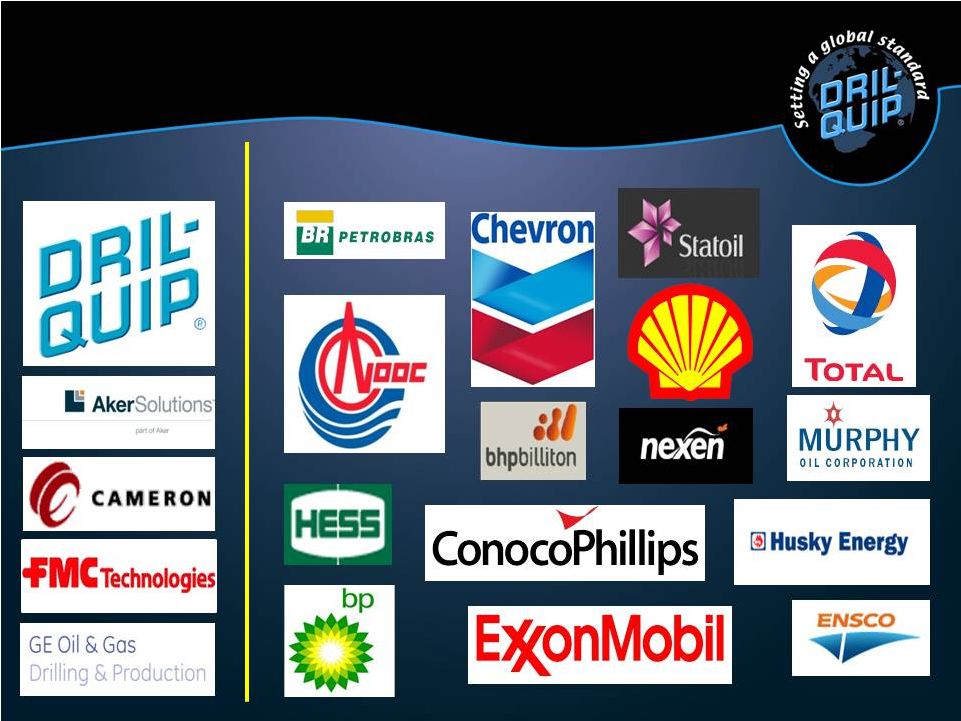 Suppliers | Offshore Operators |
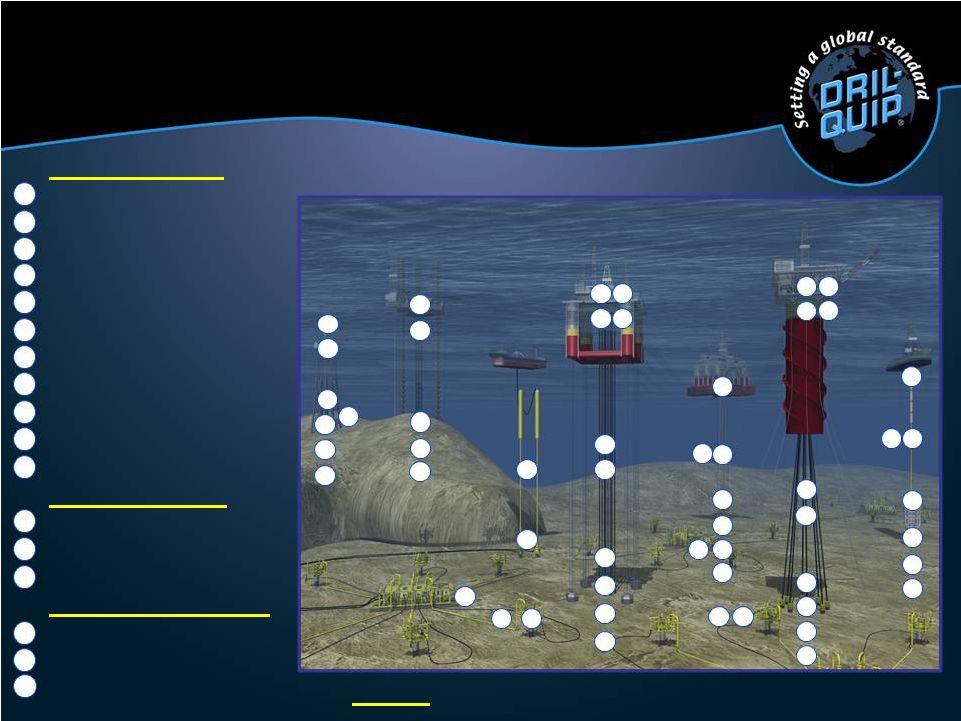 Subsea Equipment Specialty Connectors Mudline Suspension Subsea Wellheads Tie-Back Connectors Template Systems Subsea Trees Control Systems Subsea Manifolds Production Risers Liner Hangers Completion Risers Surface Equipment Surface Wellheads Surface Trees Riser Tensioners Offshore Rig Equipment Drilling Risers Wellhead Connectors Diverters 1 2 3 4 5 6 7 8 9 10 11 12 13 14 15 16 17 12 13 Platform Jack-Up FPSO TLP Spar Drillship Semi 4 5 2 1 10 12 17 2 1 10 9 4 9 4 3 1 10 17 15 7 6 13 12 14 3 8 1 10 13 12 17 9 4 3 1 10 17 15 16 3 1 10 8 7 6 17 14 Services Reconditioning, Rental Tools, Field Installation 15 14 Product and Services Summary 11 11 16 |
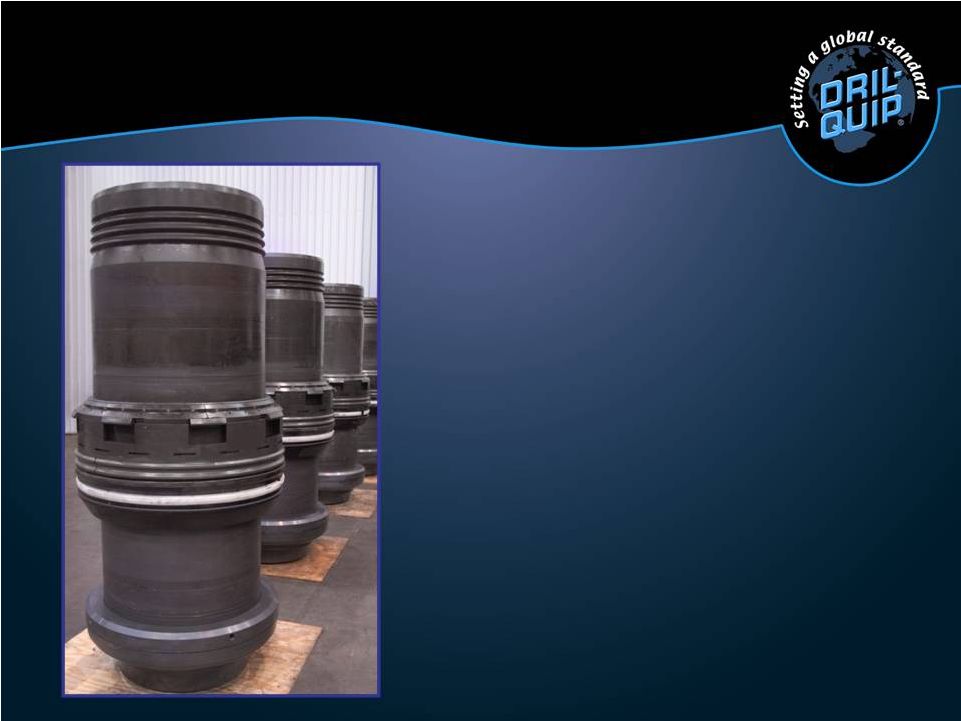 Utilized on subsea wells drilled by floating rigs • Specialty Connectors • Subsea Wellheads • Liner Hangers Subsea Well Systems |
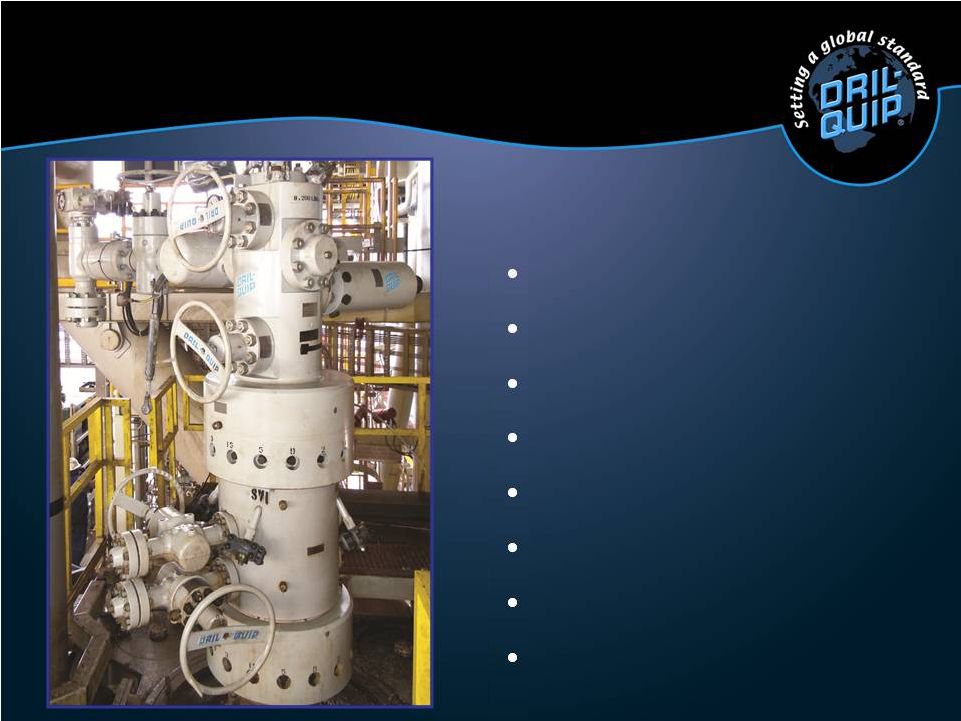 Utilized by Spars and TLPs Surface Trees Surface Wellheads Riser Tensioners Production Risers Tie-Back Connectors Subsea Wellheads Specialty Connectors Liner Hangers Dry Tree Completion Systems |
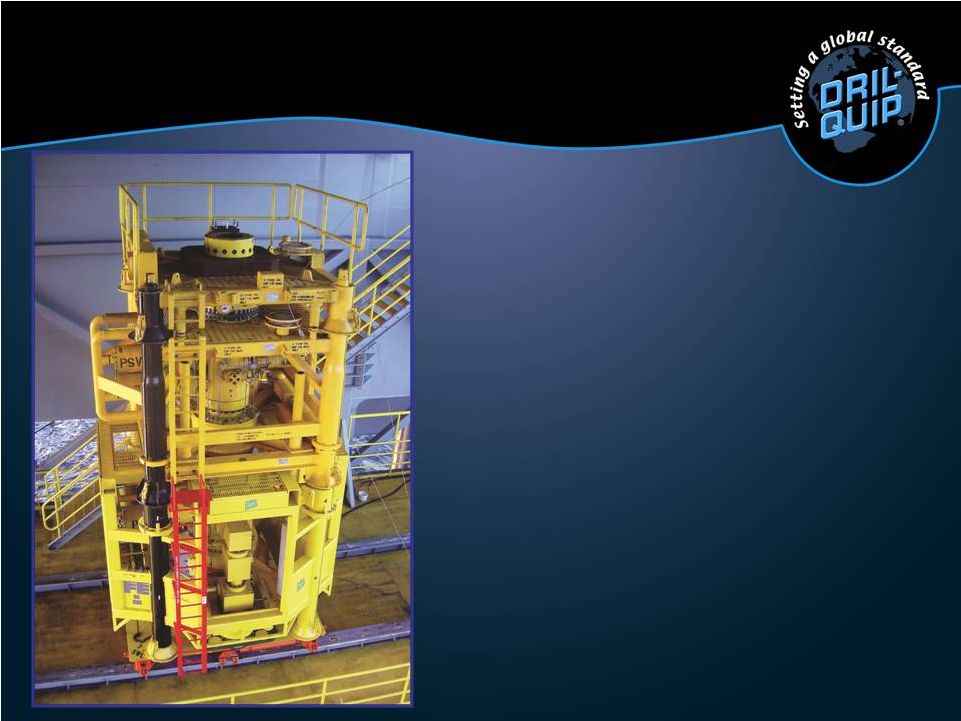 Utilized with FPSO and Subsea Developments • Subsea Trees • Control Systems • Subsea Manifolds • Subsea Wellheads • Specialty Connectors • Liner Hangers Subsea Completion Systems |
 Utilized on Drilling Rigs • Drilling Risers • Wellhead Connectors • Diverters Offshore Rig Equipment |
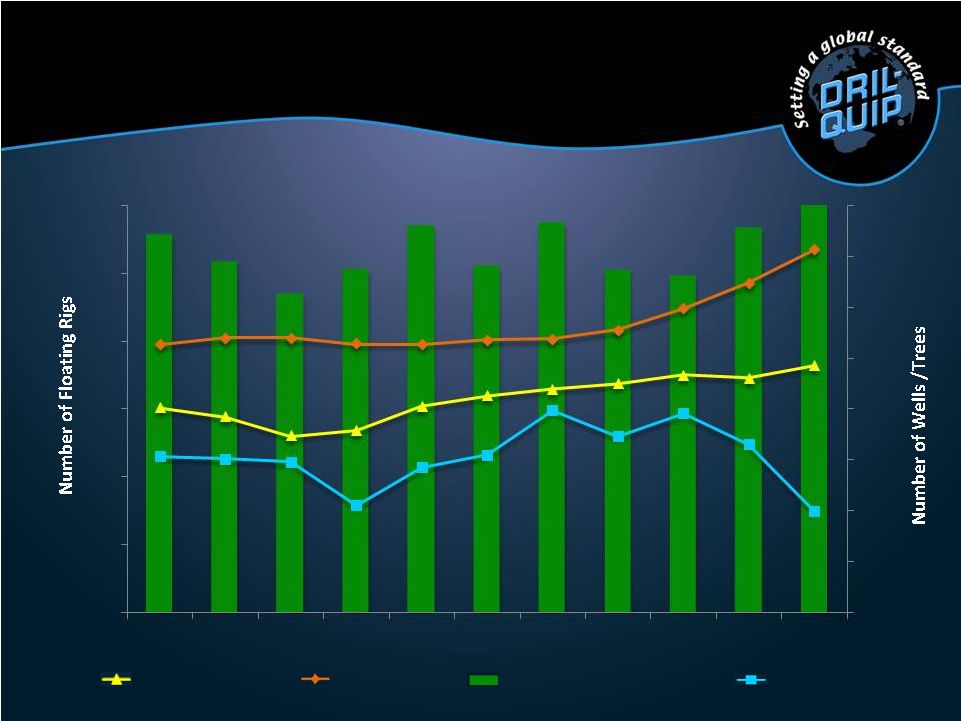 Source: IHS Petrodata, BofA Merrill Lynch, Quest QSDB Total Subsea Wells Drilled Working Floating Rigs 0 50 100 150 200 250 300 2001 2002 2003 2004 2005 2006 2007 2008 2009 2010 2011 0 100 200 300 400 500 600 700 800 Total Floating Rigs Wells Drilled from Floating Rigs Tree Startups |
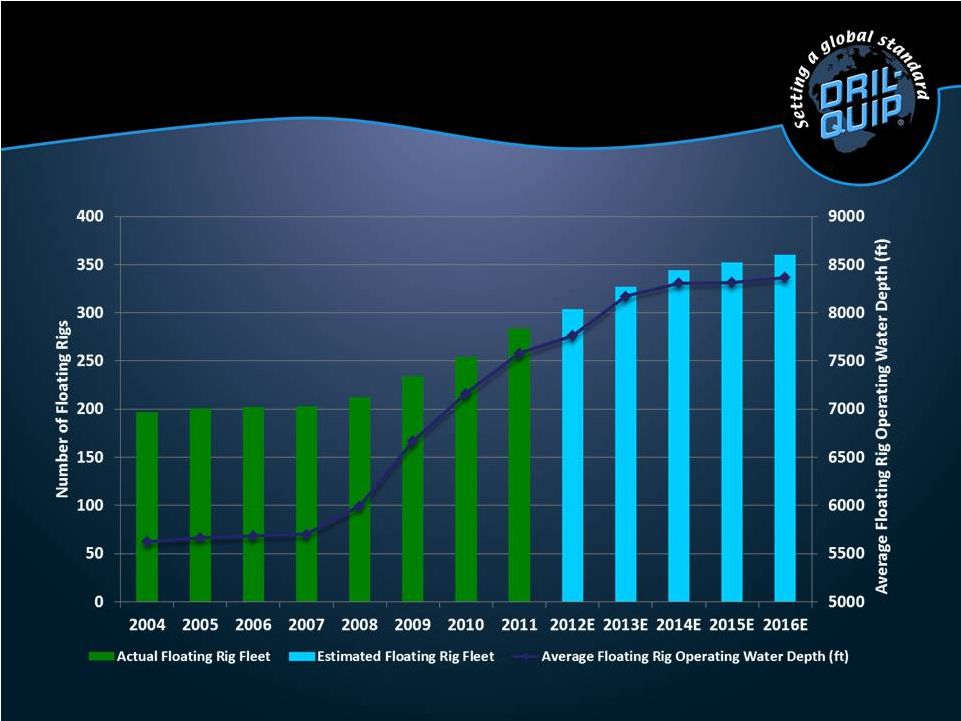 Growth of Floating Rig Fleet Source: IHS Petrodata, March 21, 2012 Assumes no attrition of rig fleet |
 Source: Quest Floating Production Database, Mar 21, 2012 FPSO, SPAR and TLP Awards Worldwide Floating Production Units Forecast |
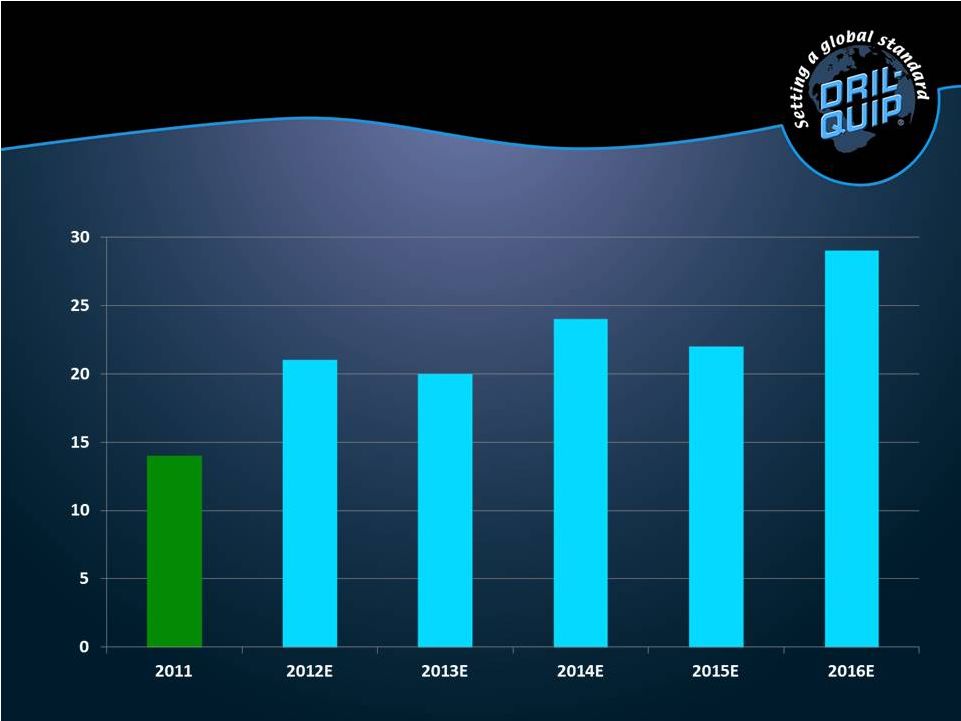
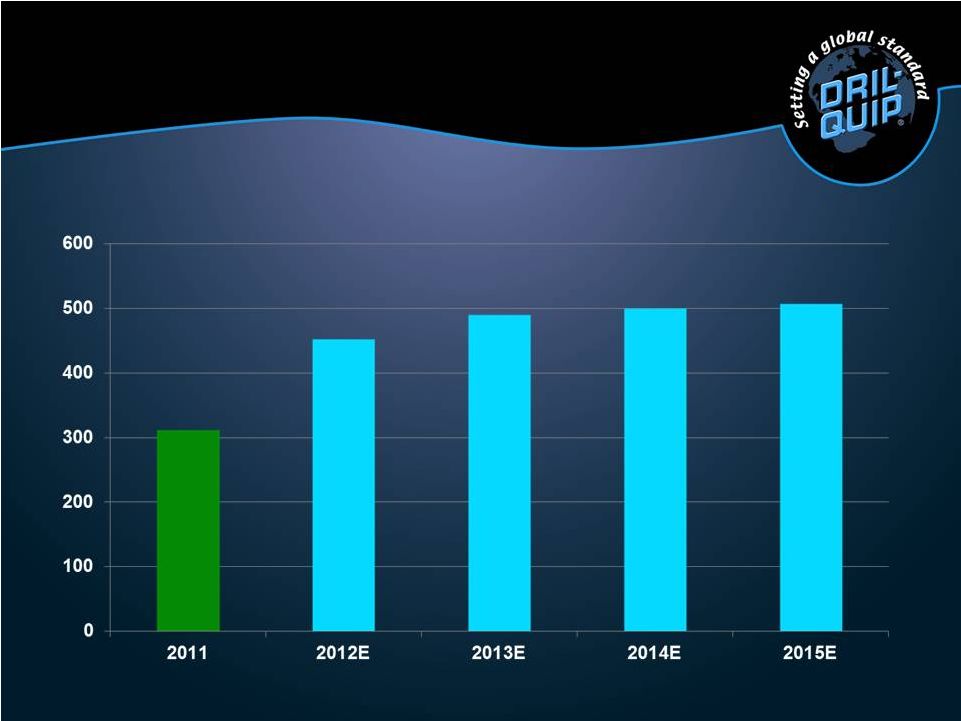 Source: Quest Subsea Forecast Awards, Feb 20, 2012 Subsea Tree Awards Forecast Base Case Worldwide Subsea Tree Forecast |
 Assets Current assets $ 799 $ 688 Property, plant and equipment, net 275 247 Other assets 12 13 Total assets $ 1,086 $ 948 Liabilities and Stockholders’ Equity Current liabilities $ 151 $ 111 Long-term debt - - Deferred taxes 10 9 Total liabilities 161 120 Stockholders’ equity 925 828 $ 1,086 $ 948 (Millions of USD) Dec. 31, Dec. 31, 2011 2010 Condensed Consolidated Balance Sheets |
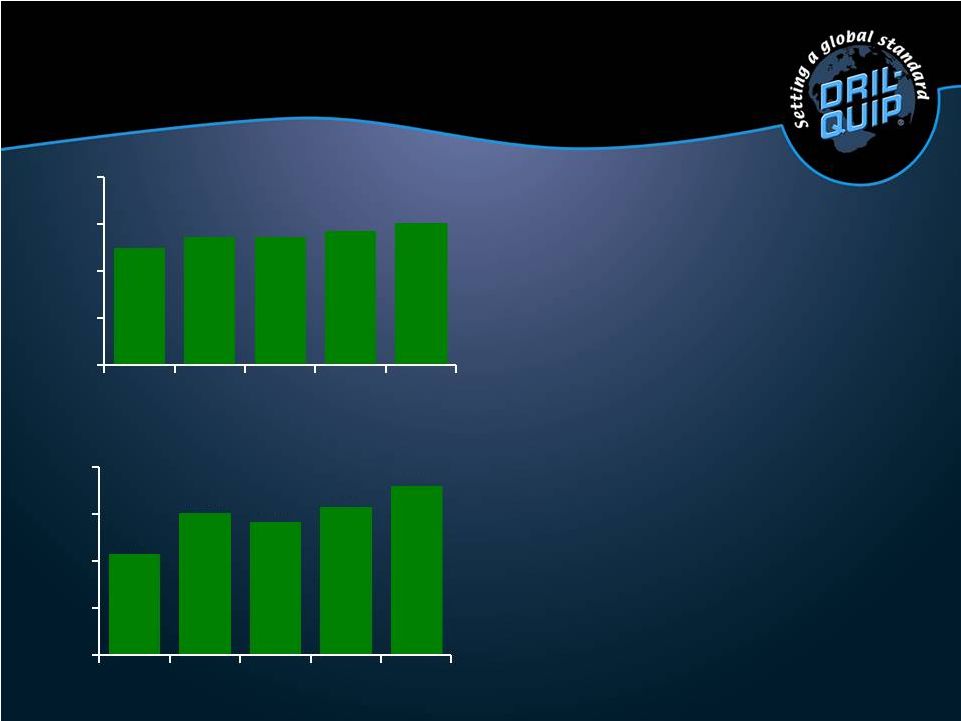 • Consistent revenue and backlog growth Revenue ($mm) Worldwide Revenues and Backlog Backlog ($mm) 601 566 540 543 496 2011 2010 2009 2008 2007 0 200 400 600 800 2011 2010 2009 2008 2007 0 200 400 600 800 716 627 563 603 429 |
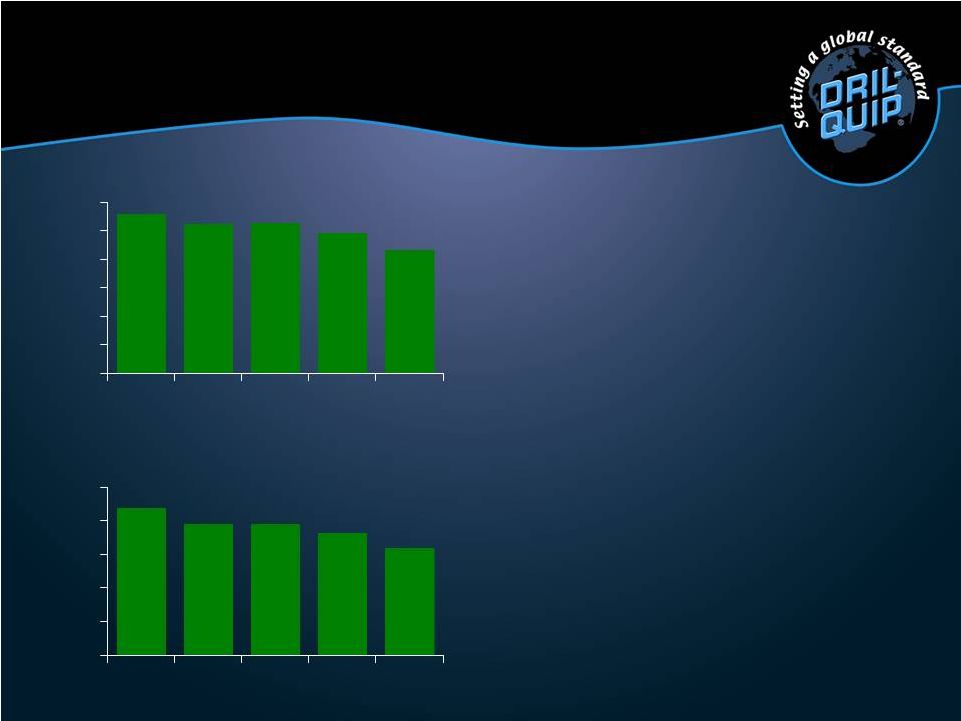 EBIT (Operating Income) Margin * (%) Net Income Margin ** (%) * Represents Operating Income divided by Revenue ** Represents Net Income divided by Revenue • Superior margins due to: - Vertical integration - Machine rebuilding Proven Track Record of Profitability 21.6 24.5 26.3 26.1 27.9 2011 2010 2009 2008 2007 0 5 10 15 20 25 30 2011 2010 2009 2008 2007 0 5 10 15 20 25 21.8 19.5 19.5 18.1 15.8 |
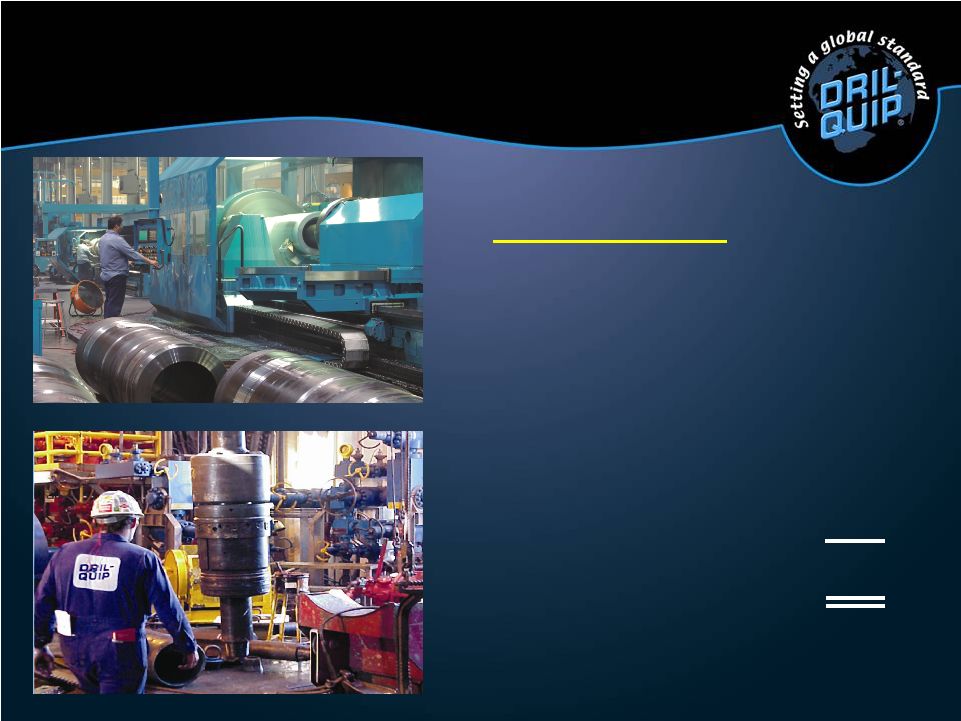
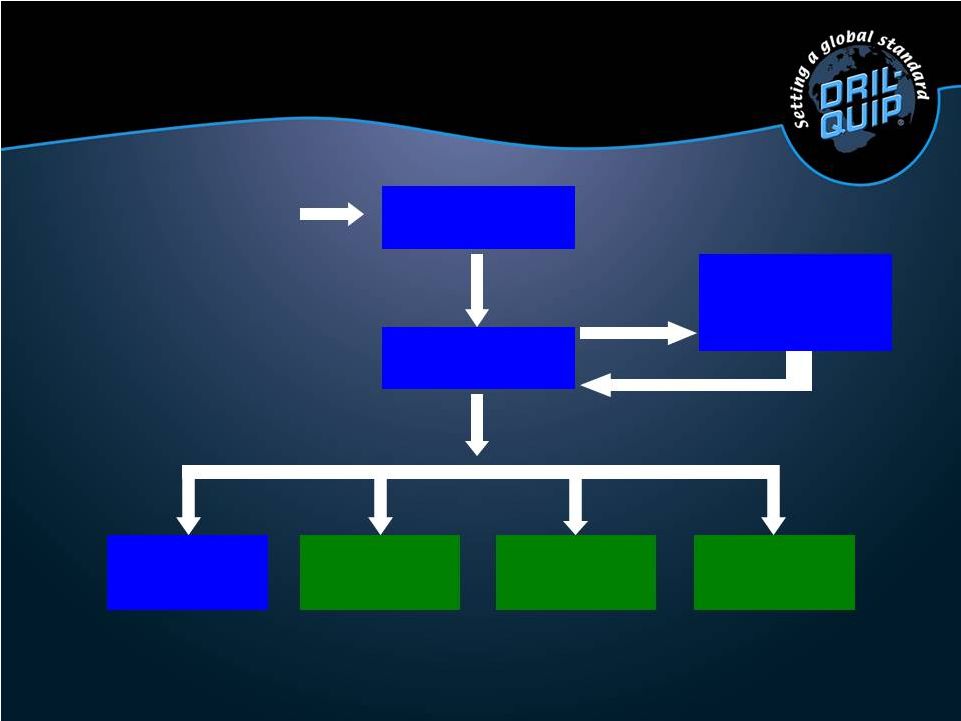 Finishing Operations Houston Finishing Operations Finishing Operations Finishing Operations Purchase Raw Materials Forge Heat Treat Rough Machine Aberdeen Singapore Brazil Vertically Integrated Manufacturing |
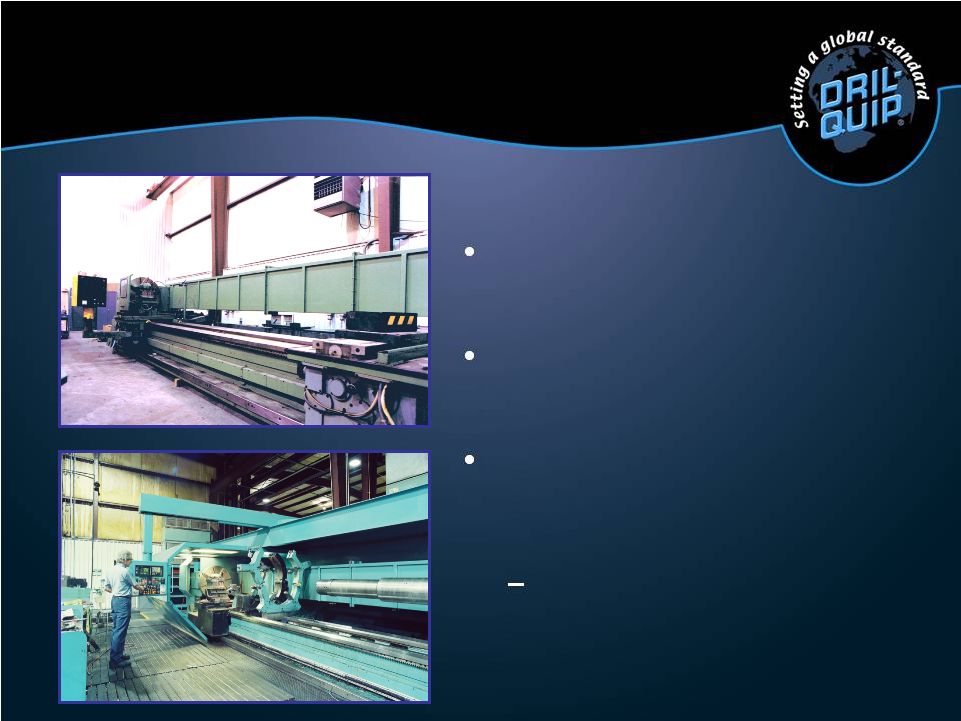 Machine Rebuilding Purchase used Rebuild in-house with new CNC controls Purpose built machines Resulting in reduced capital expenditures machines |
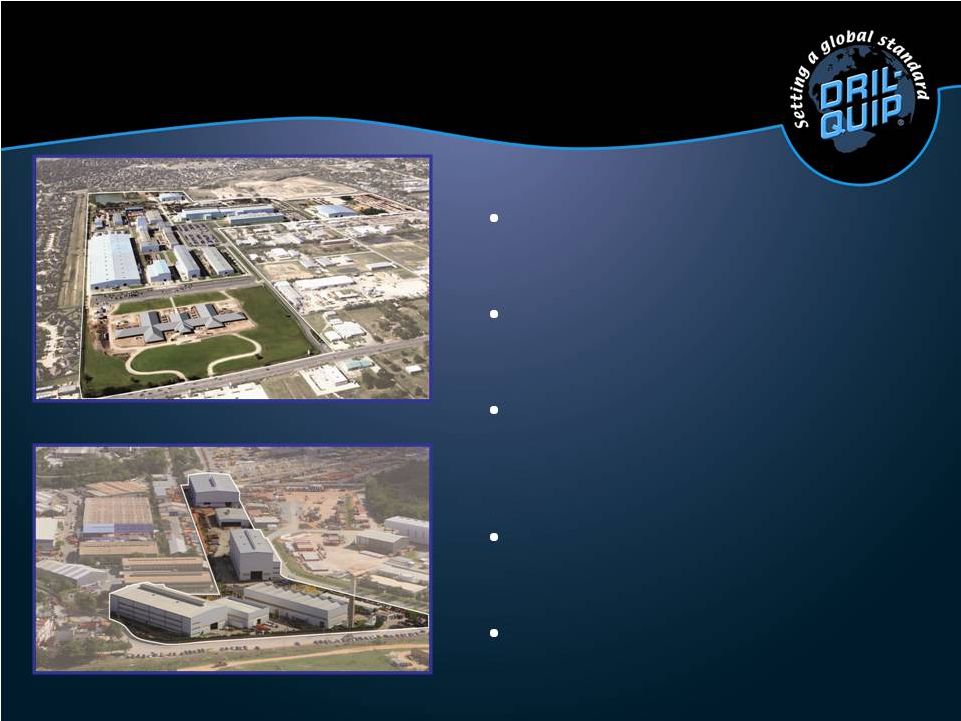 Macaé, Brazil (11 acres) Houston Eldridge (218 acres) Manufacturing Locations Nine new machines planned for 2012 Additional machine shop complete Brazil Four new machines planned for 2012 Additional forge expansion in process Headquarters expansion complete Houston |
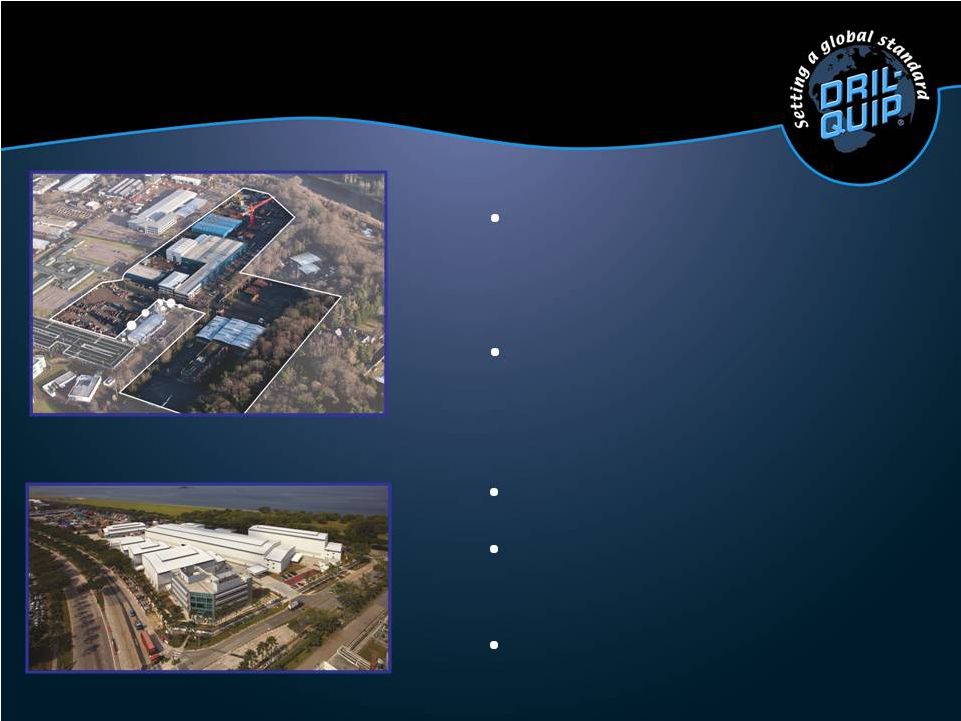 Singapore (11 acres) Aberdeen, Scotland (24 acres) Manufacturing Locations Four new machines planned for 2012 All machines relocated by Q2 2012 New facilities complete Singapore Two new machines planned for 2012 Seven acre site added in Q4 2010 - Integrated into Operation in 2011 Aberdeen |
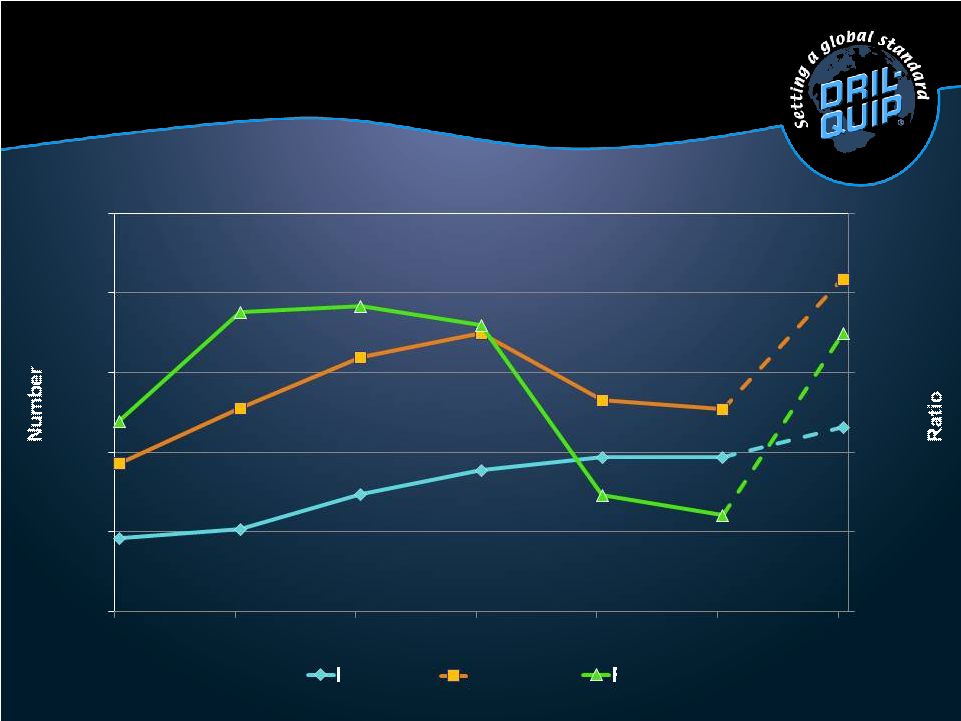 Machines and Machinists 1.00 1.10 1.20 1.30 1.40 150 200 250 300 350 400 1.50 Dec-09 Dec-10 Dec-11 Dec-08 Dec-06 Dec-07 Machines Machinists Ratio Dec-12E |
 2012 Planned Capital Expenditures • Machines • Rental Tools • Buildings • R&D Facilities • Other Total $60 (Millions of USD) $28 17 7 3 5 |
 • Continued emphasis on the growing deep water offshore sector • Increase market share of dry tree and subsea completion systems – Expand engineering staff – Expand project management and sales staff – Utilization of recent facility expansions • Continue introduction of new products • Maintain strong financial position Looking Ahead |