4th Quarter 2017 Supplemental Earnings Information Exhibit 99.2
1 Forward-Looking Statements The information furnished in this presentation contains “forward-looking statements” within the meaning of the Federal Securities laws. Forward-looking statements include goals, projections, estimates, expectations, market outlook, forecasts, plans and objectives, including revenue and other projections, acquisition opportunities, forecasted backlog, forecasted demand, liquidity, cost savings, and share repurchases and are based on assumptions, estimates and risk analysis made by management of Dril-Quip in light of its experience and perception of historical trends, current conditions, expected future developments and other factors. No assurance can be given that actual future results will not differ materially from those contained in the forward-looking statements in this presentation. Although Dril-Quip believes that all such statements contained in this presentation are based on reasonable assumptions, there are numerous variables of an unpredictable nature or outside of Dril-Quip’s control that could affect Dril-Quip’s future results and the value of its shares. Each investor must assess and bear the risk of uncertainty inherent in the forward-looking statements contained in this presentation. Please refer to Dril-Quip’s filings with the SEC for additional discussion of risks and uncertainties that may affect Dril-Quip’s actual future results. Dril-Quip undertakes no obligation to update the forward-looking statements contained herein. Use of Non-GAAP Financial Measures We calculate Adjusted net income, Adjusted diluted EPS, and Adjusted EBITDA to evaluate and compare the results of our operations from period to period by removing the effect of our capital structure from our operating structure. We calculate Free Cash Flow as net cash provided by operating activities less net cash used in the purchase of property, plant, and equipment. These measurements are used in concert with net income and cash flows from operations, respectively, which measure actual cash generated in the period. We believe that these non-GAAP measures are supplemental measurement tools used by analysts and investors to help evaluate overall operating performance, ability to pursue and service possible debt opportunities and make future capital expenditures. These metrics do not represent funds available for our discretionary use and are not intended to represent or to be used as a substitute for net income or cash flows from operations, as measured under U.S. generally accepted accounting principles. The items excluded from Adjusted net income, Adjusted EBITDA and Free Cash Flow, but included in the calculation of reported net income and net cash provided by operating activities, as applicable, are significant components of the consolidated statements of income and must be considered in performing a comprehensive assessment of overall financial performance. Our calculation of Adjusted EBITDA and Free Cash Flow may not be consistent with calculations used by other companies. Reconciliations of these non-GAAP measures to the most directly comparable GAAP measure can be found on slides 21 through 23. Cautionary Statement
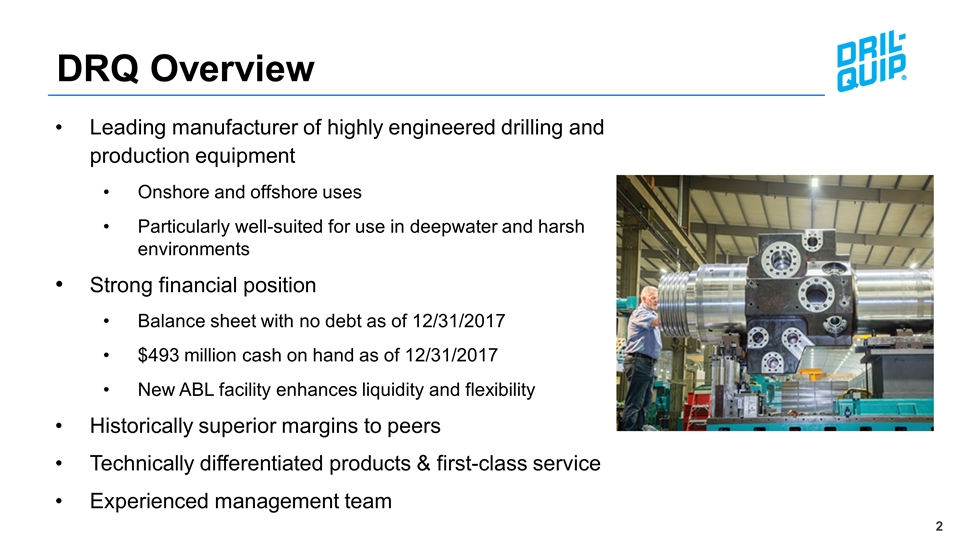
Leading manufacturer of highly engineered drilling and production equipment Onshore and offshore uses Particularly well-suited for use in deepwater and harsh environments Strong financial position Balance sheet with no debt as of 12/31/2017 $493 million cash on hand as of 12/31/2017 New ABL facility enhances liquidity and flexibility Historically superior margins to peers Technically differentiated products & first-class service Experienced management team DRQ Overview
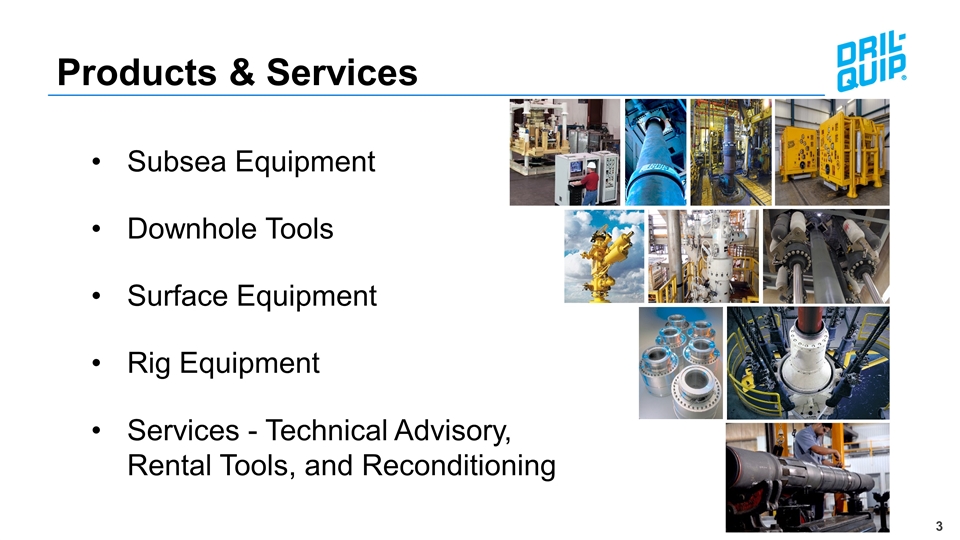
Subsea Equipment Downhole Tools Surface Equipment Rig Equipment Services - Technical Advisory, Rental Tools, and Reconditioning Products & Services
Generated $108.0 million of revenue, a quarter-on-quarter increase of 8% and consistent with general guidance Continued strong gross margin performance Reported a Net Loss of $71.5 million, or $1.90 loss per diluted share, including charges of $1.91 per diluted share Reported Adjusted Diluted EPS, excluding charges, was $0.01 per share Generated $33.3 million of Net Cash Provided by Operating Activities Grew cash on hand to $493.2 million at December 31, 2017 Maintained clean balance sheet with no debt at December 31, 2017 Subsequent to quarter-end, awarded contract for the Ca Rong Do Project in Vietnam Revenue expected to be between $90 million and $100 million per quarter in first three quarters of 2018 Q4 2017 Highlights and Recent Key Items Executing Our Strategy While Maintaining Pristine Capital Structure *Please refer to page 21 for a reconciliation of GAAP Net Income to non-GAAP Adjusted net income and page 1 for information on non-GAAP financial measures
Early signs of increased activity in some markets; however, oil price and offshore rig environments remain uncertain into 2018 Offshore spending may remain muted as operators delay FIDs in favor of reduced spending and shorter-cycle investment options Operators willing to progress projects may face financing challenges Competitive pressure is expected for projects that do move forward Market Outlook Well-Positioned with Strong Balance Sheet to Endure Current Environment
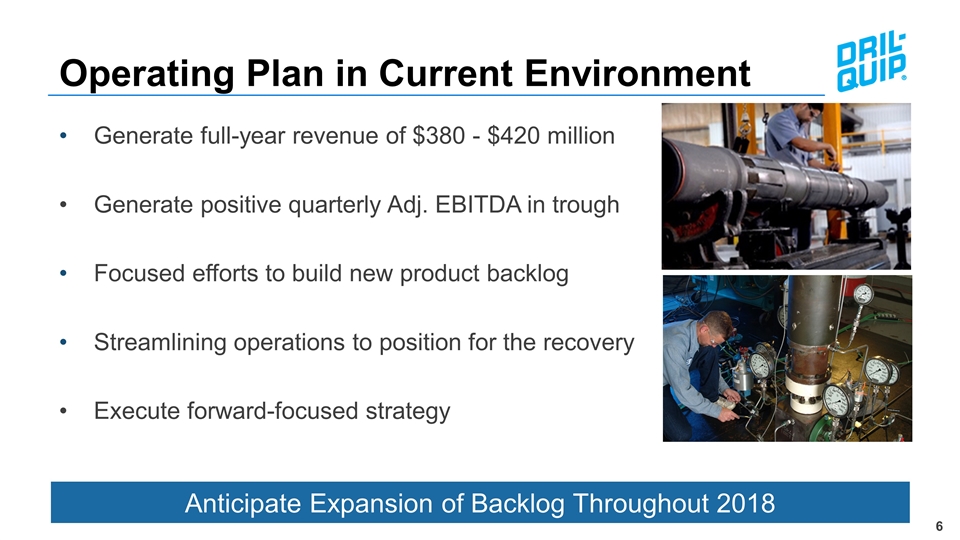
Generate full-year revenue of $380 - $420 million Generate positive quarterly Adj. EBITDA in trough Focused efforts to build new product backlog Streamlining operations to position for the recovery Execute forward-focused strategy Operating Plan in Current Environment Anticipate Expansion of Backlog Throughout 2018
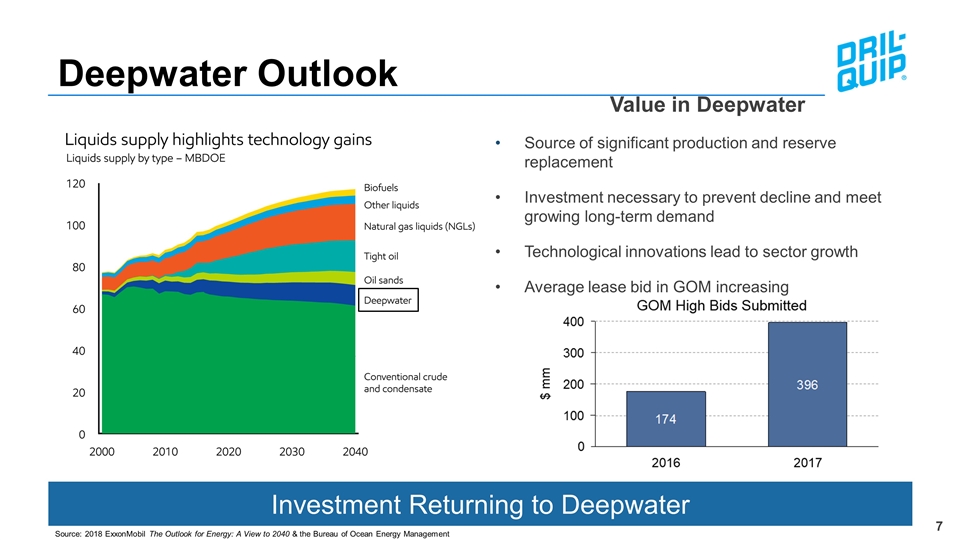
Investment Returning to Deepwater Deepwater Outlook Source: 2018 ExxonMobil The Outlook for Energy: A View to 2040 & the Bureau of Ocean Energy Management Value in Deepwater Source of significant production and reserve replacement Investment necessary to prevent decline and meet growing long-term demand Technological innovations lead to sector growth Average lease bid in GOM increasing
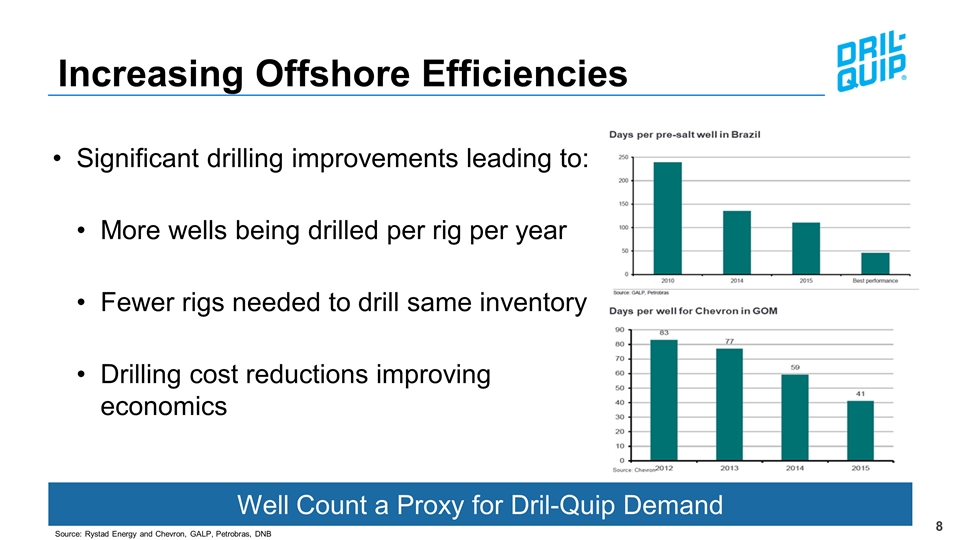
Increasing Offshore Efficiencies Significant drilling improvements leading to: More wells being drilled per rig per year Fewer rigs needed to drill same inventory Drilling cost reductions improving economics Source: Rystad Energy and Chevron, GALP, Petrobras, DNB Well Count a Proxy for Dril-Quip Demand
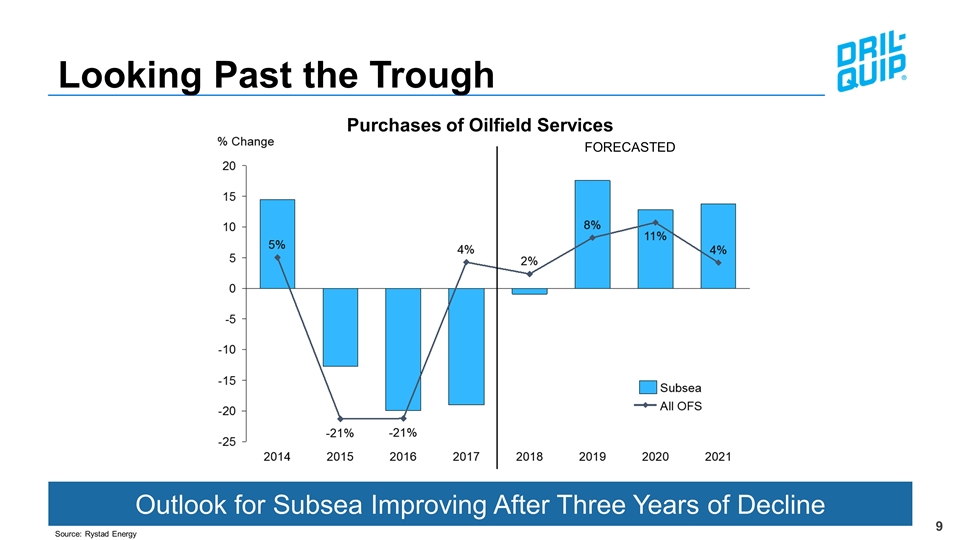
Looking Past the Trough Outlook for Subsea Improving After Three Years of Decline Purchases of Oilfield Services Source: Rystad Energy FORECASTED
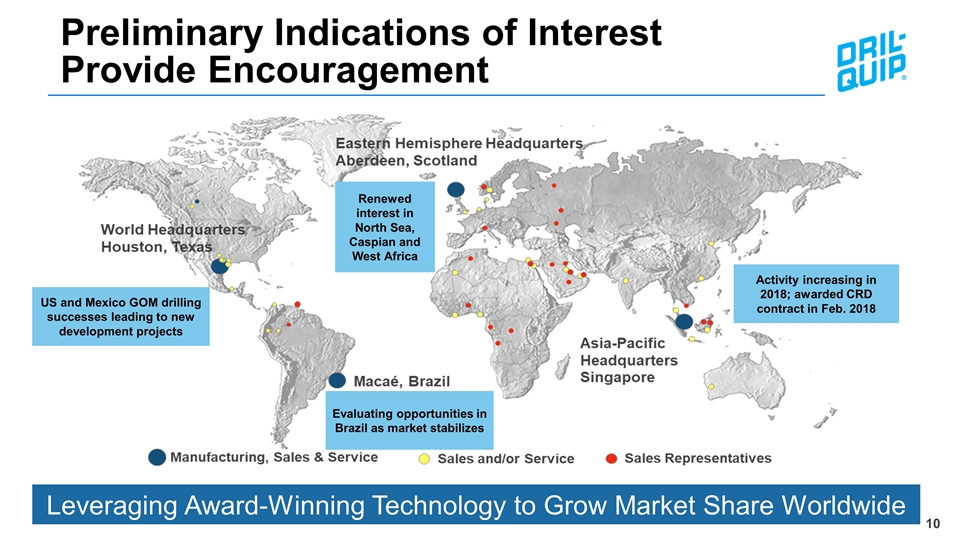
Leveraging Award-Winning Technology to Grow Market Share Worldwide Preliminary Indications of InterestProvide Encouragement US and Mexico GOM drilling successes leading to new development projects Evaluating opportunities in Brazil as market stabilizes Activity increasing in 2018; awarded CRD contract in Feb. 2018 Renewed interest in North Sea, Caspian and West Africa
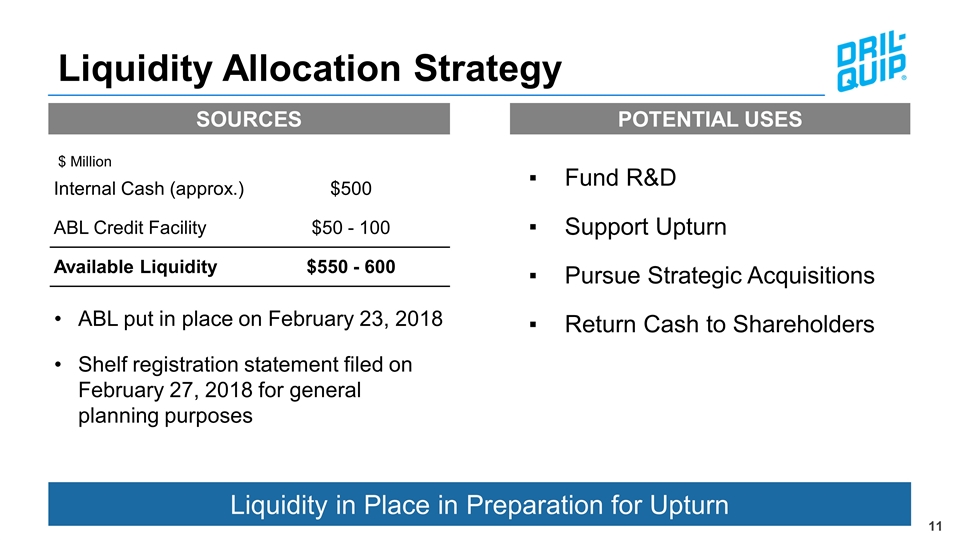
Liquidity Allocation Strategy Liquidity in Place in Preparation for Upturn Internal Cash (approx.) $500 ABL Credit Facility $50 - 100 Available Liquidity $550 - 600 $ Million ABL put in place on February 23, 2018 Shelf registration statement filed on February 27, 2018 for general planning purposes SOURCES POTENTIAL USES Fund R&D Support Upturn Pursue Strategic Acquisitions Return Cash to Shareholders
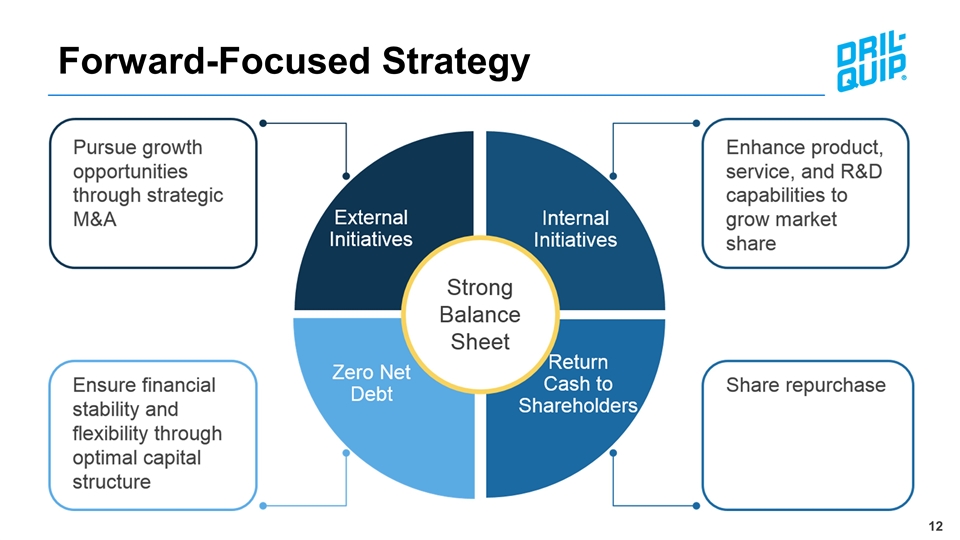
Forward-Focused Strategy Internal Initiatives Zero Debt Share Repurchase
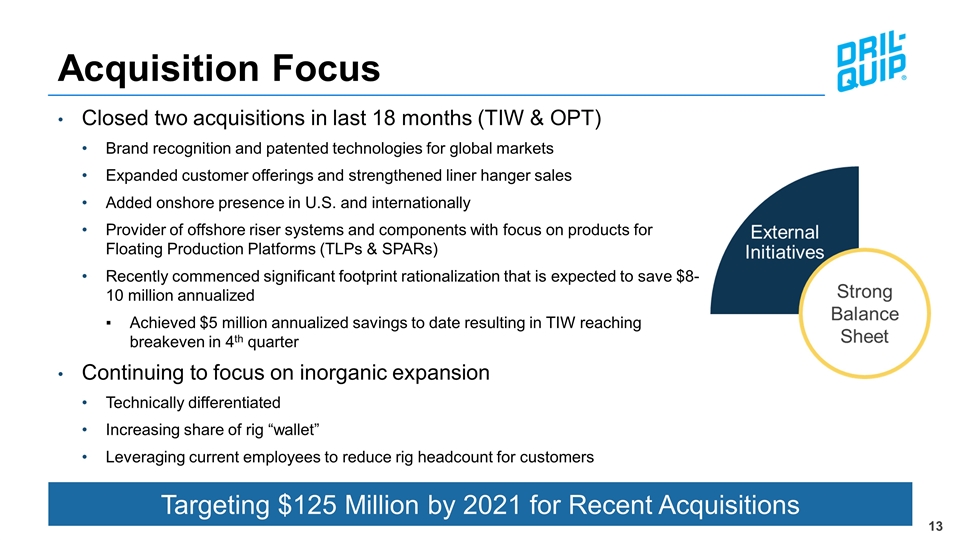
Acquisition Focus Closed two acquisitions in last 18 months (TIW & OPT) Brand recognition and patented technologies for global markets Expanded customer offerings and strengthened liner hanger sales Added onshore presence in U.S. and internationally Provider of offshore riser systems and components with focus on products for Floating Production Platforms (TLPs & SPARs) Recently commenced significant footprint rationalization that is expected to save $8-10 million annualized Achieved $5 million annualized savings to date resulting in TIW reaching breakeven in 4th quarter Continuing to focus on inorganic expansion Technically differentiated Increasing share of rig “wallet” Leveraging current employees to reduce rig headcount for customers Targeting $125 Million by 2021 for Recent Acquisitions
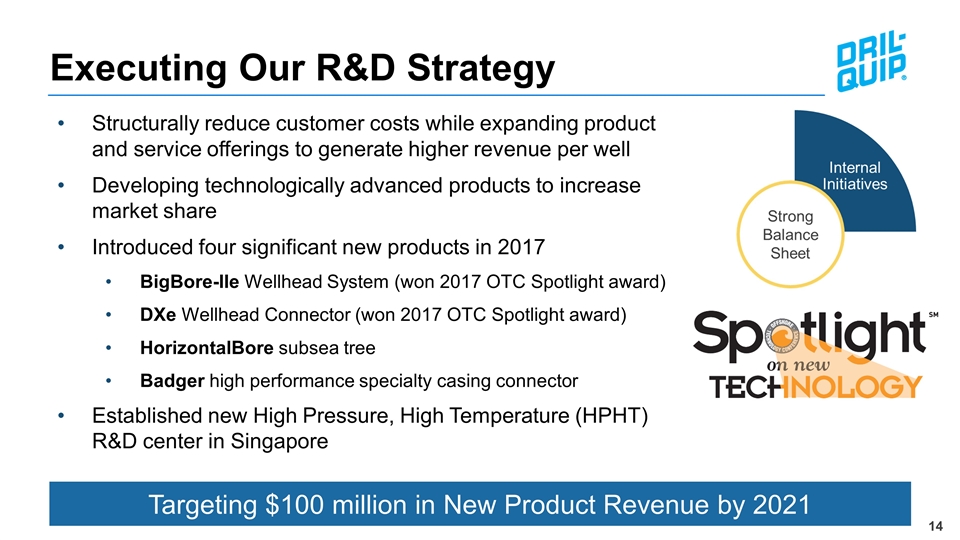
Structurally reduce customer costs while expanding product and service offerings to generate higher revenue per well Developing technologically advanced products to increase market share Introduced four significant new products in 2017 BigBore-IIe Wellhead System (won 2017 OTC Spotlight award) DXe Wellhead Connector (won 2017 OTC Spotlight award) HorizontalBore subsea tree Badger high performance specialty casing connector Established new High Pressure, High Temperature (HPHT) R&D center in Singapore Executing Our R&D Strategy Targeting $100 million in New Product Revenue by 2021
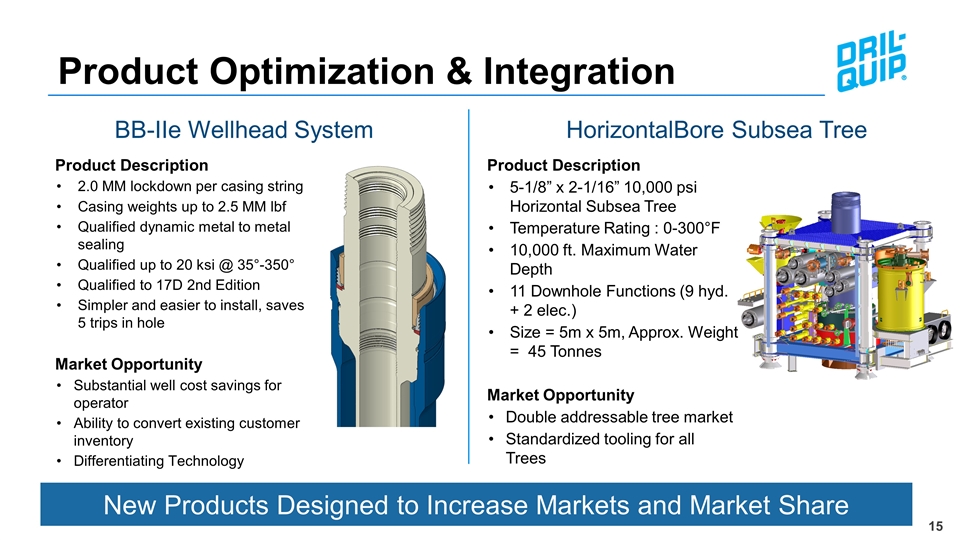
Product Optimization & Integration Product Description 2.0 MM lockdown per casing string Casing weights up to 2.5 MM lbf Qualified dynamic metal to metal sealing Qualified up to 20 ksi @ 35°-350° Qualified to 17D 2nd Edition Simpler and easier to install, saves 5 trips in hole Market Opportunity Substantial well cost savings for operator Ability to convert existing customer inventory Differentiating Technology BB-IIe Wellhead System Product Description 5-1/8” x 2-1/16” 10,000 psi Horizontal Subsea Tree Temperature Rating : 0-300°F 10,000 ft. Maximum Water Depth 11 Downhole Functions (9 hyd. + 2 elec.) Size = 5m x 5m, Approx. Weight = 45 Tonnes Market Opportunity Double addressable tree market Standardized tooling for all Trees HorizontalBore Subsea Tree New Products Designed to Increase Markets and Market Share
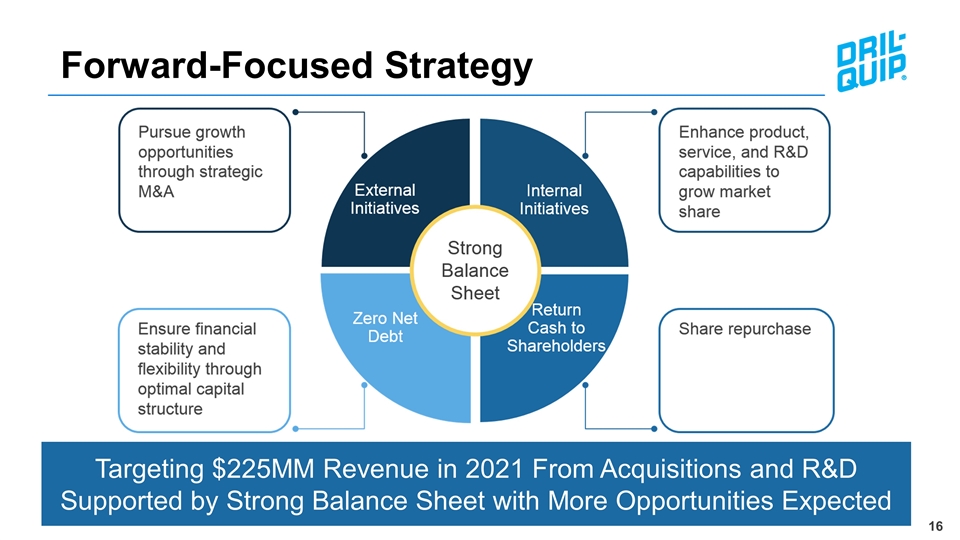
Forward-Focused Strategy Targeting $225MM Revenue in 2021 From Acquisitions and R&D Supported by Strong Balance Sheet with More Opportunities Expected
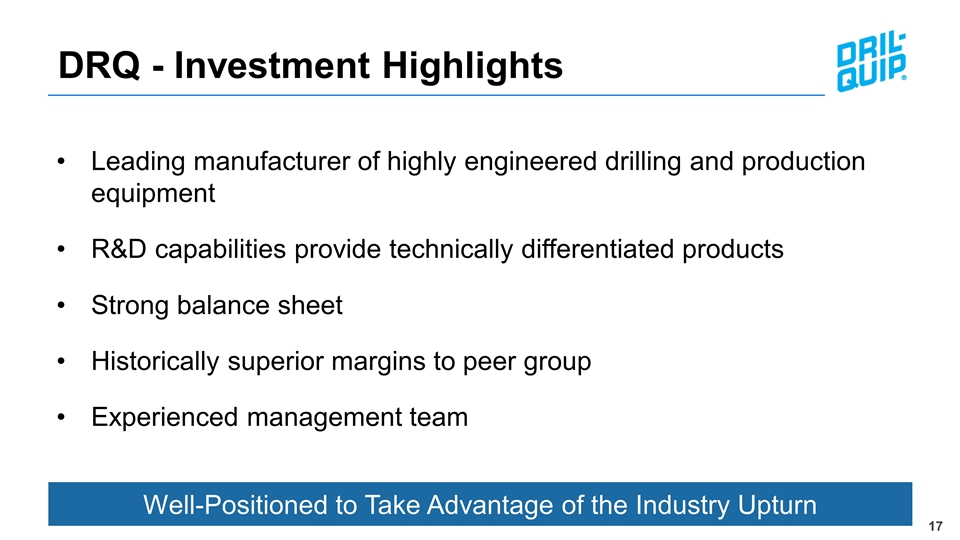
DRQ - Investment Highlights Well-Positioned to Take Advantage of the Industry Upturn Leading manufacturer of highly engineered drilling and production equipment R&D capabilities provide technically differentiated products Strong balance sheet Historically superior margins to peer group Experienced management team
Appendix
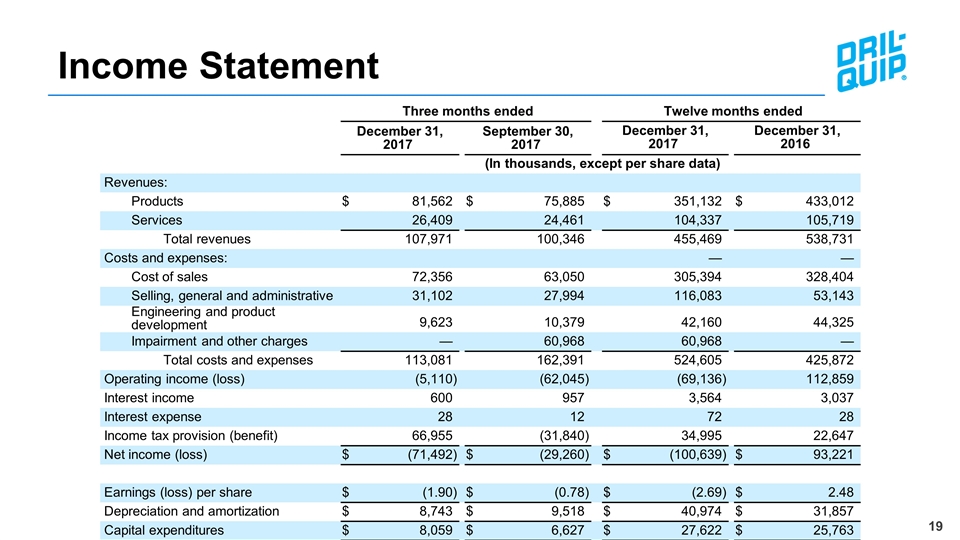
Income Statement Three months ended Three months ended Twelve months ended Twelve months ended December 31, 2017 December 31, 2017 September 30, 2017 September 30, 2017 December 31, 2017 December 31, 2017 December 31, 2016 December 31, 2016 (In thousands, except per share data) (In thousands, except per share data) Revenues: Products $ 81,562 $ 75,885 $ 351,132 $ 433,012 Services 26,409 24,461 104,337 105,719 Total revenues 107,971 100,346 455,469 538,731 Costs and expenses: — — Cost of sales 72,356 63,050 305,394 328,404 Selling, general and administrative 31,102 27,994 116,083 53,143 Engineering and product development 9,623 10,379 42,160 44,325 Impairment and other charges — 60,968 60,968 — Total costs and expenses 113,081 162,391 524,605 425,872 Operating income (loss) (5,110 ) (62,045 ) (69,136 ) 112,859 Interest income 600 957 3,564 3,037 Interest expense 28 12 72 28 Income tax provision (benefit) 66,955 (31,840 ) 34,995 22,647 Net income (loss) $ (71,492 ) $ (29,260 ) $ (100,639 ) $ 93,221 Earnings (loss) per share $ (1.90 ) $ (0.78 ) $ (2.69 ) $ 2.48 Depreciation and amortization $ 8,743 $ 9,518 $ 40,974 $ 31,857 Capital expenditures $ 8,059 $ 6,627 $ 27,622 $ 25,763
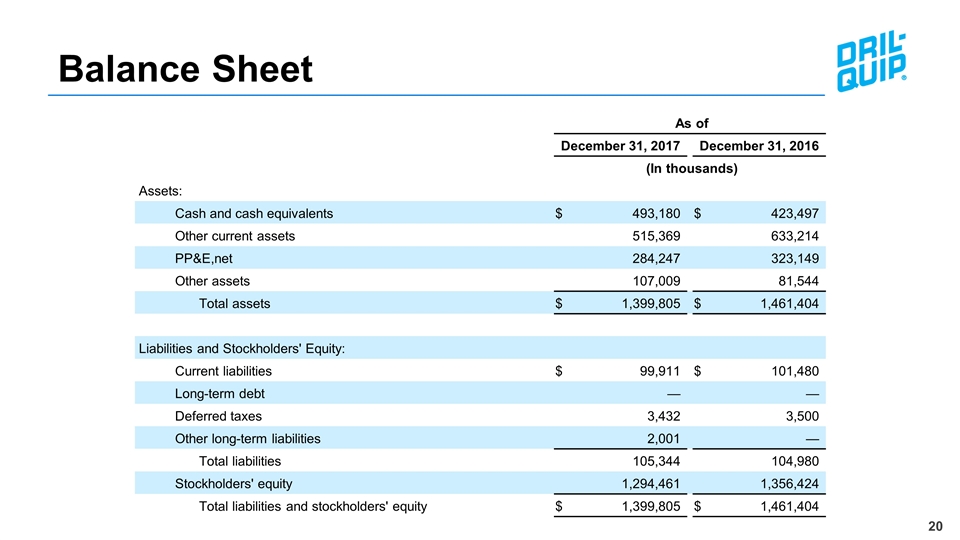
Balance Sheet As of As of December 31, 2017 December 31, 2017 December 31, 2016 December 31, 2016 (In thousands) (In thousands) Assets: Cash and cash equivalents $ 493,180 $ 423,497 Other current assets 515,369 633,214 PP&E,net 284,247 323,149 Other assets 107,009 81,544 Total assets $ 1,399,805 $ 1,461,404 Liabilities and Stockholders' Equity: Current liabilities $ 99,911 $ 101,480 Long-term debt — — Deferred taxes 3,432 3,500 Other long-term liabilities 2,001 — Total liabilities 105,344 104,980 Stockholders' equity 1,294,461 1,356,424 Total liabilities and stockholders' equity $ 1,399,805 $ 1,461,404
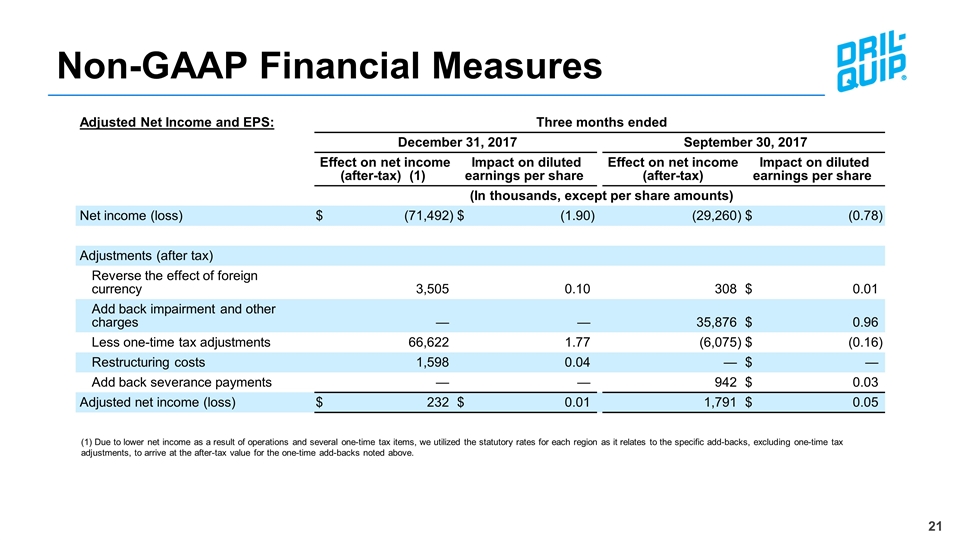
Non-GAAP Financial Measures Adjusted Net Income and EPS: Three months ended Three months ended December 31, 2017 December 31, 2017 September 30, 2017 Effect on net income (after-tax) (1) Effect on net income (after-tax) (1) Impact on diluted earnings per share Impact on diluted earnings per share Effect on net income (after-tax) Impact on diluted earnings per share Impact on diluted earnings per share (In thousands, except per share amounts) (In thousands, except per share amounts) Net income (loss) $ (71,492 ) $ (1.90 ) (29,260 ) $ (0.78 ) Adjustments (after tax) Reverse the effect of foreign currency 3,505 0.10 308 $ 0.01 Add back impairment and other charges — — 35,876 $ 0.96 Less one-time tax adjustments 66,622 1.77 (6,075 ) $ (0.16 ) Restructuring costs 1,598 0.04 — $ — Add back severance payments — — 942 $ 0.03 Adjusted net income (loss) $ 232 $ 0.01 1,791 $ 0.05 (1) Due to lower net income as a result of operations and several one-time tax items, we utilized the statutory rates for each region as it relates to the specific add-backs, excluding one-time tax adjustments, to arrive at the after-tax value for the one-time add-backs noted above.
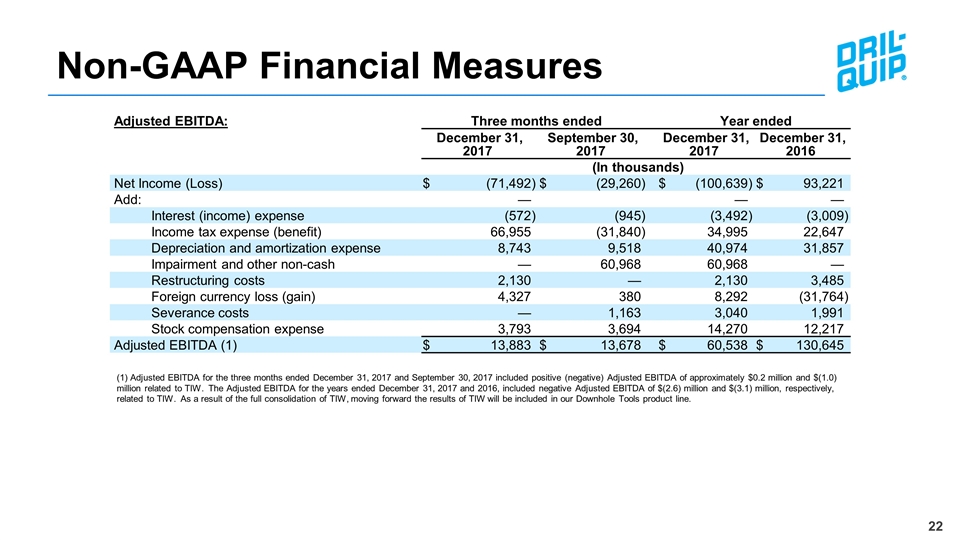
Non-GAAP Financial Measures Adjusted EBITDA: Three months ended Three months ended Year ended Year ended December 31, 2017 December 31, 2017 September 30, 2017 September 30, 2017 December 31, 2017 December 31, 2017 December 31, 2016 December 31, 2016 (In thousands) (In thousands) Net Income (Loss) $ (71,492 ) $ (29,260 ) $ (100,639 ) $ 93,221 Add: — — — Interest (income) expense (572 ) (945 ) (3,492 ) (3,009 ) Income tax expense (benefit) 66,955 (31,840 ) 34,995 22,647 Depreciation and amortization expense 8,743 9,518 40,974 31,857 Impairment and other non-cash — 60,968 60,968 — Restructuring costs 2,130 — 2,130 3,485 Foreign currency loss (gain) 4,327 380 8,292 (31,764 ) Severance costs — 1,163 3,040 1,991 Stock compensation expense 3,793 3,694 14,270 12,217 Adjusted EBITDA (1) $ 13,883 $ 13,678 $ 60,538 $ 130,645 (1) Adjusted EBITDA for the three months ended December 31, 2017 and September 30, 2017 included positive (negative) Adjusted EBITDA of approximately $0.2 million and $(1.0) million related to TIW. The Adjusted EBITDA for the years ended December 31, 2017 and 2016, included negative Adjusted EBITDA of $(2.6) million and $(3.1) million, respectively, related to TIW. As a result of the full consolidation of TIW, moving forward the results of TIW will be included in our Downhole Tools product line.
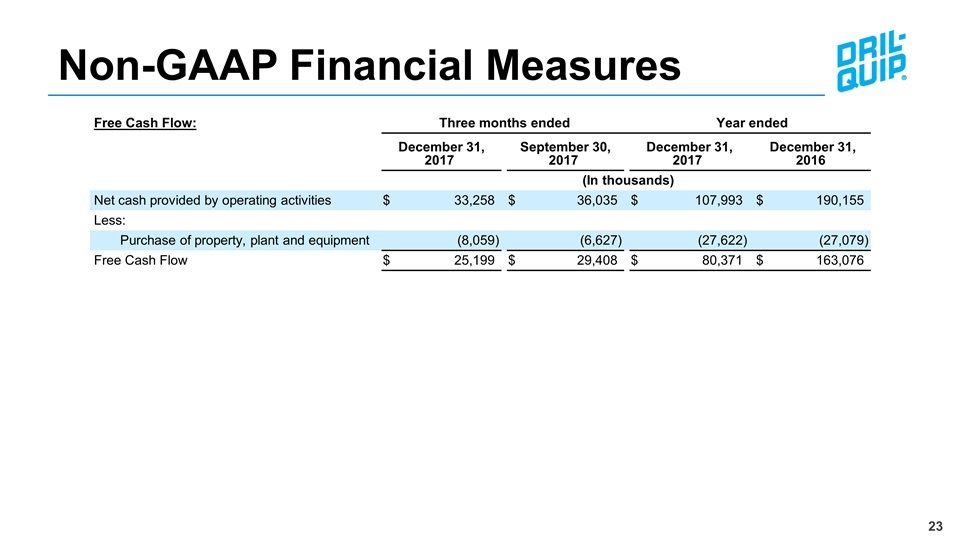
Non-GAAP Financial Measures Free Cash Flow: Three months ended Three months ended Year ended Year ended December 31, 2017 December 31, 2017 September 30, 2017 September 30, 2017 December 31, 2017 December 31, 2017 December 31, 2016 December 31, 2016 (In thousands) (In thousands) Net cash provided by operating activities $ 33,258 $ 36,035 $ 107,993 $ 190,155 Less: Purchase of property, plant and equipment (8,059 ) (6,627 ) (27,622 ) (27,079 ) Free Cash Flow $ 25,199 $ 29,408 $ 80,371 $ 163,076

Capital Expenditures Annual Maintenance Capex ~$15 - $20 Million
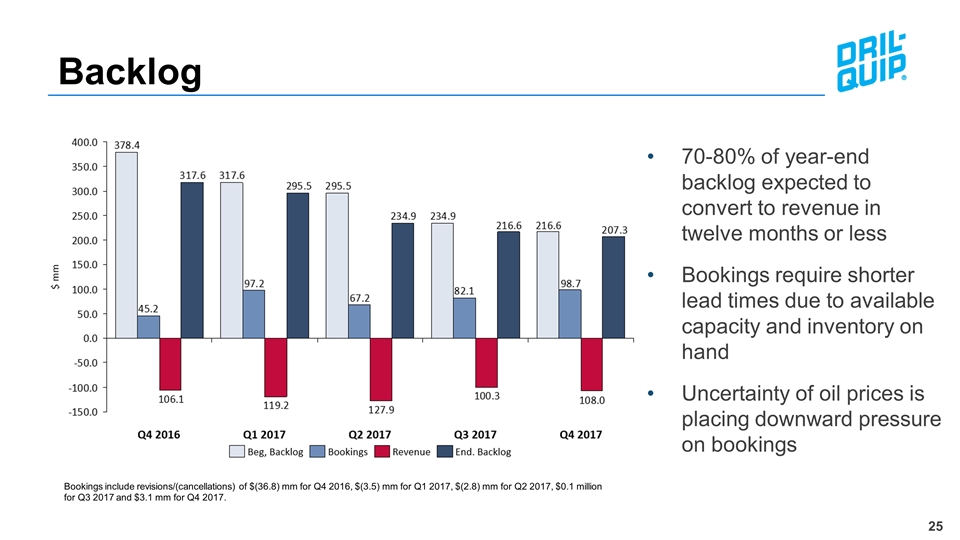
Backlog Bookings include revisions/(cancellations) of $(36.8) mm for Q4 2016, $(3.5) mm for Q1 2017, $(2.8) mm for Q2 2017, $0.1 million for Q3 2017 and $3.1 mm for Q4 2017. 70-80% of year-end backlog expected to convert to revenue in twelve months or less Bookings require shorter lead times due to available capacity and inventory on hand Uncertainty of oil prices is placing downward pressure on bookings
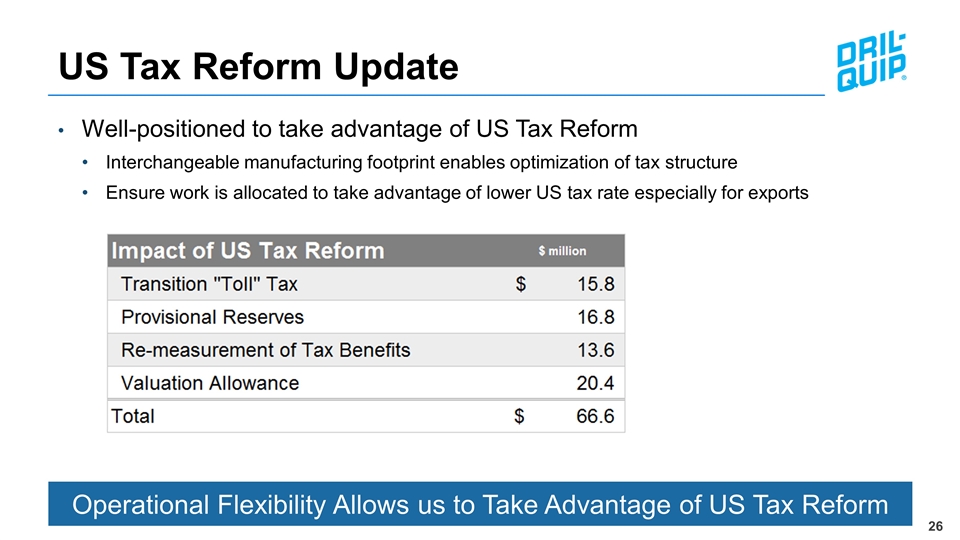
US Tax Reform Update Well-positioned to take advantage of US Tax Reform Interchangeable manufacturing footprint enables optimization of tax structure Ensure work is allocated to take advantage of lower US tax rate especially for exports Operational Flexibility Allows us to Take Advantage of US Tax Reform


