4th Quarter 2018 Supplemental Earnings Information dril-quip.com | NYSE: DRQ Exhibit 99.2
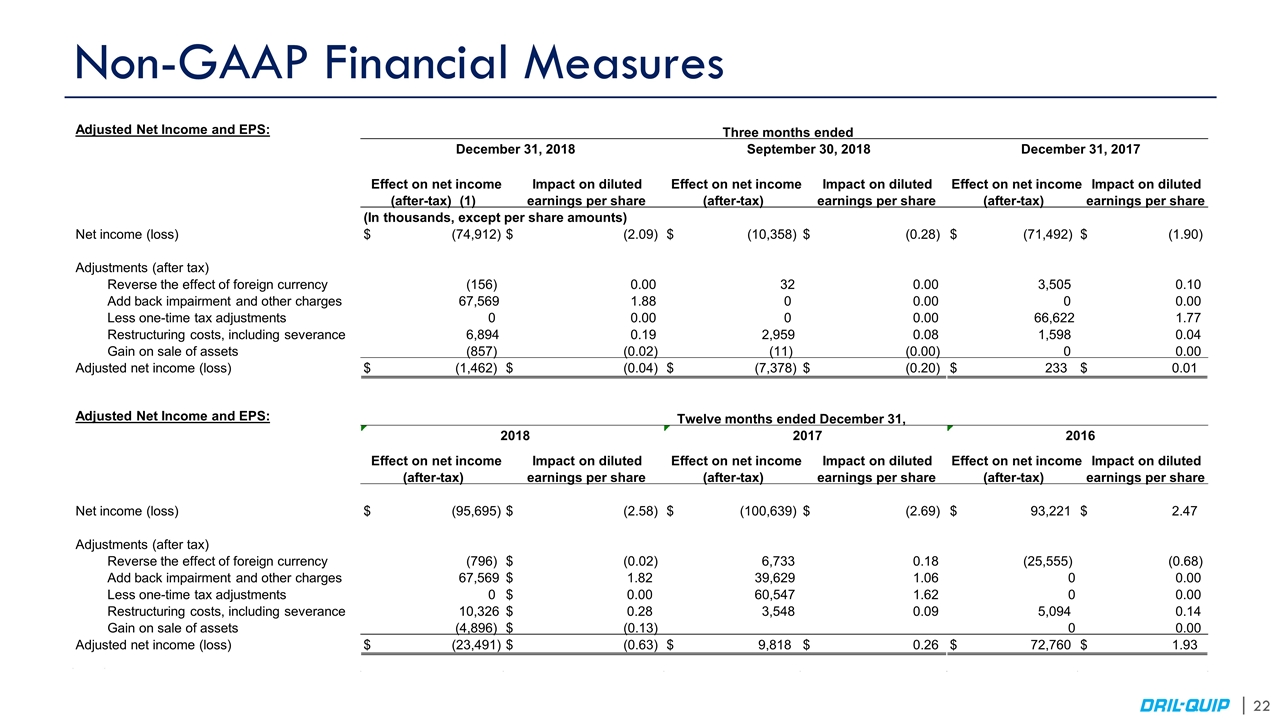
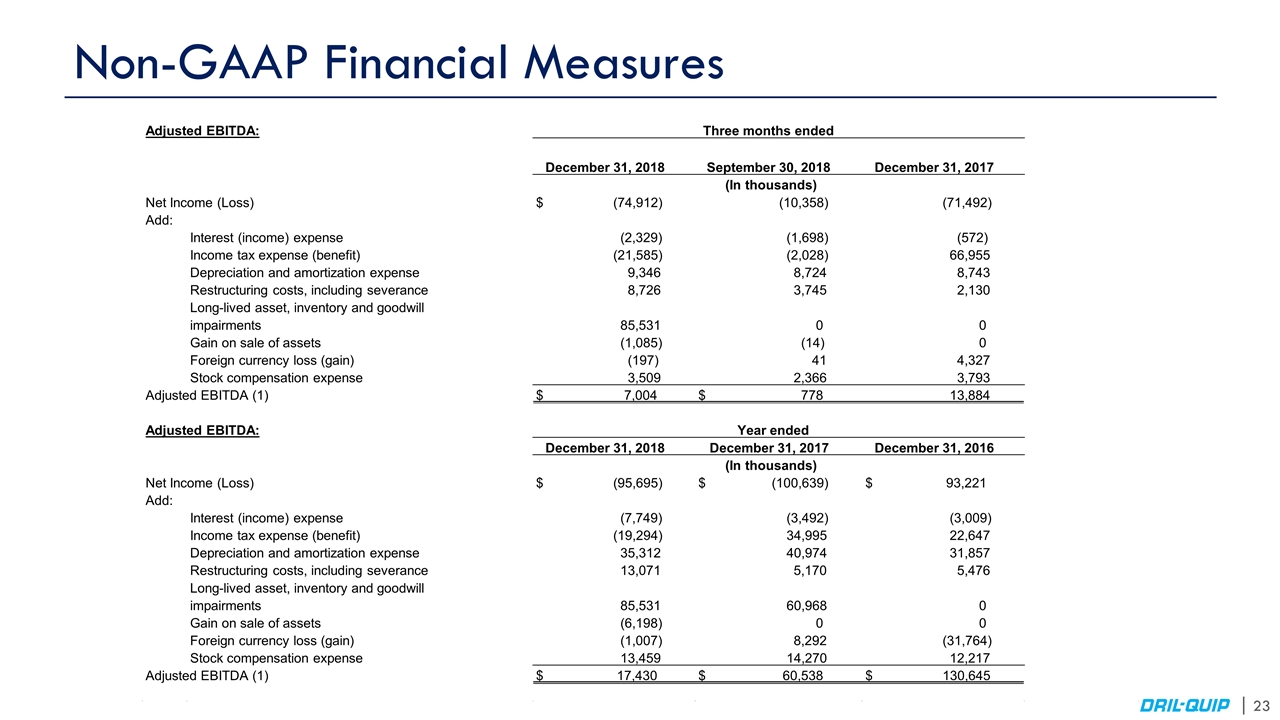
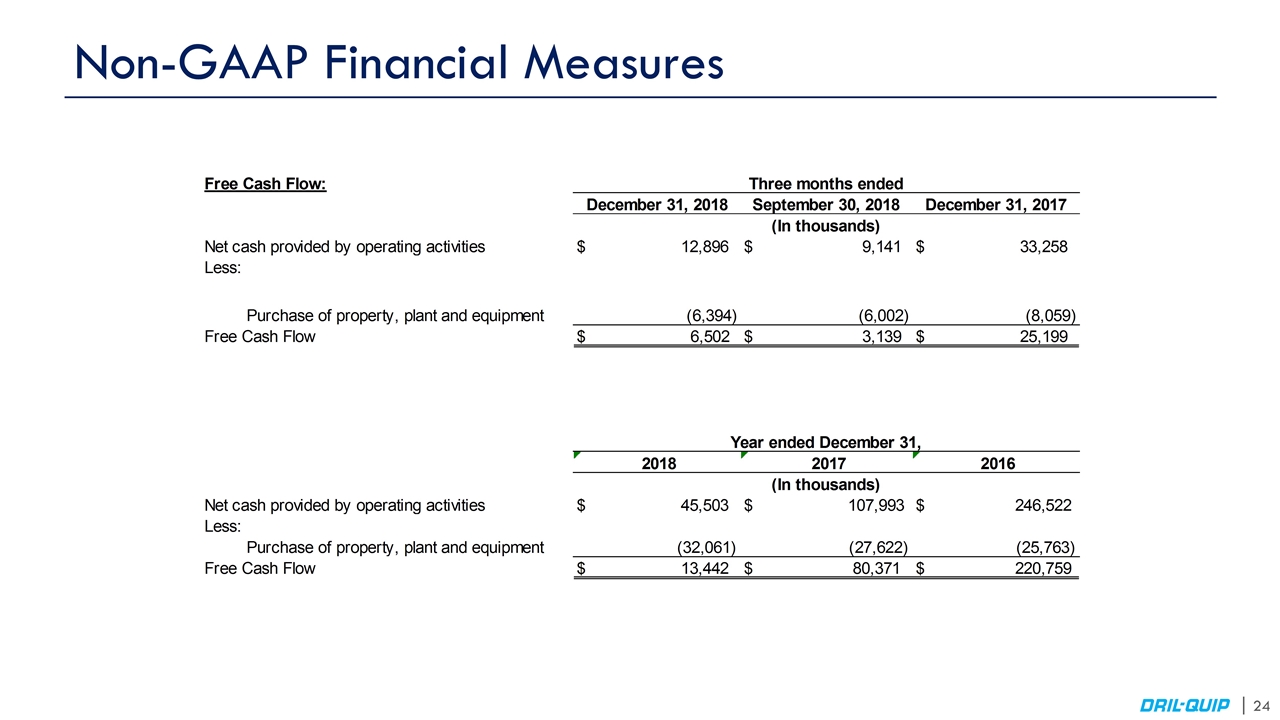
Cautionary Statement Forward-Looking Statements The information furnished in this presentation contains “forward-looking statements” within the meaning of the federal securities laws. Forward-looking statements include goals, projections, estimates, expectations, market outlook, forecasts, plans and objectives, including revenue and new product revenue and other projections, bidding and service activity, acquisition opportunities, forecasted supply and demand, liquidity, cost savings, and share repurchases and are based on assumptions, estimates and risk analysis made by management of Dril-Quip in light of its experience and perception of historical trends, current conditions, expected future developments and other factors. No assurance can be given that actual future results will not differ materially from those contained in the forward-looking statements in this presentation. Although Dril-Quip believes that all such statements contained in this presentation are based on reasonable assumptions, there are numerous variables of an unpredictable nature or outside of Dril-Quip’s control that could affect Dril-Quip’s future results and the value of its shares. Each investor must assess and bear the risk of uncertainty inherent in the forward-looking statements contained in this presentation. Please refer to Dril-Quip’s filings with the SEC for additional discussion of risks and uncertainties that may affect Dril-Quip’s actual future results. Dril-Quip undertakes no obligation to update the forward-looking statements contained herein. Use of Non-GAAP Financial Measures Adjusted Net Income, Adjusted Diluted EPS, Adjusted EBITDA and Free Cash Flow are non-GAAP measures. Adjusted Net Income and Adjusted Diluted EPS are defined as net income (loss) and earnings per share, respectively, excluding the impact of foreign currency gains or losses as well as other significant non-cash items and certain charges and credits. Adjusted EBITDA is defined as net income excluding income taxes, interest income and expense, depreciation and amortization expense, non-cash gains or losses from foreign currency exchange rate changes as well as other significant non-cash items and items that can be considered non-recurring. Free Cash Flow is defined as net cash provided by operating activities less net cash used in the purchase of property, plant and equipment. We believe that these non-GAAP measures enable us to evaluate and compare more effectively the results of our operations period over period and identify operating trends by removing the effect of our capital structure from our operating structure and certain other items including those that affect the comparability of operating results. In addition, we believe that these measures are supplemental measurement tools used by analysts and investors to help evaluate overall operating performance, ability to pursue and service possible debt opportunities and make future capital expenditures. These measures do not represent funds available for our discretionary use and are not intended to represent or to be used as a substitute for net income or net cash provided by operating activities, as measured under U.S. generally accepted accounting principles. Non-GAAP financial information supplements should be read together with, and are not an alternative or substitute for, our financial results reported in accordance with GAAP. Because non-GAAP financial information is not standardized, it may not be possible to compare these financial measures with other companies’ non-GAAP financial measures. Reconciliations of these non-GAAP measures to the most directly comparable GAAP measure can be found on slides 22, 23 and 24.
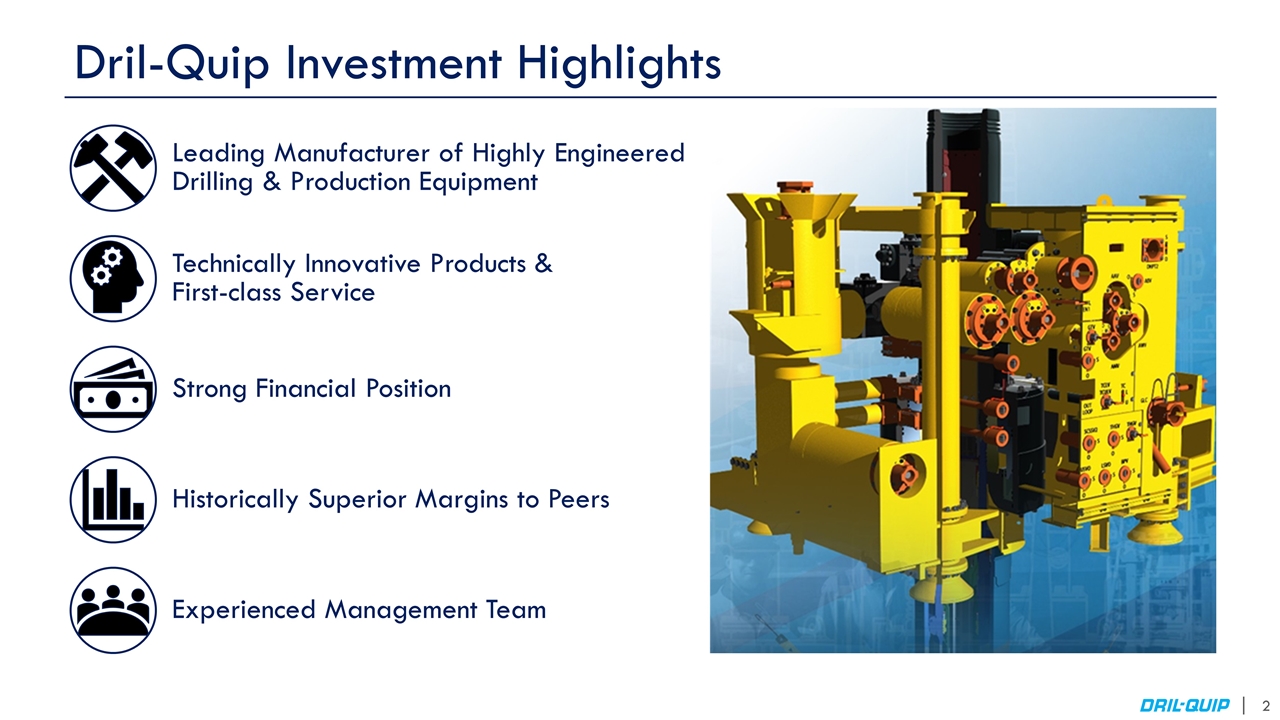
Dril-Quip Investment Highlights Leading Manufacturer of Highly Engineered Drilling & Production Equipment Technically Innovative Products & First-class Service Strong Financial Position Historically Superior Margins to Peers Experienced Management Team
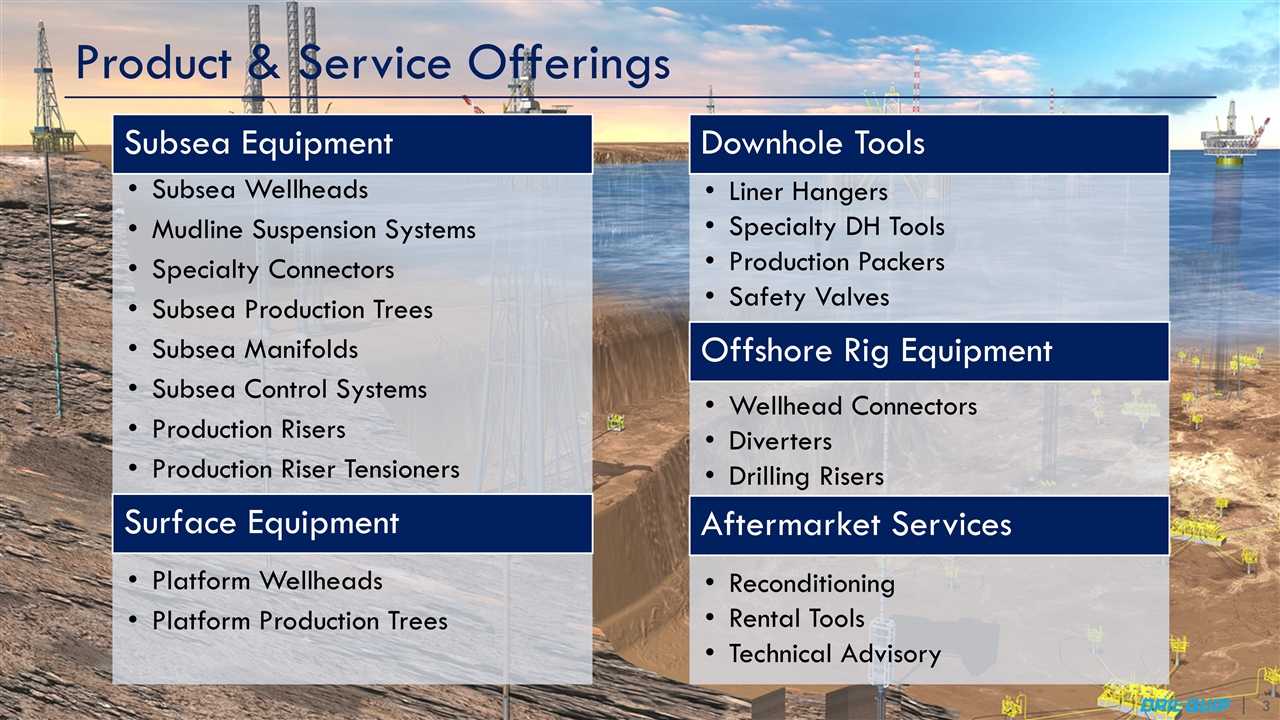
Product & Service Offerings Subsea Equipment Subsea Wellheads Mudline Suspension Systems Surface Equipment Specialty Connectors Subsea Production Trees Subsea Manifolds Subsea Control Systems Production Risers Production Riser Tensioners Platform Wellheads Platform Production Trees Downhole Tools Liner Hangers Specialty DH Tools Offshore Rig Equipment Wellhead Connectors Diverters Aftermarket Services Production Packers Safety Valves Drilling Risers Reconditioning Rental Tools Technical Advisory
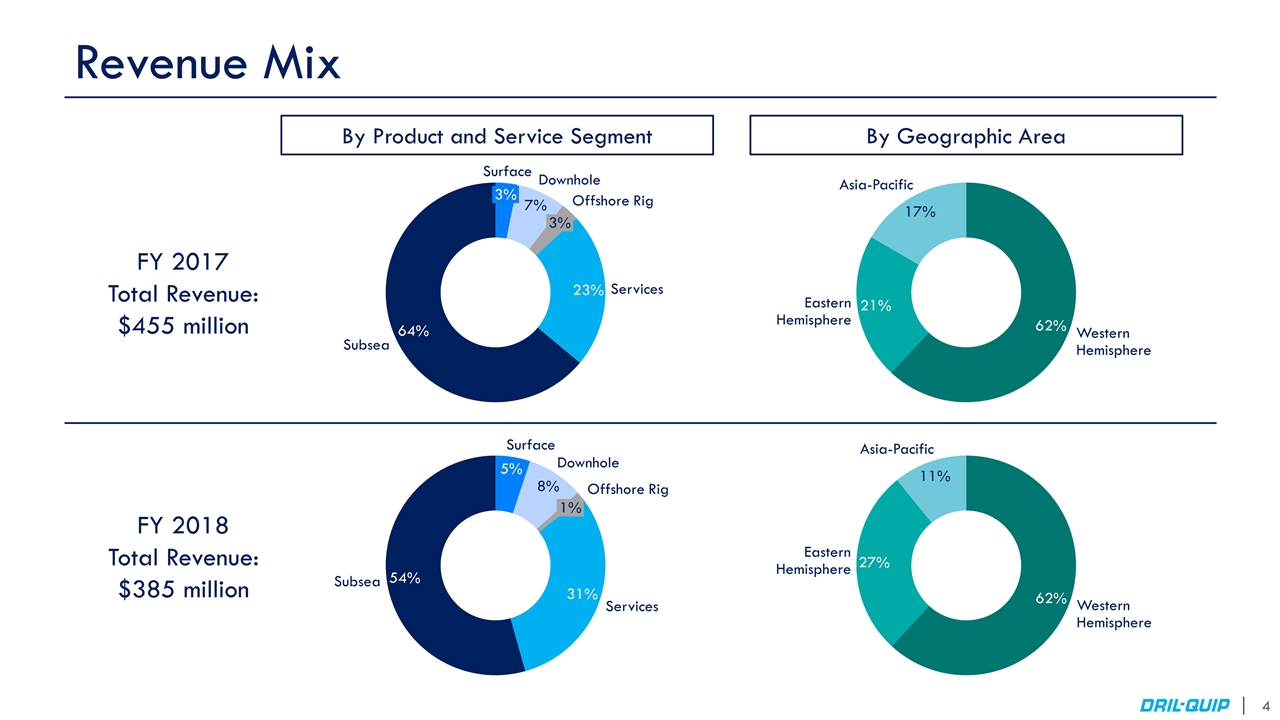
Revenue Mix By Product and Service Segment By Geographic Area FY 2017 Total Revenue: $455 million FY 2018 Total Revenue: $385 million
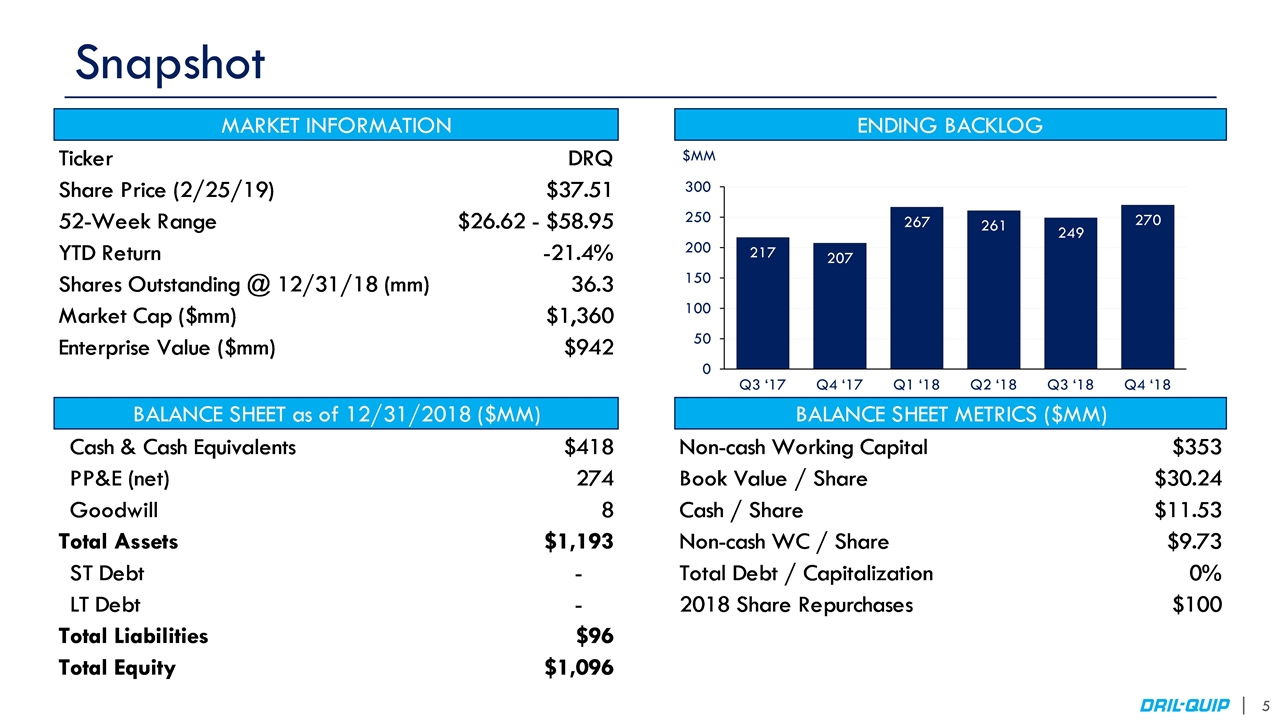
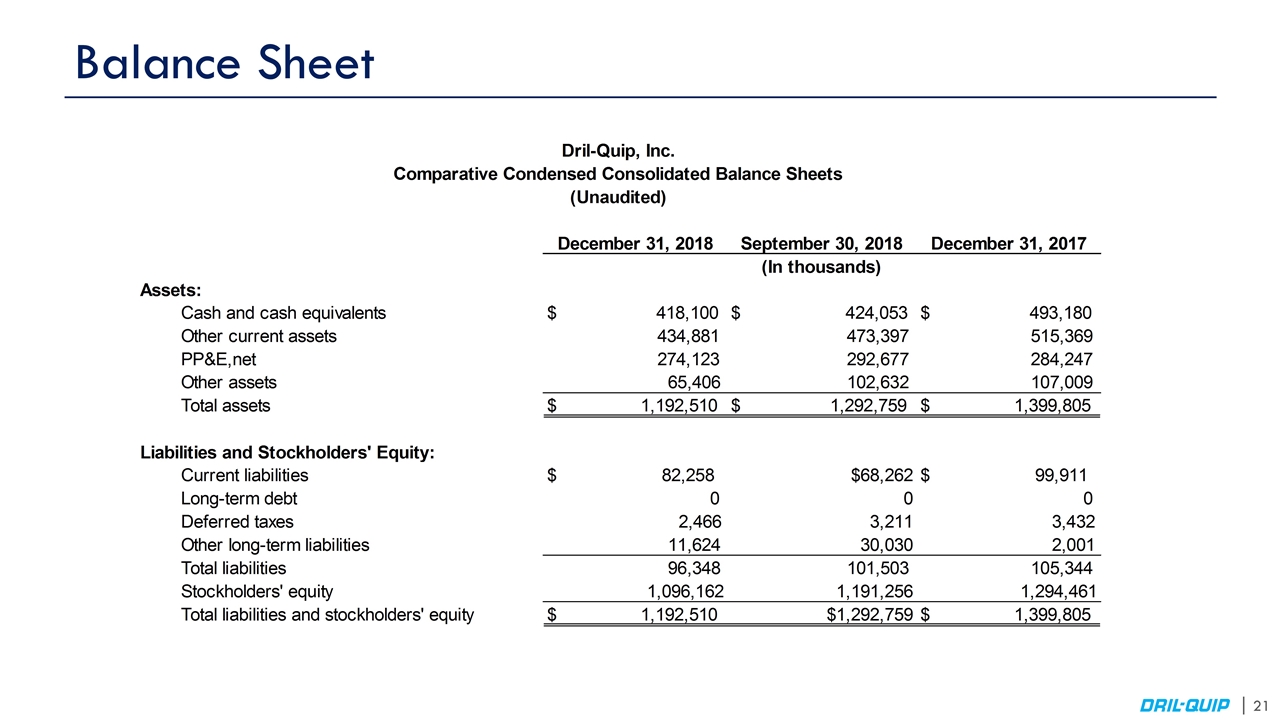
Snapshot Q3 ‘17 $MM Q4 ‘17 Q1 ‘18 Q2 ‘18 Q4 ‘18 Q3 ‘18 MARKET INFORMATION ENDING BACKLOG Ticker DRQ Share Price (2/25/19) $37.51 52-Week Range $26.62 - $58.95 YTD Return -0.2136268343815515 Shares Outstanding @ 12/31/18 (mm) 36.25 Market Cap ($mm) $1,359.7375 Enterprise Value ($mm) $941.63749999999993 BALANCE SHEET as of 12/31/2018 ($MM) BALANCE SHEET METRICS ($MM) Cash & Cash Equivalents $418.1 Non-cash Working Capital $352.62299999999993 PP&E (net) 274 Book Value / Share $30.240000000000002 Goodwill 7.7 Cash / Share $11.533793103448277 Total Assets $1,193 Non-cash WC / Share $9.727531034482757 ST Debt 0 Total Debt / Capitalization 0 LT Debt 0 2018 Share Repurchases $100 Total Liabilities $96.3 Total Equity $1,096.2
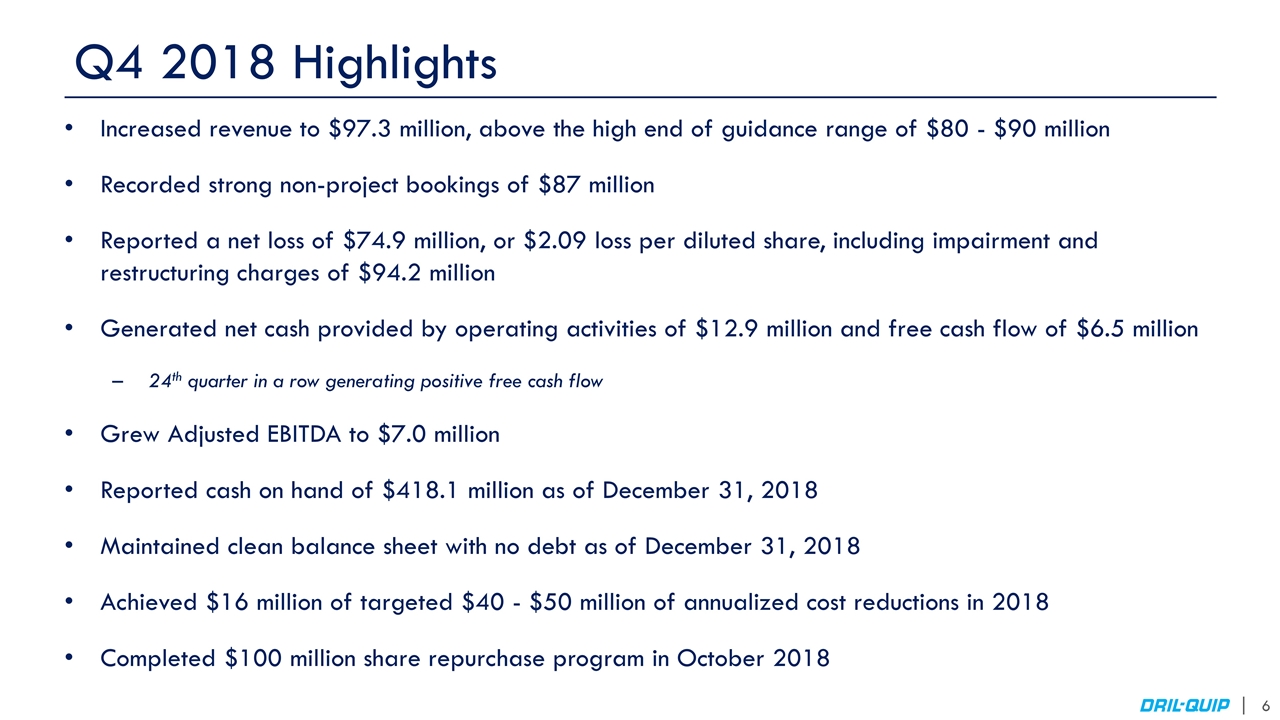
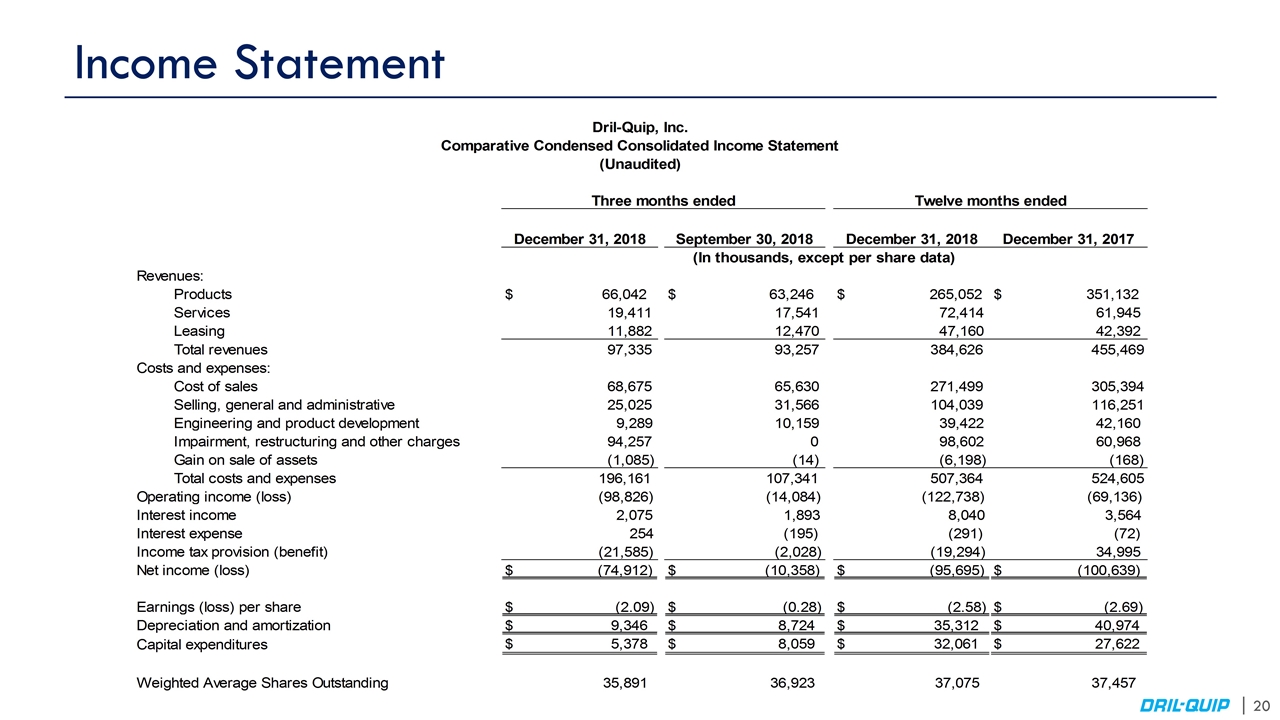
Q4 2018 Highlights Increased revenue to $97.3 million, above the high end of guidance range of $80 - $90 million Recorded strong non-project bookings of $87 million Reported a net loss of $74.9 million, or $2.09 loss per diluted share, including impairment and restructuring charges of $94.2 million Generated net cash provided by operating activities of $12.9 million and free cash flow of $6.5 million 24th quarter in a row generating positive free cash flow Grew Adjusted EBITDA to $7.0 million Reported cash on hand of $418.1 million as of December 31, 2018 Maintained clean balance sheet with no debt as of December 31, 2018 Achieved $16 million of targeted $40 - $50 million of annualized cost reductions in 2018 Completed $100 million share repurchase program in October 2018
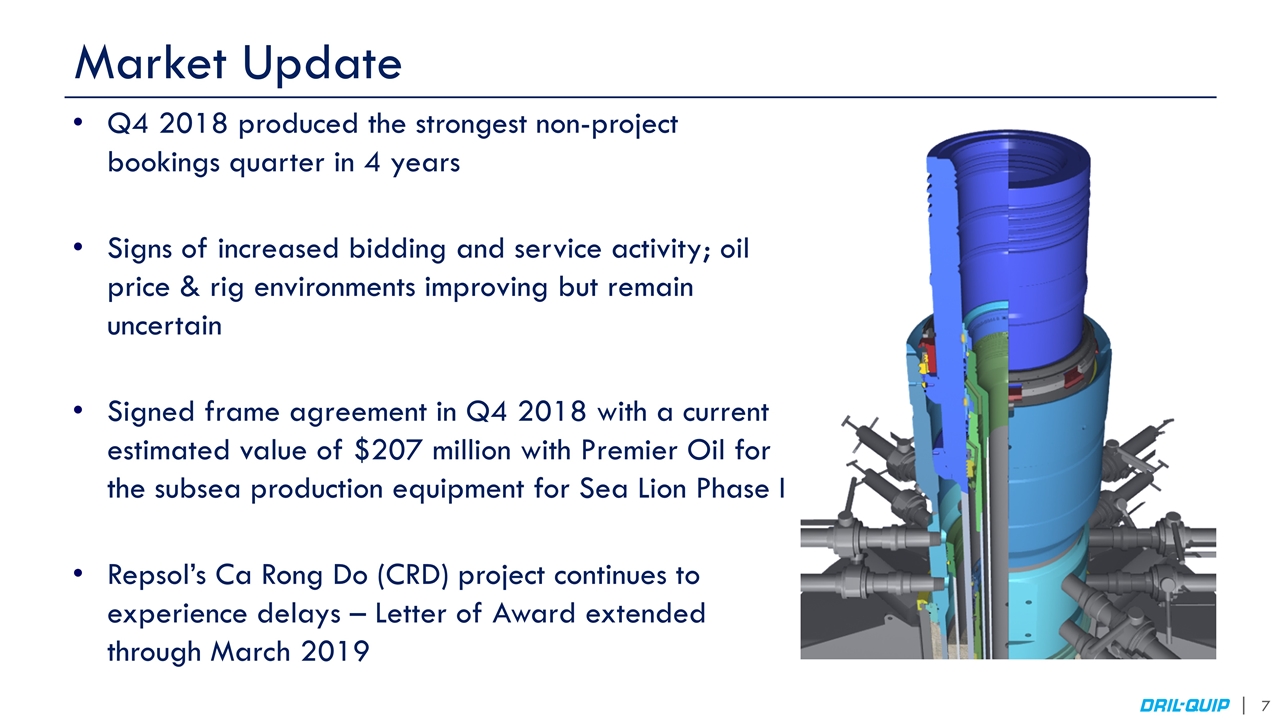
Market Update Q4 2018 produced the strongest non-project bookings quarter in 4 years Signs of increased bidding and service activity; oil price & rig environments improving but remain uncertain Signed frame agreement in Q4 2018 with a current estimated value of $207 million with Premier Oil for the subsea production equipment for Sea Lion Phase I Repsol’s Ca Rong Do (CRD) project continues to experience delays – Letter of Award extended through March 2019
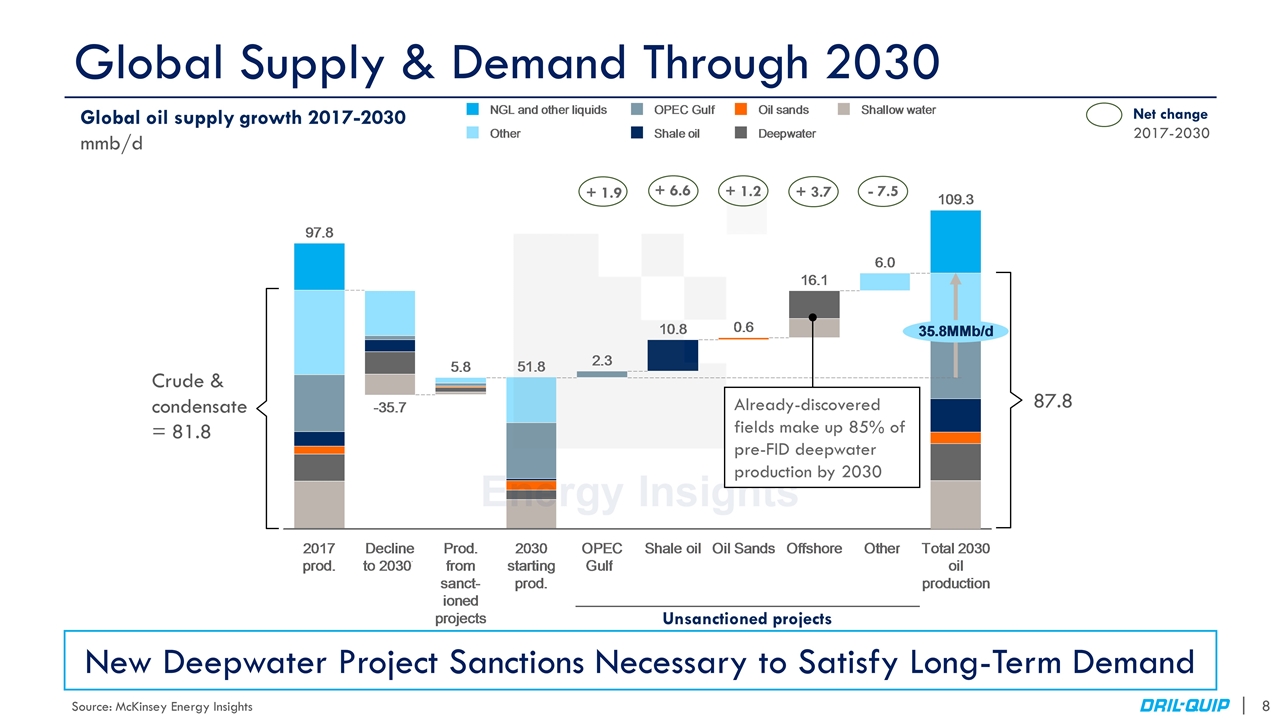
+ 6.6 + 1.9 Global Supply & Demand Through 2030 Global oil supply growth 2017-2030 mmb/d Crude & condensate = 81.8 87.8 Net change 2017-2030 + 1.2 + 3.7 - 7.5 Already-discovered fields make up 85% of pre-FID deepwater production by 2030 New Deepwater Project Sanctions Necessary to Satisfy Long-Term Demand Unsanctioned projects Source: McKinsey Energy Insights
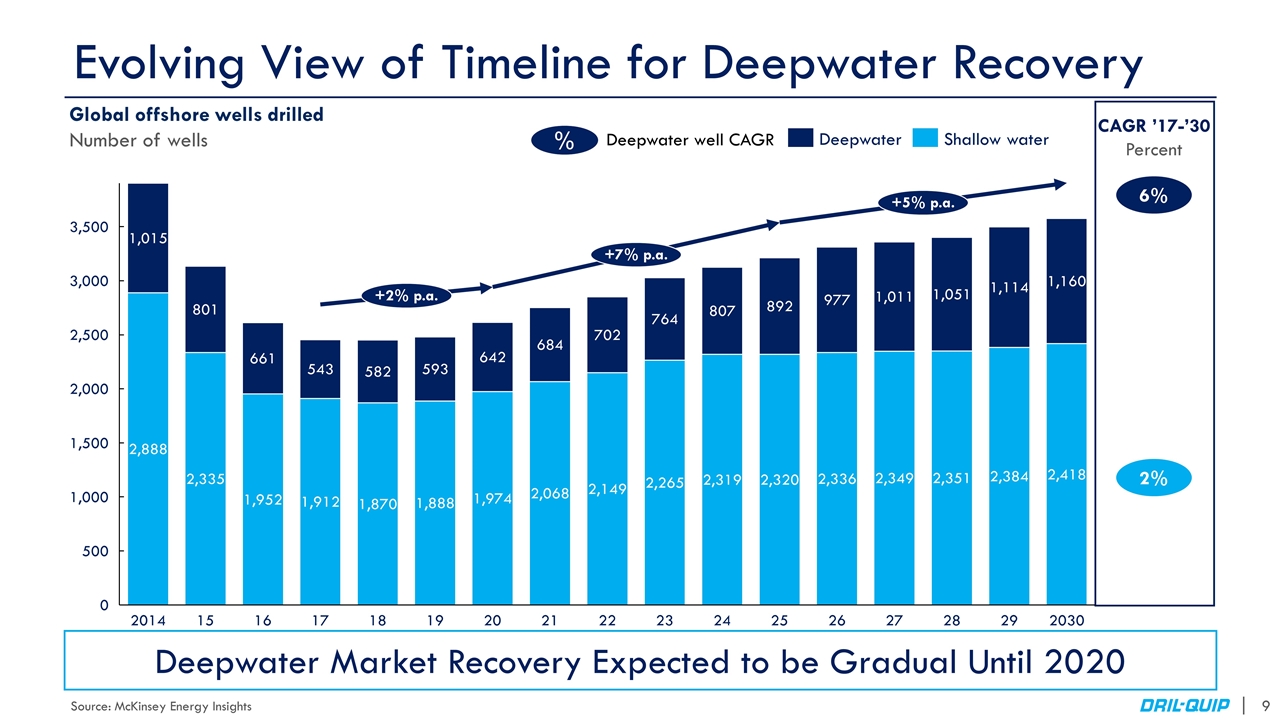
Evolving View of Timeline for Deepwater Recovery Global offshore wells drilled Number of wells % Deepwater well CAGR 2% CAGR ’17-’30 Percent 6% +2% p.a. +7% p.a. +5% p.a. Deepwater Market Recovery Expected to be Gradual Until 2020 Source: McKinsey Energy Insights
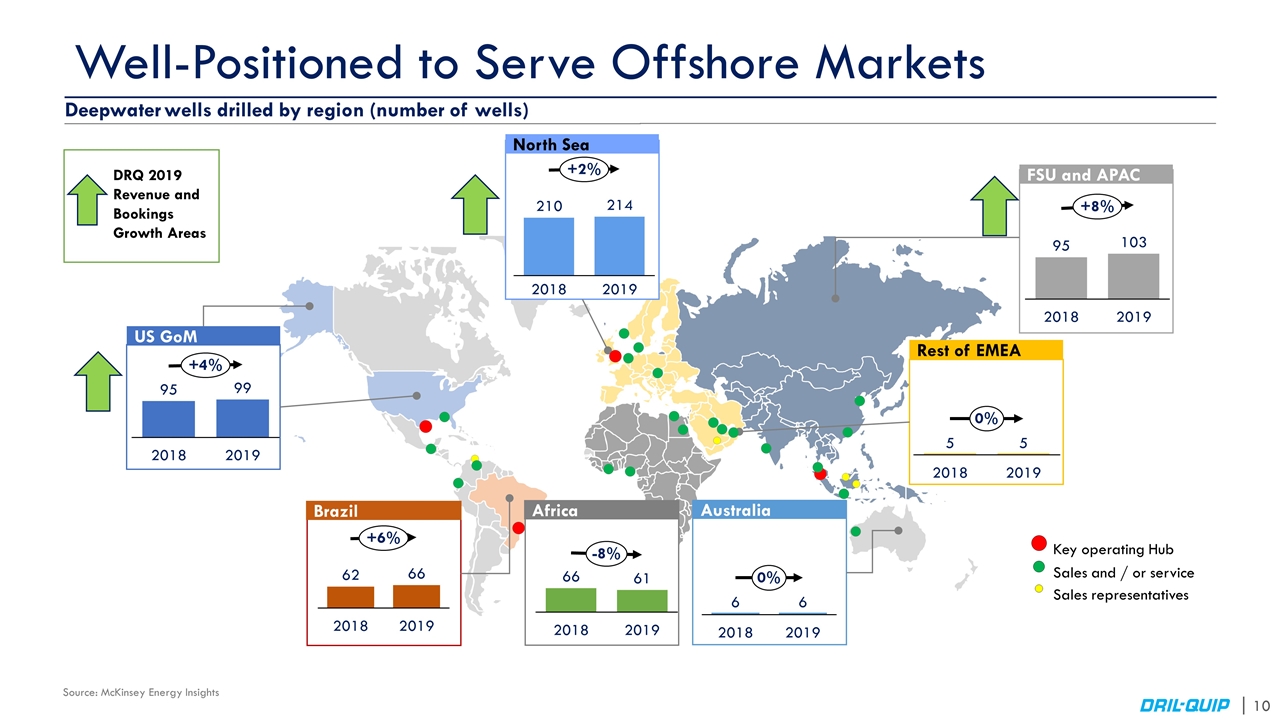
Well-Positioned to Serve Offshore Markets US GoM North Sea FSU and APAC Rest of EMEA Africa Brazil Australia Source: McKinsey Energy Insights Key operating Hub Sales and / or service Sales representatives Deepwater wells drilled by region (number of wells) DRQ 2019 Revenue and Bookings Growth Areas
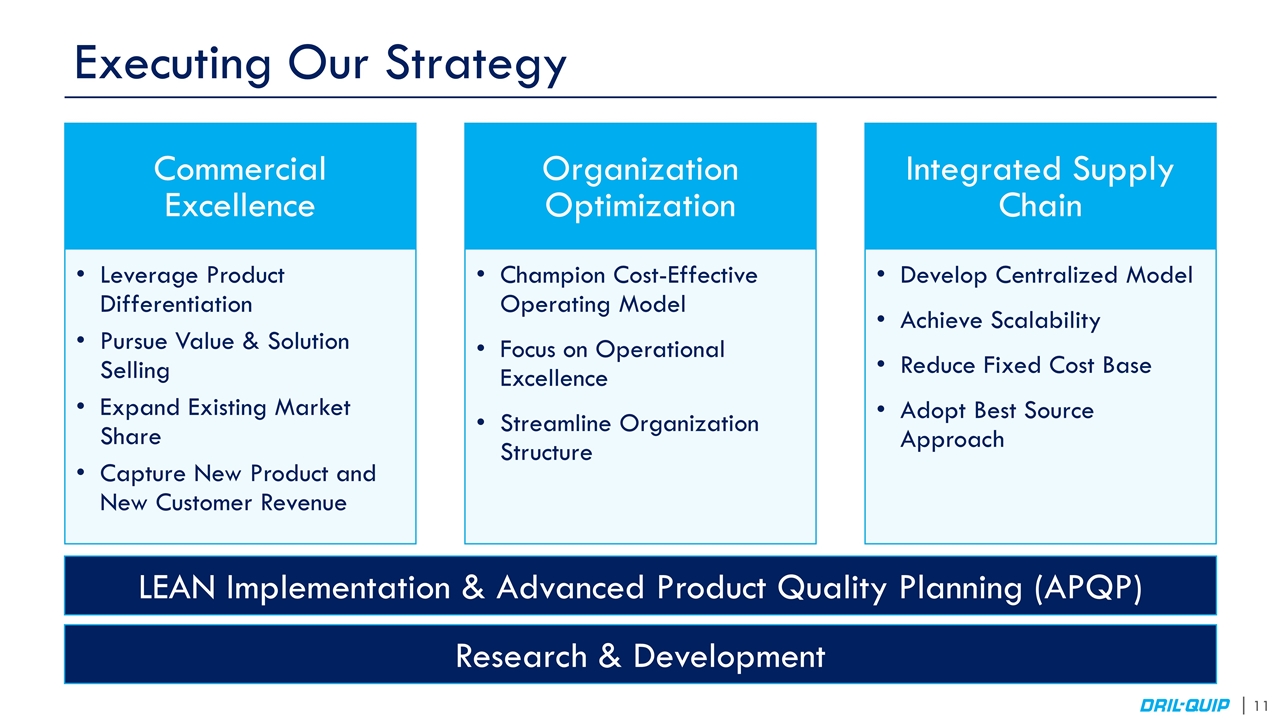
Executing Our Strategy Research & Development LEAN Implementation & Advanced Product Quality Planning (APQP) Commercial Excellence Integrated Supply Chain Streamline Organization Structure Champion Cost-Effective Operating Model Achieve Scalability Adopt Best Source Approach Expand Existing Market Share Capture New Product and New Customer Revenue Organization Optimization Leverage Product Differentiation Reduce Fixed Cost Base Develop Centralized Model Pursue Value & Solution Selling Focus on Operational Excellence
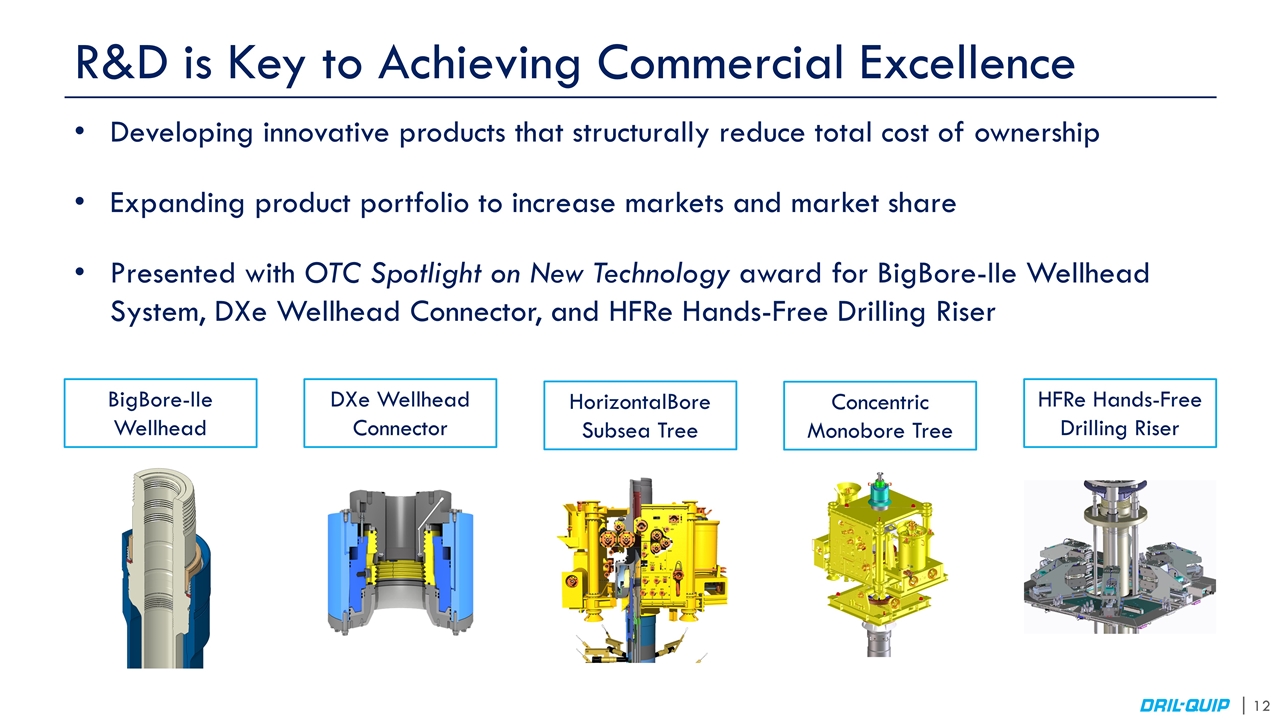
R&D is Key to Achieving Commercial Excellence Developing innovative products that structurally reduce total cost of ownership Expanding product portfolio to increase markets and market share Presented with OTC Spotlight on New Technology award for BigBore-IIe Wellhead System, DXe Wellhead Connector, and HFRe Hands-Free Drilling Riser BigBore-IIe Wellhead DXe Wellhead Connector HorizontalBore Subsea Tree HFRe Hands-Free Drilling Riser Concentric Monobore Tree
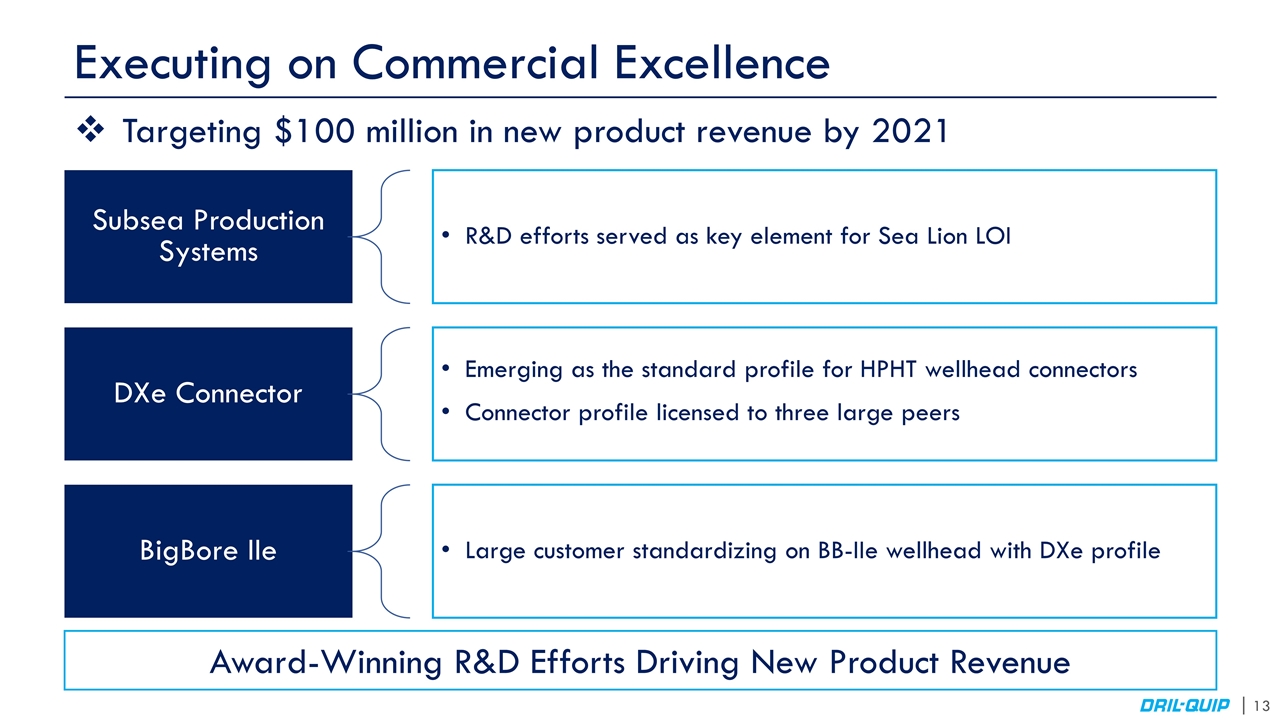
Executing on Commercial Excellence Targeting $100 million in new product revenue by 2021 Award-Winning R&D Efforts Driving New Product Revenue Subsea Production Systems DXe Connector Large customer standardizing on BB- IIe wellhead with DXe profile R&D efforts served as key element for Sea Lion LOI Emerging as the standard profile for HPHT wellhead connectors BigBore IIe Connector profile licensed to three large peers
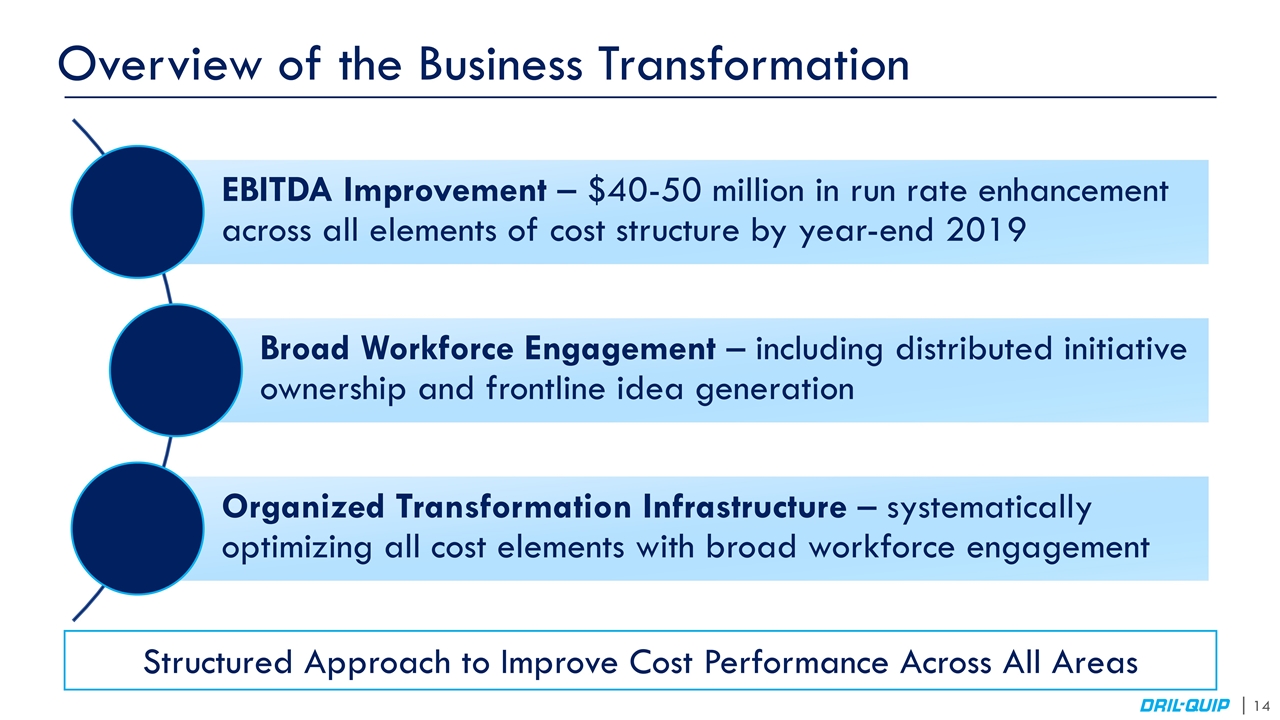
Overview of the Business Transformation Structured Approach to Improve Cost Performance Across All Areas EBITDA Improvement – $40-50 million in run rate enhancement across all elements of cost structure by year-end 2019 Broad Workforce Engagement – including distributed initiative ownership and frontline idea generation Organized Transformation Infrastructure – systematically optimizing all cost elements with broad workforce engagement
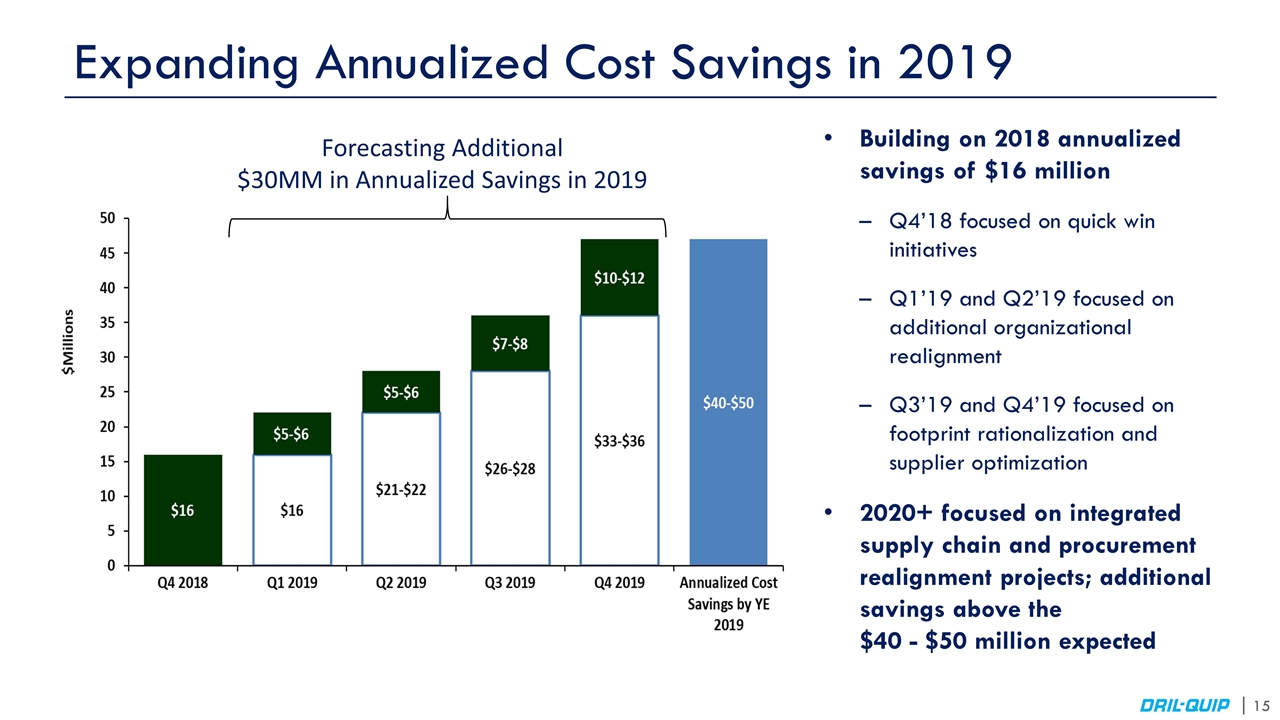
Expanding Annualized Cost Savings in 2019 Building on 2018 annualized savings of $16 million Q4’18 focused on quick win initiatives Q1’19 and Q2’19 focused on additional organizational realignment Q3’19 and Q4’19 focused on footprint rationalization and supplier optimization 2020+ focused on integrated supply chain and procurement realignment projects; additional savings above the $40 - $50 million expected Forecasting Additional $30MM in Annualized Savings in 2019
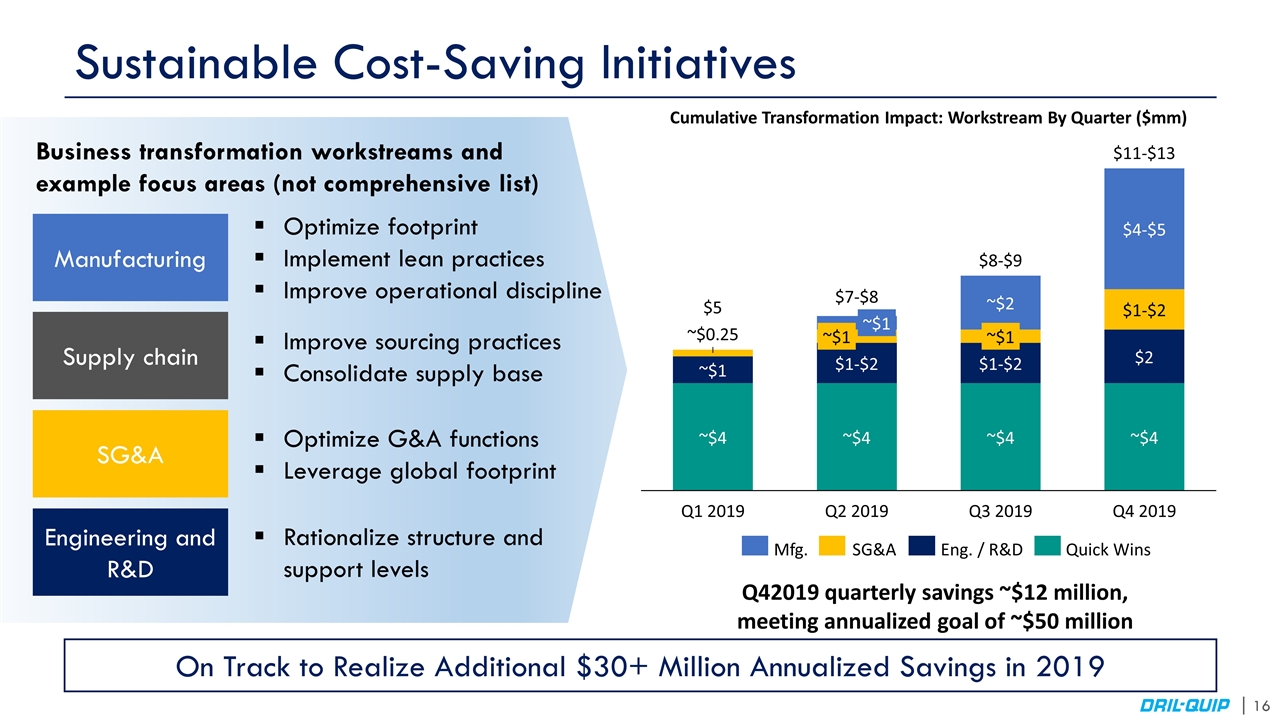
Sustainable Cost-Saving Initiatives Manufacturing Supply chain SG&A Engineering and R&D Optimize footprint Implement lean practices Improve operational discipline Improve sourcing practices Consolidate supply base Optimize G&A functions Leverage global footprint Rationalize structure and support levels Business transformation workstreams and example focus areas (not comprehensive list) On Track to Realize Additional $30+ Million Annualized Savings in 2019 Q42019 quarterly savings ~$12 million, meeting annualized goal of ~$50 million ~$4 $1-$2 $4-$5 ~$4 $1-$ $ $-$8 $-$9 $11-$13 $1-$2 ~$1 ~$0.25 ~$1 ~$1 ~$1 ~$4 $2 ~$4 ~$2 Cumulative Transformation Impact: Workstream By Quarter ($mm)
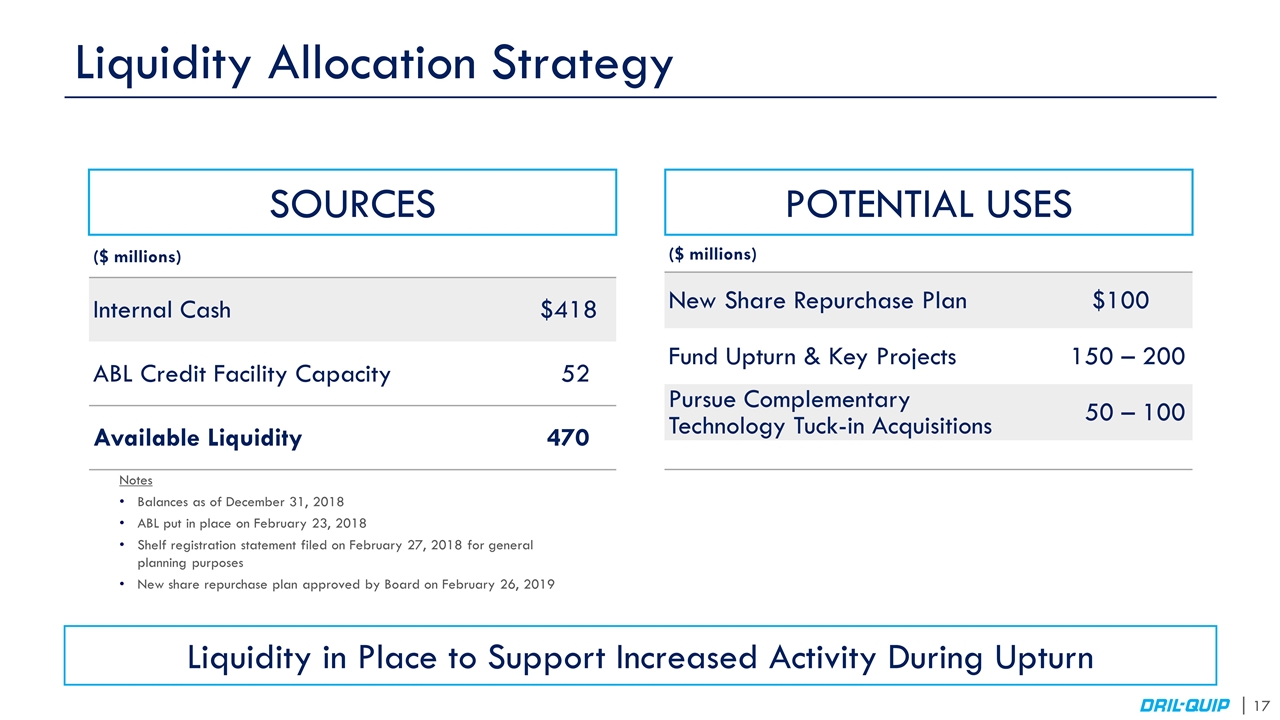
Liquidity Allocation Strategy ($ millions) Internal Cash $418 ABL Credit Facility Capacity 52 Available Liquidity 470 SOURCES Notes Balances as of December 31, 2018 ABL put in place on February 23, 2018 Shelf registration statement filed on February 27, 2018 for general planning purposes New share repurchase plan approved by Board on February 26, 2019 ($ millions) New Share Repurchase Plan $100 Fund Upturn & Key Projects 150 – 200 Pursue Complementary Technology Tuck-in Acquisitions 50 – 100 Liquidity in Place to Support Increased Activity During Upturn POTENTIAL USES
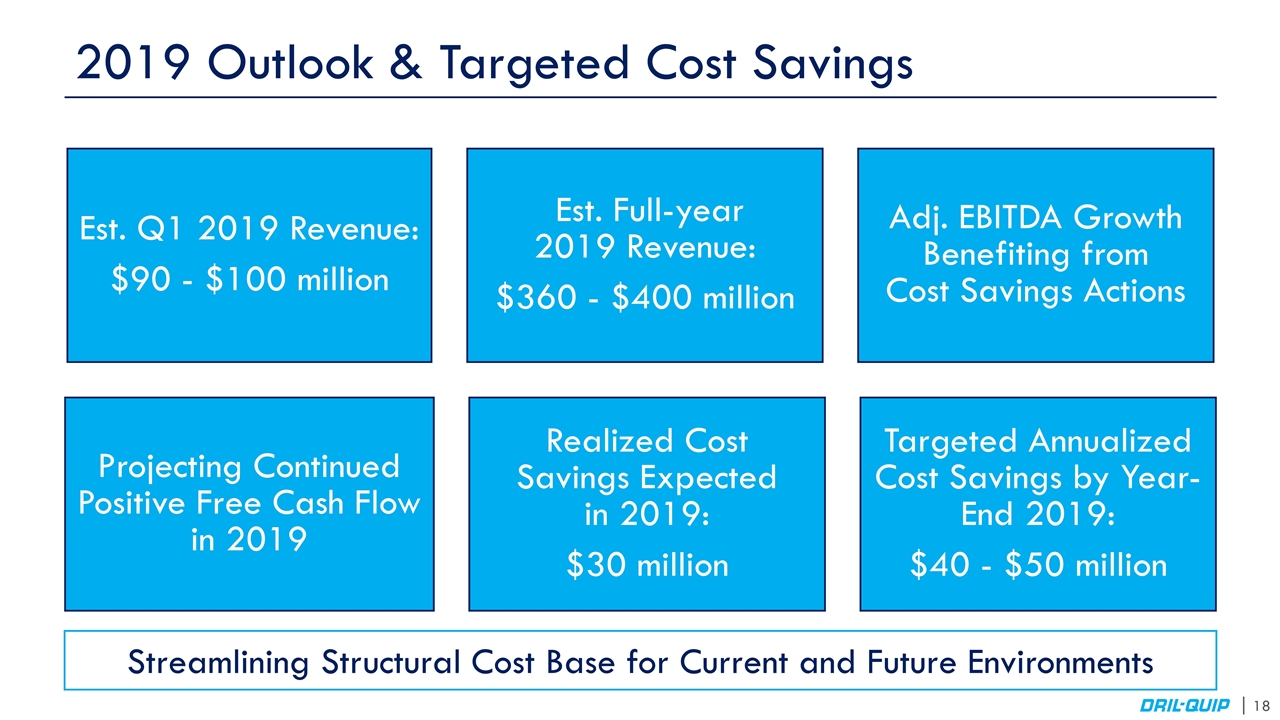
2019 Outlook & Targeted Cost Savings Streamlining Structural Cost Base for Current and Future Environments Est. Q1 2019 Revenue: $90 - $100 million Adj. EBITDA Growth Benefiting from Cost Savings Actions Est. Full-year 2019 Revenue: $360 - $400 million Targeted Annualized Cost Savings by Year-End 2019: $40 - $50 million Realized Cost Savings Expected in 2019: $30 million Projecting Continued Positive Free Cash Flow in 2019
Appendix
Income Statement
Balance Sheet
Non-GAAP Financial Measures Effect on net income (after-tax) (1) Impact on diluted earnings per share Effect on net income (after-tax) Impact on diluted earnings per share Effect on net income (after-tax) Impact on diluted earnings per share $ (74,912) $ (2.09) $ (10,358) $ (0.28) $ (71,492) $ (1.90) Reverse the effect of foreign currency (156) 0.00 32 0.00 3,505 0.10 Add back impairment and other charges 67,569 1.88 0 0.00 0 0.00 Less one-time tax adjustments 0 0.00 0 0.00 66,622 1.77 Restructuring costs, including severance 6,894 0.19 2,959 0.08 1,598 0.04 Gain on sale of assets (857) (0.02) (11) (0.00) 0 0.00 $ (1,462) $ (0.04) $ (7,378) $ (0.20) $ 233 $ 0.01 Effect on net income (after-tax) Impact on diluted earnings per share Effect on net income (after-tax) Impact on diluted earnings per share Effect on net income (after-tax) Impact on diluted earnings per share $ (95,695) $ (2.58) $ (100,639) $ (2.69) $ 93,221 $ 2.47 Reverse the effect of foreign currency (796) $ (0.02) 6,733 0.18 (25,555) (0.68) Add back impairment and other charges 67,569 $ 1.82 39,629 1.06 0 0.00 Less one-time tax adjustments 0 $ 0.00 60,547 1.62 0 0.00 Restructuring costs, including severance 10,326 $ 0.28 3,548 0.09 5,094 0.14 Gain on sale of assets (4,896) $ (0.13) 0 0.00 $ (23,491) $ (0.63) $ 9,818 $ 0.26 $ 72,760 $ 1.93 Adjustments (after tax) Adjusted net income (loss) Adjusted Net Income and EPS: December 31, 2018 September 30, 2018 Three months ended (In thousands, except per share amounts) Net income (loss) Adjustments (after tax) Adjusted net income (loss) December 31, 2017 2018 Adjusted Net Income and EPS: Net income (loss) 2017 Twelve months ended December 31, 2016
Non-GAAP Financial Measures December 31, 2018 September 30, 2018 December 31, 2017 $ (74,912) (10,358) (71,492) Add: Interest (income) expense (2,329) (1,698) (572) Income tax expense (benefit) (21,585) (2,028) 66,955 Depreciation and amortization expense 9,346 8,724 8,743 Restructuring costs, including severance 8,726 3,745 2,130 Long-lived asset, inventory and goodwill impairments 85,531 0 0 Gain on sale of assets (1,085) (14) 0 Foreign currency loss (gain) (197) 41 4,327 Stock compensation expense 3,509 2,366 3,793 $ 7,004 $ 778 13,884 December 31, 2018 December 31, 2017 December 31, 2016 $ (95,695) $ (100,639) $ 93,221 Add: Interest (income) expense (7,749) (3,492) (3,009) Income tax expense (benefit) (19,294) 34,995 22,647 Depreciation and amortization expense 35,312 40,974 31,857 Restructuring costs, including severance 13,071 5,170 5,476 Long-lived asset, inventory and goodwill impairments 85,531 60,968 0 Gain on sale of assets (6,198) 0 0 Foreign currency loss (gain) (1,007) 8,292 (31,764) Stock compensation expense 13,459 14,270 12,217 $ 17,430 $ 60,538 $ 130,645 Adjusted EBITDA: Three months ended (In thousands) Net Income (Loss) Adjusted EBITDA (1) Adjusted EBITDA: Net Income (Loss) (In thousands) Year ended Adjusted EBITDA (1)
Non-GAAP Financial Measures
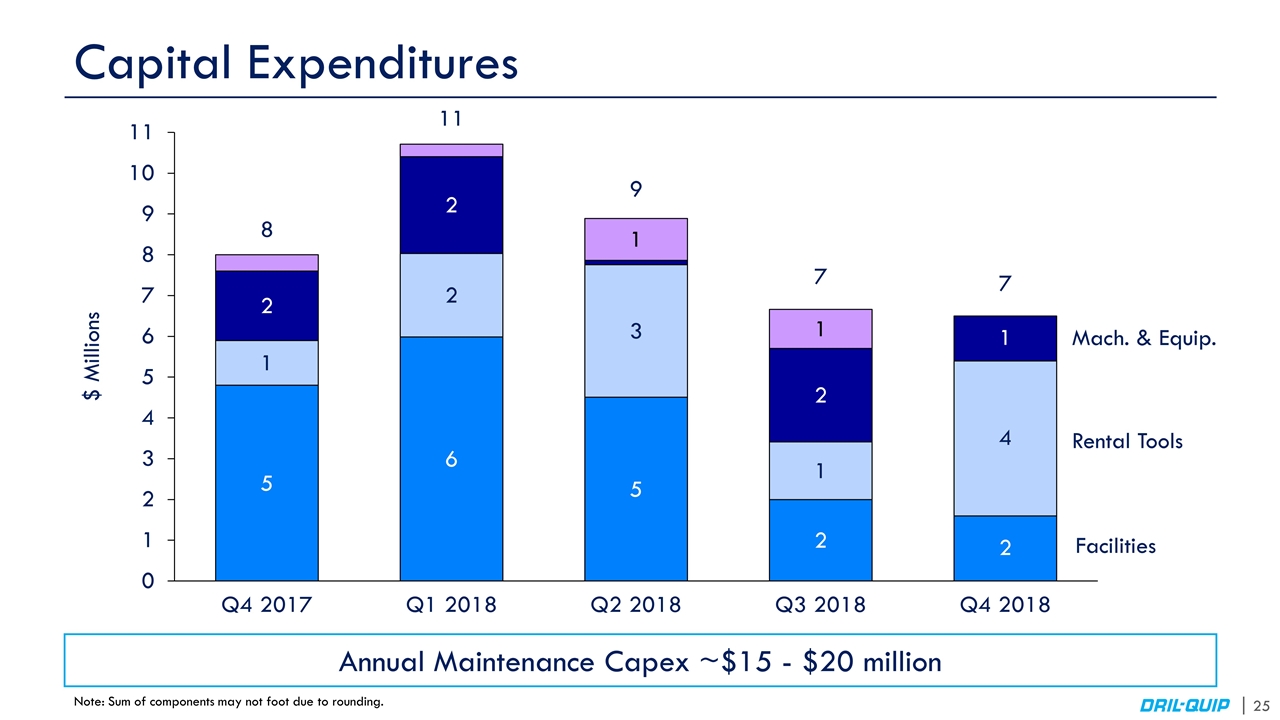
Capital Expenditures Q1 2018 $ Millions Q4 2017 Q3 2018 Q2 2018 Q4 2018 7 Annual Maintenance Capex ~$15 - $20 million Note: Sum of components may not foot due to rounding. 7

Backlog $ Millions Q3’17 Q1’18 Q4’17 Q2’18 Q3’18 Q4’18 70% – 80% of year-end 2017 backlog expected to convert to revenue in twelve months or less Bookings require shorter lead times due to available capacity and inventory on hand Note: The backlog data shown above includes all bookings as of December 31, 2018, including contract awards and signed purchase orders for which the contracts would not be considered enforceable under ASC 606. Note: Sum of components may not foot due to rounding.
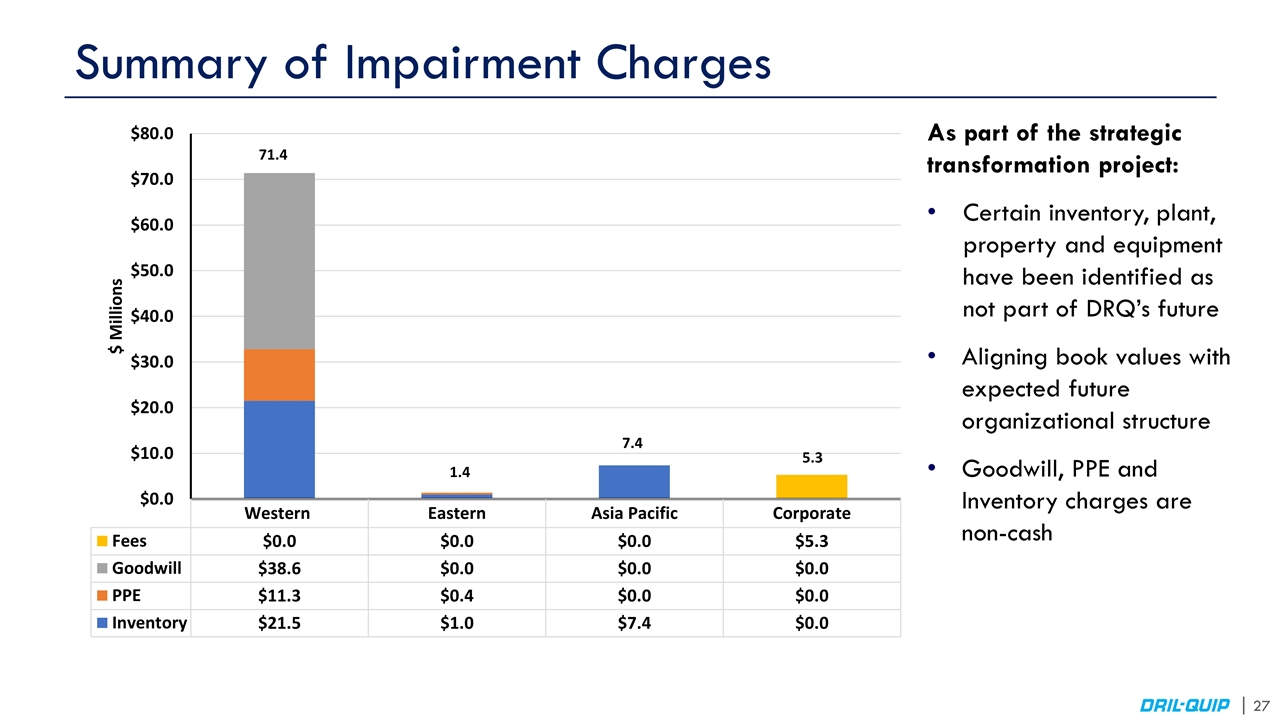
Summary of Impairment Charges As part of the strategic transformation project: Certain inventory, plant, property and equipment have been identified as not part of DRQ’s future Aligning book values with expected future organizational structure Goodwill, PPE and Inventory charges are non-cash 71.4 1.4 7.4 5.3
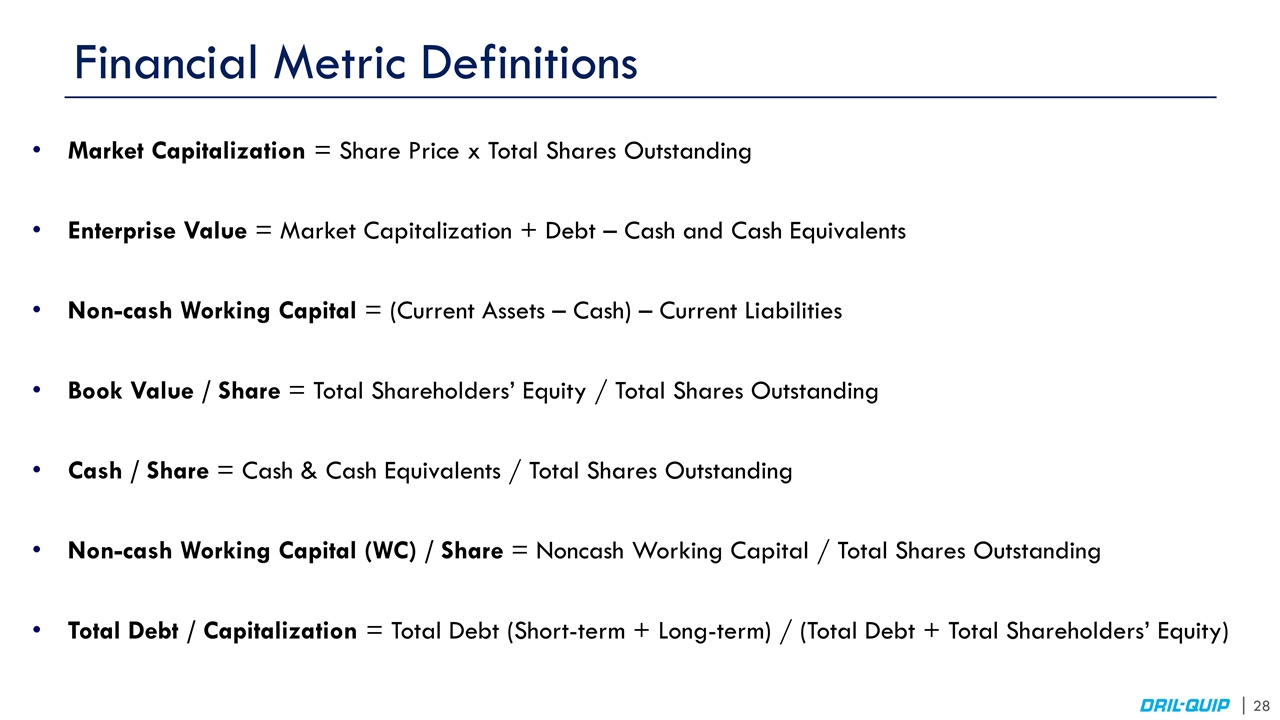
Financial Metric Definitions Market Capitalization = Share Price x Total Shares Outstanding Enterprise Value = Market Capitalization + Debt – Cash and Cash Equivalents Non-cash Working Capital = (Current Assets – Cash) – Current Liabilities Book Value / Share = Total Shareholders’ Equity / Total Shares Outstanding Cash / Share = Cash & Cash Equivalents / Total Shares Outstanding Non-cash Working Capital (WC) / Share = Noncash Working Capital / Total Shares Outstanding Total Debt / Capitalization = Total Debt (Short-term + Long-term) / (Total Debt + Total Shareholders’ Equity)


