FIRST QUARTER 2021 Supplemental Earnings Information dril-quip.com | NYSE: DRQ Exhibit 99.2
Forward-Looking Statements The information furnished in this presentation contains “forward-looking statements” within the meaning of the federal securities laws. Forward-looking statements include, but are not limited to, the effects of the COVID-19 pandemic, and the effects of actions taken by third parties including, but not limited to, governmental authorities, customers, contractors and suppliers, in response to the ongoing COVID-19 pandemic, the impact of actions taken by the Organization of Petroleum Exporting Countries (OPEC) and non-OPEC nations to adjust their production levels, the general volatility of oil and natural gas prices and cyclicality of the oil and gas industry, declines in investor and lender sentiment with respect to, and new capital investments in, the oil and gas industry, project terminations, suspensions or scope adjustments to contracts, uncertainties regarding the effects of new governmental regulations, the Company’s international operations, operating risks, the impact of our customers and the global energy sector shifting some of their asset allocation from fossil-fuel production to renewable energy resources, goals, projections, estimates, expectations, market outlook, forecasts, plans and objectives, including revenue and new product revenue, capital expenditures and other projections, project bookings, bidding and service activity, acquisition opportunities, forecasted supply and demand, forecasted drilling activity and subsea investment, liquidity, cost savings, and share repurchases and are based on assumptions, estimates and risk analysis made by management of Dril-Quip, Inc. (“Dril-Quip”) in light of its experience and perception of historical trends, current conditions, expected future developments and other factors. No assurance can be given that actual future results will not differ materially from those contained in the forward-looking statements in this presentation. Although Dril-Quip believes that all such statements contained in this presentation are based on reasonable assumptions, there are numerous variables of an unpredictable nature or outside of Dril-Quip’s control that could affect Dril-Quip’s future results and the value of its shares. Each investor must assess and bear the risk of uncertainty inherent in the forward-looking statements contained in this presentation. Please refer to Dril-Quip’s filings with the Securities and Exchange Commission (“SEC”) for additional discussion of risks and uncertainties that may affect Dril-Quip’s actual future results. Dril-Quip undertakes no obligation to update the forward-looking statements contained herein. Use of Non-GAAP Financial Measures Adjusted Net Income, Adjusted Diluted EPS, Adjusted EBITDA and Free Cash Flow are non-GAAP measures. Adjusted Net Income and Adjusted Diluted EPS are defined as net income (loss) and earnings per share, respectively, excluding the impact of foreign currency gains or losses as well as other significant non-cash items and certain charges and credits. Adjusted EBITDA is defined as net income excluding income taxes, interest income and expense, depreciation and amortization expense, non-cash gains or losses from foreign currency exchange rate changes as well as other significant non-cash items and items that can be considered non-recurring. Free Cash Flow is defined as net cash provided by operating activities less net cash used in the purchase of property, plant and equipment. We believe that these non-GAAP measures enable us to evaluate and compare more effectively the results of our operations period over period and identify operating trends by removing the effect of our capital structure from our operating structure and certain other items including those that affect the comparability of operating results. In addition, we believe that these measures are supplemental measurement tools used by analysts and investors to help evaluate overall operating performance, ability to pursue and service possible debt opportunities and make future capital expenditures. These measures do not represent funds available for our discretionary use and are not intended to represent or to be used as a substitute for net income or net cash provided by operating activities, as measured under U.S. generally accepted accounting principles (“GAAP”). Non-GAAP financial information supplements should be read together with, and is not an alternative or substitute for, our financial results reported in accordance with GAAP. Because non-GAAP financial information is not standardized, it may not be possible to compare these financial measures with other companies’ non-GAAP financial measures. Reconciliations of these non-GAAP measures to the most directly comparable GAAP measure can be found in the appendix. Use of Website Investors should note that Dril-Quip announces material financial information in SEC filings, press releases and public conference calls. Dril-Quip may use the Investors section of its website (www.dril-quip.com) to communicate with investors. It is possible that the financial and other information posted there could be deemed to be material information. Information on Dril-Quip’s website is not part of this presentation. Cautionary Statement
Dril-Quip Investment Highlights Leading Manufacturer of Highly Engineered Drilling & Production Equipment Technically Innovative, Environmentally Responsible Products & First-class Service Strong Financial Position Historically Superior Margins to Peers Results Driven Management Team
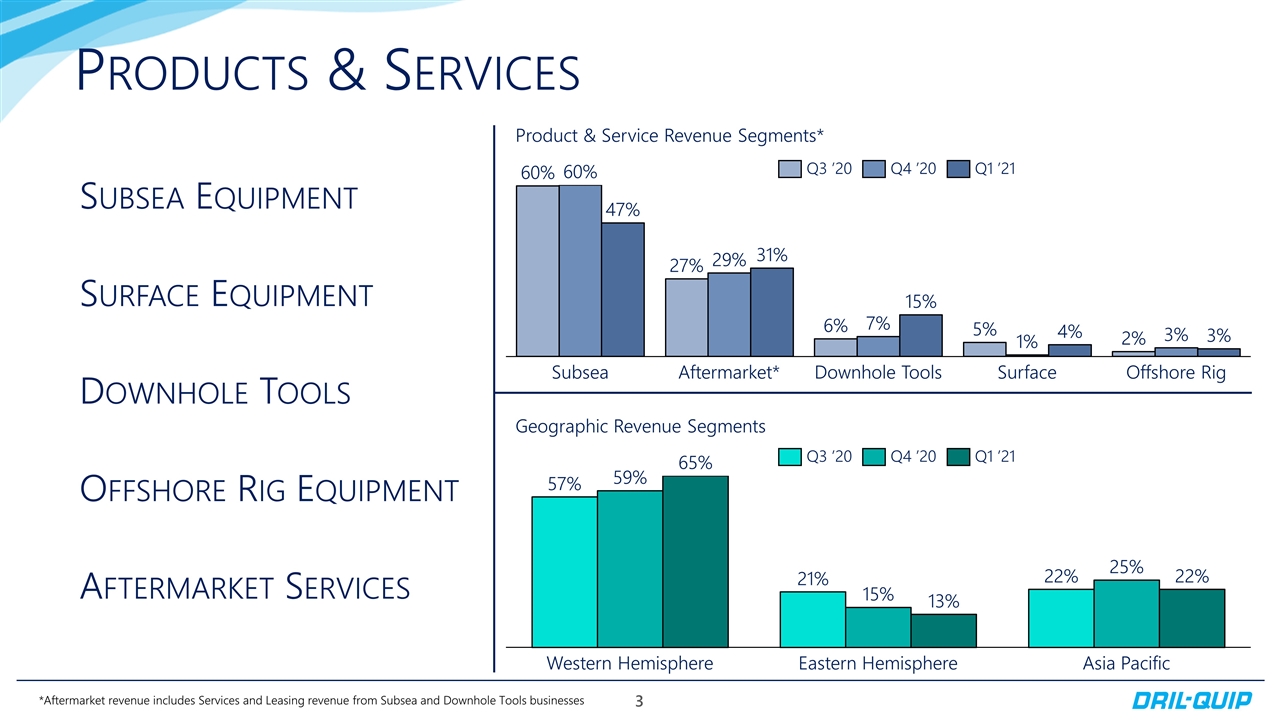
Products & Services Product & Service Revenue Segments* Geographic Revenue Segments *Aftermarket revenue includes Services and Leasing revenue from Subsea and Downhole Tools businesses Subsea Equipment Surface Equipment Downhole Tools Offshore Rig Equipment Aftermarket Services
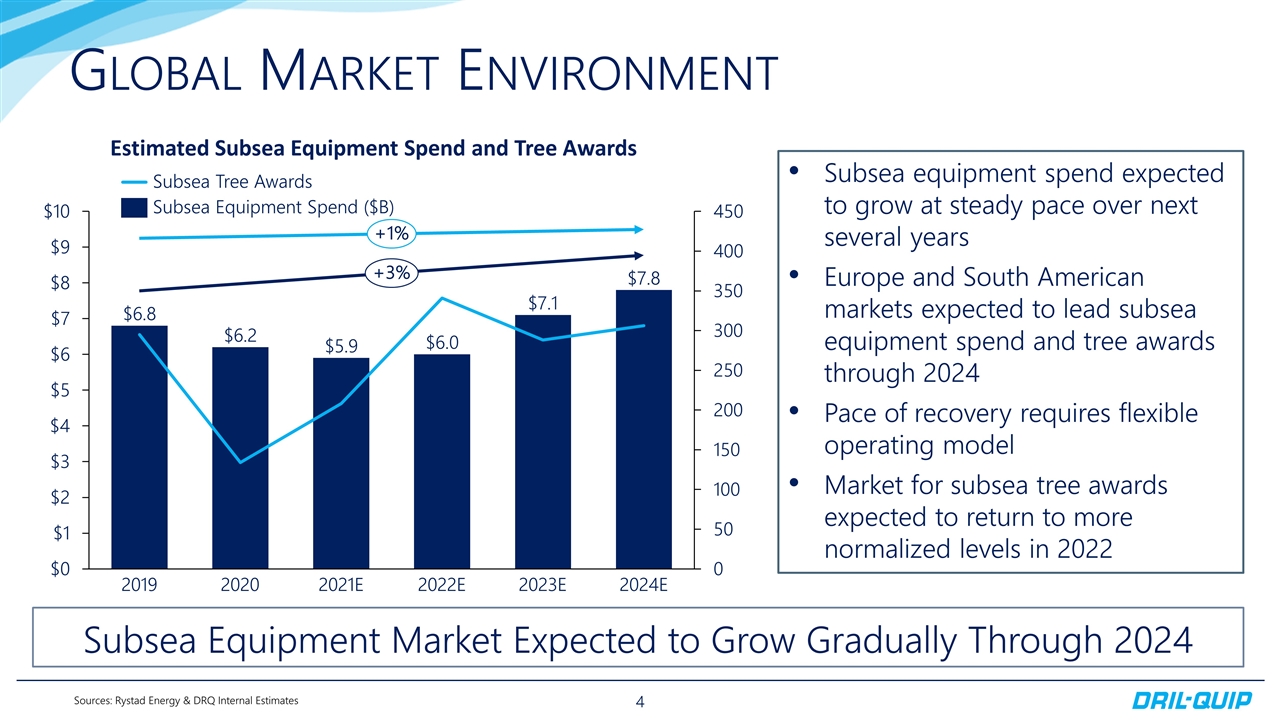
Global Market Environment Sources: Rystad Energy & DRQ Internal Estimates Subsea Equipment Market Expected to Grow Gradually Through 2024 Subsea equipment spend expected to grow at steady pace over next several years Europe and South American markets expected to lead subsea equipment spend and tree awards through 2024 Pace of recovery requires flexible operating model Market for subsea tree awards expected to return to more normalized levels in 2022 Estimated Subsea Equipment Spend and Tree Awards
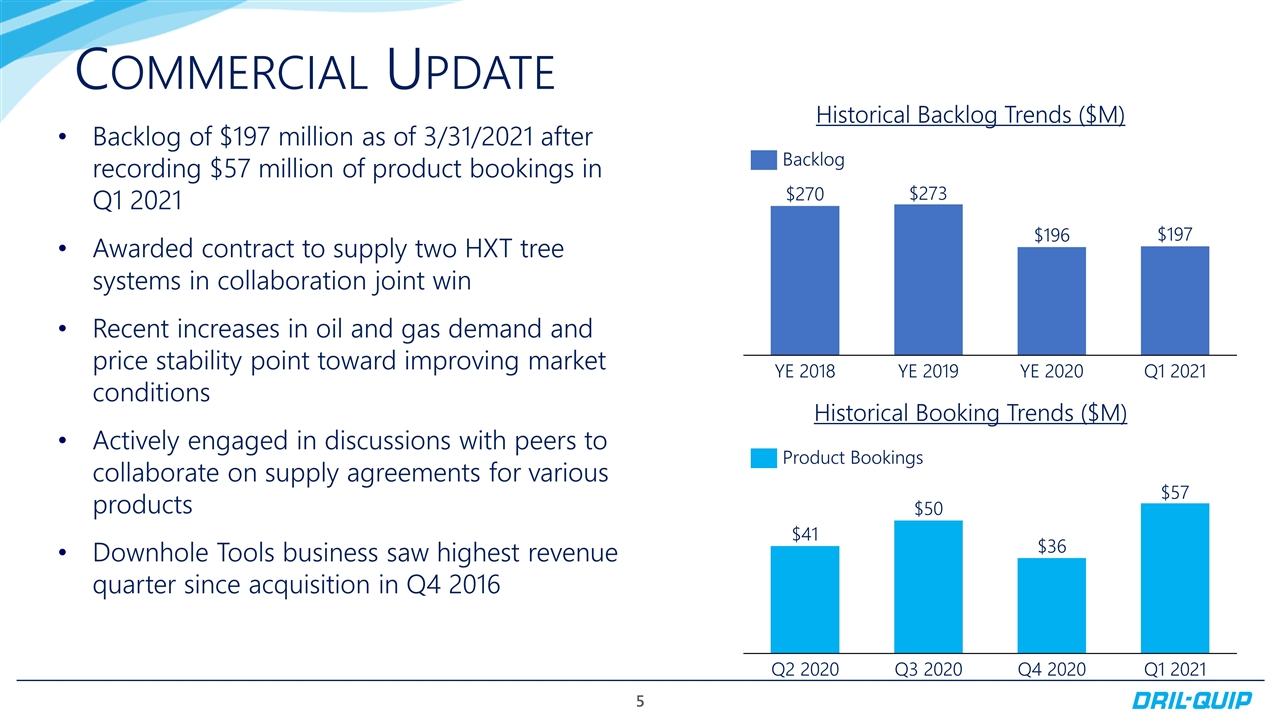
Commercial Update Backlog of $197 million as of 3/31/2021 after recording $57 million of product bookings in Q1 2021 Awarded contract to supply two HXT tree systems in collaboration joint win Recent increases in oil and gas demand and price stability point toward improving market conditions Actively engaged in discussions with peers to collaborate on supply agreements for various products Downhole Tools business saw highest revenue quarter since acquisition in Q4 2016 Historical Backlog Trends ($M) Historical Booking Trends ($M)
Q1 2021 Highlights Delivered revenue of $81.2 million for the first quarter of 2021; Reported a net loss of $34.4 million, or a $0.97 loss per share, driven primarily by $25.0 million of impairments, restructuring and other charges predominantly related to the downhole tools product line; First quarter net cash provided by operating activities of $13.1 million and free cash flow of $10.6 million, or 13.0% of revenue, inclusive of $2.5 million of capital expenditures; Booked $56.6 million of new product orders during the first quarter of 2021 resulting in quarter end backlog up $1 million from December 31, 2020 to $197 million; Generated adjusted EBITDA of $8.0 million, or 9.9% of revenue; Recorded highest revenue quarter in downhole tools product line since the acquisition in the fourth quarter of 2016. Adjusted EBITDA and free cash flow are non-GAAP measures. See appendix for reconciliation to GAAP measures.
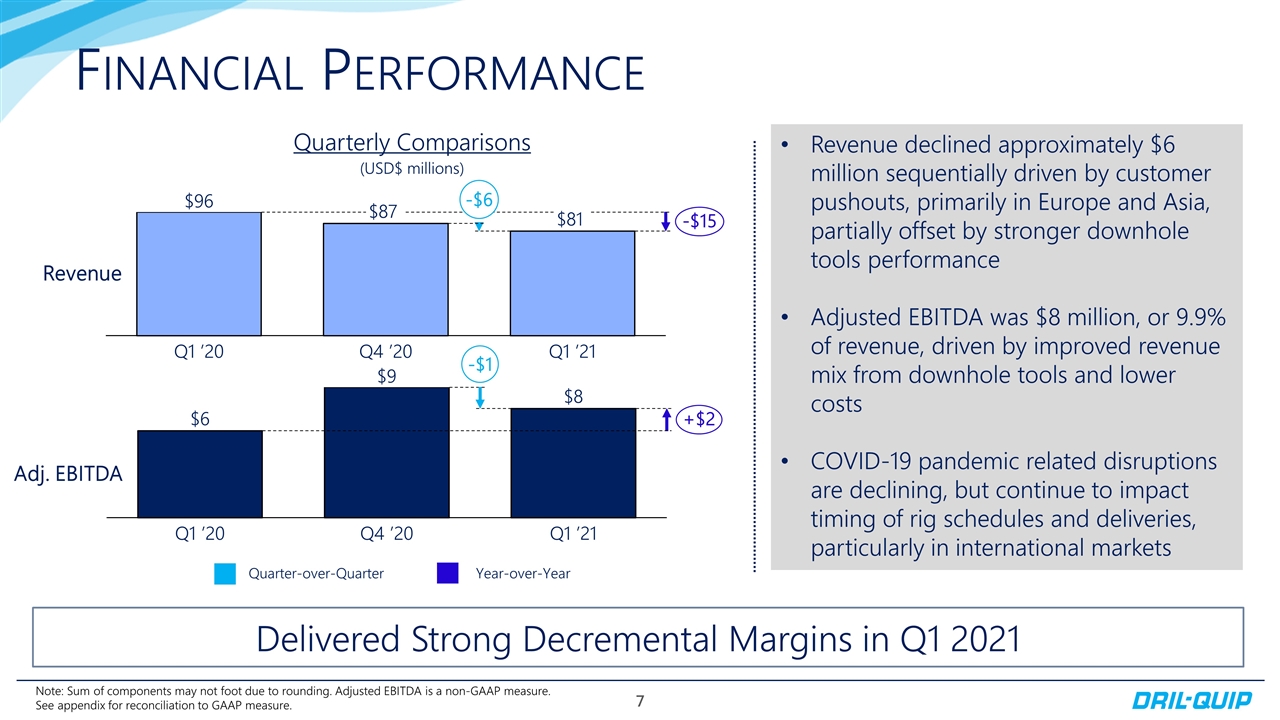
Financial Performance (USD$ millions) -$15 -$6 Delivered Strong Decremental Margins in Q1 2021 Quarterly Comparisons Note: Sum of components may not foot due to rounding. Adjusted EBITDA is a non-GAAP measure. See appendix for reconciliation to GAAP measure. Revenue declined approximately $6 million sequentially driven by customer pushouts, primarily in Europe and Asia, partially offset by stronger downhole tools performance Adjusted EBITDA was $8 million, or 9.9% of revenue, driven by improved revenue mix from downhole tools and lower costs COVID-19 pandemic related disruptions are declining, but continue to impact timing of rig schedules and deliveries, particularly in international markets -$1 +$2 Quarter-over-Quarter Year-over-Year
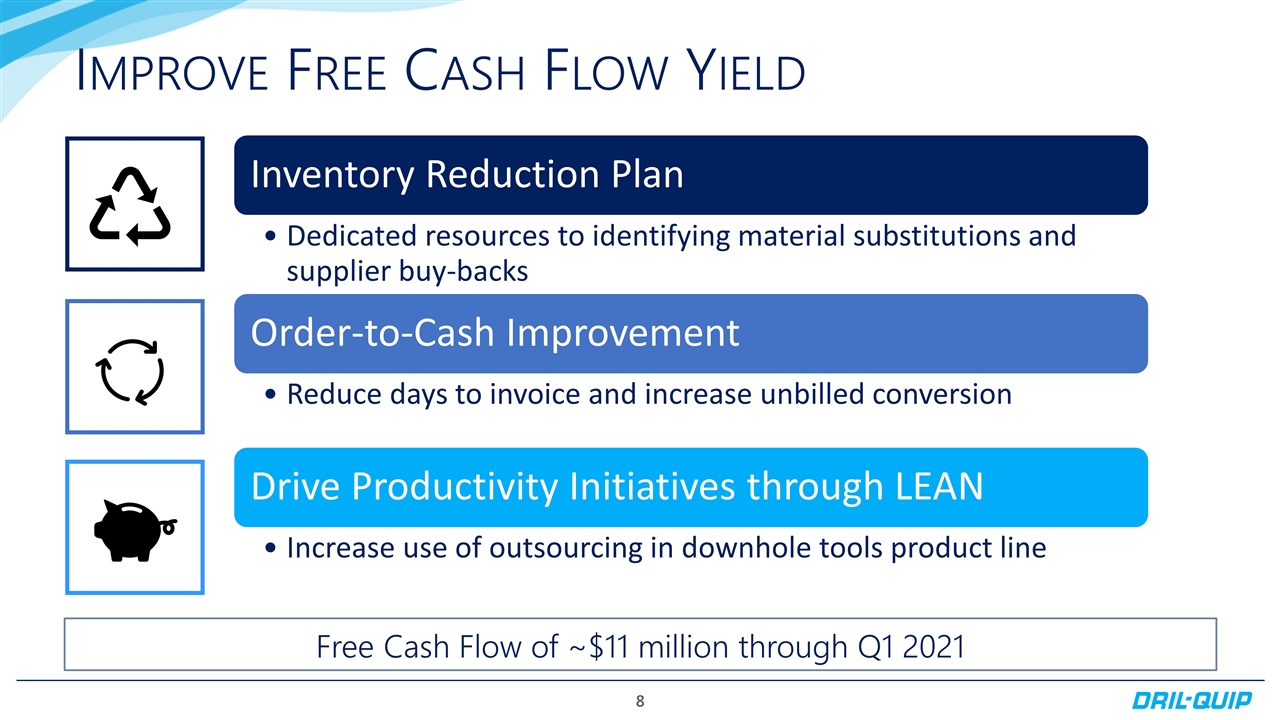
Improve Free Cash Flow Yield Free Cash Flow of ~$11 million through Q1 2021 Inventory Reduction Plan Dedicated resources to identifying material substitutions and supplier buy-backs Order-to-Cash Improvement Reduce days to invoice and increase unbilled conversion Drive Productivity Initiatives through LEAN Increase use of outsourcing in downhole tools product line
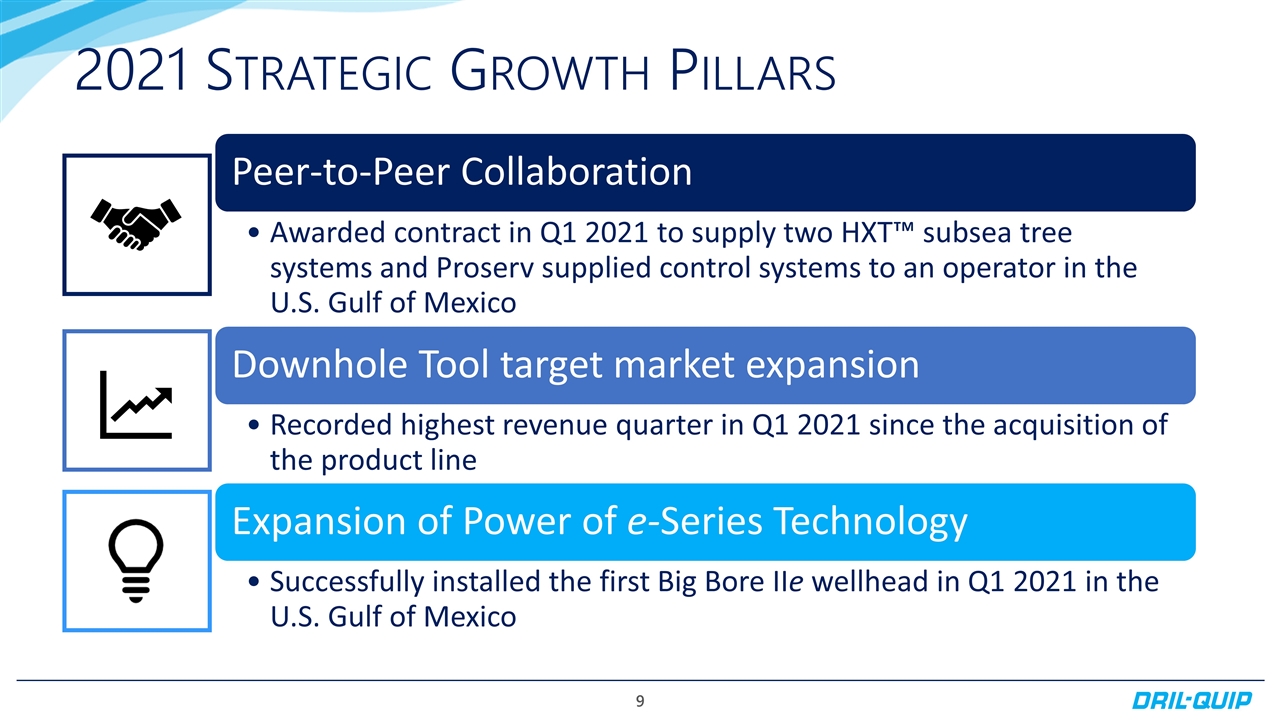
2021 Strategic Growth Pillars Peer-to-Peer Collaboration Awarded contract in Q1 2021 to supply two HXT™ subsea tree systems and Proserv supplied control systems to an operator in the U.S. Gulf of Mexico Downhole Tool target market expansion Recorded highest revenue quarter in Q1 2021 since the acquisition of the product line Expansion of Power of e- Series Technology Successfully installed the first Big Bore II e wellhead in Q1 2021 in the U.S. Gulf of Mexico
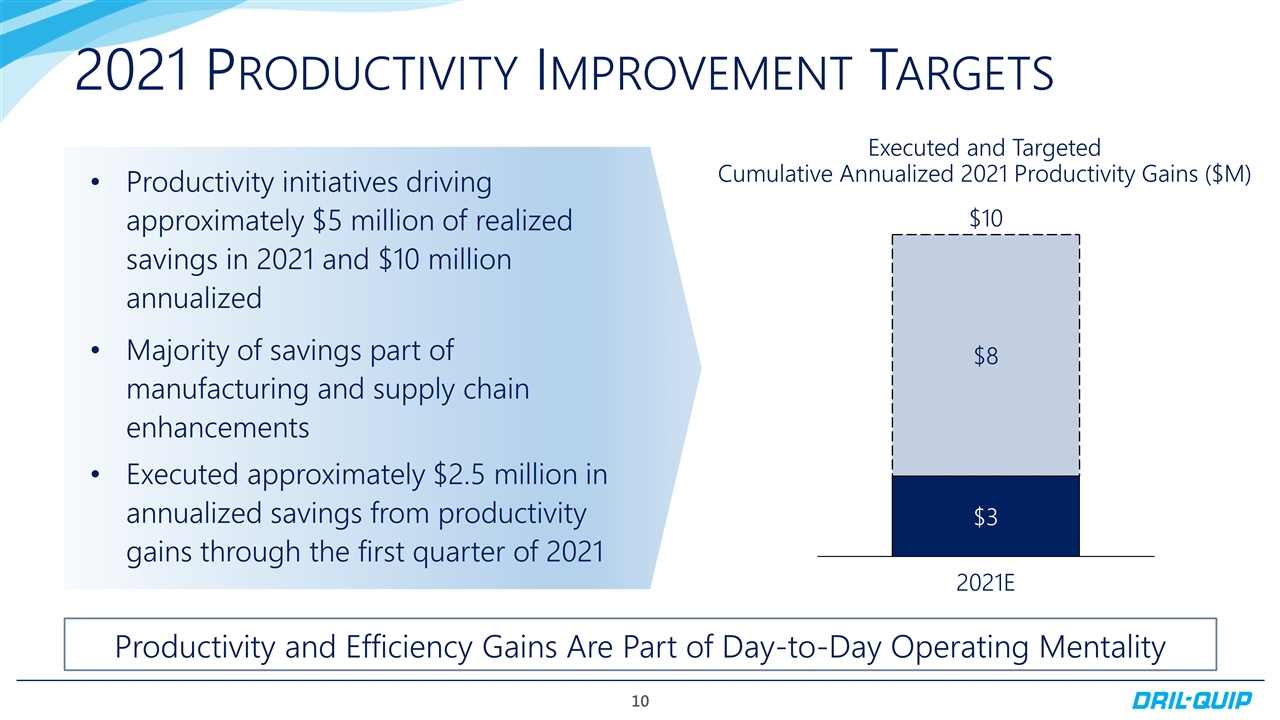
2021 Productivity Improvement Targets Productivity initiatives driving approximately $5 million of realized savings in 2021 and $10 million annualized Majority of savings part of manufacturing and supply chain enhancements Executed approximately $2.5 million in annualized savings from productivity gains through the first quarter of 2021 Executed and Targeted Cumulative Annualized 2021 Productivity Gains ($M) Productivity and Efficiency Gains Are Part of Day-to-Day Operating Mentality
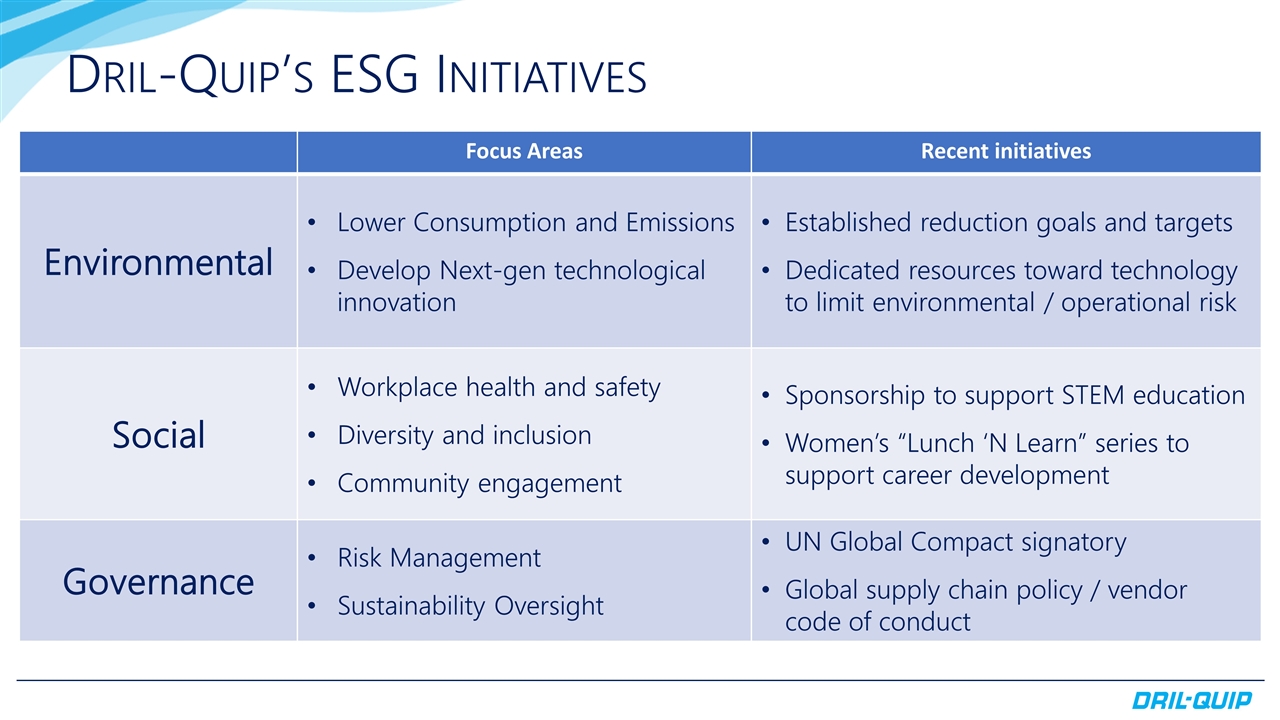
Dril-Quip’s ESG Initiatives Focus Areas Recent initiatives Environmental Lower Consumption and Emissions Develop Next-gen technological innovation Established reduction goals and targets Dedicated resources toward technology to limit environmental / operational risk Social Workplace health and safety Diversity and inclusion Community engagement Sponsorship to support STEM education Women’s “Lunch ‘N Learn” series to support career development Governance Risk Management Sustainability Oversight UN Global Compact signatory Global supply chain policy / vendor code of conduct
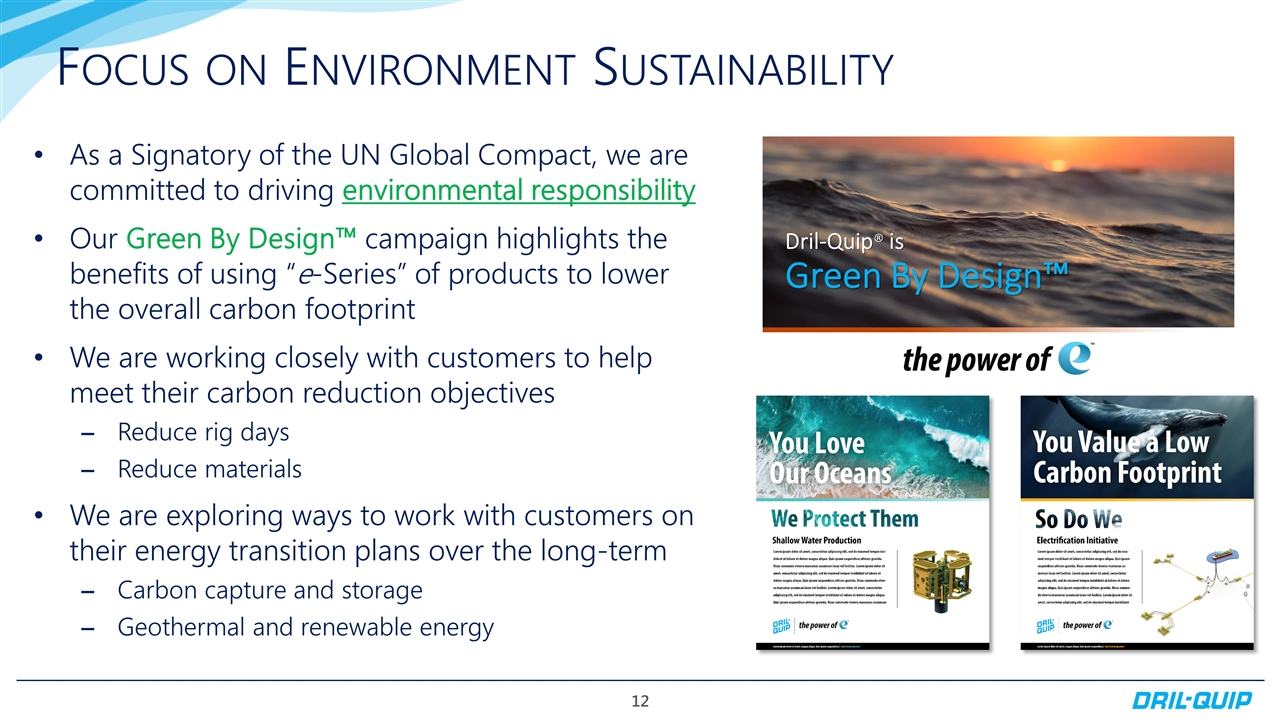
Focus on Environment Sustainability As a Signatory of the UN Global Compact, we are committed to driving environmental responsibility Our Green By Design™ campaign highlights the benefits of using “e-Series” of products to lower the overall carbon footprint We are working closely with customers to help meet their carbon reduction objectives Reduce rig days Reduce materials We are exploring ways to work with customers on their energy transition plans over the long-term Carbon capture and storage Geothermal and renewable energy
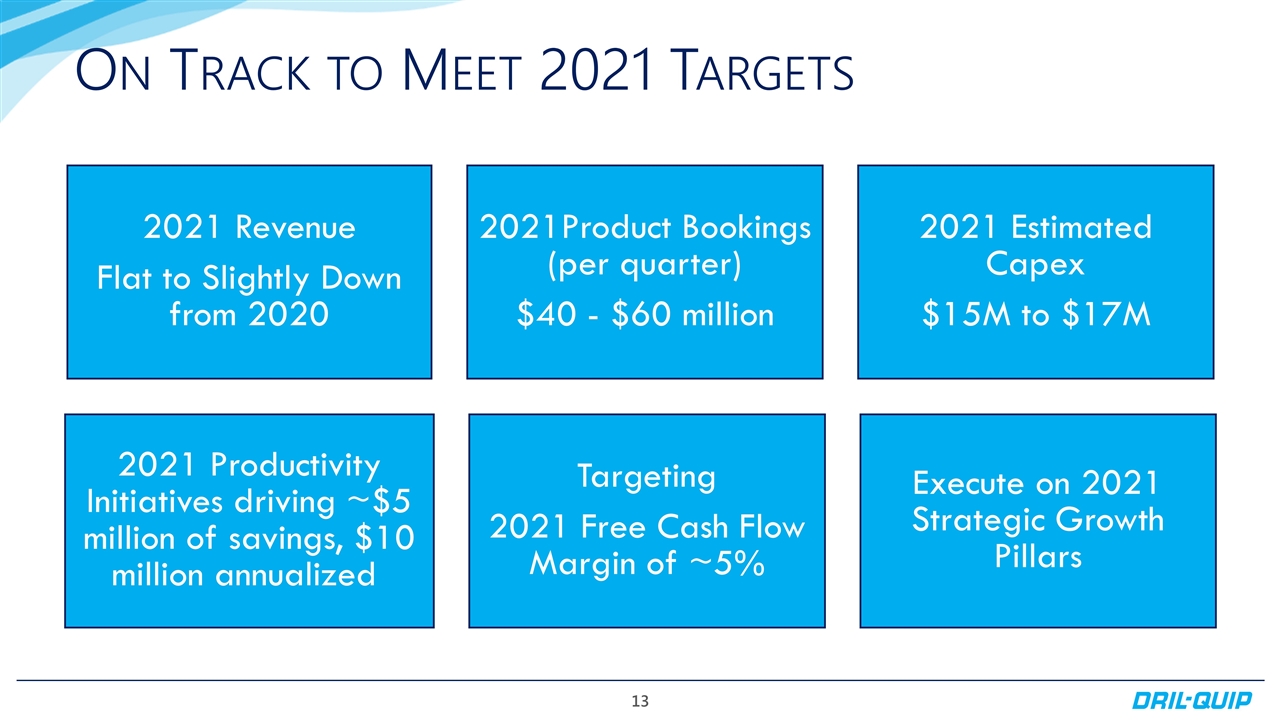
On Track to Meet 2021 Targets 2021 Revenue Flat to Slightly Down from 2020 2021 Estimated Capex $15M to $17M 2021Product Bookings (per quarter) $40 - $60 million Execute on 2021 Strategic Growth Pillars 2021 Productivity Initiatives driving ~$5 million of savings, $10 million annualized Targeting 2021 Free Cash Flow Margin of ~5%
dril-quip.com | NYSE: DRQ APPENDIX
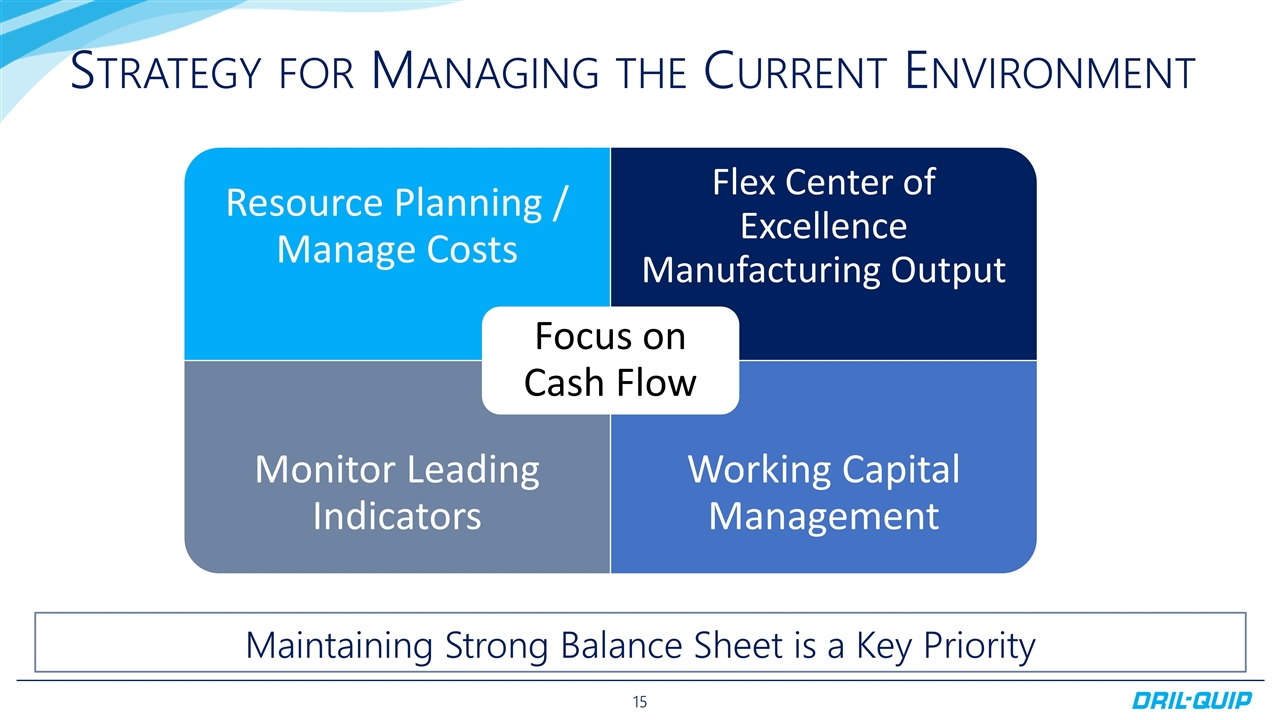
Strategy for Managing the Current Environment Maintaining Strong Balance Sheet is a Key Priority Focus on Cash Flow Resource Planning / Manage Costs Flex Center of Excellence Manufacturing Output Monitor Leading Indicators Working Capital Management
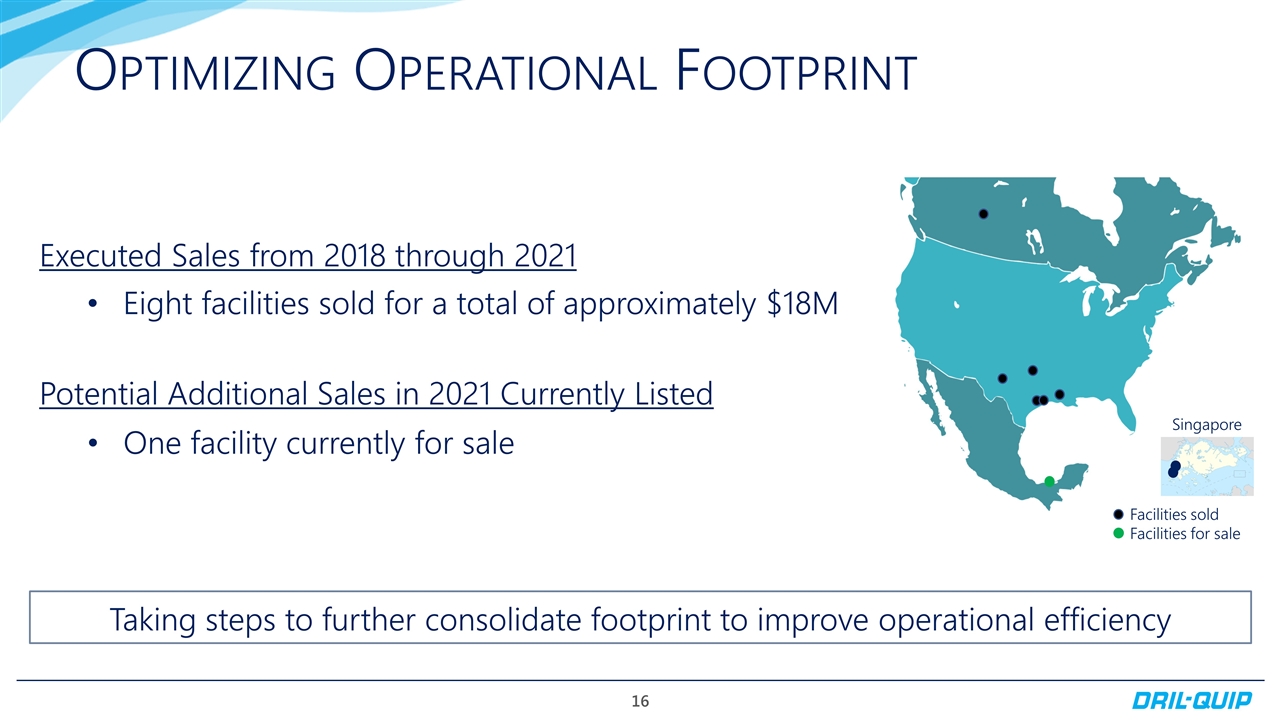
Optimizing Operational Footprint Executed Sales from 2018 through 2021 Eight facilities sold for a total of approximately $18M Potential Additional Sales in 2021 Currently Listed One facility currently for sale Taking steps to further consolidate footprint to improve operational efficiency Facilities sold Facilities for sale Singapore
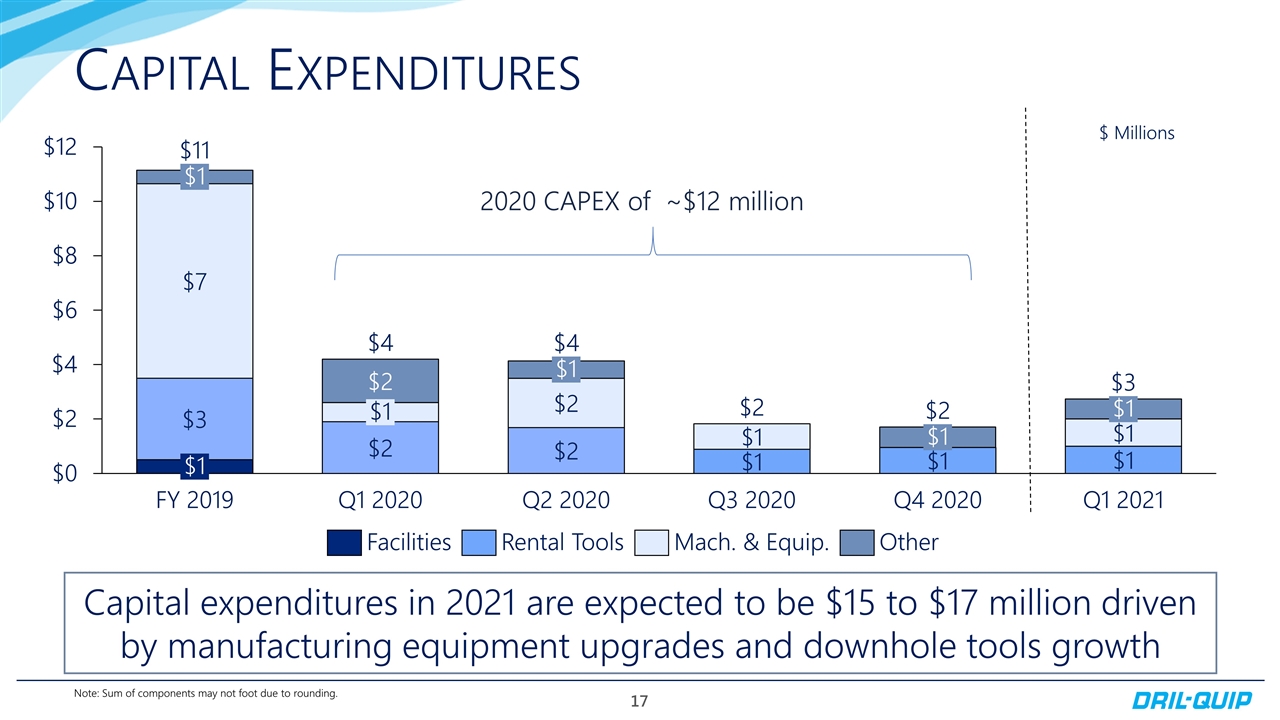
Capital Expenditures $2 $2 Capital expenditures in 2021 are expected to be $15 to $17 million driven by manufacturing equipment upgrades and downhole tools growth Note: Sum of components may not foot due to rounding. $ Millions 2020 CAPEX of ~$12 million
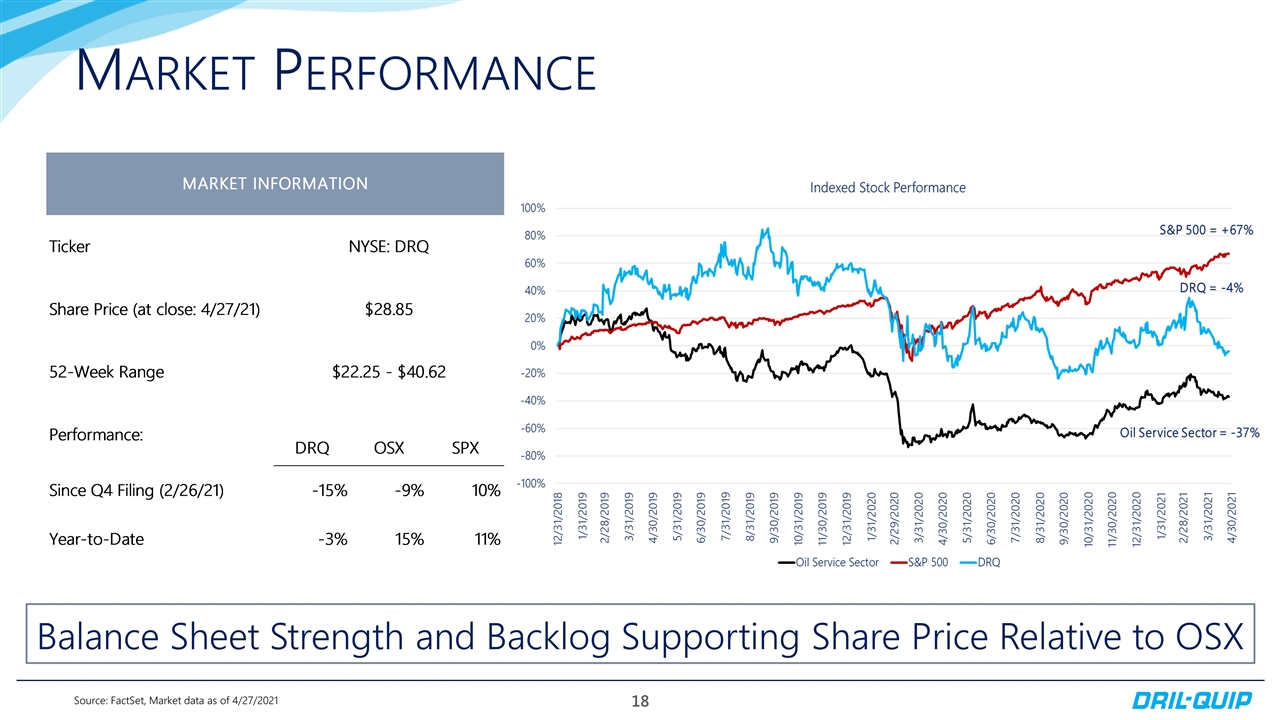
Market Performance Source: FactSet, Market data as of 4/27/2021 Balance Sheet Strength and Backlog Supporting Share Price Relative to OSX
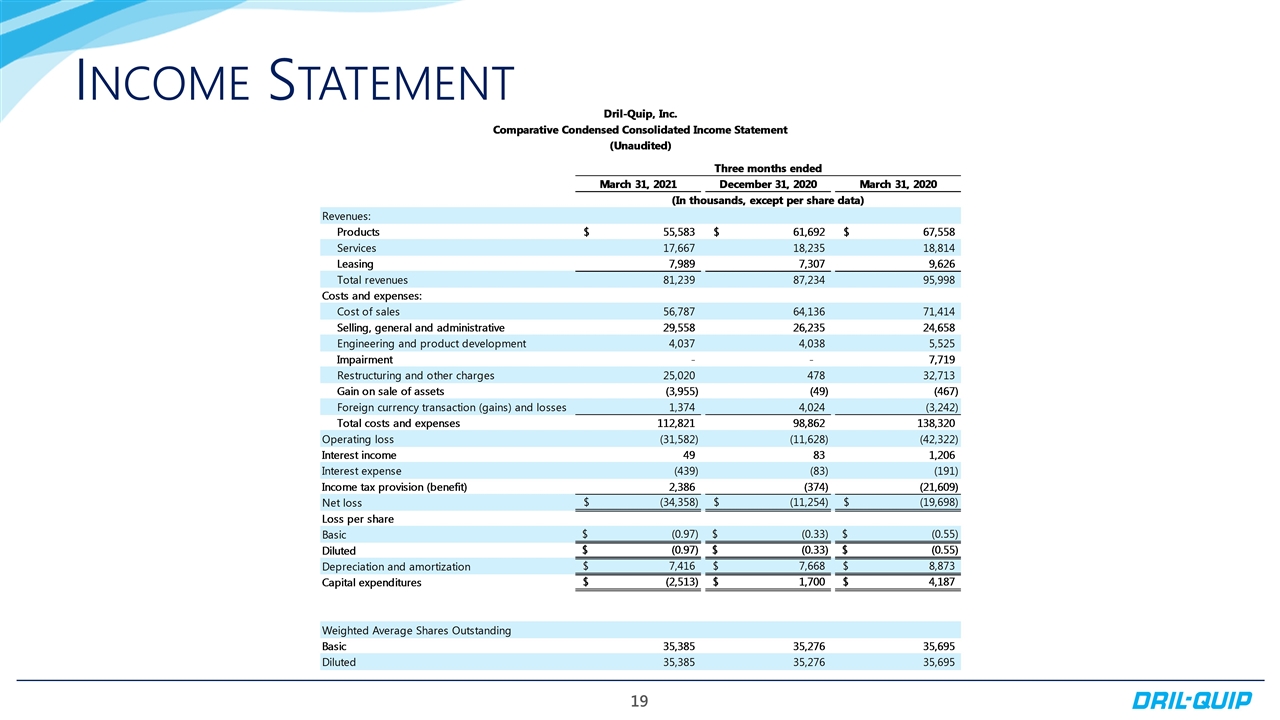
Income Statement
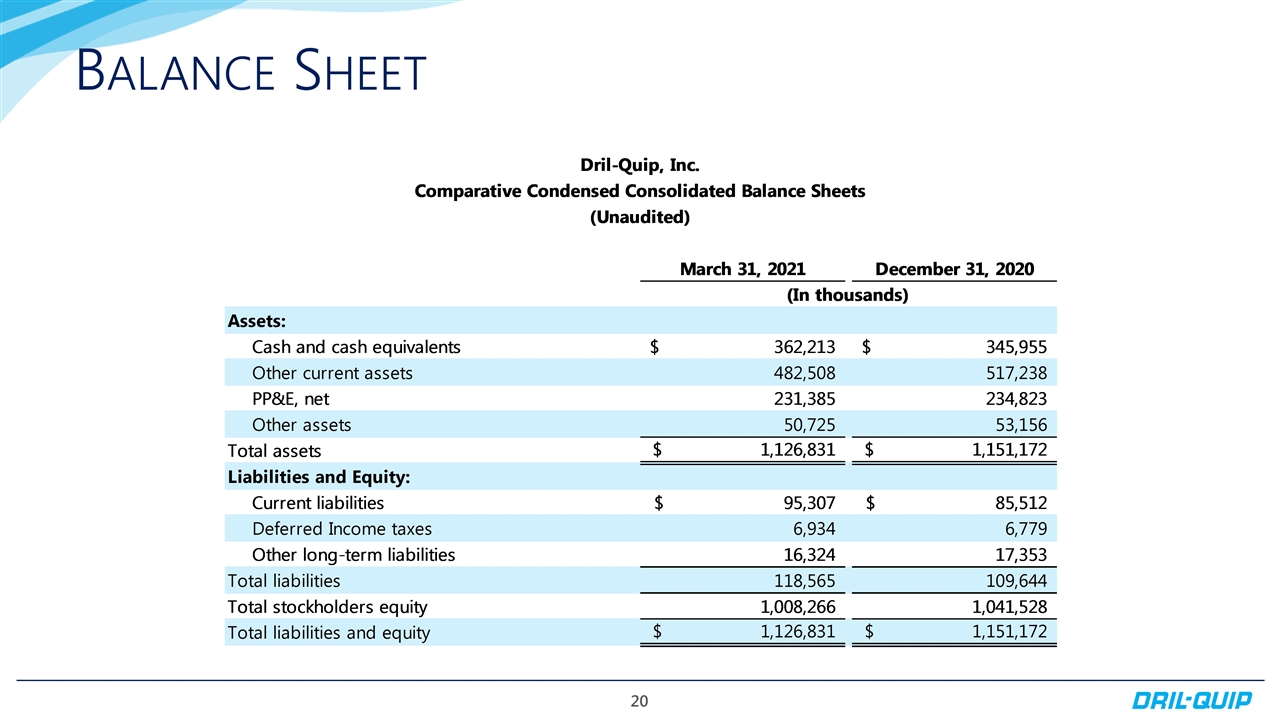
Balance Sheet
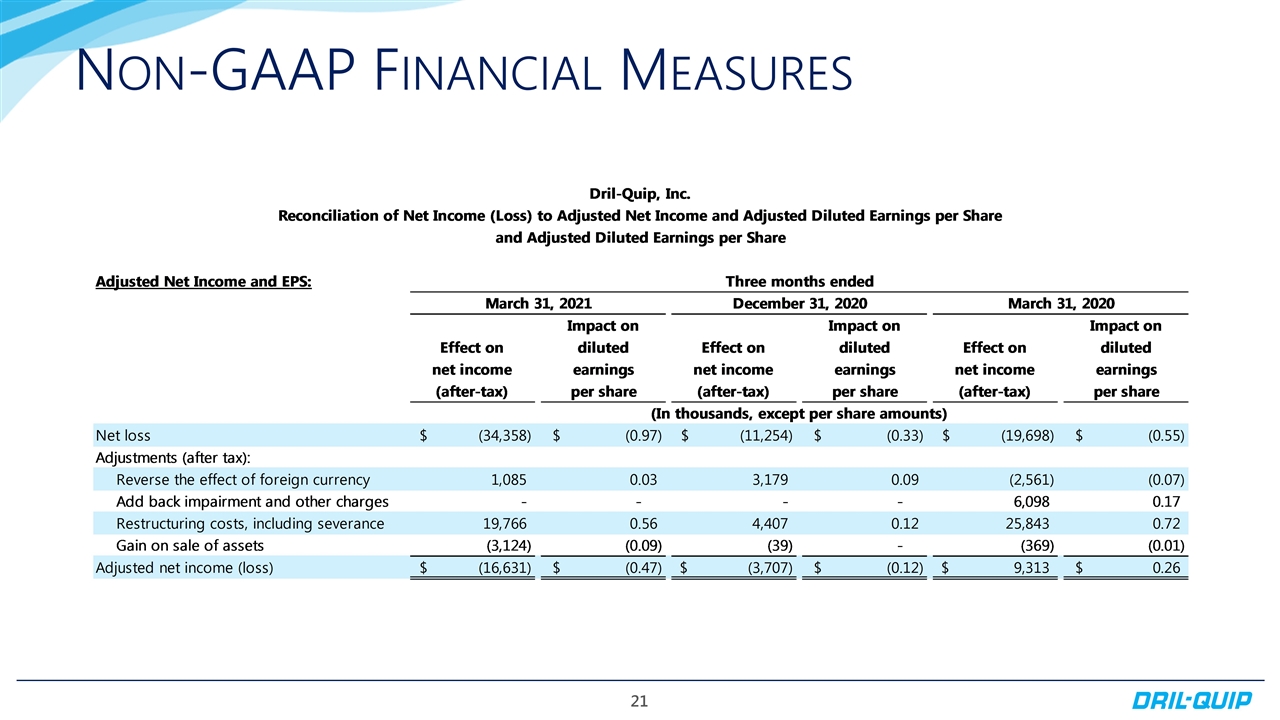
Non-GAAP Financial Measures
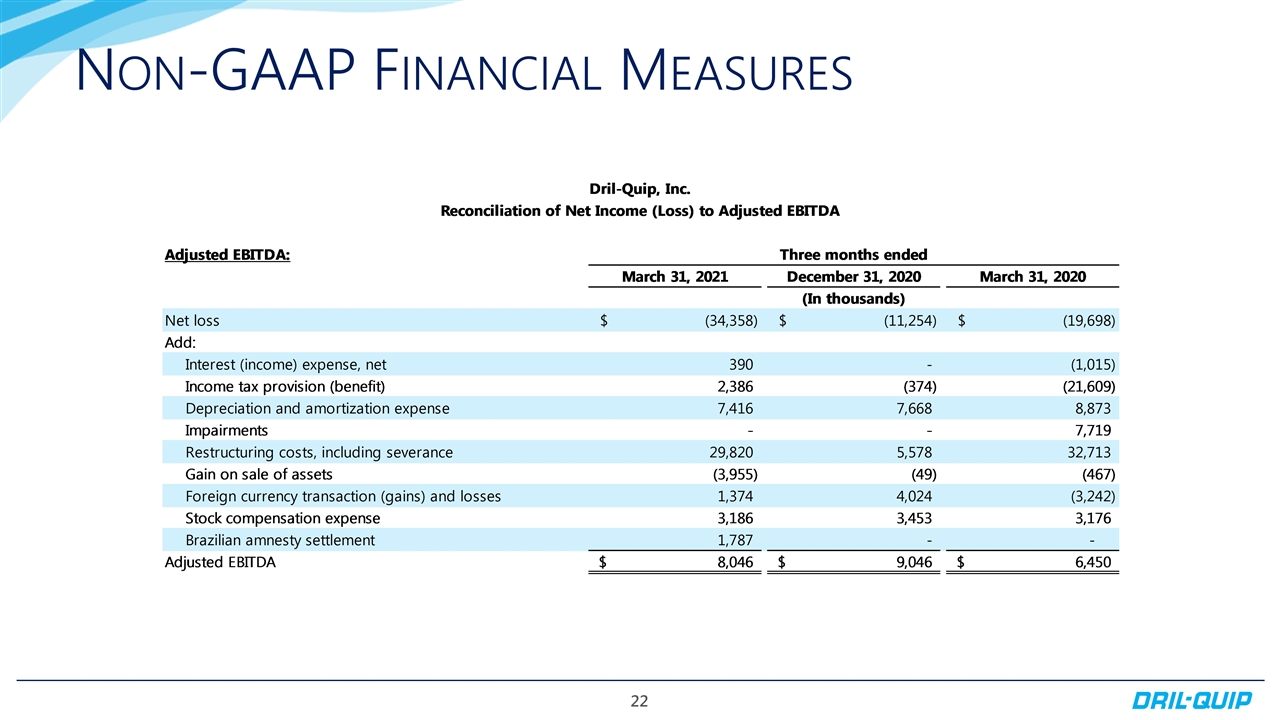
Non-GAAP Financial Measures
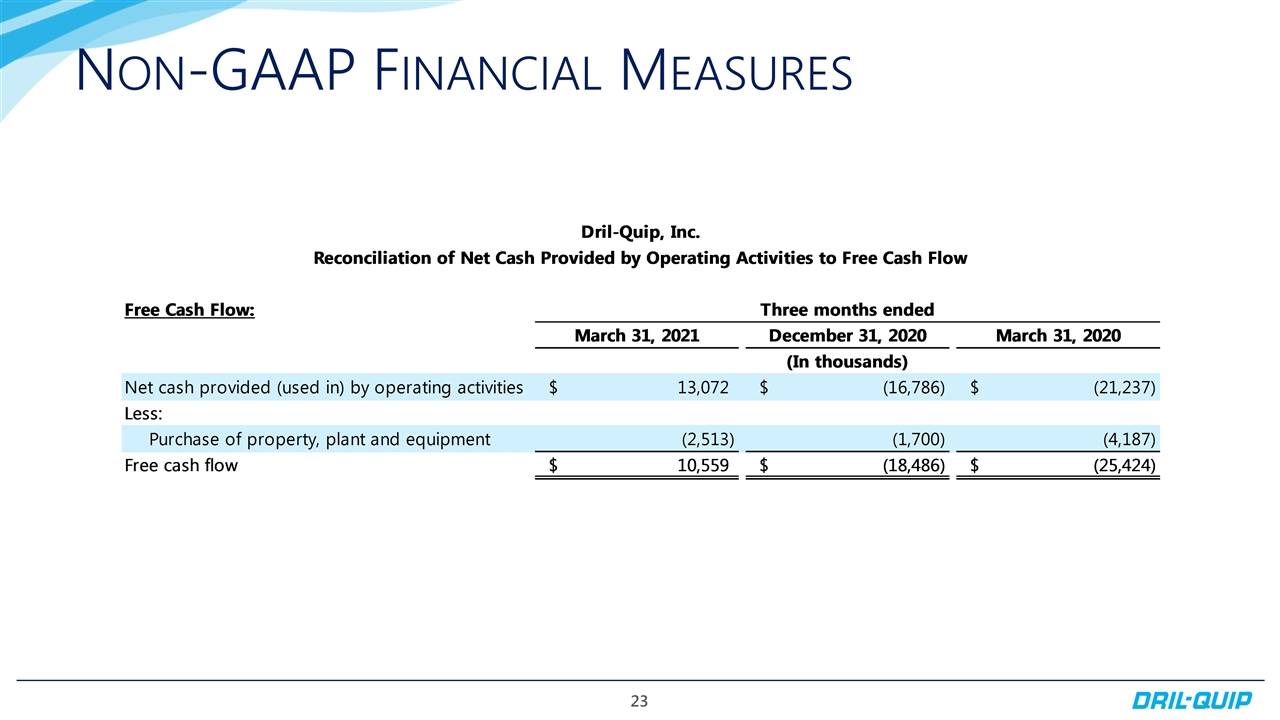
Non-GAAP Financial Measures
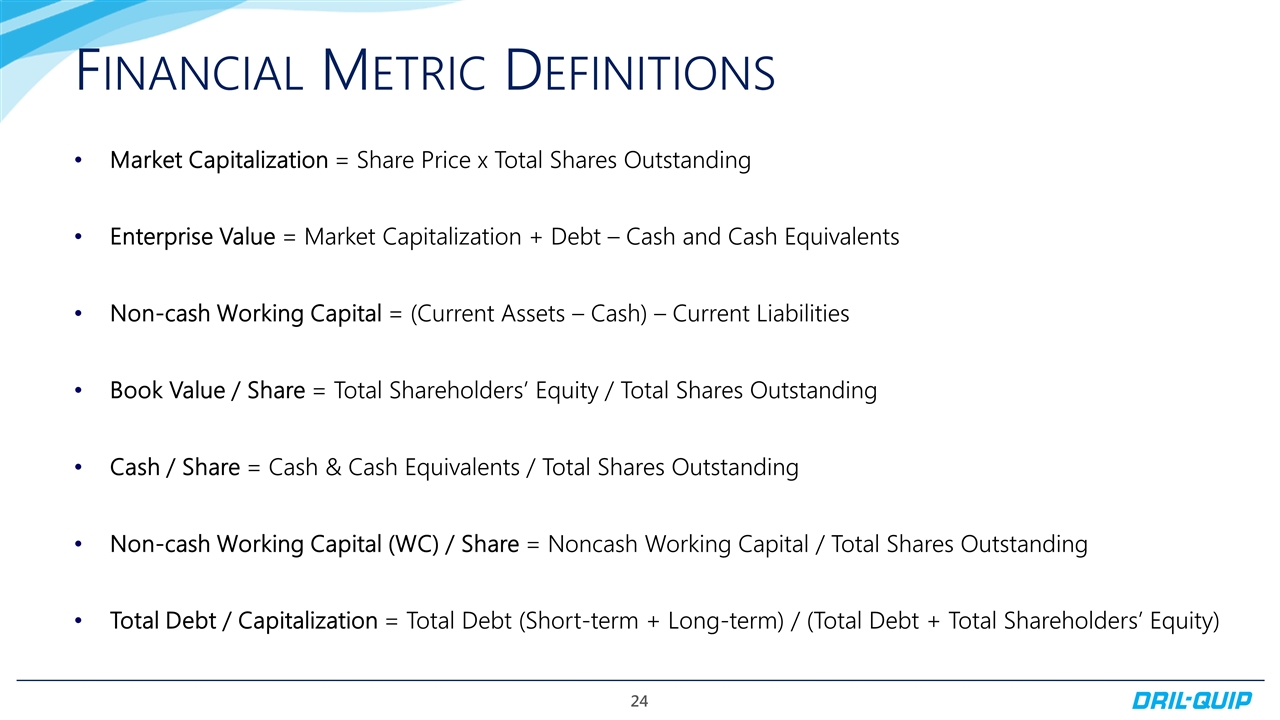
Financial Metric Definitions Market Capitalization = Share Price x Total Shares Outstanding Enterprise Value = Market Capitalization + Debt – Cash and Cash Equivalents Non-cash Working Capital = (Current Assets – Cash) – Current Liabilities Book Value / Share = Total Shareholders’ Equity / Total Shares Outstanding Cash / Share = Cash & Cash Equivalents / Total Shares Outstanding Non-cash Working Capital (WC) / Share = Noncash Working Capital / Total Shares Outstanding Total Debt / Capitalization = Total Debt (Short-term + Long-term) / (Total Debt + Total Shareholders’ Equity)


