
Exhibit 99.2 A Leading Owner, Operator & Investor of Senior Housing Communities SNDA│ NYSE Listed Investor Presentation October 2024

Forward-Looking Statements This presentation contains forward-looking statements which are subject to certain risks and uncertainties that could cause our actual results and financial condition of Sonida Senior Living, Inc. (the “Company,” “we,” “our” or “us”) to differ materially from those indicated in the forward-looking statements, including, among others, the risks, uncertainties and factors set forth under “Item. 1A. Risk Factors” in our Annual Report on Form 10-K for the fiscal year ended December 31, 2023, filed with the Securities and Exchange Commission (the “SEC”) on March 27, 2024, as well as on Form 10-Q for the second quarter ended June 30, 2024, filed with the SEC on August 12, 2024, and also include the following: the Company’s ability to generate sufficient cash flows from operations, proceeds from equity issuances and debt financings, and proceeds from the sale of assets to satisfy its short- and long-term debt obligations and to fund the Company’s acquisitions and capital improvement projects to expand, redevelop, and/or reposition its senior living communities; increases in market interest rates that increase the cost of certain of our debt obligations; increased competition for, or a shortage of, skilled workers, including due to general labor market conditions, along with wage pressures resulting from such increased competition, low unemployment levels, use of contract labor, minimum wage increases and/or changes in overtime laws; the Company’s ability to obtain additional capital on terms acceptable to it; the Company’s ability to extend or refinance its existing debt as such debt matures; the Company’s compliance with its debt agreements, including certain financial covenants, and the risk of cross-default in the event such non-compliance occurs; the Company’s ability to complete acquisitions and dispositions upon favorable terms or at all; the risk of oversupply and increased competition in the markets which the Company operates; the Company’s ability to improve and maintain controls over financial reporting and remediate the identified material weakness discussed in its recent Quarterly and Annual Reports filed with the SEC; the cost and difficulty of complying with applicable licensure, legislative oversight, or regulatory changes; risks associated with current global economic conditions and general economic factors such as inflation, the consumer price index, commodity costs, fuel and other energy costs, competition in the labor market, costs of salaries, wages, benefits, and insurance, interest rates, and tax rates; the impact from or the potential emergence and effects of a future epidemic, pandemic, outbreak of infectious disease or other health crisis; and changes in accounting principles and interpretations. We caution you that the risks, uncertainties and other factors referenced above may not contain all of the risks, uncertainties and other factors that are important to you. In addition, we cannot assure you that we will realize the results, benefits or outcomes that we expect or anticipate or, even if substantially realized, that they will result in the consequences or affect us or our business in the way expected. For information about the Company, visit www.sonidaseniorliving.com. 2
Non-GAAP Financial Measures This presentation contains contains the financial measures (1) Community Net Operating Income or NOI, (2) Community Net Operating Income Margin, (3) Revenue per Occupied Unit (RevPOR) and (4) Same-Store amounts for these metrics, all of which are not calculated in accordance with U.S. GAAP. Presentations of these non-GAAP financial measures are intended to aid investors in better understanding the factors and trends affecting the Company’s performance and liquidity. However, investors should not consider these non-GAAP financial measures as a substitute for financial measures determined in accordance with GAAP, including net income (loss), income (loss) from operations, net cash provided by (used in) operating activities, or revenue. Investors are cautioned that amounts presented in accordance with the Company’s definitions of these non-GAAP financial measures may not be comparable to similar measures disclosed by other companies because not all companies calculate non-GAAP measures in the same manner. Investors are urged to review the reconciliations of these non-GAAP financial measures from the most comparable financial measures determined in accordance with GAAP included in our Form 8k filing with this presentation. Community Net Operating Income and Community Net Operating Income Margin are non-GAAP performance measures for the Company’s consolidated owned portfolio of communities that the Company defines as net income (loss) excluding: general and administrative expenses (inclusive of stock-based compensation expense), interest income, interest expense, other income/expense, provision for income taxes, settlement fees and expenses, revenue and operating expenses from the Company’s disposed properties; and further adjusted to exclude income/expense associated with non-cash, non-operational, transactional, or organizational restructuring items that management does not consider as part of the Company’s underlying core operating performance and impacts the comparability of performance between periods. For the periods presented herein, such other items include depreciation and amortization expense, gain(loss) on extinguishment of debt, gain(loss) on disposition of assets, long-lived asset impairment, and loss on non-recurring settlements with third parties. The Community Net Operating Income Margin is calculated by dividing Community Net Operating Income by resident revenue. Adjusted Community Net Operating Income and Adjusted Community Net Operating Income Margin are further adjusted to exclude the impact from non-recurring state grant funds received. The Company believes that presentation of Community Net Operating Income and Community Net Operating Income Margin as performance measures are useful to investors because (i) they are one of the metrics used by the Company’s management to evaluate the performance of our core consolidated owed portfolio of communities, to review the Company’s comparable historic and prospective core operating performance of the consolidated owned communities, and to make day-to-day operating decisions; (ii) they provide an assessment of operational factors that management can impact in the short-term, namely revenues and the controllable cost structure of the organization, by eliminating items related to the Company’s financing and capital structure and other items that management does not consider as part of the Company’s underlying core operating performance, and impacts the comparability of performance between periods. Community Net Operating Income and Net Community Operating Income Margin have material limitations as a performance measure, including: (i) excluded general and administrative expenses are necessary to operate the Company and oversee its communities; (ii) excluded interest is necessary to operate the Company’s business under its current financing and capital structure; (iii) excluded depreciation, amortization, and impairment charges may represent the wear and tear and/or reduction in value of the Company’s communities, and other assets and may be indicative of future needs for capital expenditures; and (iv) the Company may incur income/expense similar to those for which adjustments are made, such as gain (loss) on debt extinguishment, gain(loss) on disposition of assets, loss on settlements, non-cash stock-based compensation expense, and transaction and other costs, and such income/expense may significantly affect the Company’s operating results. Same-Store Net Operating Income and Same-Store Net Operating Income Margin are non-GAAP performance measures for the Company’s portfolio of 61 owned continuing communities that the Company defines as net income (loss) excluding: general and administrative expenses, interest income, interest expense, other income/expense, provision for income taxes, settlement fees and expenses, and further adjusted to exclude income/expense associated with non-cash, non-operational, transactional, or organizational restructuring items that management does not consider as part of the Company’s underlying core operating performance and that management believes impact the comparability of performance between periods. For the periods presented herein, such other items include stock-based compensation expense, depreciation and amortization expense, long-lived asset impairment, gain on extinguishment of debt, loss from equity method investment, and other income (expense), net. The Company believes that presentation of Same-Store Net Operating Income and Same-Store Net Operating Income Margin as performance measures are useful to investors because (i) they are one of the metrics used by the Company’s management to evaluate the performance of our core portfolio of 61 owned continuing communities, to review the Company’s comparable historic and prospective core operating performance of the 61 owned continuing communities, and to make day-to-day operating decisions; (ii) they provide an assessment of operational factors that management can impact in the short-term, namely revenues and the controllable cost structure of the organization, by eliminating items related to the Company’s financing and capital structure and other items that management does not consider as part of the Company’s underlying core operating performance, and that management believes impact the comparability of performance between periods. Same-Store Net Operating Income and Same-Store Net Operating Income Margin have material limitations as a performance measure, including: (i) excluded interest is necessary to operate the Company’s business under its current financing and capital structure; (ii) excluded depreciation, amortization and impairment charges may represent the wear and tear and/or reduction in value of the Company’s communities, and other assets and may be indicative of future needs for capital expenditures; and (iii) the Company may incur income/expense similar to those for which adjustments are made, such as gain(loss) on sale of assets, gain(loss) debt extinguishment, loss on equity method investment, non-cash stock-based compensation expense, and transaction and other costs, and such income/expense may significantly affect the Company’s operating results. 3

Introduction to Today’s Speakers Brandon Ribar Kevin Detz Max Levy President & CEO Chief Financial Officer Chief Investment Officer Joined Sonida Senior Living in 2019 Joined Sonida Senior Living in 2022 Joined Sonida Senior Living in 2024 (Board Director from 2021 to 2024) § >20 years of experience managing and § >11 years of experience in investing, M&A, § >20 years of experience instilling financial scaling (through M&A) large portfolios in capital markets, strategy and senior living accountability, scalability and labor healthcare and real estate underwriting efficiencies for operating companies and § Prior to Sonida, served as senior vice § Prior to Sonida, served as principal at financial services organizations president of operations at Golden Living, Conversant Capital focusing on credit and § Prior to Sonida, spent eight years at overseeing 305 skilled nursing and assisted equity investments in real estate and Aimbridge Hospitality in various leadership living centers with 20,000 employees hospitality including senior housing roles across 21 states 4
About Sonida
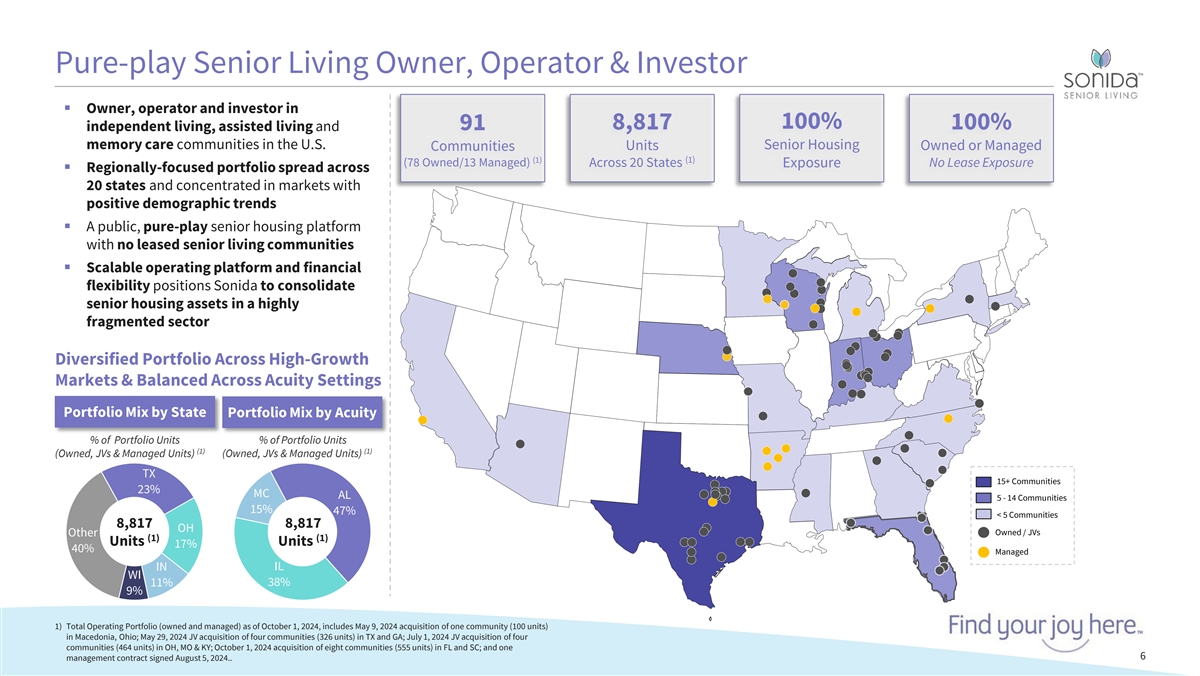
Pure-play Senior Living Owner, Operator & Investor § Owner, operator and investor in 100% 91 8,817 100% independent living, assisted living and memory care communities in the U.S. Senior Housing Units Owned or Managed Communities (1) (1) (78 Owned/13 Managed) Across 20 States No Lease Exposure Exposure § Regionally-focused portfolio spread across 20 states and concentrated in markets with positive demographic trends § A public, pure-play senior housing platform with no leased senior living communities § Scalable operating platform and financial flexibility positions Sonida to consolidate senior housing assets in a highly fragmented sector Diversified Portfolio Across High-Growth Markets & Balanced Across Acuity Settings Portfolio Mix by State Portfolio Mix by Acuity % of Portfolio Units % of Portfolio Units (1) (1) (Owned, JVs & Managed Units) (Owned, JVs & Managed Units) TX 15+ Communities 23% MC AL 5 - 14 Communities 15% 47% < 5 Communities 8,817 8,817 OH Owned / JVs Other (1) (1) Units Units 17% 40% Managed IN IL WI 38% 11% 9% 1) Total Operating Portfolio (owned and managed) as of October 1, 2024, includes May 9, 2024 acquisition of one community (100 units) in Macedonia, Ohio; May 29, 2024 JV acquisition of four communities (326 units) in TX and GA; July 1, 2024 JV acquisition of four communities (464 units) in OH, MO & KY; October 1, 2024 acquisition of eight communities (555 units) in FL and SC; and one 6 management contract signed August 5, 2024..

Recent Strategic Initiatives Have Positioned Sonida for Operational Outperformance and Accelerated Growth After a Series of Key Actions Since 2020, Sonida is Primed to Play Offense, Driving its Next Phase of Growth ü Senior § Brandon Ribar promoted from COO to CEO in 2022, Kevin Detz hired as CFO in 2022, and Max Levy joined as CIO in June 2024 Leadership & § Re-designed and expanded leadership team to include Chief Clinical Officer to focus on operational excellence Refreshed § Refreshed Board with highly-experienced industry veterans: 7 new directors since 2021 Board ü § Raised >$330MM of equity since 2021 § Modified / restructured 58 of 60 community loans in 2023 and 2024, including recently-announced discounted pay-off of two Texas Community Loans at $18.5MM (on a $28.7MM balance, representing a ~36% discount) Strengthened § Repurchased $77.4MM worth of loans on seven communities in February 2024 for $40.2MM (at a 48% discount to Balance Sheet principal) (1) § New credit facility with $150MM of capacity ü § Fully exited leased portfolio in 2020 Portfolio § Re-invested $10MM and $15MM+ of CapEx into communities in 2022 and 2023, respectively, and investing $20MM+ of CapEx in 2024 Stabilization (2) § Announced 13 consecutive quarters of occupancy growth and 9 consecutive quarters of rental rate growth 1) Comprised of $75MM secured revolving credit facility entered into in July 2024 and additional $75MM in October 2024 (this facility contains an accordion feature for up to $500MM of total capacity, subject to approvals); the borrowing base under the revolving credit facility is based on the value of the Company’s senior living communities that secure its obligations. 2) As of June 30, 2024. 7

Q2’24 Earnings and Other Recent Highlights Organic Operational and Financial Improvements, Coupled with ~$30MM of Equity Deployed for Pending Property Acquisitions § Same-Store Weighted Average Occupancy: 86.2% / 230 bps increase vs. Q2’23 (2)(3) § Same-Store RevPOR: $4,263 / 8.4% increase vs. Q2’23 (1) Operational (2) § Same-Store Community NOI: $17.7MM / 31.1% increase vs. Q2’23 (2) § Same-Store Community NOI Margin: 28.2% / 450 bps increase vs. Q2’23 § Acquired one community for ~$12MM comprising 100 units (AL and MC) in May 2024 § Acquired eight communities for ~$102MM ($50MM representing Sonida’s share of transaction Closed and value through two separate JVs) in May and July 2024 Announced Acquisitions & § Acquired eight communities for ~$103MM comprising 555 units (~70% AL and ~30% MC) across Investments Florida and South Carolina (the “Palm” Communities) on October 1, 2024 (totaling § Significant pipeline of additional acquisition opportunities in various phases of diligence, ~$250MM) including two additional communities located in Georgia currently under contract for ~$29MM, which represents a purchase price of approximately $173k per unit 1) Same-store community owned senior housing portfolio includes operating results and data for 61 communities 3) Sonida defines RevPOR, or average monthly revenue per occupied unit, as resident revenue for the period, divided by consolidated as of Q2’24 and excludes May 9, 2024 acquisition of one community in Macedonia, Ohio and the weighted average number of occupied units in the corresponding portfolio for the period, divided by the number of May 29, 2024 acquisition of four communities in TX and GA through a JV. months in the period. 2) These are non-GAAP financial metrics; please see Appendix for reconciliations of these non-GAAP financial measures. 8
Investment Highlights

Investment Highlights Senior Housing Sector Supported by Favorable Industry Tailwinds 1 Differentiated Owner / Operator / Investor Platform 2 Attractive Organic Growth Characteristics Across Regionally- 3 Focused Portfolio Positioned to Leverage Platform to Pursue Compelling 4 External Growth Opportunities Seasoned Management Team and Board with Experience Scaling Real 5 Estate and Operating Businesses 10

Senior Housing Sector Supported by Favorable Industry Tailwinds 1 Strong Sector Tailwinds Supported by Favorable Supply / Demand Dynamics Senior Housing Demand Current Supply Trend Unlikely to Meet Senior Housing Demand 80+ Demographic Growth Rates – Census Bureau Projections ’24-’30 Occupied Senior Housing Units (000s) – Top 99 Markets Highest on Record Total U.S. 80+ population anticipated to grow by 36.5%+ through 2030 950 925 36.5% 30.8% 900 24.8% 5MM Additional 850 18.5% 80+ Seniors by 2030 10.5% 800 7.1% 7.3% 5.3% 4.8% 3.7% 4.4% 3.1% 750 3.3% 700 2024 2024 20 2025 25 2026 2026 2027 2027 2028 2028 2029 2029 2030 2030 2019 2020 2021 2022 2023 2024 80+ Pop. YoY Increase 80+ Pop. % Increase vs. 2023 12% ~19MM Senior Housing Supply X Estimated Estimated Q4’23 Senior Housing Construction Starts Down ~66% from L5Y Average (1) Penetration Rate 80+ Pop. In 2030 10,000 Senior Housing Starts = 2.3MM 7,500 Last 5 Year-Average: ~6,400 Expected Demand (in units) of Senior Housing in 2030 5,000 2,227 2,500 With current occupied senior housing units of 925k, plus estimated ~2.3k construction starts per quarter, current supply - level unlikely to meet demand in 2030 Q1'19 Q2'19 Q3'19 Q4'19 Q1'20 Q2'20 Q3'20 Q4'20 Q1'21 Q2'21 Q3'21 Q4'21 Q1'22 Q2'22 Q3'22 Q4'22 Q1'23 Q2'23 Q3'23 Q4'23 Source: Data sourced from US Census, NIC MAP, Green Street and PWC Emerging Trends in Real Estate 2024. 1) Per Green Street 2024 Senior Housing Outlook Report dated January 23, 2024 11
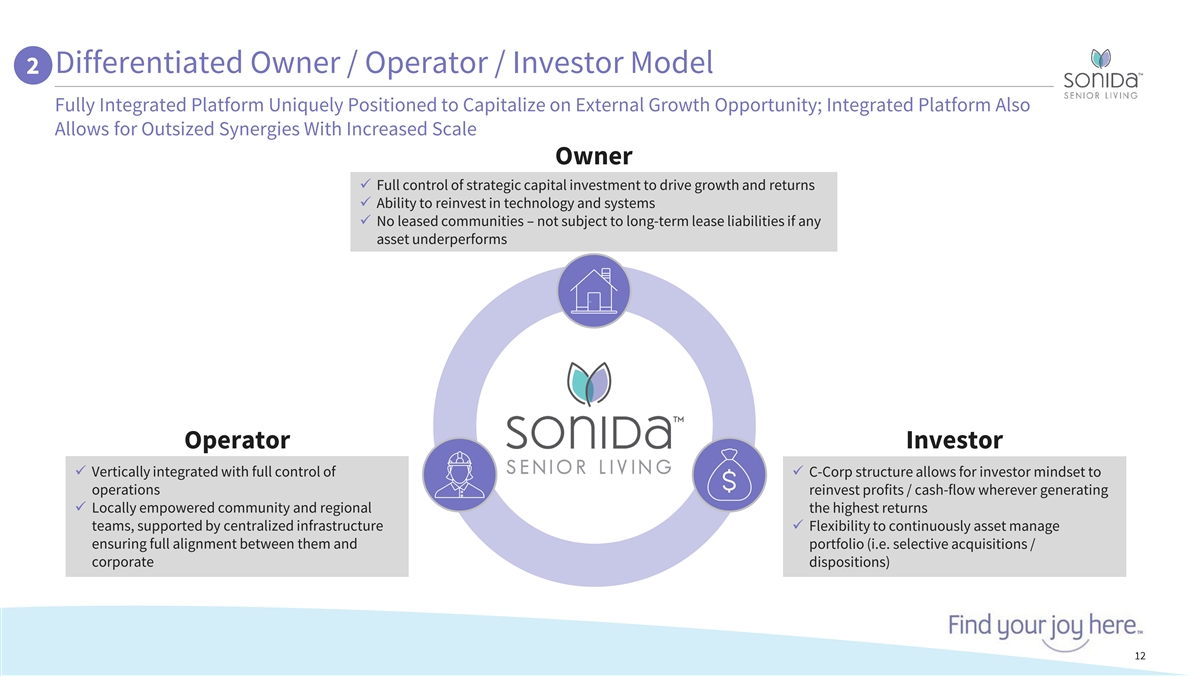
Differentiated Owner / Operator / Investor Model 2 Fully Integrated Platform Uniquely Positioned to Capitalize on External Growth Opportunity; Integrated Platform Also Allows for Outsized Synergies With Increased Scale Owner ü Full control of strategic capital investment to drive growth and returns ü Ability to reinvest in technology and systems ü No leased communities – not subject to long-term lease liabilities if any asset underperforms Operator Investor ü Vertically integrated with full control of ü C-Corp structure allows for investor mindset to operations reinvest profits / cash-flow wherever generating ü Locally empowered community and regional the highest returns teams, supported by centralized infrastructure ü Flexibility to continuously asset manage ensuring full alignment between them and portfolio (i.e. selective acquisitions / corporate dispositions) 12
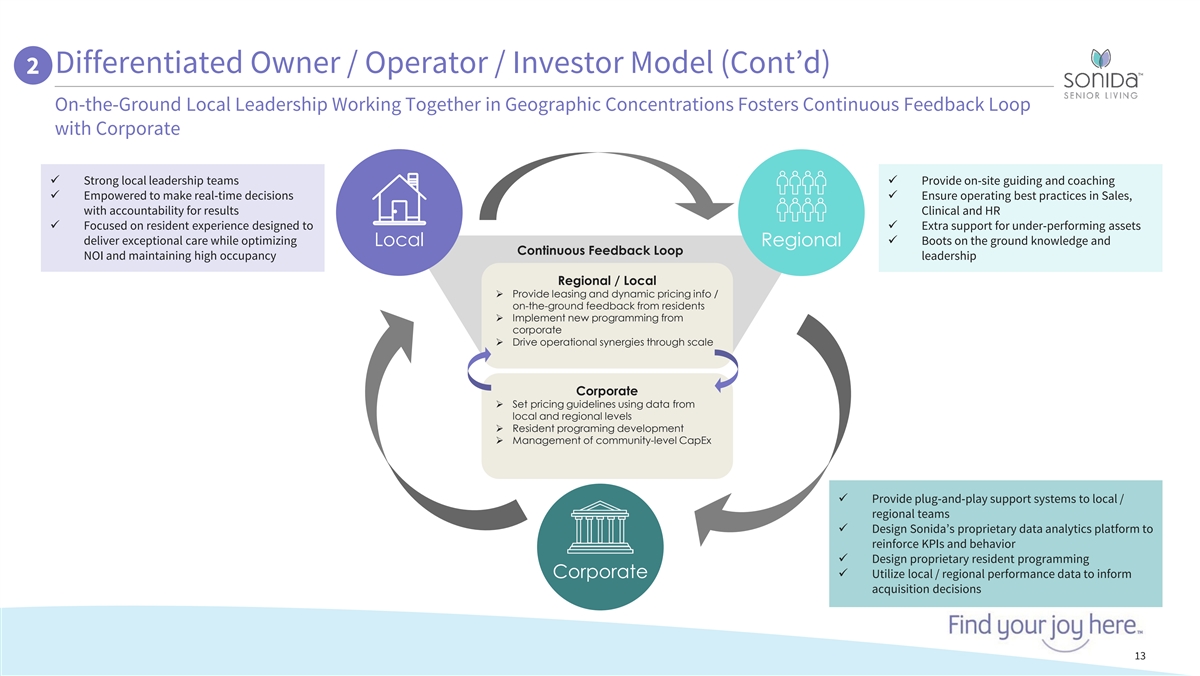
Differentiated Owner / Operator / Investor Model (Cont’d) 2 On-the-Ground Local Leadership Working Together in Geographic Concentrations Fosters Continuous Feedback Loop with Corporate ü Strong local leadership teamsü Provide on-site guiding and coaching ü Empowered to make real-time decisions ü Ensure operating best practices in Sales, with accountability for results Clinical and HR ü Focused on resident experience designed to ü Extra support for under-performing assets deliver exceptional care while optimizing ü Boots on the ground knowledge and Local Regional Continuous Feedback Loop NOI and maintaining high occupancy leadership Regional / Local Ø Provide leasing and dynamic pricing info / on-the-ground feedback from residents Ø Implement new programming from corporate Ø Drive operational synergies through scale Corporate Ø Set pricing guidelines using data from local and regional levels Ø Resident programing development Ø Management of community-level CapEx ü Provide plug-and-play support systems to local / regional teams ü Design Sonida’s proprietary data analytics platform to reinforce KPIs and behavior ü Design proprietary resident programming Corporateü Utilize local / regional performance data to inform acquisition decisions 13

Select Operational Turnaround Case Studies 2 Excellent Track Record in Turning Around Underperforming Assets to Drive Improvement in Key Metrics The Waterford at Mansfield The Wellington at North Bend Crossing ü Identified market need for Memory Care unitsü Invested ~$700K to improve all common areas and ü Converted 24 Assisted Living units to Memory Care refresh Memory Care with $1.3MM of CapEx investmentü Hired strong, experienced Executive Director and ü Hired strong Executive Director with previous Clinical Leader to support strong sales leadership regional experience and market knowledgeü Drove expansion in each key metric below and ended June ’24 at 100% occupancy Occupancy Rental Rate NOI Margin Occupancy Rental Rate NOI Margin 97% 96% $4,983 33% 29% $4,810 81% 79% $4,015 21% $4,509 15% Mansfield, Ohio Cincinnati, Ohio Q2'22 Q2'24 Q2'22 Q2'24 Q2'22 Q2'24 Q2'22 Q2'24 Q2'22 Q2'24 Q2'22 Q2'24 The Waterford at Creekside The Waterford at Cooper ü Invested ~$600K in physical property improvements ü Recruited leader with multi-site experience to lead to refresh each of the Memory Care villas community ü Recruited and hired Executive Director with ü Invested in common area improvements to refresh experience in higher acuity setting both Assisted Living and Memory Care ü Revised staffing model to allow for more staff ü Significantly improved programming and dining stability and removed premium contract labor offerings to drive strong market reputation ü Introduced levels of care to support the service model and drive margin Occupancy Rental Rate NOI Margin Note: Decrease in Occupancy Rental Rate NOI Margin occupancy offset by $5,568 82% 33% $6,145 increase in rental rates, 94% 21% leading to increased NOI 86% 59% $4,575 and NOI margins $4,728 13% 7% Pensacola, Florida Arlington, Texas Q2'22 Q2'24 Q2'22 Q2'24 Q2'22 Q2'24 Q2'22 Q2'24 Q2'22 Q2'24 Q2'22 Q2'24 14

3 Attractive Organic Growth Characteristics Across Regionally-Focused Portfolio Favorable Demographic Exposure has Translated to Best-in-Class Operational Results (1)(2) (2) % Senior Housing Exposure Senior Housing Occupancy (1) Based on Latest Available Quarter Results Based on % of Latest Available Quarter Results NOI Change Since Q4’19 (Pre-COVID) 86.2% (6) 100% 85.7% 98% +480bps (157bps) (6) 78.1% 26% (690bps) REIT Average REIT Average (4)(7) (4) (SHOP Only) (SHOP Only) % Units 36% -% -% (5) Leased (2)(3) (2) Senior Housing Same-Store NOI YoY Growth Senior Housing Same-Store RevPOR YoY Growth Based on Latest Available Quarter Results Based on Latest Available Quarter Results Same-Store NOI QoQ Growth (vs Q1’24) 31.1% 8.4% 28.7% +18.8% +6.4% (6) 4.1% (6) 12.6% 2.8% (1.3%) REIT Average REIT Average (4) (4) (SHOP Only) (SHOP Only) 1) Data as of June 30, 2024; for BKD, based on unit count; for all others, based on Q2’24 NOI. 2) AHR (included in REIT average) excludes Integrated Senior Health Campuses (“ISHC”) segment. 3) For SNDA, reflects Community NOI growth YoY as of Q2’24 4) REIT average based on a simple average for AHR, NHI, SBRA, VTR, and WELL; includes SHOP portion of portfolios only (i.e., does not include senior housing NNN). 5) Based on reported leased unit count as of Q2’24. 15 6) For Brookdale, 98% senior housing exposure excludes 2% of SNF exposure within CCRC segment; however, senior housing occupancy of 78.1%, same-store NOI YoY growth of 12.6% and same-store RevPOR YoY growth of 4.3% inclusive of the CCRC segment. 7) 85.7% occupancy based on simple average of WELL, VTR, AHR, NHI and SBRA; however, (157bps) only includes WELL, VTR and SBRA.(AHR not public pre-COVID; NHI has no RIDEA senior housing exposure pre-COVID)
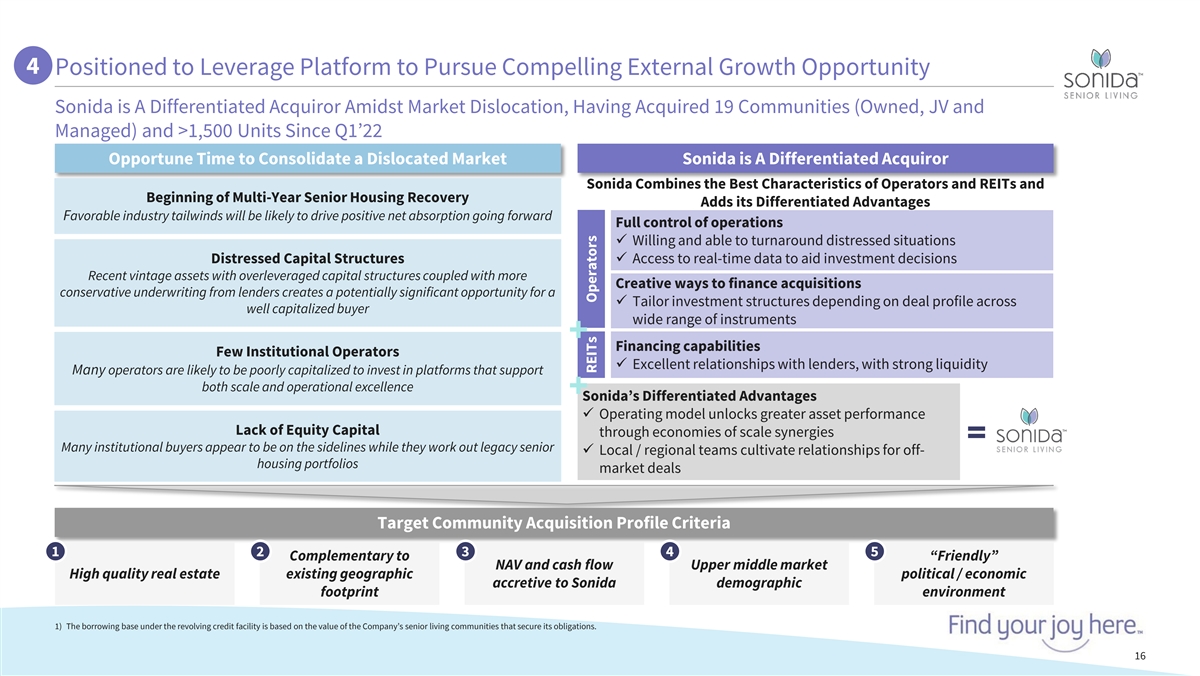
4 Positioned to Leverage Platform to Pursue Compelling External Growth Opportunity Sonida is A Differentiated Acquiror Amidst Market Dislocation, Having Acquired 19 Communities (Owned, JV and Managed) and >1,500 Units Since Q1’22 Opportune Time to Consolidate a Dislocated Market Sonida is A Differentiated Acquiror Sonida Combines the Best Characteristics of Operators and REITs and Beginning of Multi-Year Senior Housing Recovery Adds its Differentiated Advantages Favorable industry tailwinds will be likely to drive positive net absorption going forward Full control of operations ü Willing and able to turnaround distressed situations Distressed Capital Structuresü Access to real-time data to aid investment decisions Recent vintage assets with overleveraged capital structures coupled with more Creative ways to finance acquisitions conservative underwriting from lenders creates a potentially significant opportunity for a ü Tailor investment structures depending on deal profile across well capitalized buyer wide range of instruments + Financing capabilities Few Institutional Operators ü Excellent relationships with lenders, with strong liquidity Many operators are likely to be poorly capitalized to invest in platforms that support both scale and operational excellence + Sonida’s Differentiated Advantages ü Operating model unlocks greater asset performance Lack of Equity Capital through economies of scale synergies = Many institutional buyers appear to be on the sidelines while they work out legacy senior ü Local / regional teams cultivate relationships for off- housing portfolios market deals Target Community Acquisition Profile Criteria 1 2 3 4 5 Complementary to “Friendly” NAV and cash flow Upper middle market High quality real estate existing geographic political / economic accretive to Sonida demographic footprint environment 1) The borrowing base under the revolving credit facility is based on the value of the Company’s senior living communities that secure its obligations. 16 REITs Operators
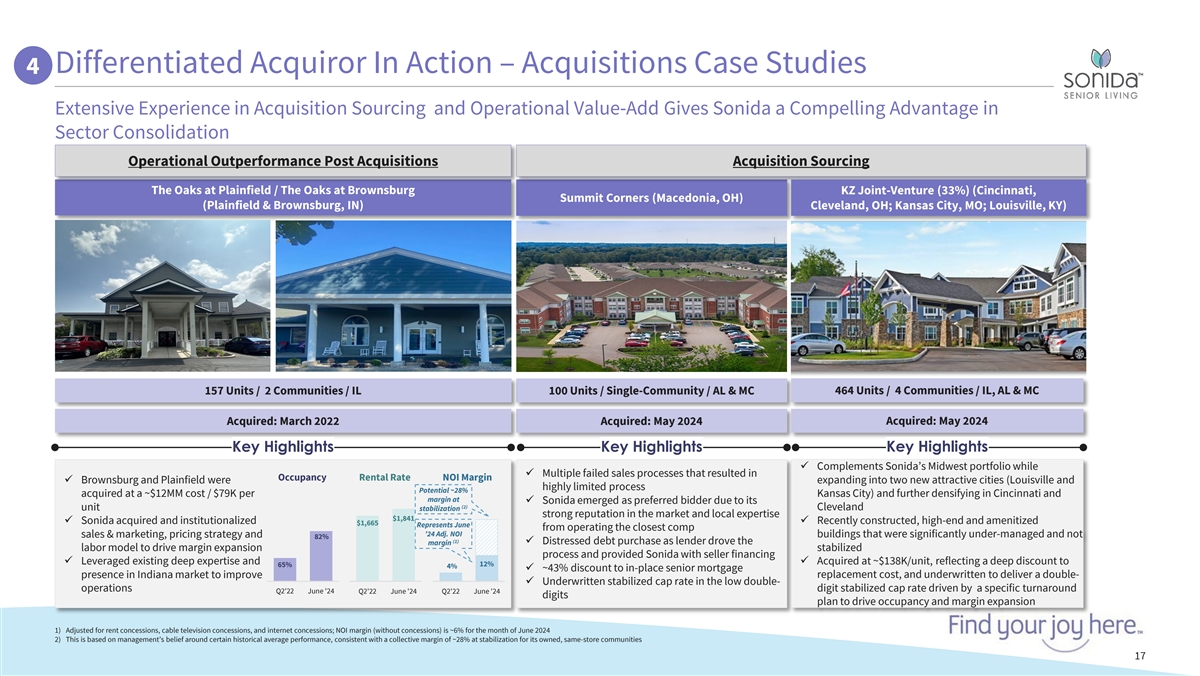
Differentiated Acquiror In Action – Acquisitions Case Studies 4 Extensive Experience in Acquisition Sourcing and Operational Value-Add Gives Sonida a Compelling Advantage in Sector Consolidation Operational Outperformance Post Acquisitions Acquisition Sourcing The Oaks at Plainfield / The Oaks at Brownsburg KZ Joint-Venture (33%) (Cincinnati, Summit Corners (Macedonia, OH) (Plainfield & Brownsburg, IN) Cleveland, OH; Kansas City, MO; Louisville, KY) 157 Units / 2 Communities / IL 100 Units / Single-Community / AL & MC 464 Units / 4 Communities / IL, AL & MC Acquired: May 2024 Acquired: March 2022 Acquired: May 2024 Key Highlights Key Highlights Key Highlights ü Complements Sonida’s Midwest portfolio while ü Multiple failed sales processes that resulted in Occupancy Rental Rate NOI Margin ü Brownsburg and Plainfield were expanding into two new attractive cities (Louisville and highly limited process Potential ~28% acquired at a ~$12MM cost / $79K per Kansas City) and further densifying in Cincinnati and margin at ü Sonida emerged as preferred bidder due to its (2) unit stabilization Cleveland strong reputation in the market and local expertise $1,841 ü Sonida acquired and institutionalized ü Recently constructed, high-end and amenitized $1,665 Represents June from operating the closest comp ’24 Adj. NOI buildings that were significantly under-managed and not sales & marketing, pricing strategy and 82% (1) ü Distressed debt purchase as lender drove the margin labor model to drive margin expansion stabilized process and provided Sonida with seller financing ü Leveraged existing deep expertise and ü Acquired at ~$138K/unit, reflecting a deep discount to 65% 12% 4% ü ~43% discount to in-place senior mortgage presence in Indiana market to improve replacement cost, and underwritten to deliver a double- ü Underwritten stabilized cap rate in the low double- operations digit stabilized cap rate driven by a specific turnaround Q2'22 June '24 Q2'22 June '24 Q2'22 June '24 digits plan to drive occupancy and margin expansion 1) Adjusted for rent concessions, cable television concessions, and internet concessions; NOI margin (without concessions) is ~6% for the month of June 2024 2) This is based on management’s belief around certain historical average performance, consistent with a collective margin of ~28% at stabilization for its owned, same-store communities 17

5 Seasoned Management Team and Board with Experience Scaling Operating Businesses Full Management Team Has >200 Years of Combined Experience Supported by Highly-Experienced Board of Directors Across Healthcare, Finance, and Real Estate Brandon Ribar, President, CEO, and Director David Johnson, Chairman Benjamin Harris § Prior to joining Sonida in 2019, Brandon served as senior vice president of operational § Director since 2021§ Director since 2021 finance and strategy at Golden Living § Co-founder and managing director of Horizon § Founder and CEO of Pinedale Capital Partners § Before that, he served as vice president of healthcare investments at Fillmore Capital Capital § Previously, he was the CEO of Link Logistics Partners § Prior to Horizon Capital, he founded and president of Gramercy Property Trust Aimbridge Hospitality and served as its CEO Kevin Detz, Chief Financial Officer § Prior to joining Sonida in 2022, Kevin held various leadership roles at Aimbridge Elliot Zibel, CFA Jill Krueger Hospitality, most recently serving as executive vice president and operational chief financial officer § Director since 2021§ Director since 2004 § Before that, he was a vice president and controller for Goldman Sachs and an audit § Recently founded ClariFi Health and was the § Founding president and CEO of Symbria, Inc. manager for Ernst & Young founder and CEO of Select Dental § Previously, she was a partner at KPMG LLP Management Mike Fryar, Chief Revenue Officer § Prior to joining Sonida in 2019, Mike served as vice president of GN Hearing North America Lilly Donohue Noah Beren § Before that, he served as senior director of marketing at Starkey Hearing Technologies and as an account director at marketing agency Colle McVoy § Director since 2024§ Director since 2021 § Currently president and CEO of Everstory § Currently head of asset management for GF Partners (formerly StoneMor Inc.) Investments Max Levy, Chief Investment Officer § Most recently served as CEO of Holiday § Previously, he served as a vice president at a § Prior to joining Sonida in 2024, Max served as principal at Conversant Capital Retirement (led sale of senior housing private independent oil and gas company § Before that, he was an analyst at The Baupost Group and an investment banking analyst portfolio to Welltower) and was previously for Hentschel & Company President of Fortress Investment Group China § Served as director of Sonida since 2021 and currently serves on the board of Crossroads Impact, a U.S.-based impact lender Robert Grove Shmuel Lieberman Tabitha Obenour, Chief Clinical Officer § Director since 2024§ Director since 2021 § Prior to joining Sonida in 2023, Tabitha was at Enlivant, most recently serving as the § Principal at Conversant since May 2020§ Currently a senior member of the investment company’s vice president of clinical quality and compliance team at GF Investments § Previously, he served as a senior analyst at § She previously was at Genesis Healthcare, as its manager of clinical operations Viking Global Investors§ Shmuel has been an observer to a number of portfolio companies 18

Palm Portfolio Acquisition
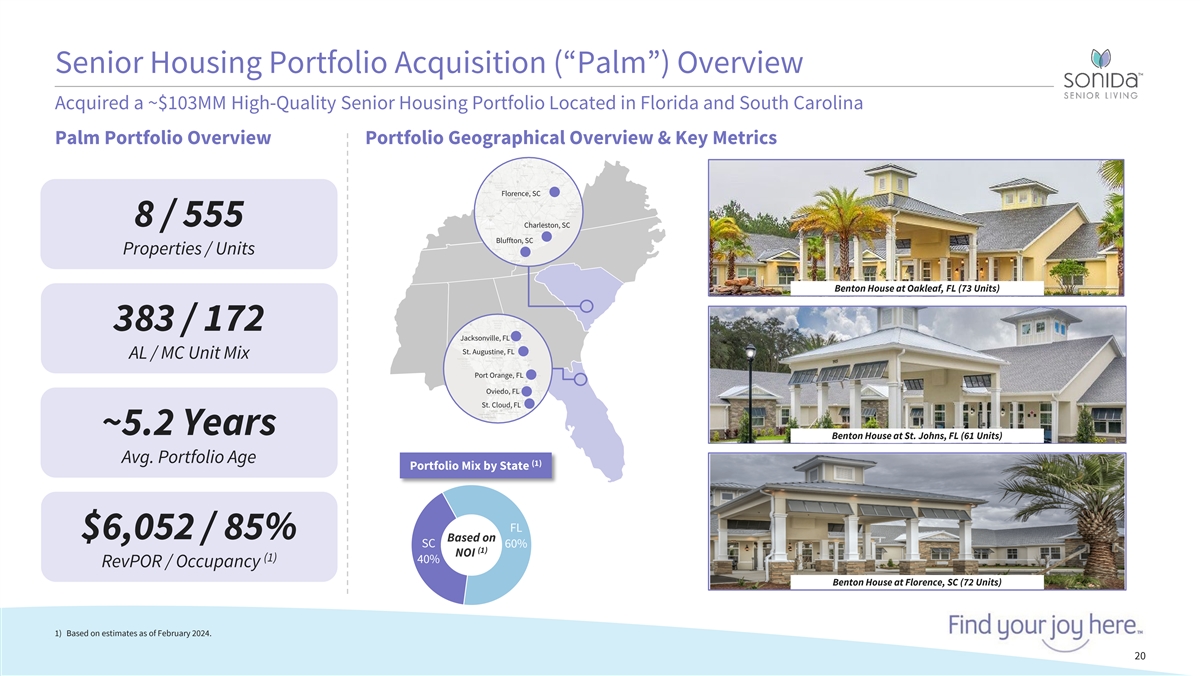
Senior Housing Portfolio Acquisition (“Palm”) Overview Acquired a ~$103MM High-Quality Senior Housing Portfolio Located in Florida and South Carolina Palm Portfolio Overview Portfolio Geographical Overview & Key Metrics Florence, SC 8 / 555 Charleston, SC Bluffton, SC Properties / Units Benton House at Oakleaf, FL (73 Units) 383 / 172 Jacksonville, FL St. Augustine, FL AL / MC Unit Mix Port Orange, FL Oviedo, FL St. Cloud, FL ~5.2 Years Benton House at St. Johns, FL (61 Units) Avg. Portfolio Age (1) Portfolio Mix by State FL $6,052 / 85% Based on SC 60% (1) NOI (1) 40% RevPOR / Occupancy Benton House at Florence, SC (72 Units) 1) Based on estimates as of February 2024. 20
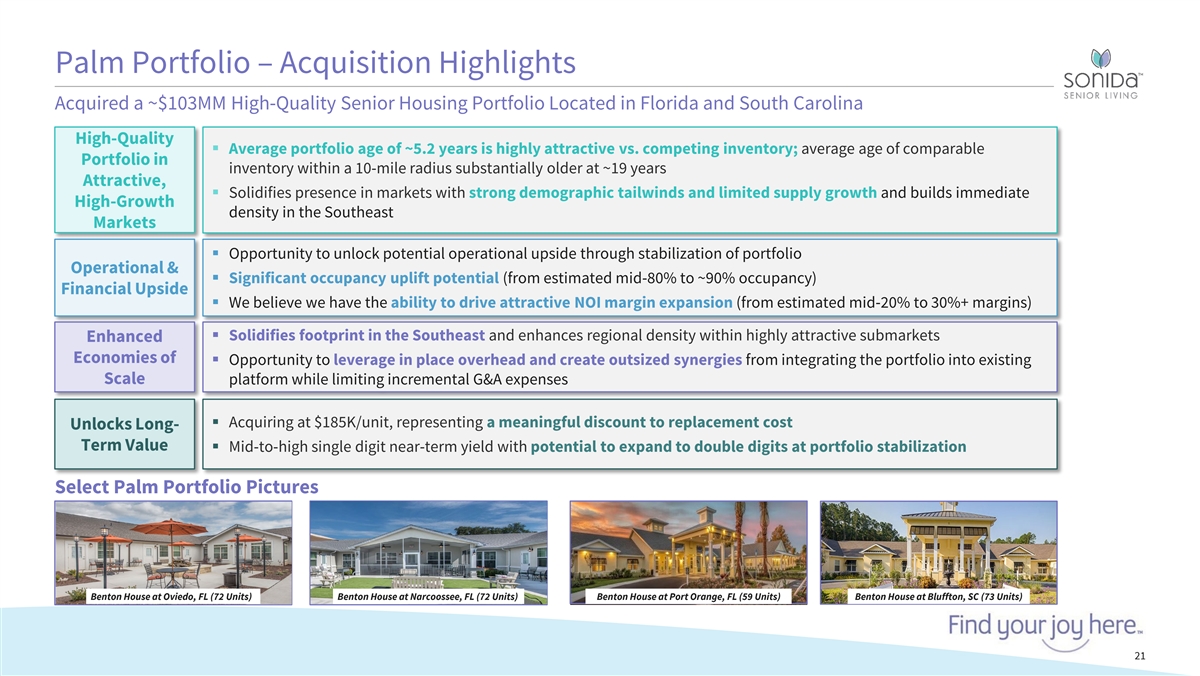
Palm Portfolio – Acquisition Highlights Acquired a ~$103MM High-Quality Senior Housing Portfolio Located in Florida and South Carolina High-Quality § Average portfolio age of ~5.2 years is highly attractive vs. competing inventory; average age of comparable Portfolio in inventory within a 10-mile radius substantially older at ~19 years Attractive, § Solidifies presence in markets with strong demographic tailwinds and limited supply growth and builds immediate High-Growth density in the Southeast Markets § Opportunity to unlock potential operational upside through stabilization of portfolio Operational & § Significant occupancy uplift potential (from estimated mid-80% to ~90% occupancy) Financial Upside § We believe we have the ability to drive attractive NOI margin expansion (from estimated mid-20% to 30%+ margins) § Solidifies footprint in the Southeast and enhances regional density within highly attractive submarkets Enhanced Economies of § Opportunity to leverage in place overhead and create outsized synergies from integrating the portfolio into existing Scale platform while limiting incremental G&A expenses § Acquiring at $185K/unit, representing a meaningful discount to replacement cost Unlocks Long- Term Value § Mid-to-high single digit near-term yield with potential to expand to double digits at portfolio stabilization Select Palm Portfolio Pictures Benton House at Oviedo, FL (72 Units) Benton House at Narcoossee, FL (72 Units) Benton House at Port Orange, FL (59 Units) Benton House at Bluffton, SC (73 Units) 21