Exhibit 99.2

3Q 2013 Stockholder Supplement November 6, 2013
 This presentation, other written or oral communications and our public documents to which we refer contain or incorporate by reference certain forward-looking statements which are based on various assumptions (some of which are beyond our control) that may be identified by reference to a future period or periods or by the use of forward-looking terminology, such as "may," "will," "believe," "expect," "anticipate," "continue," or similar terms or variations on those terms or the negative of those terms. Actual results could differ materially from those set forth in forward-looking statements due to a variety of factors, including, but not limited to, changes in interest rates; changes in the yield curve; changes in prepayment rates; the availability of mortgage-backed securities for purchase; the availability of financing and, if available, the terms of any financings; changes in the market value of our assets; changes in business conditions and the general economy; our ability to integrate and grow the commercial mortgage business; our ability to consummate any contemplated investment opportunities; risks associated with the businesses of our subsidiaries, including the investment advisory business of our wholly-owned subsidiary, including the removal by clients of assets managed, its regulatory requirements, and competition in the investment advisory business; risks associated with the broker-dealer business of our wholly-owned subsidiary; changes in government regulations affecting our business; our ability to maintain our qualification as a REIT for federal income tax purposes; and our ability to maintain our exemption from registration under the Investment Company Act of 1940, as amended. For a discussion of the risks and uncertainties which could cause actual results to differ from those contained in the forward-looking statements, see "Risk Factors" in our most recent Annual Report on Form 10-K and any subsequent Quarterly Reports on Form 10-Q. We do not undertake, and specifically disclaim any obligation, to publicly release the result of any revisions which may be made to any forward-looking statements to reflect the occurrence of anticipated or unanticipated events or circumstances after the date of such statements. Safe Harbor Notice
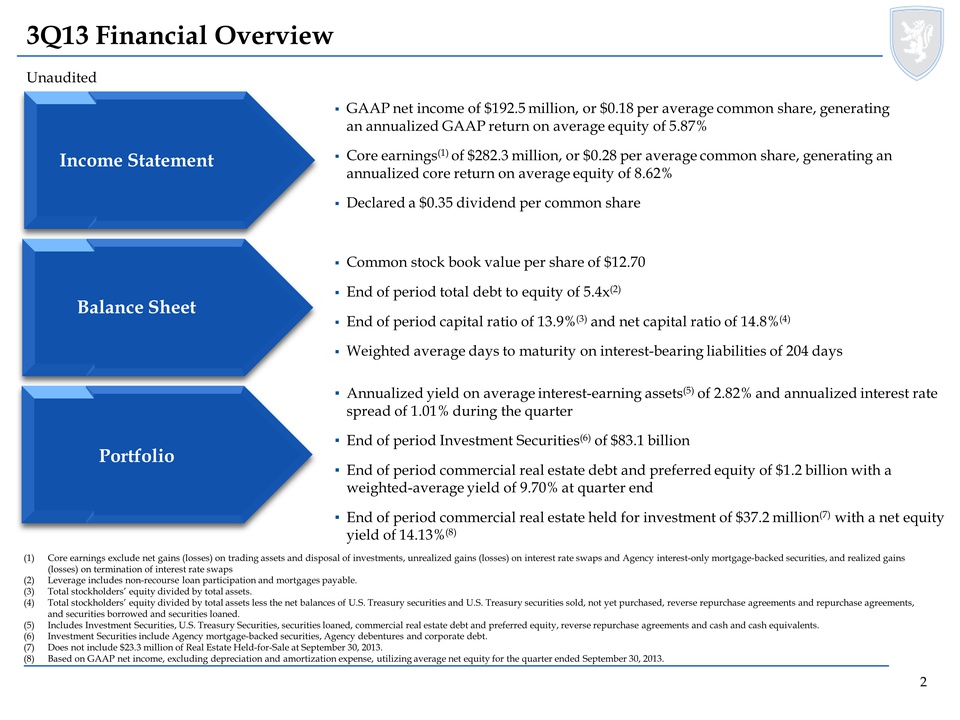 (1)Core earnings exclude net gains (losses) on trading assets and disposal of investments, unrealized gains (losses) on interest rate swaps and Agency interest-only mortgage-backed securities, and realized gains (losses) on termination of interest rate swaps (2)Leverage includes non-recourse loan participation and mortgages payable. (3)Total stockholders’ equity divided by total assets. (4)Total stockholders’ equity divided by total assets less the net balances of U.S. Treasury securities and U.S. Treasury securities sold, not yet purchased, reverse repurchase agreements and repurchase agreements, and securities borrowed and securities loaned. (5)Includes Investment Securities, U.S. Treasury Securities, securities loaned, commercial real estate debt and preferred equity, reverse repurchase agreements and cash and cash equivalents. (6)Investment Securities include Agency mortgage-backed securities, Agency debentures and corporate debt. (7)Does not include $23.3 million of Real Estate Held-for-Sale at September 30, 2013. (8)Based on GAAP net income, excluding depreciation and amortization expense, utilizing average net equity for the quarter ended September 30, 2013. 3Q13 Financial Overview GAAP net income of $192.5 million, or $0.18 per average common share, generating an annualized GAAP return on average equity of 5.87% Core earnings(1) of $282.3 million, or $0.28 per average common share, generating an annualized core return on average equity of 8.62% Declared a $0.35 dividend per common share Common stock book value per share of $12.70 End of period total debt to equity of 5.4x(2) End of period capital ratio of 13.9%(3) and net capital ratio of 14.8%(4) Weighted average days to maturity on interest-bearing liabilities of 204 days ▪Annualized yield on average interest-earning assets(5) of 2.82% and annualized interest rate spread of 1.01% during the quarter ▪End of period Investment Securities(6) of $83.1 billion ▪End of period commercial real estate debt and preferred equity of $1.2 billion with a weighted-average yield of 9.70% at quarter end ▪End of period commercial real estate held for investment of $37.2 million(7) with a net equity yield of 14.13%(8) Income Statement Balance Sheet Portfolio Unaudited
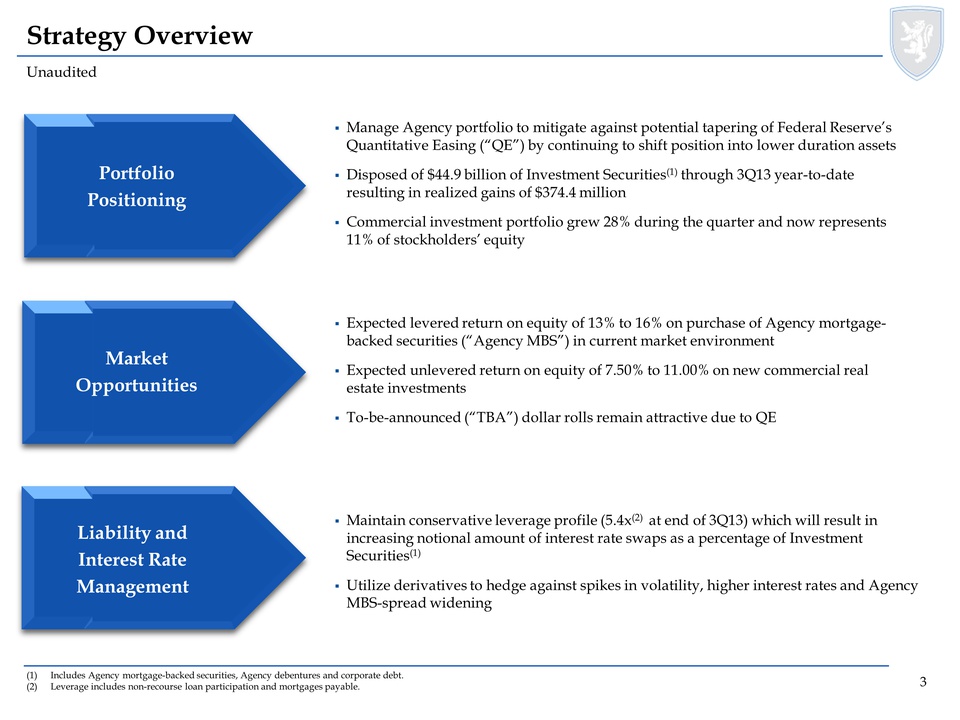 (1)Includes Agency mortgage-backed securities, Agency debentures and corporate debt. (2)Leverage includes non-recourse loan participation and mortgages payable. Strategy Overview Expected levered return on equity of 13% to 16% on purchase of Agency mortgage-backed securities (“Agency MBS”) in current market environment Expected unlevered return on equity of 7.50% to 11.00% on new commercial real estate investments To-be-announced (“TBA”) dollar rolls remain attractive due to QE Maintain conservative leverage profile (5.4x(2) at end of 3Q13) which will result in increasing notional amount of interest rate swaps as a percentage of Investment Securities(1) Utilize derivatives to hedge against spikes in volatility, higher interest rates and Agency MBS-spread widening Portfolio Positioning Market Opportunities Liability and Interest Rate Management Manage Agency portfolio to mitigate against potential tapering of Federal Reserve’s Quantitative Easing (“QE”) by continuing to shift position into lower duration assets Disposed of $44.9 billion of Investment Securities(1) through 3Q13 year-to-date resulting in realized gains of $374.4 million Commercial investment portfolio grew 28% during the quarter and now represents 11% of stockholders’ equity Unaudited
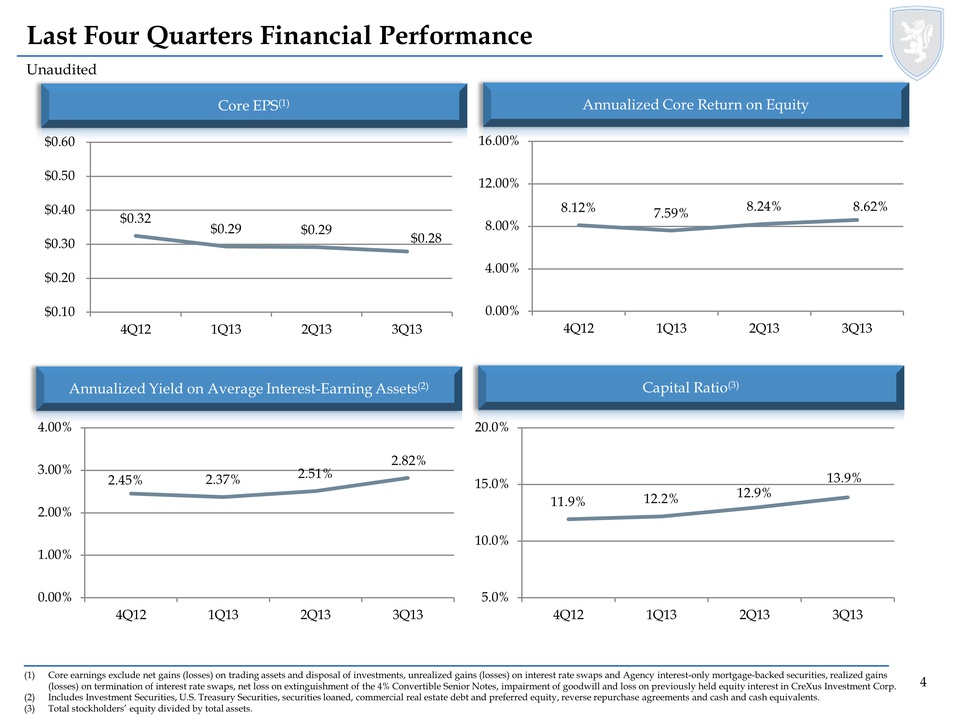 Last Four Quarters Financial Performance (1)Core earnings exclude net gains (losses) on trading assets and disposal of investments, unrealized gains (losses) on interest rate swaps and Agency interest-only mortgage-backed securities, realized gains (losses) on termination of interest rate swaps, net loss on extinguishment of the 4% Convertible Senior Notes, impairment of goodwill and loss on previously held equity interest in CreXus Investment Corp. (2)Includes Investment Securities, U.S. Treasury Securities, securities loaned, commercial real estate debt and preferred equity, reverse repurchase agreements and cash and cash equivalents. (3)Total stockholders’ equity divided by total assets. Unaudited Core EPS(1) Annualized Core Return on Equity Annualized Yield on Average Interest-Earning Assets(2) Capital Ratio(3) $0.32 $0.29 $0.29 $0.28 $0.10$0.20$0.30$0.40$0.50$0.604Q121Q132Q133Q138.12% 7.59% 8.24% 8.62% 0.00%4.00%8.00%12.00%16.00%4Q121Q132Q133Q132.45% 2.37% 2.51% 2.82% 0.00%1.00%2.00%3.00%4.00%4Q121Q132Q133Q1311.9% 12.2% 12.9% 13.9% 5.0%10.0%15.0%20.0%4Q121Q132Q133Q13
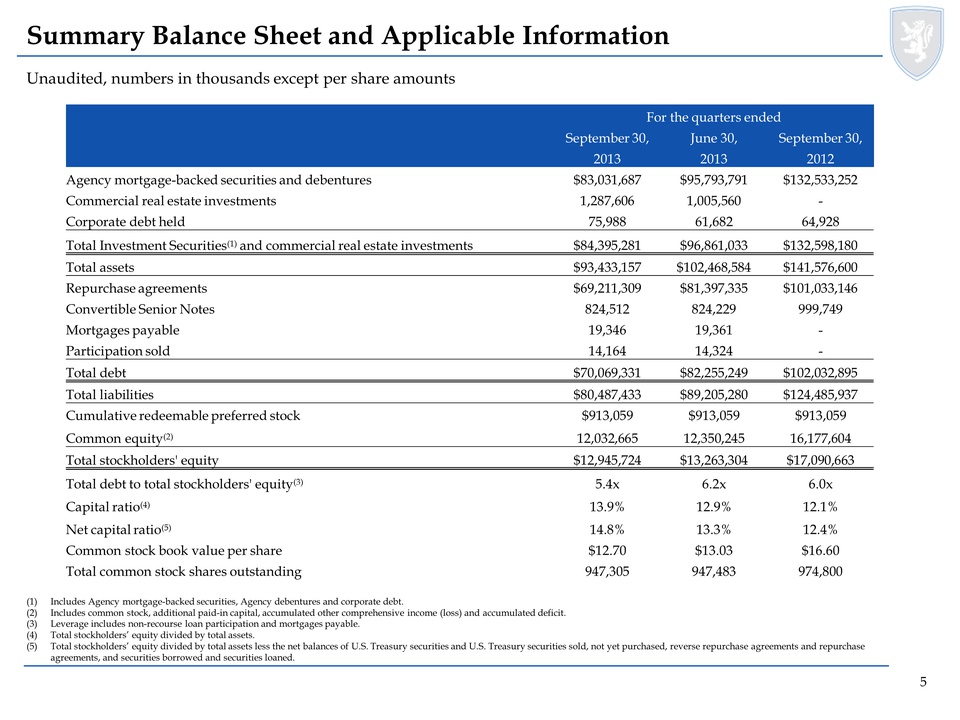 Unaudited, numbers in thousands except per share amounts Summary Balance Sheet and Applicable Information (1) Includes Agency mortgage-backed securities, Agency debentures and corporate debt. (2)Includes common stock, additional paid-in capital, accumulated other comprehensive income (loss) and accumulated deficit. (3)Leverage includes non-recourse loan participation and mortgages payable. (4)Total stockholders’ equity divided by total assets. (5)Total stockholders’ equity divided by total assets less the net balances of U.S. Treasury securities and U.S. Treasury securities sold, not yet purchased, reverse repurchase agreements and repurchase agreements, and securities borrowed and securities loaned. For the quarters ended September 30, June 30, September 30, 2013 2013 2012 Agency mortgage-backed securities and debentures $83,031,687 $95,793,791 $132,533,252 Commercial real estate investments 1,287,606 1,005,560 - Corporate debt held 75,988 61,682 64,928 Total Investment Securities(1) and commercial real estate investments $84,395,281 $96,861,033 $132,598,180 Total assets $93,433,157 $102,468,584 $141,576,600 Repurchase agreements $69,211,309 $81,397,335 $101,033,146 Convertible Senior Notes 824,512 824,229 999,749 Mortgages payable 19,346 19,361 - Participation sold 14,164 14,324 - Total debt $70,069,331 $82,255,249 $102,032,895 Total liabilities $80,487,433 $89,205,280 $124,485,937 Cumulative redeemable preferred stock $913,059 $913,059 $913,059 Common equity(2) 12,032,665 12,350,245 16,177,604 Total stockholders' equity $12,945,724 $13,263,304 $17,090,663 Total debt to total stockholders' equity(3) 5.4x 6.2x 6.0x Capital ratio(4) 13.9% 12.9% 12.1% Net capital ratio(5) 14.8% 13.3% 12.4% Common stock book value per share $12.70 $13.03 $16.60 Total common stock shares outstanding 947,305 947,483 974,800
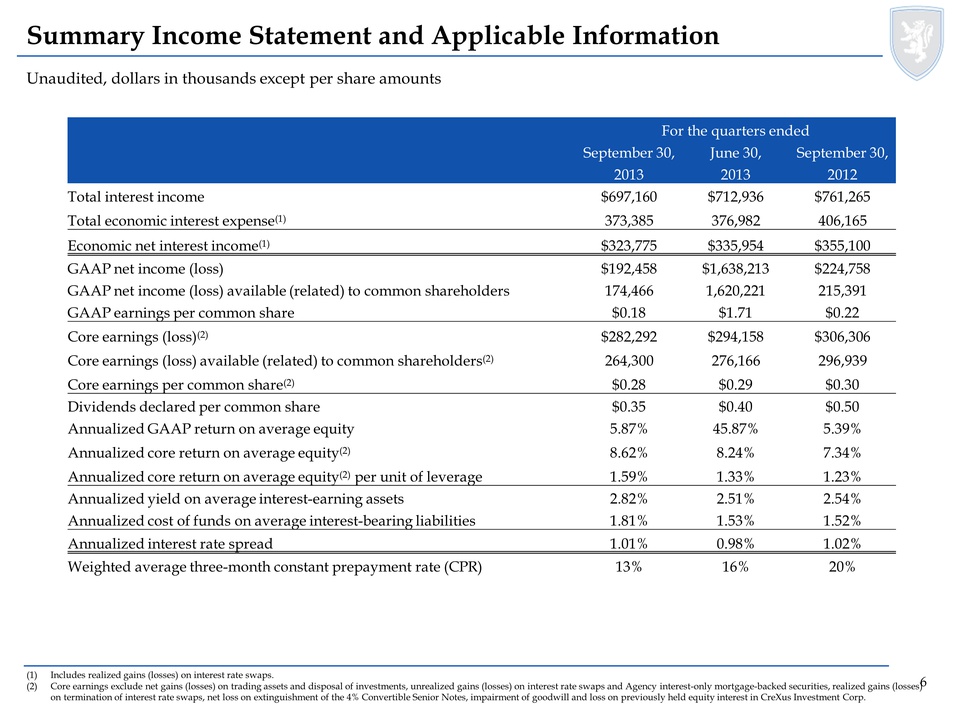 Unaudited, dollars in thousands except per share amounts Summary Income Statement and Applicable Information (1)Includes realized gains (losses) on interest rate swaps. (2)Core earnings exclude net gains (losses) on trading assets and disposal of investments, unrealized gains (losses) on interest rate swaps and Agency interest-only mortgage-backed securities, realized gains (losses) on termination of interest rate swaps, net loss on extinguishment of the 4% Convertible Senior Notes, impairment of goodwill and loss on previously held equity interest in CreXus Investment Corp. For the quarters ended September 30, June 30, September 30, 2013 2013 2012 Total interest income $697,160 $712,936 $761,265 Total economic interest expense(1) 373,385 376,982 406,165 Economic net interest income(1) $323,775 $335,954 $355,100 GAAP net income (loss) $192,458 $1,638,213 $224,758 GAAP net income (loss) available (related) to common shareholders 174,466 1,620,221 215,391 GAAP earnings per common share $0.18 $1.71 $0.22 Core earnings (loss)(2) $282,292 $294,158 $306,306 Core earnings (loss) available (related) to common shareholders(2) 264,300 276,166 296,939 Core earnings per common share(2) $0.28 $0.29 $0.30 Dividends declared per common share $0.35 $0.40 $0.50 Annualized GAAP return on average equity 5.87% 45.87% 5.39% Annualized core return on average equity(2) 8.62% 8.24% 7.34% Annualized core return on average equity(2) per unit of leverage 1.59% 1.33% 1.23% Annualized yield on average interest-earning assets 2.82% 2.51% 2.54% Annualized cost of funds on average interest-bearing liabilities 1.81% 1.53% 1.52% Annualized interest rate spread 1.01% 0.98% 1.02% Weighted average three-month constant prepayment rate (CPR) 13% 16% 20%
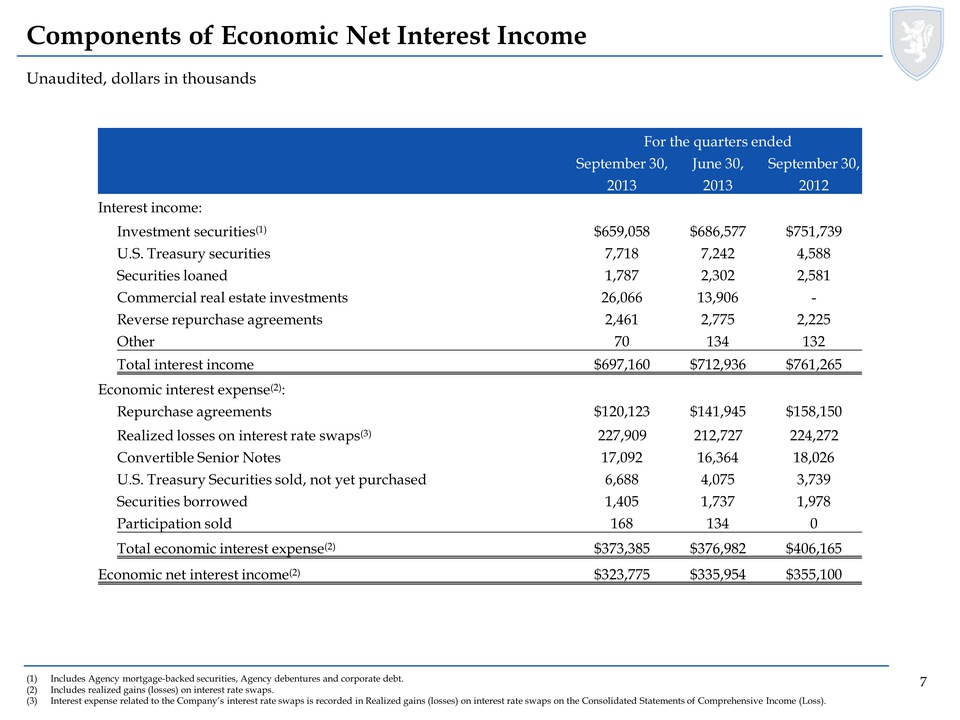 Unaudited, dollars in thousands Components of Economic Net Interest Income (1)Includes Agency mortgage-backed securities, Agency debentures and corporate debt. (2)Includes realized gains (losses) on interest rate swaps. (3)Interest expense related to the Company’s interest rate swaps is recorded in Realized gains (losses) on interest rate swaps on the Consolidated Statements of Comprehensive Income (Loss). For the quarters ended September 30, June 30, September 30, 2013 2013 2012 Interest income: Investment securities(1) $659,058 $686,577 $751,739 U.S. Treasury securities 7,718 7,242 4,588 Securities loaned 1,787 2,302 2,581 Commercial real estate investments 26,066 13,906 - Reverse repurchase agreements 2,461 2,775 2,225 Other 70 134 132 Total interest income $697,160 $712,936 $761,265 Economic interest expense(2): Repurchase agreements $120,123 $141,945 $158,150 Realized losses on interest rate swaps(3) 227,909 212,727 224,272 Convertible Senior Notes 17,092 16,364 18,026 U.S. Treasury Securities sold, not yet purchased 6,688 4,075 3,739 Securities borrowed 1,405 1,737 1,978 Participation sold 168 134 0 Total economic interest expense(2) $373,385 $376,982 $406,165 Economic net interest income(2) $323,775 $335,954 $355,100
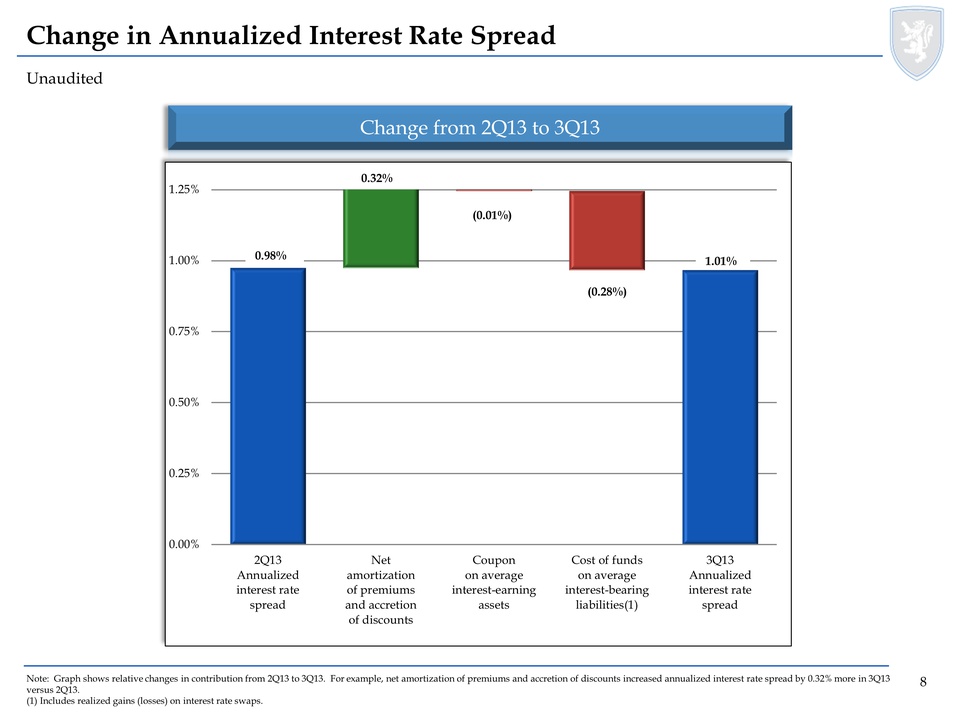 Unaudited Change in Annualized Interest Rate Spread Change from 2Q13 to 3Q13 Note: Graph shows relative changes in contribution from 2Q13 to 3Q13. For example, net amortization of premiums and accretion of discounts increased annualized interest rate spread by 0.32% more in 3Q13 versus 2Q13. (1) Includes realized gains (losses) on interest rate swaps. 0.32% 0.00%0.25%0.50%0.75%1.00%1.25%2Q13Annualizedinterest ratespreadNetamortizationof premiumsand accretionof discountsCouponon averageinterest-earningassetsCost of fundson averageinterest-bearingliabilities(1)3Q13Annualizedinterest ratespread 0.98% (0.01%) (0.28%) 1.01%
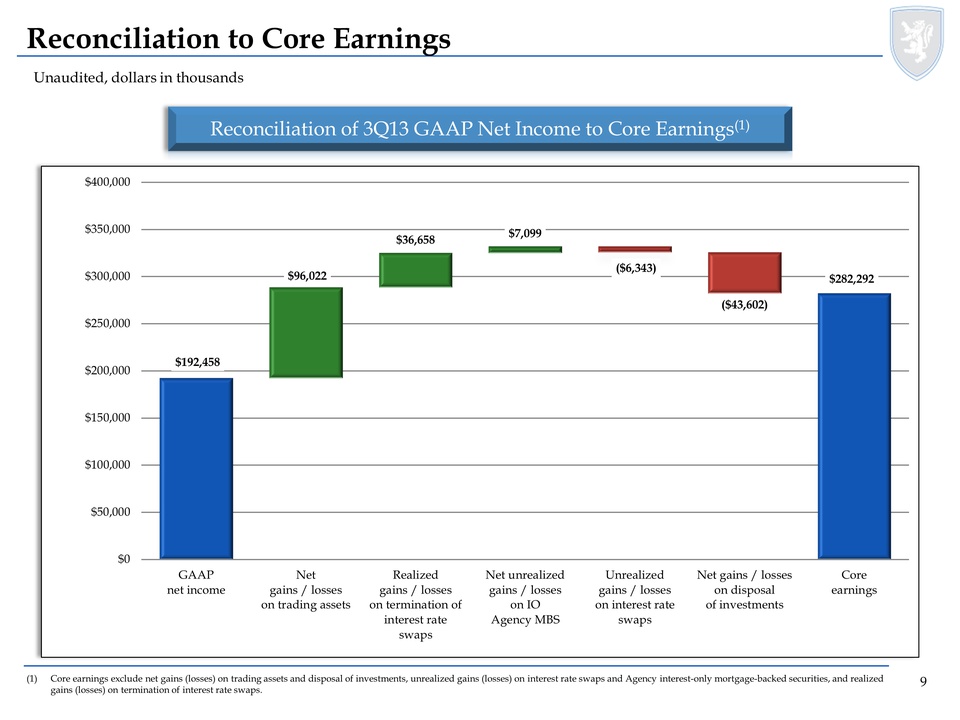
Unaudited, dollars in thousands Reconciliation to Core Earnings Reconciliation of 3Q13 GAAP Net Income to Core Earnings(1) (1)Core earnings exclude net gains (losses) on trading assets and disposal of investments, unrealized gains (losses) on interest rate swaps and Agency interest-only mortgage-backed securities, and realized gains (losses) on termination of interest rate swaps. $282,292 $36,658 $96,022 $7,099 ($6,343) ($43,602) $192,458 $0$50,000$100,000$150,000$200,000$250,000$300,000$350,000$400,000GAAPnet incomeNetgains / losseson trading assetsRealizedgains / losseson termination ofinterest rateswapsNet unrealizedgains / losseson IOAgency MBSUnrealizedgains / losseson interest rateswapsNet gains / losseson disposalof investmentsCoreearnings
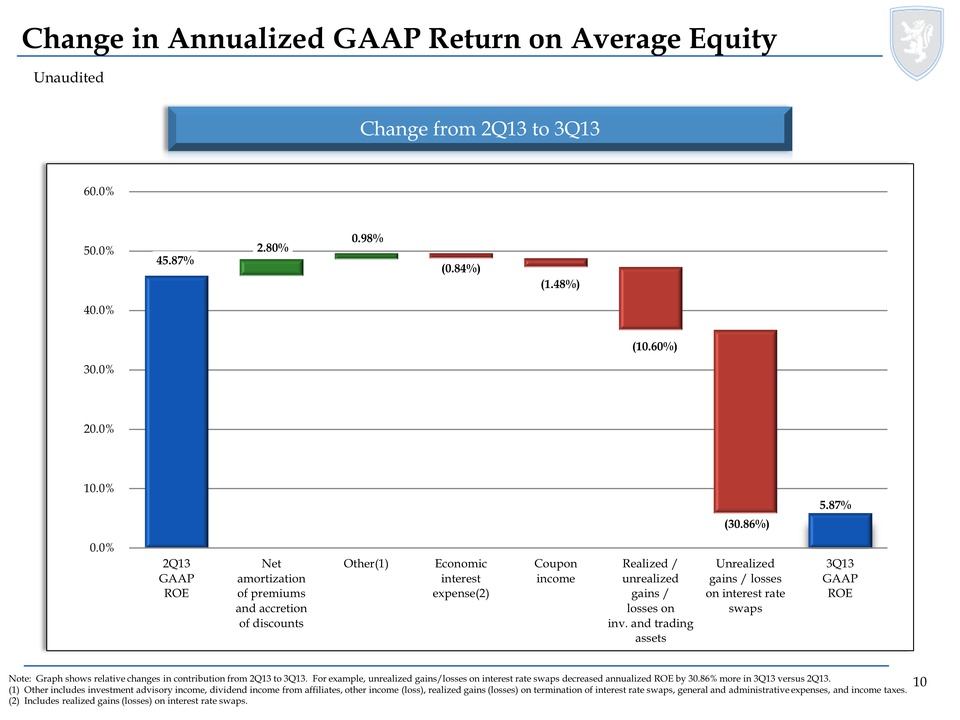 Unaudited Change in Annualized GAAP Return on Average Equity Change from 2Q13 to 3Q13 Note: Graph shows relative changes in contribution from 2Q13 to 3Q13. For example, unrealized gains/losses on interest rate swaps decreased annualized ROE by 30.86% more in 3Q13 versus 2Q13. (1) Other includes investment advisory income, dividend income from affiliates, other income (loss), realized gains (losses) on termination of interest rate swaps, general and administrative expenses, and income taxes. (2) Includes realized gains (losses) on interest rate swaps. 2.80% 0.98% (0.84%) 45.87% 0.0%10.0%20.0%30.0%40.0%50.0%60.0%2Q13GAAPROENetamortizationof premiumsand accretionof discountsOther(1)Economicinterestexpense(2)CouponincomeRealized /unrealizedgains /losses oninv. and tradingassetsUnrealizedgains / losseson interest rateswaps3Q13GAAPROE (30.86%) (10.60%) (1.48%) 5.87%
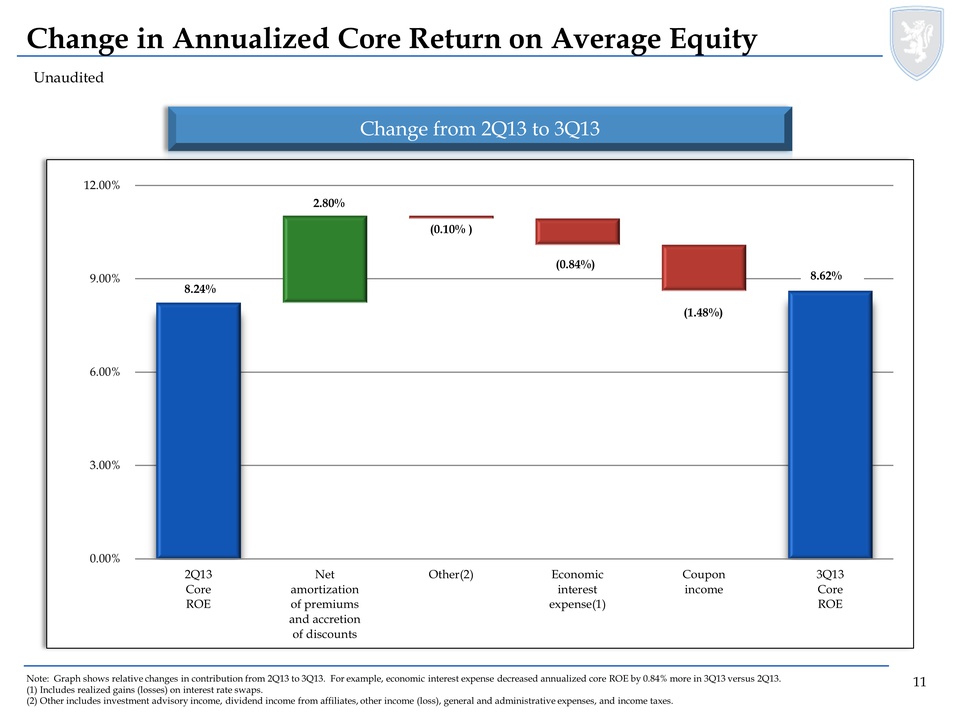 Unaudited Change in Annualized Core Return on Average Equity Change from 2Q13 to 3Q13 Note: Graph shows relative changes in contribution from 2Q13 to 3Q13. For example, economic interest expense decreased annualized core ROE by 0.84% more in 3Q13 versus 2Q13. (1) Includes realized gains (losses) on interest rate swaps. (2) Other includes investment advisory income, dividend income from affiliates, other income (loss), general and administrative expenses, and income taxes. 2.80% (0.10% ) 8.24% 0.00%3.00%6.00%9.00%12.00%2Q13CoreROENetamortizationof premiums and accretion of discountsOther(2)Economicinterestexpense(1)Couponincome3Q13CoreROE (0.84%) (1.48%) 8.62%
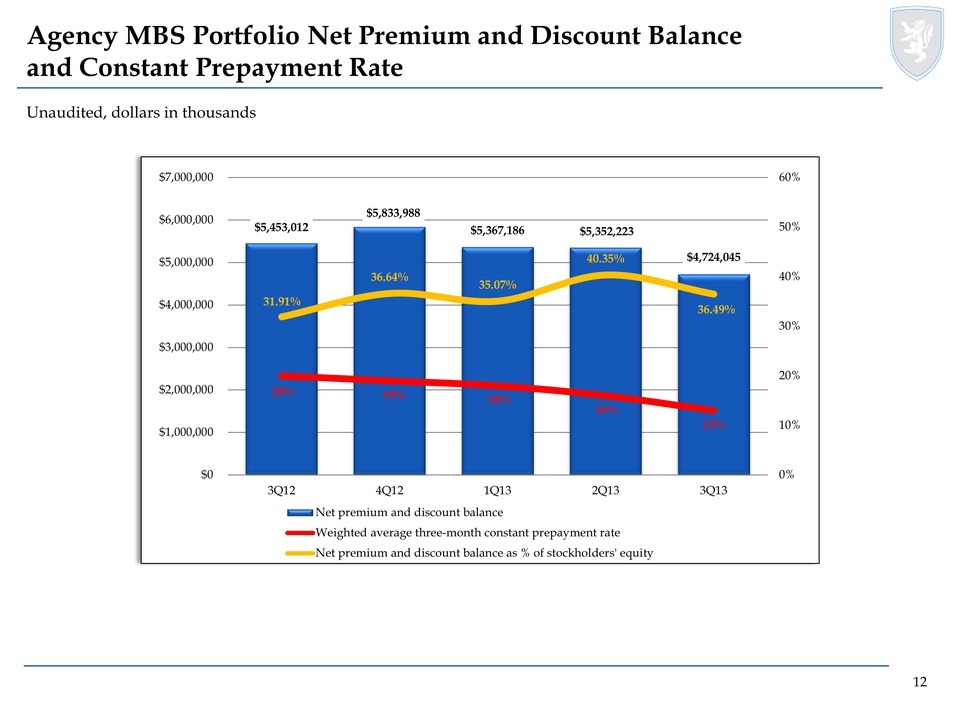 Unaudited, dollars in thousands Agency MBS Portfolio Net Premium and Discount Balance and Constant Prepayment Rate $5,453,012 $5,833,988 $5,367,186 $5,352,223 $4,724,045 20% 19% 18% 16% 13% 31.91% 36.64% 35.07% 40.35% 36.49% 0%10%20%30%40%50%60%$0$1,000,000$2,000,000$3,000,000$4,000,000$5,000,000$6,000,000$7,000,0003Q124Q121Q132Q133Q13Net premium and discount balance Weighted average three-month constant prepayment rate Net premium and discount balance as % of stockholders' equity
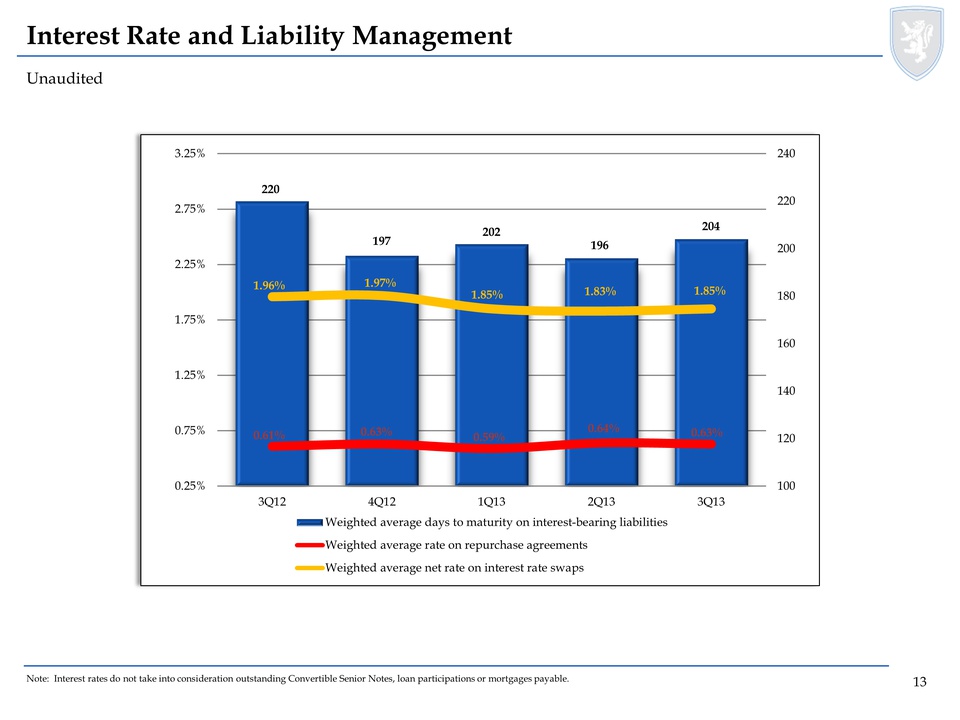
Unaudited Interest Rate and Liability Management Note: Interest rates do not take into consideration outstanding Convertible Senior Notes, loan participations or mortgages payable. 220 197 202 196 204 0.61% 0.63% 0.59% 0.64% 0.63% 1.96% 1.97% 1.85% 1.83% 1.85% 1001201401601802002202400.25%0.75%1.25%1.75%2.25%2.75%3.25%3Q124Q121Q132Q133Q13Weighted average days to maturity on interest-bearing liabilities Weighted average rate on repurchase agreements Weighted average net rate on interest rate swaps
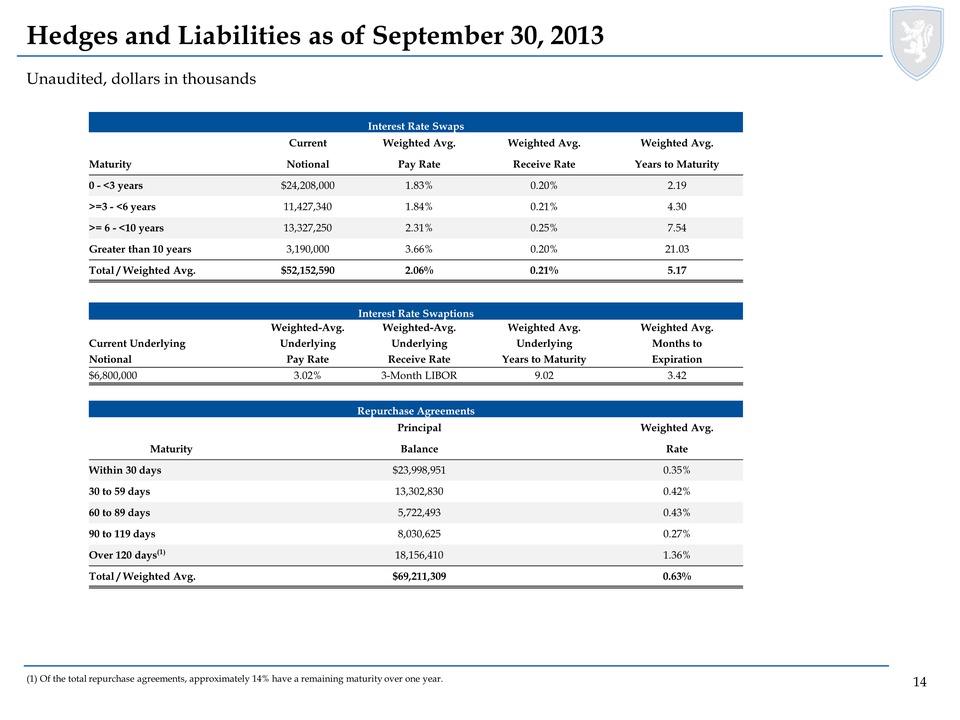 Hedges and Liabilities as of September 30, 2013 Unaudited, dollars in thousands (1) Of the total repurchase agreements, approximately 14% have a remaining maturity over one year. Interest Rate Swaps Current Weighted Avg. Weighted Avg. Weighted Avg. Maturity Notional Pay Rate Receive Rate Years to Maturity 0 - <3 years $24,208,000 1.83% 0.20% 2.19 >=3 - <6 years 11,427,340 1.84% 0.21% 4.30 >= 6 - <10 years 13,327,250 2.31% 0.25% 7.54 Greater than 10 years 3,190,000 3.66% 0.20% 21.03 Total / Weighted Avg. $52,152,590 2.06% 0.21% 5.17 Interest Rate Swaptions Weighted-Avg. Weighted-Avg. Weighted Avg. Weighted Avg. Current Underlying Underlying Underlying Underlying Months to Notional Pay Rate Receive Rate Years to Maturity Expiration $6,800,000 3.02% 3-Month LIBOR 9.02 3.42 Repurchase Agreements Principal Weighted Avg. Maturity Balance Rate Within 30 days $23,998,951 0.35% 30 to 59 days 13,302,830 0.42% 60 to 89 days 5,722,493 0.43% 90 to 119 days 8,030,625 0.27% Over 120 days(1) 18,156,410 1.36% Total / Weighted Avg. $69,211,309 0.63%
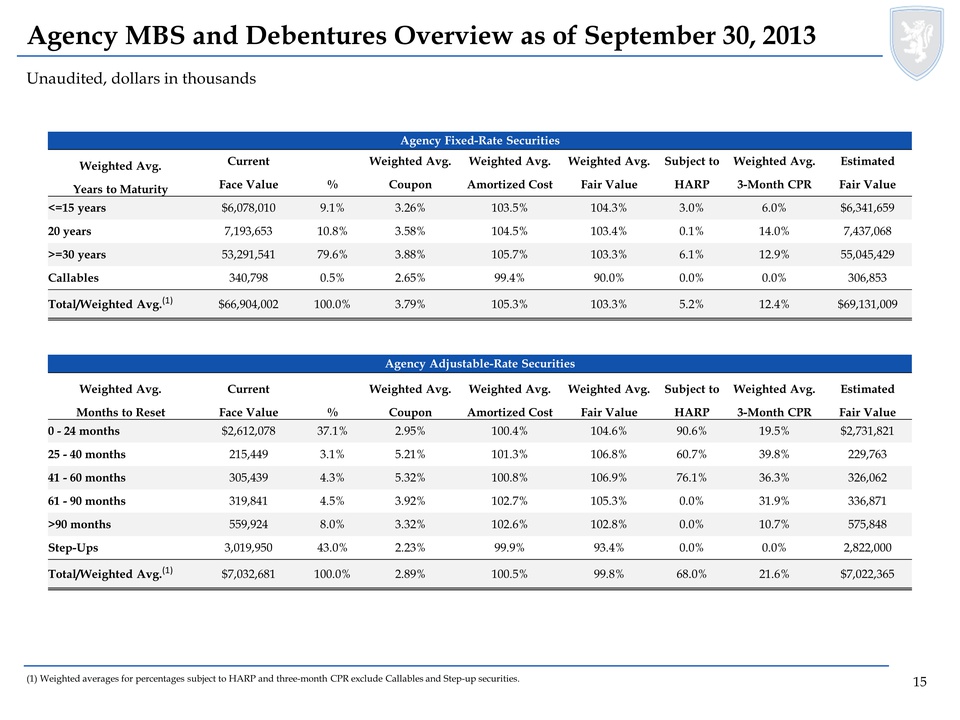 Unaudited, dollars in thousands Agency MBS and Debentures Overview as of September 30, 2013 (1) Weighted averages for percentages subject to HARP and three-month CPR exclude Callables and Step-up securities. Agency Fixed-Rate Securities Weighted Avg. Current Weighted Avg. Weighted Avg. Weighted Avg. Subject to Weighted Avg. Estimated Years to Maturity Face Value % Coupon Amortized Cost Fair Value HARP 3-Month CPR Fair Value <=15 years $6,078,010 9.1% 3.26% 103.5% 104.3% 3.0% 6.0% $6,341,659 20 years 7,193,653 10.8% 3.58% 104.5% 103.4% 0.1% 14.0% 7,437,068 >=30 years 53,291,541 79.6% 3.88% 105.7% 103.3% 6.1% 12.9% 55,045,429 Callables 340,798 0.5% 2.65% 99.4% 90.0% 0.0% 0.0% 306,853 Total/Weighted Avg.(1) $66,904,002 100.0% 3.79% 105.3% 103.3% 5.2% 12.4% $69,131,009 Agency Adjustable-Rate Securities Weighted Avg. Current Weighted Avg. Weighted Avg. Weighted Avg. Subject to Weighted Avg. Estimated Months to Reset Face Value % Coupon Amortized Cost Fair Value HARP 3-Month CPR Fair Value 0 - 24 months $2,612,078 37.1% 2.95% 100.4% 104.6% 90.6% 19.5% $2,731,821 25 - 40 months 215,449 3.1% 5.21% 101.3% 106.8% 60.7% 39.8% 229,763 41 - 60 months 305,439 4.3% 5.32% 100.8% 106.9% 76.1% 36.3% 326,062 61 - 90 months 319,841 4.5% 3.92% 102.7% 105.3% 0.0% 31.9% 336,871 >90 months 559,924 8.0% 3.32% 102.6% 102.8% 0.0% 10.7% 575,848 Step-Ups 3,019,950 43.0% 2.23% 99.9% 93.4% 0.0% 0.0% 2,822,000 Total/Weighted Avg.(1) $7,032,681 100.0% 2.89% 100.5% 99.8% 68.0% 21.6% $7,022,365
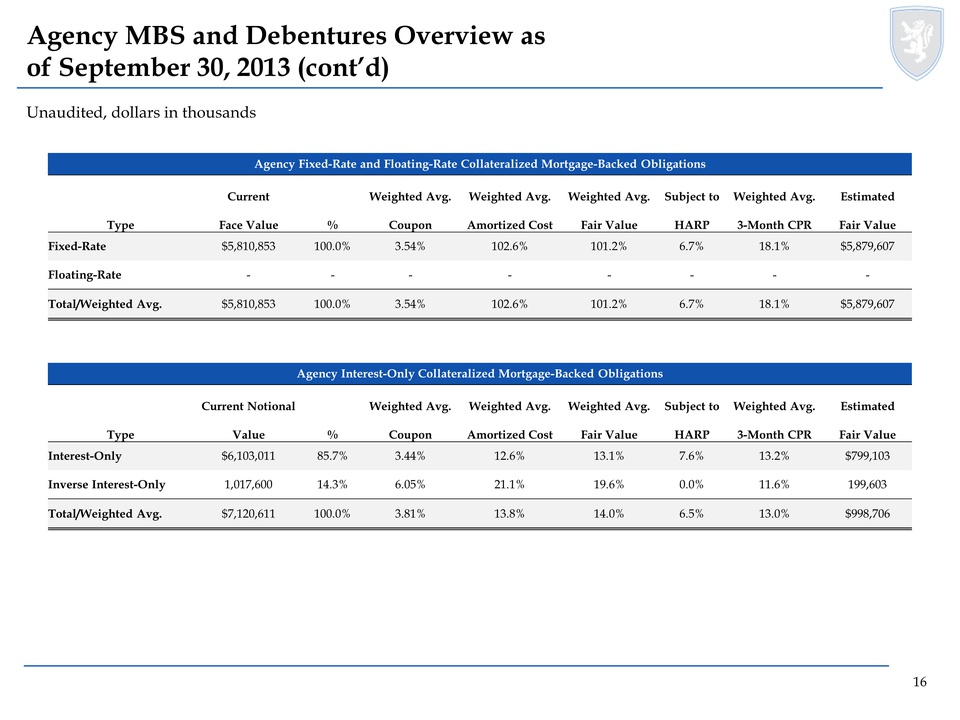 Unaudited, dollars in thousands Agency MBS and Debentures Overview as of September 30, 2013 (cont’d) Agency Fixed-Rate and Floating-Rate Collateralized Mortgage-Backed Obligations Current Weighted Avg. Weighted Avg. Weighted Avg. Subject to Weighted Avg. Estimated Type Face Value % Coupon Amortized Cost Fair Value HARP 3-Month CPR Fair Value Fixed-Rate $5,810,853 100.0% 3.54% 102.6% 101.2% 6.7% 18.1% $5,879,607 Floating-Rate - - - - - - - - Total/Weighted Avg. $5,810,853 100.0% 3.54% 102.6% 101.2% 6.7% 18.1% $5,879,607 Agency Interest-Only Collateralized Mortgage-Backed Obligations Current Notional Weighted Avg. Weighted Avg. Weighted Avg. Subject to Weighted Avg. Estimated Type Value % Coupon Amortized Cost Fair Value HARP 3-Month CPR Fair Value Interest-Only $6,103,011 85.7% 3.44% 12.6% 13.1% 7.6% 13.2% $799,103 Inverse Interest-Only 1,017,600 14.3% 6.05% 21.1% 19.6% 0.0% 11.6% 199,603 Total/Weighted Avg. $7,120,611 100.0% 3.81% 13.8% 14.0% 6.5% 13.0% $998,706
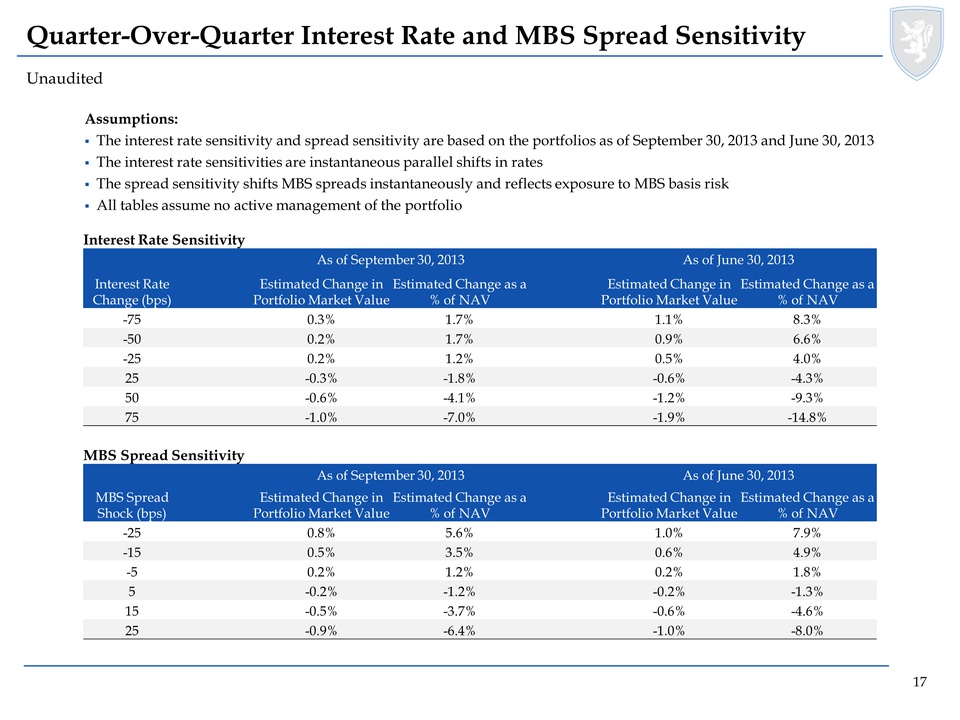 Unaudited Quarter-Over-Quarter Interest Rate and MBS Spread Sensitivity Assumptions: The interest rate sensitivity and spread sensitivity are based on the portfolios as of September 30, 2013 and June 30, 2013 The interest rate sensitivities are instantaneous parallel shifts in rates The spread sensitivity shifts MBS spreads instantaneously and reflects exposure to MBS basis risk All tables assume no active management of the portfolio Interest Rate Sensitivity As of September 30, 2013 As of June 30, 2013 Interest Rate Change (bps) Estimated Change in Portfolio Market Value Estimated Change as a % of NAV Estimated Change in Portfolio Market Value Estimated Change as a % of NAV -75 0.3% 1.7% 1.1% 8.3% -50 0.2% 1.7% 0.9% 6.6% -25 0.2% 1.2% 0.5% 4.0% 25 -0.3% -1.8% -0.6% -4.3% 50 -0.6% -4.1% -1.2% -9.3% 75 -1.0% -7.0% -1.9% -14.8% MBS Spread Sensitivity As of September 30, 2013 As of June 30, 2013 MBS Spread Shock (bps) Estimated Change in Portfolio Market Value Estimated Change as a % of NAV Estimated Change in Portfolio Market Value Estimated Change as a % of NAV -25 0.8% 5.6% 1.0% 7.9% -15 0.5% 3.5% 0.6% 4.9% -5 0.2% 1.2% 0.2% 1.8% 5 -0.2% -1.2% -0.2% -1.3% 15 -0.5% -3.7% -0.6% -4.6% 25 -0.9% -6.4% -1.0% -8.0%
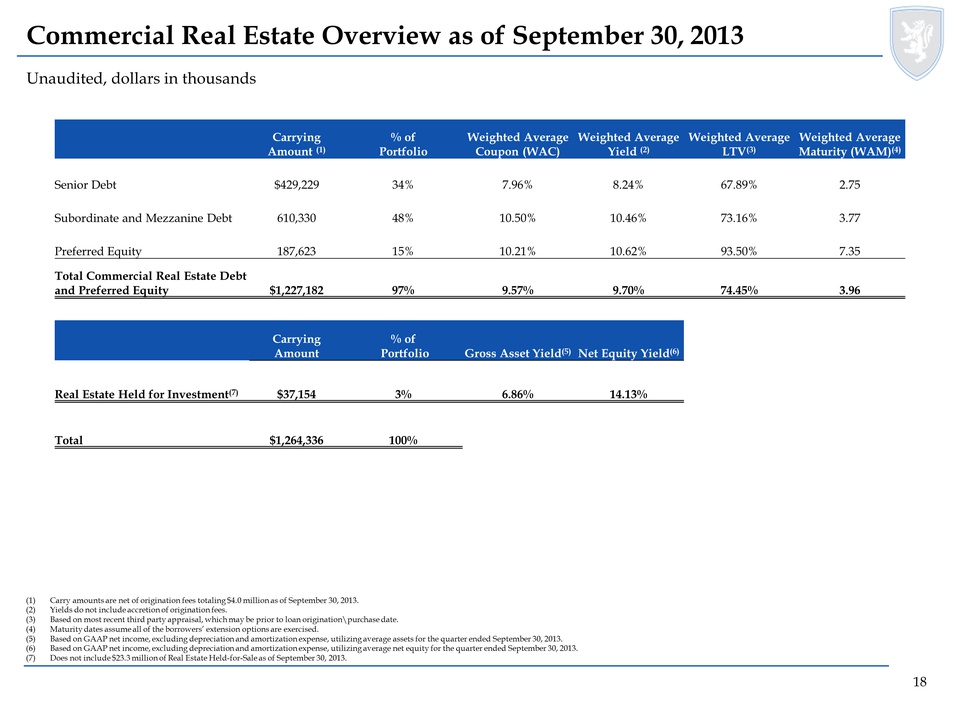
Unaudited, dollars in thousands Commercial Real Estate Overview as of September 30, 2013 (1)Carry amounts are net of origination fees totaling $4.0 million as of September 30, 2013. (2)Yields do not include accretion of origination fees. (3)Based on most recent third party appraisal, which may be prior to loan origination\purchase date. (4)Maturity dates assume all of the borrowers’ extension options are exercised. (5)Based on GAAP net income, excluding depreciation and amortization expense, utilizing average assets for the quarter ended September 30, 2013. (6)Based on GAAP net income, excluding depreciation and amortization expense, utilizing average net equity for the quarter ended September 30, 2013. (7)Does not include $23.3 million of Real Estate Held-for-Sale as of September 30, 2013. Carrying Amount (1) % of Portfolio Weighted Average Coupon (WAC) Weighted Average Yield (2) Weighted Average LTV(3) Weighted Average Maturity (WAM)(4) Senior Debt $429,229 34% 7.96% 8.24% 67.89% 2.75 Subordinate and Mezzanine Debt 610,330 48% 10.50% 10.46% 73.16% 3.77 Preferred Equity 187,623 15% 10.21% 10.62% 93.50% 7.35 Total Commercial Real Estate Debt and Preferred Equity $1,227,182 97% 9.57% 9.70% 74.45% 3.96 Carrying Amount % of Portfolio Gross Asset Yield(5) Net Equity Yield(6) Real Estate Held for Investment(7) $37,154 3% 6.86% 14.13% Total $1,264,336 100%
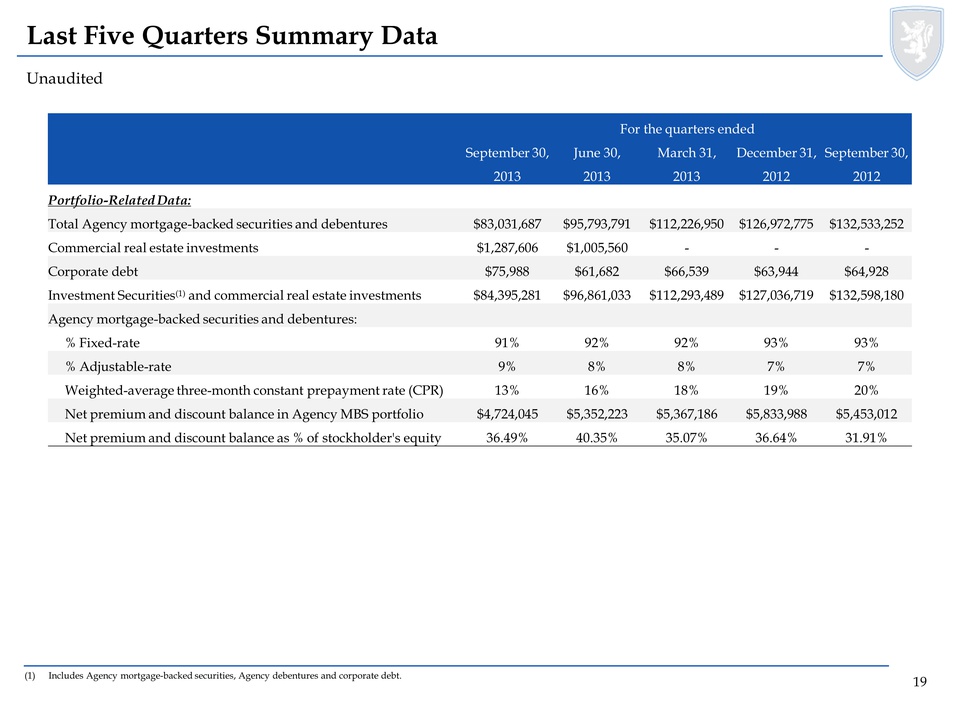 Unaudited Last Five Quarters Summary Data (1)Includes Agency mortgage-backed securities, Agency debentures and corporate debt. For the quarters ended September 30, June 30, March 31, December 31, September 30, 2013 2013 2013 2012 2012 Portfolio-Related Data: Total Agency mortgage-backed securities and debentures $83,031,687 $95,793,791 $112,226,950 $126,972,775 $132,533,252 Commercial real estate investments $1,287,606 $1,005,560 - - - Corporate debt $75,988 $61,682 $66,539 $63,944 $64,928 Investment Securities(1) and commercial real estate investments $84,395,281 $96,861,033 $112,293,489 $127,036,719 $132,598,180 Agency mortgage-backed securities and debentures: % Fixed-rate 91% 92% 92% 93% 93% % Adjustable-rate 9% 8% 8% 7% 7% Weighted-average three-month constant prepayment rate (CPR) 13% 16% 18% 19% 20% Net premium and discount balance in Agency MBS portfolio $4,724,045 $5,352,223 $5,367,186 $5,833,988 $5,453,012 Net premium and discount balance as % of stockholder's equity 36.49% 40.35% 35.07% 36.64% 31.91%
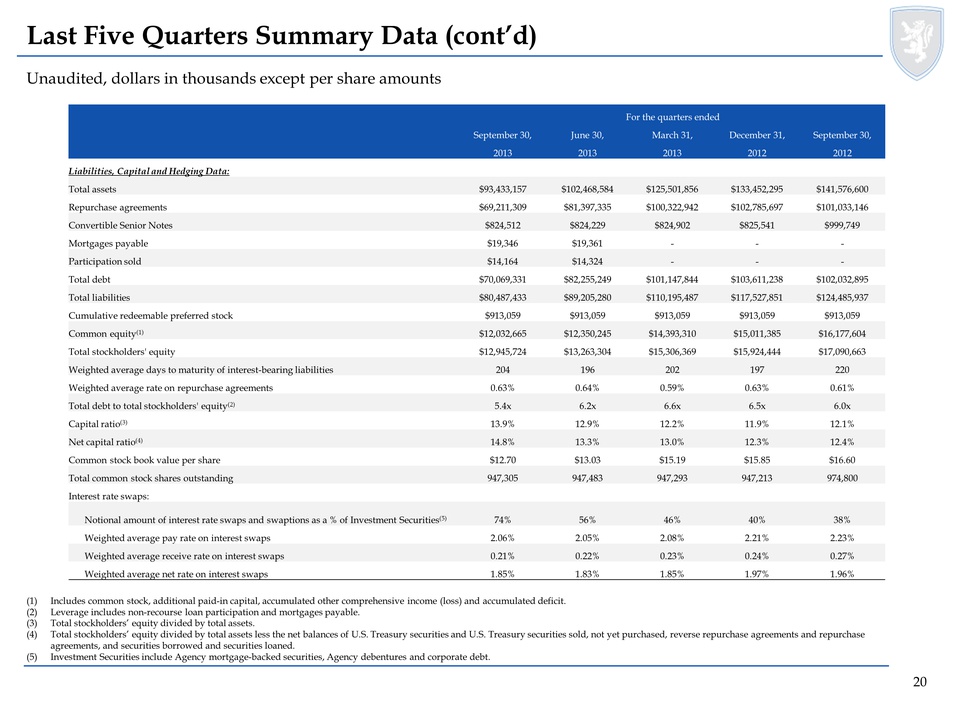 Unaudited, dollars in thousands except per share amounts Last Five Quarters Summary Data (cont’d) (1)Includes common stock, additional paid-in capital, accumulated other comprehensive income (loss) and accumulated deficit. (2)Leverage includes non-recourse loan participation and mortgages payable. (3)Total stockholders’ equity divided by total assets. (4)Total stockholders’ equity divided by total assets less the net balances of U.S. Treasury securities and U.S. Treasury securities sold, not yet purchased, reverse repurchase agreements and repurchase agreements, and securities borrowed and securities loaned. (5)Investment Securities include Agency mortgage-backed securities, Agency debentures and corporate debt. For the quarters ended September 30, June 30, March 31, December 31, September 30, 2013 2013 2013 2012 2012 Liabilities, Capital and Hedging Data: Total assets $93,433,157 $102,468,584 $125,501,856 $133,452,295 $141,576,600 Repurchase agreements $69,211,309 $81,397,335 $100,322,942 $102,785,697 $101,033,146 Convertible Senior Notes $824,512 $824,229 $824,902 $825,541 $999,749 Mortgages payable $19,346 $19,361 - - - Participation sold $14,164 $14,324 - - - Total debt $70,069,331 $82,255,249 $101,147,844 $103,611,238 $102,032,895 Total liabilities $80,487,433 $89,205,280 $110,195,487 $117,527,851 $124,485,937 Cumulative redeemable preferred stock $913,059 $913,059 $913,059 $913,059 $913,059 Common equity(1) $12,032,665 $12,350,245 $14,393,310 $15,011,385 $16,177,604 Total stockholders' equity $12,945,724 $13,263,304 $15,306,369 $15,924,444 $17,090,663 Weighted average days to maturity of interest-bearing liabilities 204 196 202 197 220 Weighted average rate on repurchase agreements 0.63% 0.64% 0.59% 0.63% 0.61% Total debt to total stockholders' equity(2) 5.4x 6.2x 6.6x 6.5x 6.0x Capital ratio(3) 13.9% 12.9% 12.2% 11.9% 12.1% Net capital ratio(4) 14.8% 13.3% 13.0% 12.3% 12.4% Common stock book value per share $12.70 $13.03 $15.19 $15.85 $16.60 Total common stock shares outstanding 947,305 947,483 947,293 947,213 974,800 Interest rate swaps: Notional amount of interest rate swaps and swaptions as a % of Investment Securities(5) 74% 56% 46% 40% 38% Weighted average pay rate on interest swaps 2.06% 2.05% 2.08% 2.21% 2.23% Weighted average receive rate on interest swaps 0.21% 0.22% 0.23% 0.24% 0.27% Weighted average net rate on interest swaps 1.85% 1.83% 1.85% 1.97% 1.96%
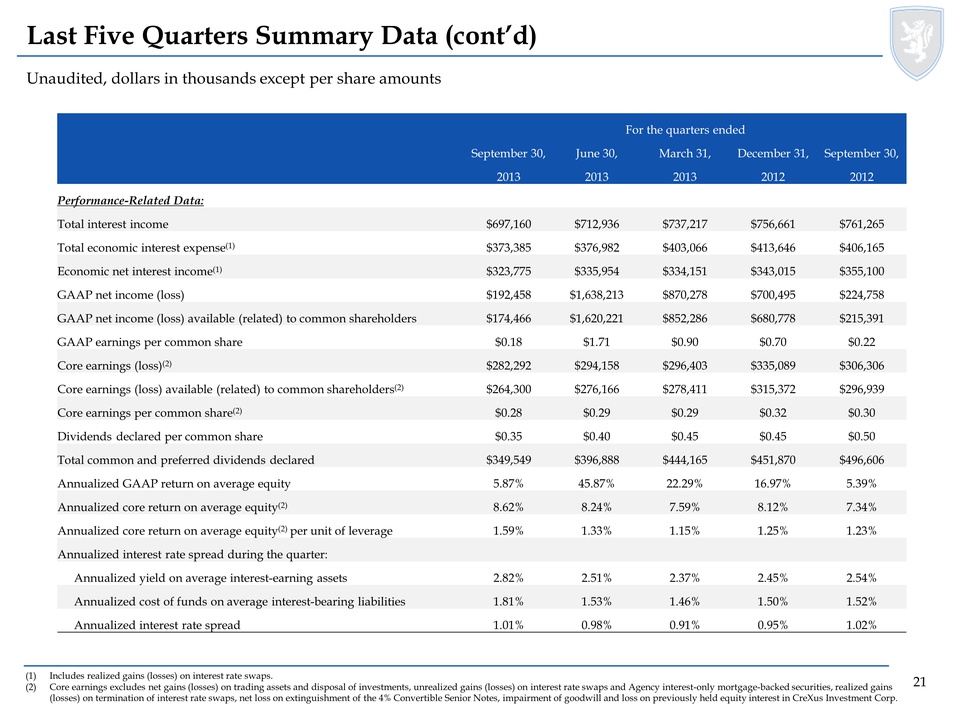 Unaudited, dollars in thousands except per share amounts Last Five Quarters Summary Data (cont’d) (1)Includes realized gains (losses) on interest rate swaps. (2)Core earnings excludes net gains (losses) on trading assets and disposal of investments, unrealized gains (losses) on interest rate swaps and Agency interest-only mortgage-backed securities, realized gains (losses) on termination of interest rate swaps, net loss on extinguishment of the 4% Convertible Senior Notes, impairment of goodwill and loss on previously held equity interest in CreXus Investment Corp. For the quarters ended September 30, June 30, March 31, December 31, September 30, 2013 2013 2013 2012 2012 Performance-Related Data: Total interest income $697,160 $712,936 $737,217 $756,661 $761,265 Total economic interest expense(1) $373,385 $376,982 $403,066 $413,646 $406,165 Economic net interest income(1) $323,775 $335,954 $334,151 $343,015 $355,100 GAAP net income (loss) $192,458 $1,638,213 $870,278 $700,495 $224,758 GAAP net income (loss) available (related) to common shareholders $174,466 $1,620,221 $852,286 $680,778 $215,391 GAAP earnings per common share $0.18 $1.71 $0.90 $0.70 $0.22 Core earnings (loss)(2) $282,292 $294,158 $296,403 $335,089 $306,306 Core earnings (loss) available (related) to common shareholders(2) $264,300 $276,166 $278,411 $315,372 $296,939 Core earnings per common share(2) $0.28 $0.29 $0.29 $0.32 $0.30 Dividends declared per common share $0.35 $0.40 $0.45 $0.45 $0.50 Total common and preferred dividends declared $349,549 $396,888 $444,165 $451,870 $496,606 Annualized GAAP return on average equity 5.87% 45.87% 22.29% 16.97% 5.39% Annualized core return on average equity(2) 8.62% 8.24% 7.59% 8.12% 7.34% Annualized core return on average equity(2) per unit of leverage 1.59% 1.33% 1.15% 1.25% 1.23% Annualized interest rate spread during the quarter: Annualized yield on average interest-earning assets 2.82% 2.51% 2.37% 2.45% 2.54% Annualized cost of funds on average interest-bearing liabilities 1.81% 1.53% 1.46% 1.50% 1.52% Annualized interest rate spread 1.01% 0.98% 0.91% 0.95% 1.02%