Exhibit 99.2
August 5, 2015 2Q 2015 Stockholder Supplement
Safe Harbor Notice This news release and our public documents to which we refer contain or incorporate by reference certain forward-looking statements which are based on various assumptions (some of which are beyond our control) and may be identified by reference to a future period or periods or by the use of forward-looking terminology, such as "may," "will," "believe," "expect," "anticipate," "continue," or similar terms or variations on those terms or the negative of those terms. Actual results could differ materially from those set forth in forward-looking statements due to a variety of factors, including, but not limited to, changes in interest rates; changes in the yield curve; changes in prepayment rates; the availability of mortgage-backed securities and other securities for purchase; the availability of financing and, if available, the terms of any financings; changes in the market value of our assets; changes in business conditions and the general economy; our ability to grow the commercial mortgage business; credit risks related to our investments in Agency CRT securities, residential mortgage-backed securities and related residential mortgage credit assets, commercial real estate assets and corporate debt; our ability to grow our residential mortgage credit business; our ability to consummate any contemplated investment opportunities; changes in government regulations affecting our business; our ability to maintain our qualification as a REIT for federal income tax purposes; and our ability to maintain our exemption from registration under the Investment Company Act of 1940, as amended. For a discussion of the risks and uncertainties which could cause actual results to differ from those contained in the forward-looking statements, see "Risk Factors" in our most recent Annual Report on Form 10-K and any subsequent Quarterly Reports on Form 10-Q. We do not undertake, and specifically disclaim any obligation, to publicly release the result of any revisions which may be made to any forward-looking statements to reflect the occurrence of anticipated or unanticipated events or circumstances after the date of such statements. 1
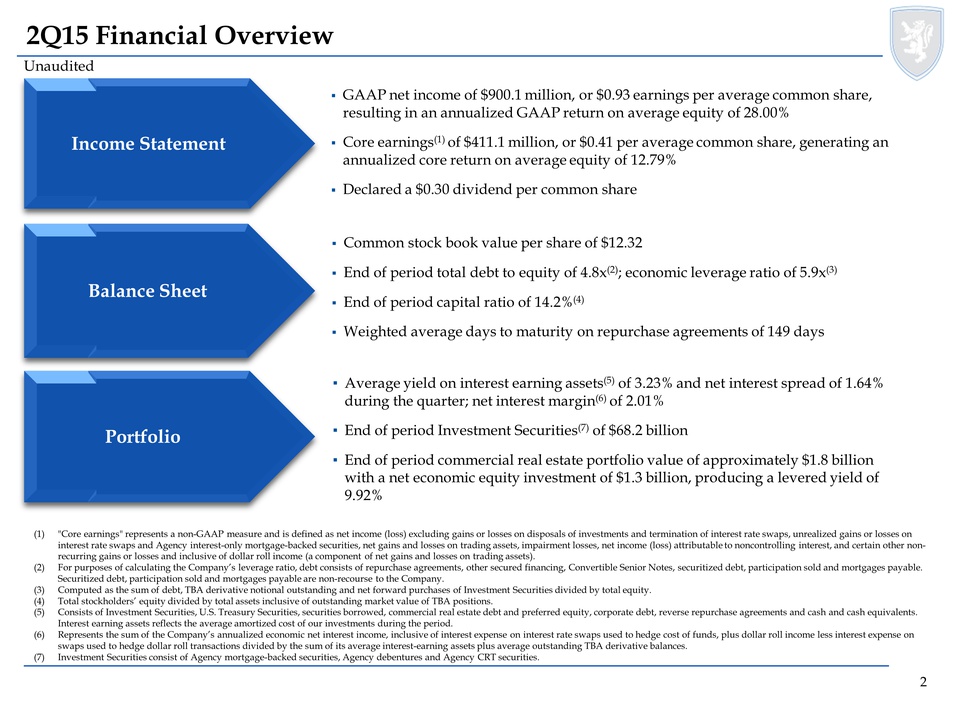
2Q15 Financial Overview Unaudited Income Statement Balance Sheet Portfolio (1) "Core earnings" represents a non-GAAP measure and is defined as net income (loss) excluding gains or losses on disposals of investments and termination of interest rate swaps, unrealized gains or losses on interest rate swaps and Agency interest-only mortgage-backed securities, net gains and losses on trading assets, impairment losses, net income (loss) attributable to noncontrolling interest, and certain other nonrecurring gains or losses and inclusive of dollar roll income (a component of net gains and losses on trading assets). (2) For purposes of calculating the Company’s leverage ratio, debt consists of repurchase agreements, other secured financing, Convertible Senior Notes, securitized debt, participation sold and mortgages payable. Securitized debt, participation sold and mortgages payable are non-recourse to the Company. (3) Computed as the sum of debt, TBA derivative notional outstanding and net forward purchases of Investment Securities divided by total equity. (4) Total stockholders’ equity divided by total assets inclusive of outstanding market value of TBA positions. (5) Consists of Investment Securities, U.S. Treasury Securities, securities borrowed, commercial real estate debt and preferred equity, corporate debt, reverse repurchase agreements and cash and cash equivalents. Interest earning assets reflects the average amortized cost of our investments during the period. (6) Represents the sum of the Company’s annualized economic net interest income, inclusive of interest expense on interest rate swaps used to hedge cost of funds, plus dollar roll income less interest expense on swaps used to hedge dollar roll transactions divided by the sum of its average interest-earning assets plus average outstanding TBA derivative balances. (7) Investment Securities consist of Agency mortgage-backed securities, Agency debentures and Agency CRT securities. GAAP net income of $900.1 million, or $0.93 earnings per average common share, resulting in an annualized GAAP return on average equity of 28.00% Core earnings(1) of $411.1 million, or $0.41 per average common share, generating an annualized core return on average equity of 12.79% Declared a $0.30 dividend per common share Common stock book value per share of $12.32 End of period total debt to equity of 4.8x(2); economic leverage ratio of 5.9x(3) End of period capital ratio of 14.2%(4) Weighted average days to maturity on repurchase agreements of 149 days Average yield on interest earning assets(5) of 3.23% and net interest spread of 1.64% during the quarter; net interest margin(6) of 2.01% End of period Investment Securities(7) of $68.2 billion End of period commercial real estate portfolio value of approximately $1.8 billion with a net economic equity investment of $1.3 billion, producing a levered yield of 9.92% 2
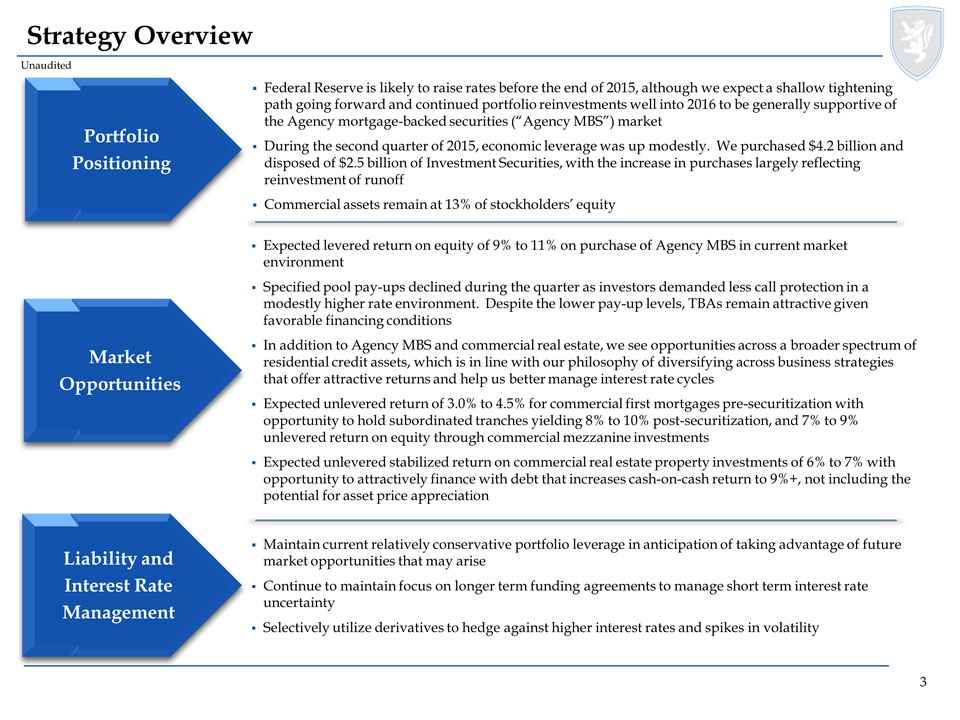
Strategy Overview Unaudited Portfolio Positioning Market Opportunities Liability and Interest Rate Management Federal Reserve is likely to raise rates before the end of 2015, although we expect a shallow tightening path going forward and continued portfolio reinvestments well into 2016 to be generally supportive of the Agency mortgage-backed securities (“Agency MBS”) market During the second quarter of 2015, economic leverage was up modestly. We purchased $4.2 billion and disposed of $2.5 billion of Investment Securities, with the increase in purchases largely reflecting reinvestment of runoff Commercial assets remain at 13% of stockholders’ equity Expected levered return on equity of 9% to 11% on purchase of Agency MBS in current market environment Specified pool pay-ups declined during the quarter as investors demanded less call protection in a modestly higher rate environment. Despite the lower pay-up levels, TBAs remain attractive given favorable financing conditions In addition to Agency MBS and commercial real estate, we see opportunities across a broader spectrum of residential credit assets, which is in line with our philosophy of diversifying across business strategies that offer attractive returns and help us better manage interest rate cycles Expected unlevered return of 3.0% to 4.5% for commercial first mortgages pre-securitization with opportunity to hold subordinated tranches yielding 8% to 10% post-securitization, and 7% to 9% unlevered return on equity through commercial mezzanine investments Expected unlevered stabilized return on commercial real estate property investments of 6% to 7% with opportunity to attractively finance with debt that increases cash-on-cash return to 9%+, not including the potential for asset price appreciation Maintain current relatively conservative portfolio leverage in anticipation of taking advantage of future market opportunities that may arise Continue to maintain focus on longer term funding agreements to manage short term interest rate uncertainty Selectively utilize derivatives to hedge against higher interest rates and spikes in volatility 3
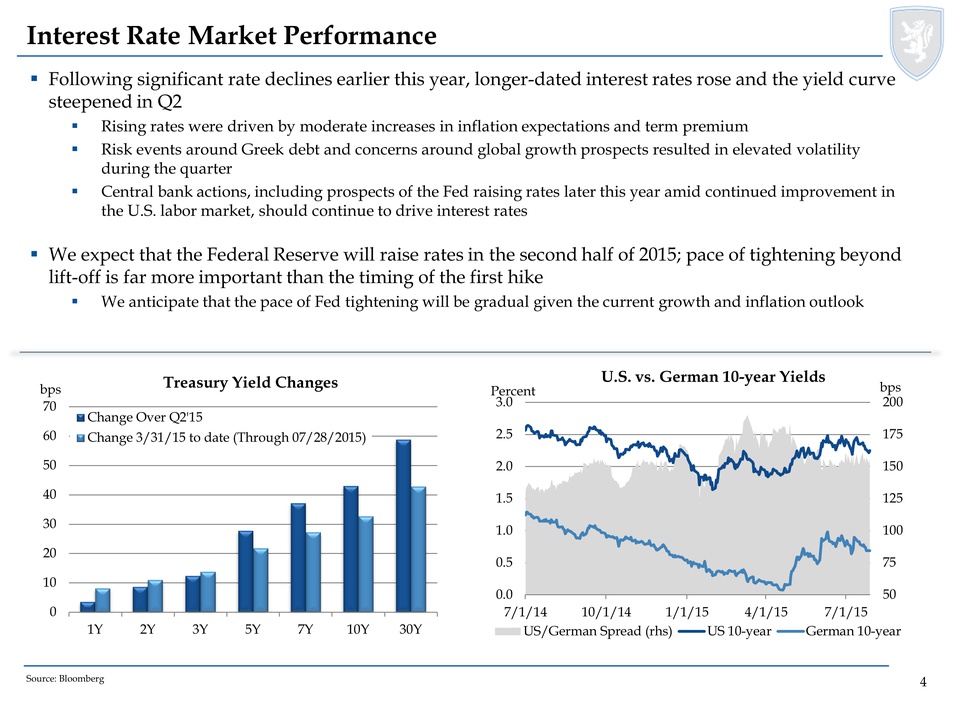
Interest Rate Market Performance Following significant rate declines earlier this year, longer-dated interest rates rose and the yield curve steepened in Q2 Rising rates were driven by moderate increases in inflation expectations and term premium Risk events around Greek debt and concerns around global growth prospects resulted in elevated volatility during the quarter Central bank actions, including prospects of the Fed raising rates later this year amid continued improvement in the U.S. labor market, should continue to drive interest rates We expect that the Federal Reserve will raise rates in the second half of 2015; pace of tightening beyond lift-off is far more important than the timing of the first hike We anticipate that the pace of Fed tightening will be gradual given the current growth and inflation outlook Treasury Yield Changes Change Over Q2'15 Change 3/31/15 to date (Through 07/28/2015) U.S. vs. German 10-year Yields Percent bps Source: Bloomberg 4
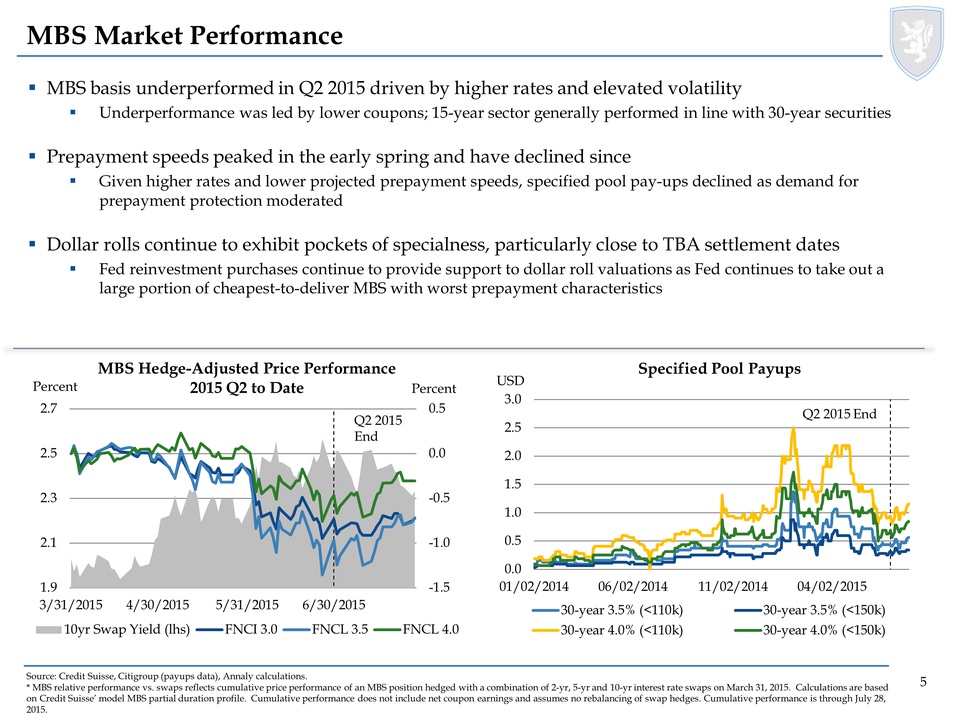
MBS Market Performance MBS basis underperformed in Q2 2015 driven by higher rates and elevated volatility Underperformance was led by lower coupons; 15-year sector generally performed in line with 30-year securities Prepayment speeds peaked in the early spring and have declined since Given higher rates and lower projected prepayment speeds, specified pool pay-ups declined as demand for prepayment protection moderated Dollar rolls continue to exhibit pockets of specialness, particularly close to TBA settlement dates Fed reinvestment purchases continue to provide support to dollar roll valuations as Fed continues to take out a large portion of cheapest-to-deliver MBS with worst prepayment characteristics MBS Hedge-Adjusted Price Performance 2015 Q2 to Date Specified Pool Payups Source: Credit Suisse, Citigroup (payups data), Annaly calculations. * MBS relative performance vs. swaps reflects cumulative price performance of an MBS position hedged with a combination of 2-yr, 5-yr and 10-yr interest rate swaps on March 31, 2015. Calculations are based on Credit Suisse’ model MBS partial duration profile. Cumulative performance does not include net coupon earnings and assumes no rebalancing of swap hedges. Cumulative performance is through July 28, 2015. 5
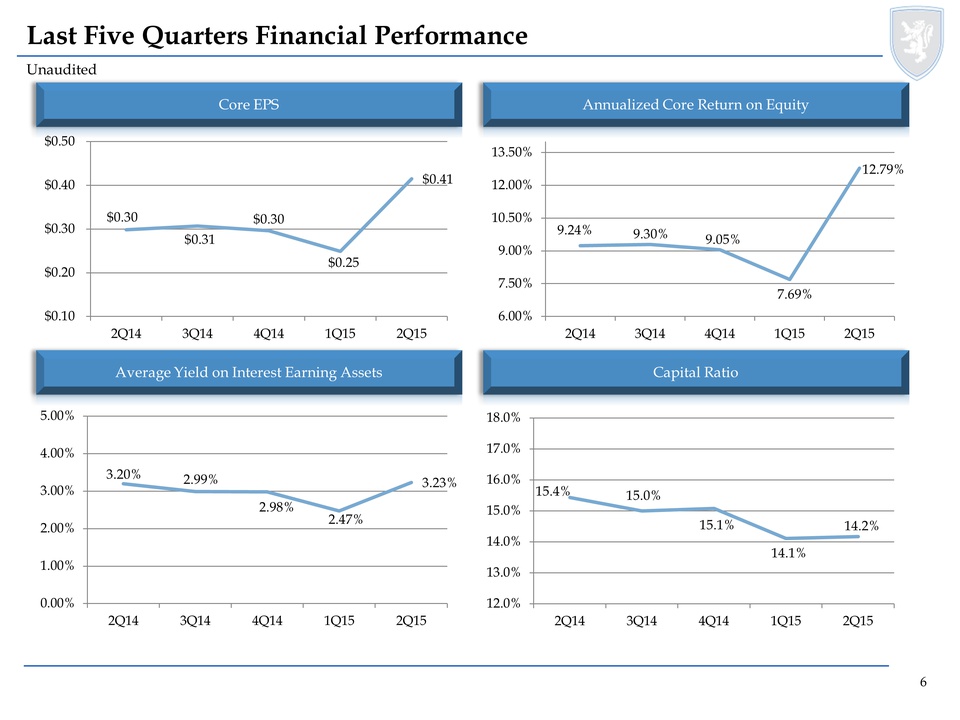
Last Five Quarters Financial Performance Unaudited Core EPS Annualized Core Return on Equity Average Yield on Interest Earning Assets Capital Ratio 6
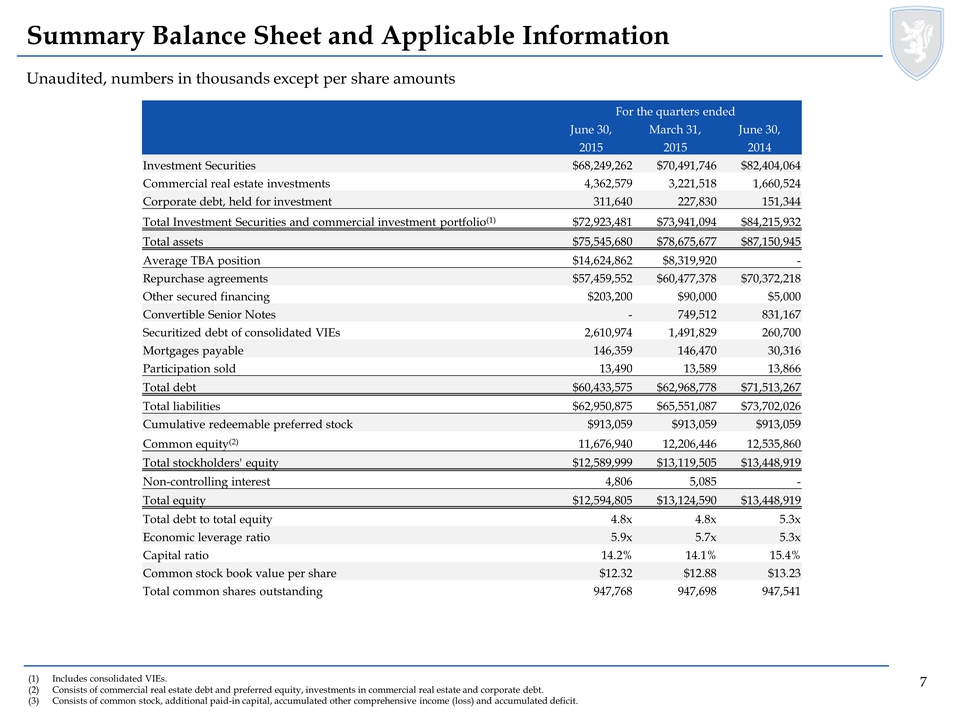
Summary Balance Sheet and Applicable Information Unaudited, numbers in thousands except per share amounts (1) Includes consolidated VIEs. (2) Consists of commercial real estate debt and preferred equity, investments in commercial real estate and corporate debt. (3) Consists of common stock, additional paid-in capital, accumulated other comprehensive income (loss) and accumulated deficit. For the quarters ended June 30, March 31, June 30, 2015 2015 2014 Investment Securities $68,249,262 $70,491,746 $82,404,064 Commercial real estate investments(1) 4,362,579 3,221,518 1,660,524 Corporate debt, held for investment 311,640 227,830 151,344 Total Investment Securities and commercial investment portfolio(1) $72,923,481 $73,941,094 $84,215,932 Total assets $75,545,680 $78,675,677 $87,150,945 Average TBA position $14,624,862 $8,319,920 - Repurchase agreements $57,459,552 $60,477,378 $70,372,218 Other secured financing $203,200 $90,000 - Convertible Senior Notes - 749,512 831,167 Securitized debt of consolidated VIEs 2,610,974 1,491,829 260,700 Mortgages payable 146,359 146,470 30,316 Participation sold 13,490 13,589 13,866 Total debt $60,433,575 $62,968,778 $71,508,267 Total liabilities $62,950,875 $65,551,087 $73,702,026 Cumulative redeemable preferred stock $913,059 $913,059 $913,059 Common equity(2) 11,676,940 12,206,446 12,535,860 Total stockholders' equity $12,589,999 $13,119,505 $13,448,919 Non-controlling interest 4,806 5,085 - Total equity $12,594,805 $13,124,590 $13,448,919 Total debt to total equity 4.8x 4.8x 5.3x Economic leverage ratio 5.9x 5.7x 5.3x Capital ratio 14.2% 14.1% 15.4% Common stock book value per share $12.32 $12.88 $13.23 Total common shares outstanding 947,768 947,698 947,541 7
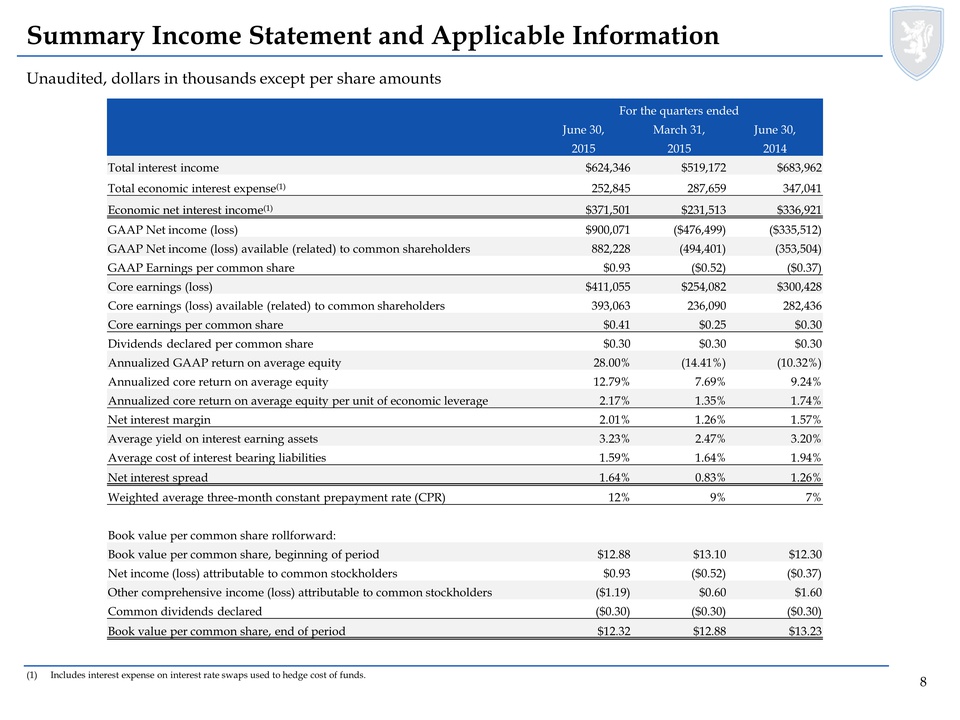
Summary Income Statement and Applicable Information Unaudited, dollars in thousands except per share amounts (1) Includes interest expense on interest rate swaps used to hedge cost of funds. For the quarters ended June 30, March 31, June 30, 2015 2015 2014 Total interest income $624,346 $519,172 $683,962 Total economic interest expense(1) 252,845 287,659 347,041 Economic net interest income(1) $371,501 $231,513 $336,921 GAAP Net income (loss) $900,071 ($476,499) ($335,512) GAAP Net income (loss) available (related) to common shareholders 882,228 (494,401) (353,504) GAAP Earnings per common share $0.93 ($0.52) ($0.37) Core earnings (loss) $411,055 $254,082 $300,428 Core earnings (loss) available (related) to common shareholders 393,063 236,090 282,436 Core earnings per common share $0.41 $0.25 $0.30 Dividends declared per common share $0.30 $0.30 $0.30 Annualized GAAP return on average equity 28.00% (14.41%) (10.32%) Annualized core return on average equity 12.79% 7.69% 9.24% Annualized core return on average equity per unit of economic leverage 2.17% 1.35% 1.74% Net interest margin 2.01% 1.26% 1.57% Average yield on interest earning assets 3.23% 2.47% 3.20% Average cost of interest bearing liabilities 1.59% 1.64% 1.94% Net interest spread 1.64% 0.83% 1.26% Weighted average three-month constant prepayment rate (CPR) 12% 9% 7% Book value per common share rollforward: Book value per common share, beginning of period $12.88 $13.10 $12.30 Net income (loss) attributable to common stockholders $0.93 ($0.52) ($0.37) Other comprehensive income (loss) attributable to common stockholders ($1.19) $0.60 $1.60 Common dividends declared ($0.30) ($0.30) ($0.30) Book value per common share, end of period $12.32 $12.88 $13.23 8
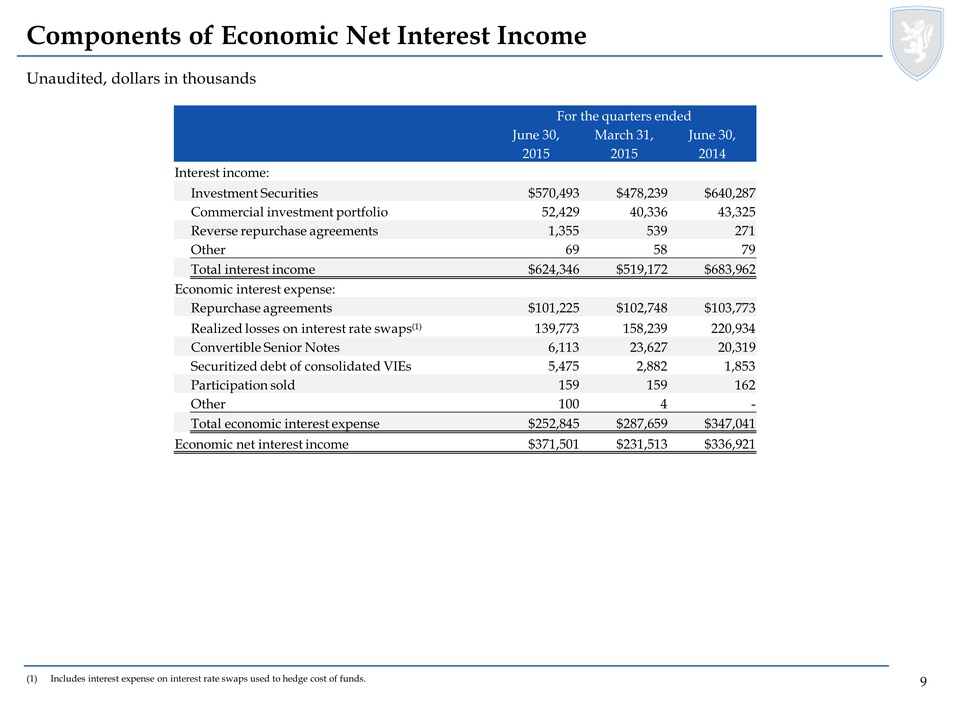
Components of Economic Net Interest Income Unaudited, dollars in thousands (1) Includes interest expense on interest rate swaps used to hedge cost of funds. For the quarters ended June 30, March 31, June 30, 2015 2015 2014 Interest income: Investment Securities $570,493 $478,239 $640,287 Commercial investment portfolio 52,429 40,336 43,325 Reverse repurchase agreements 1,355 539 271 Other 69 58 79 Total interest income $624,346 $519,172 $683,962 Economic interest expense: Repurchase agreements $101,225 $102,748 $103,773 Realized losses on interest rate swaps(1) 139,773 158,239 220,934 Convertible Senior Notes 6,113 23,627 20,319 Securitized debt of consolidated VIEs 5,475 2,882 1,853 Participation sold 159 159 162 Other 100 4 - Total economic interest expense $252,845 $287,659 $347,041 Economic net interest income $371,501 $231,513 $336,921 9
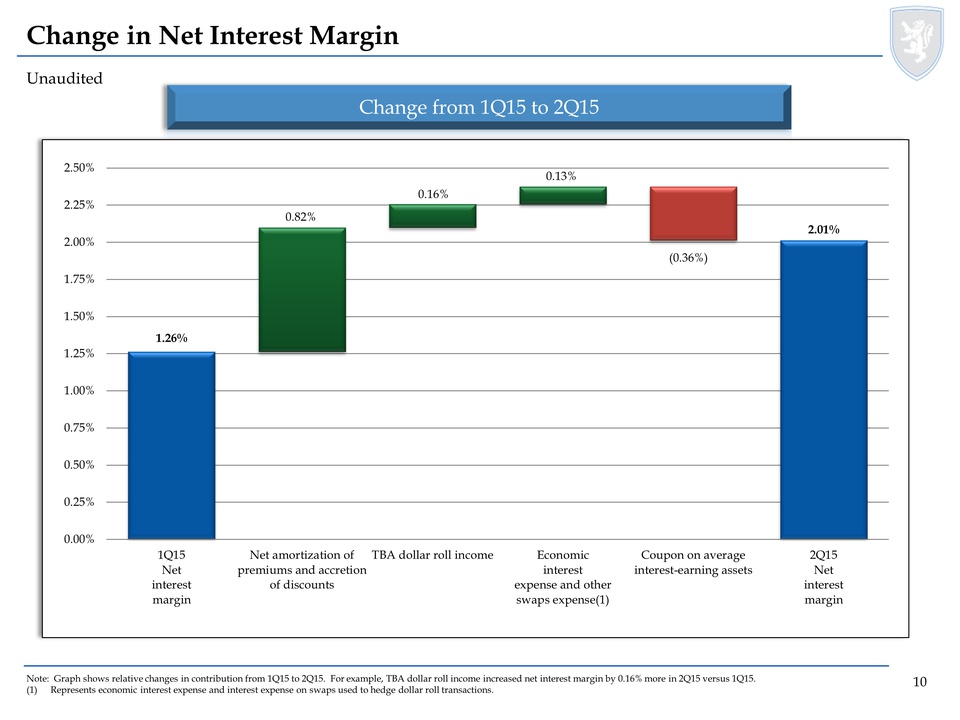
Change in Net Interest Margin Unaudited Change from 1Q15 to 2Q15 Note: Graph shows relative changes in contribution from 1Q15 to 2Q15. For example, TBA dollar roll income increased net interest margin by 0.16% more in 2Q15 versus 1Q15. (1) Represents economic interest expense and interest expense on swaps used to hedge dollar roll transactions. 10 1Q15 Net interest margin Net amortization of premiums and accretion of discounts TBA dollar roll income Economic interest expense and other swaps expense(1) Coupon on average interest-earning assets 2Q15 Net interest margin 10
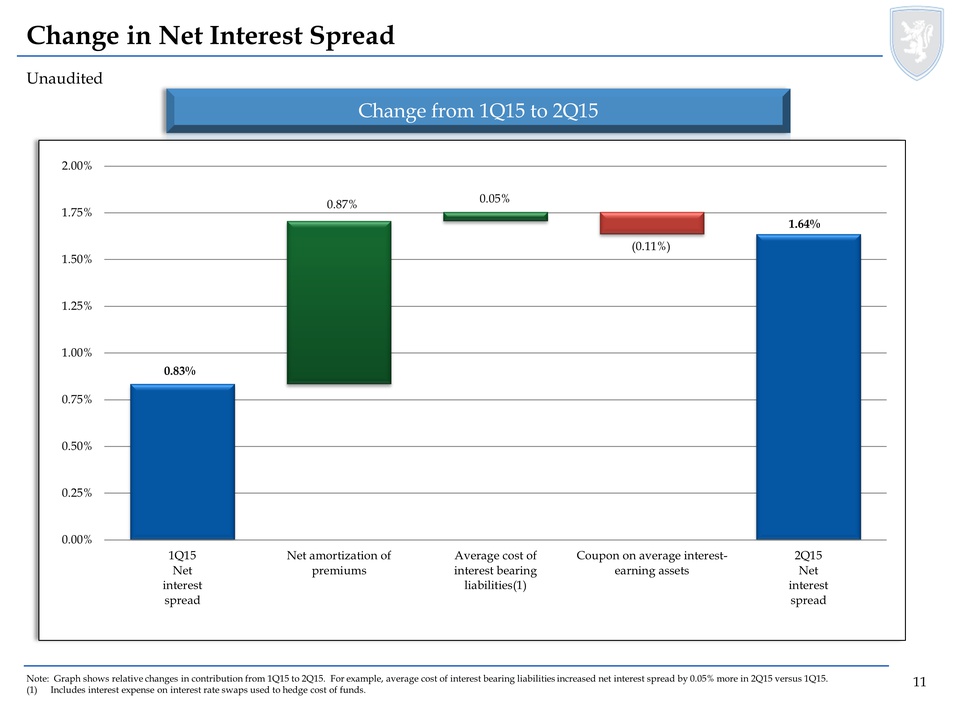
Change in Net Interest Spread Unaudited Change from 1Q15 to 2Q15 Note: Graph shows relative changes in contribution from 1Q15 to 2Q15. For example, average cost of interest bearing liabilities increased net interest spread by 0.05% more in 2Q15 versus 1Q15. (1) Includes interest expense on interest rate swaps used to hedge cost of funds. 1Q15 Net interest spread Net amortization of premiums Average cost of interest bearing liabilities(1) Coupon on average interest earning assets 2Q15 Net interest spread 11
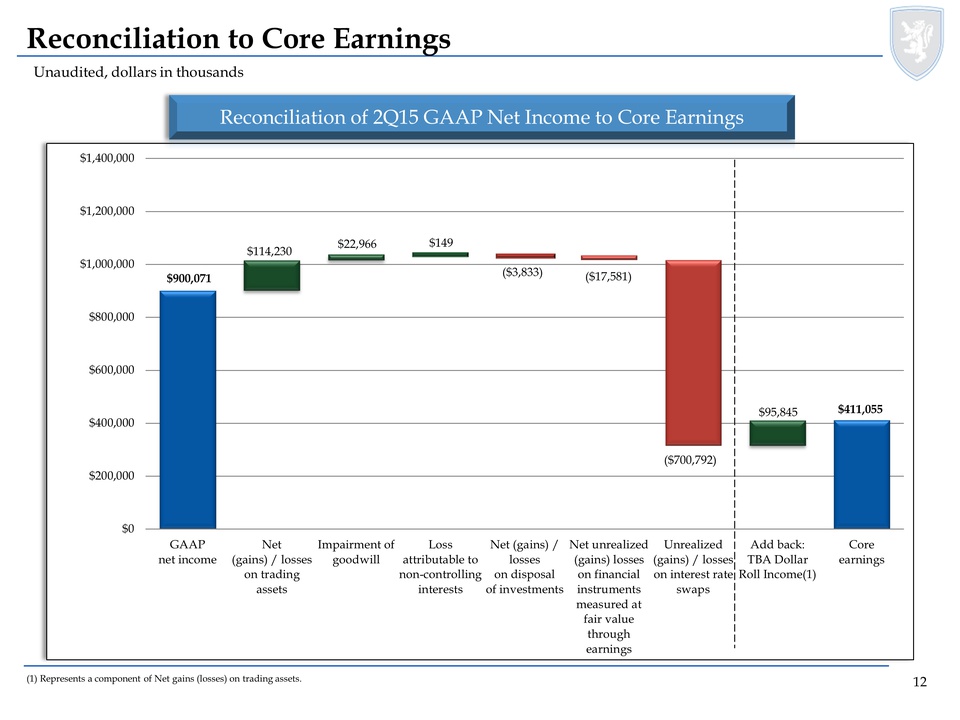
Reconciliation to Core Earnings Unaudited, dollars in thousands Reconciliation of 2Q15 GAAP Net Income to Core Earnings (1) Represents a component of Net gains (losses) on trading assets. GAAP net income Net (gains) / losses on trading assets Impairment of goodwill Loss attributable to non-controlling interests Net (gains) / losses on disposal of investments Net unrealized (gains) losses on financial instruments measured at fair value through earnings Unrealized (gains) / losses on interest rate swaps Add back: TBA Dollar Roll Income(1) Core earnings 12
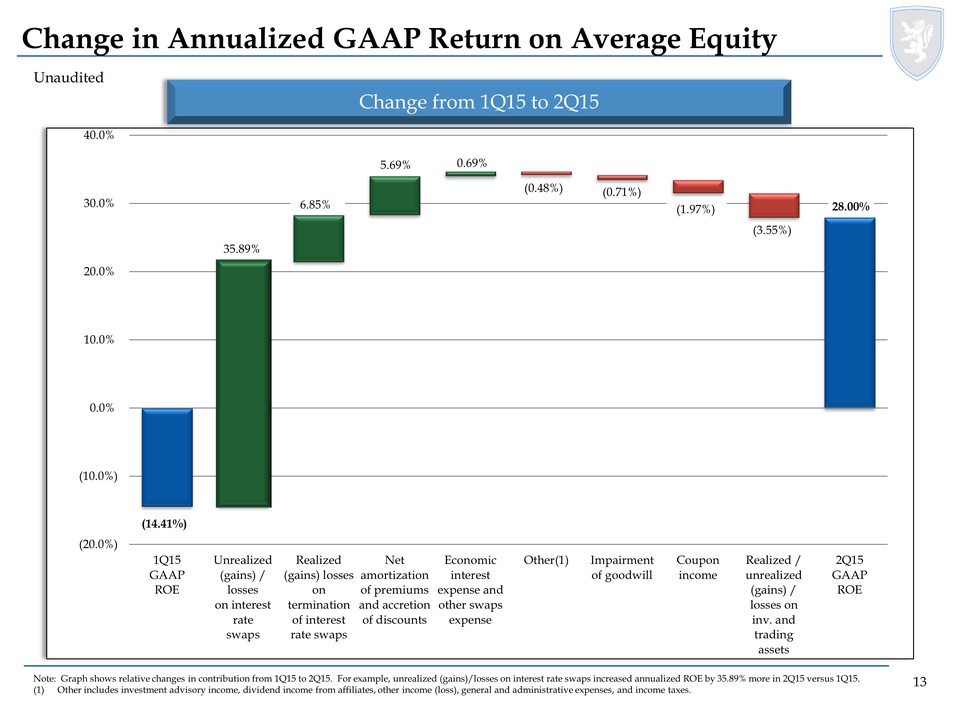
Change in Annualized GAAP Return on Average Equity Unaudited Change from 1Q15 to 2Q15 Note: Graph shows relative changes in contribution from 1Q15 to 2Q15. For example, unrealized (gains)/losses on interest rate swaps increased annualized ROE by 35.89% more in 2Q15 versus 1Q15. (1) Other includes investment advisory income, dividend income from affiliates, other income (loss), general and administrative expenses, and income taxes. 1Q15 GAAP ROE Unrealized (gains) / losses on interest rate swaps Realized (gains) losses on termination of interest rate swaps Net amortization of premiums and accretion of discounts Economic interest expense and other swaps expense Other(1) Impairment of goodwill Coupon income Realized / unrealized (gains) / losses on inv. and trading assets 2Q15 GAAP ROE 13

Change in Annualized Core Return on Average Equity Unaudited Change from 1Q15 to 2Q15 Note: Graph shows relative changes in contribution from 1Q15 to 2Q15. For example, TBA dollar roll income increased annualized core ROE by 1.17% more in 2Q15 versus 1Q15. (1) Other includes investment advisory income, dividend income from affiliates, other income (loss) excluding non-recurring gains or losses, general and administrative expenses, and income taxes. 1Q15 Core ROE Net amortization of premiums and accretion of discounts TBA dollar roll income Economic interest expense and other swaps expense Other(1) Coupon income 2Q15 Core ROE 14
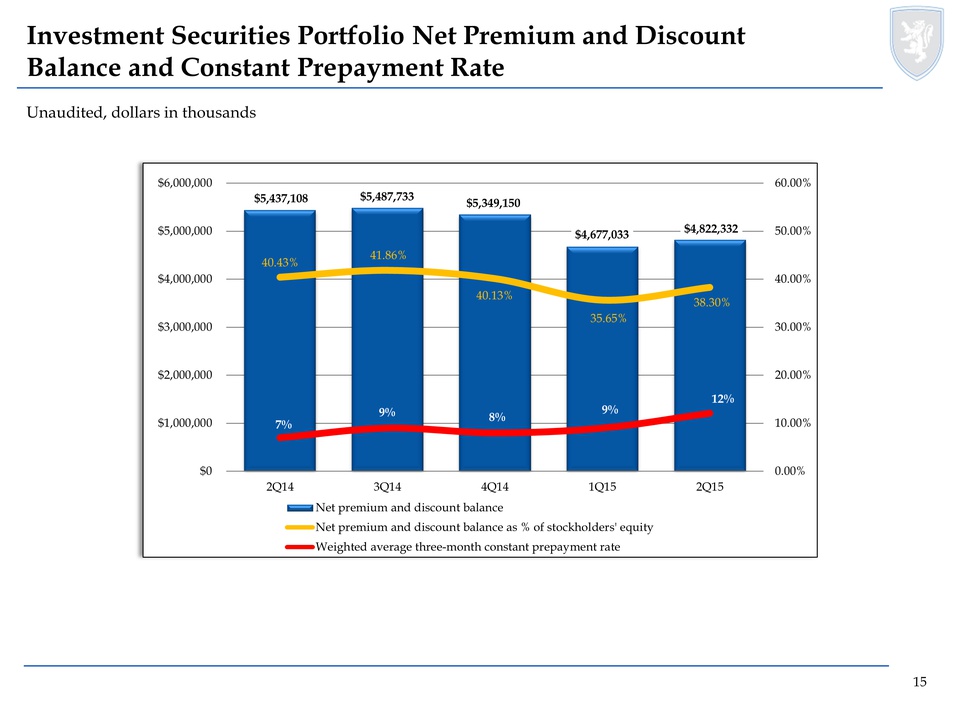
Investment Securities Portfolio Net Premium and Discount Balance and Constant Prepayment Rate Unaudited, dollars in thousands Net premium and discount balance Net premium and discount balance as % of stockholders' equity Weighted average three-month constant prepayment rate 15
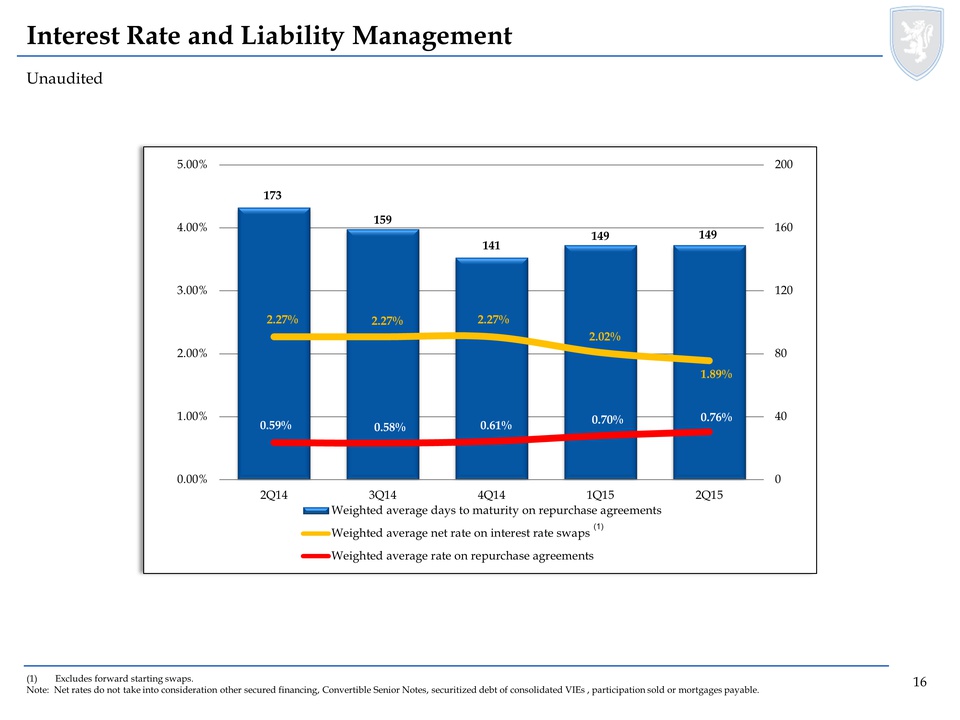
Interest Rate and Liability Management Unaudited (1) Excludes forward starting swaps. Note: Net rates do not take into consideration other secured financing, Convertible Senior Notes, securitized debt of consolidated VIEs , participation sold or mortgages payable. Weighted average days to maturity on repurchase agreements Weighted average net rate on interest rate swaps (1) Weighted average rate on repurchase agreements 16
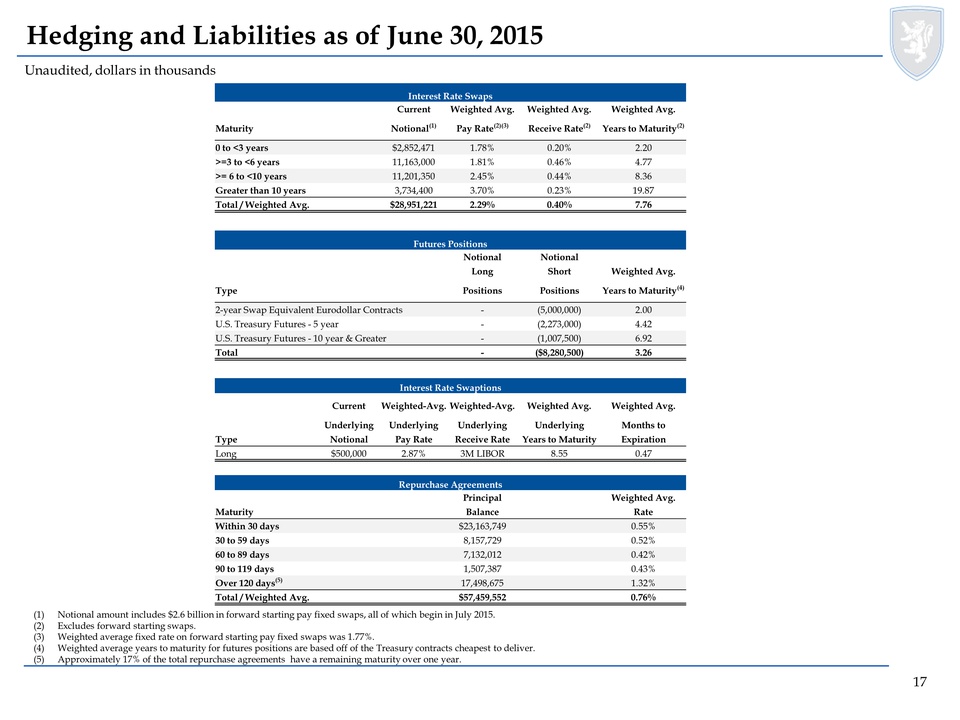
Hedging and Liabilities as of June 30, 2015 Unaudited, dollars in thousands (1) Notional amount includes $2.6 billion in forward starting pay fixed swaps, all of which begin in July 2015. (2) Excludes forward starting swaps. (3) Weighted average fixed rate on forward starting pay fixed swaps was 1.77%. (4) Weighted average years to maturity for futures positions are based off of the Treasury contracts cheapest to deliver. (5) Approximately 17% of the total repurchase agreements have a remaining maturity over one year. Interest Rate Swaps Current Weighted Avg. Weighted Avg. Weighted Avg. Maturity Notional(1) Pay Rate(2)(3) Receive Rate(2) Years to Maturity(2) 0 to <3 years $2,852,471 1.78% 0.20% 2.20 >=3 to <6 years 11,163,000 1.81% 0.46% 4.77 >= 6 to <10 years 11,201,350 2.45% 0.44% 8.36 Greater than 10 years 3,734,400 3.70% 0.23% 19.87 Total / Weighted Avg. $28,951,221 2.29% 0.40% 7.76 Futures Positions Notional Notional Long Short Weighted Avg. Type Positions Positions Years to Maturity(4) 2-year Swap Equivalent Eurodollar Contracts - (5,000,000) 2.00 U.S. Treasury Futures - 5 year - (2,273,000) 4.42 U.S. Treasury Futures - 10 year & Greater - (1,007,500) 6.92 Total - ($8,280,500) 3.26 Interest Rate Swaptions Current Weighted-Avg. Weighted-Avg. Weighted Avg. Weighted Avg. Underlying Underlying Underlying Underlying Months to Type Notional Pay Rate Receive Rate Years to Maturity Expiration Long $500,000 2.87% 3M LIBOR 8.55 0.47 Repurchase Agreements Principal Weighted Avg. Maturity Balance Rate Within 30 days $23,163,749 0.55% 30 to 59 days 8,157,729 0.52% 60 to 89 days 7,132,012 0.42% 90 to 119 days 1,507,387 0.43% Over 120 days(5) 17,498,675 1.32% Total / Weighted Avg. $57,459,552 0.76% 17
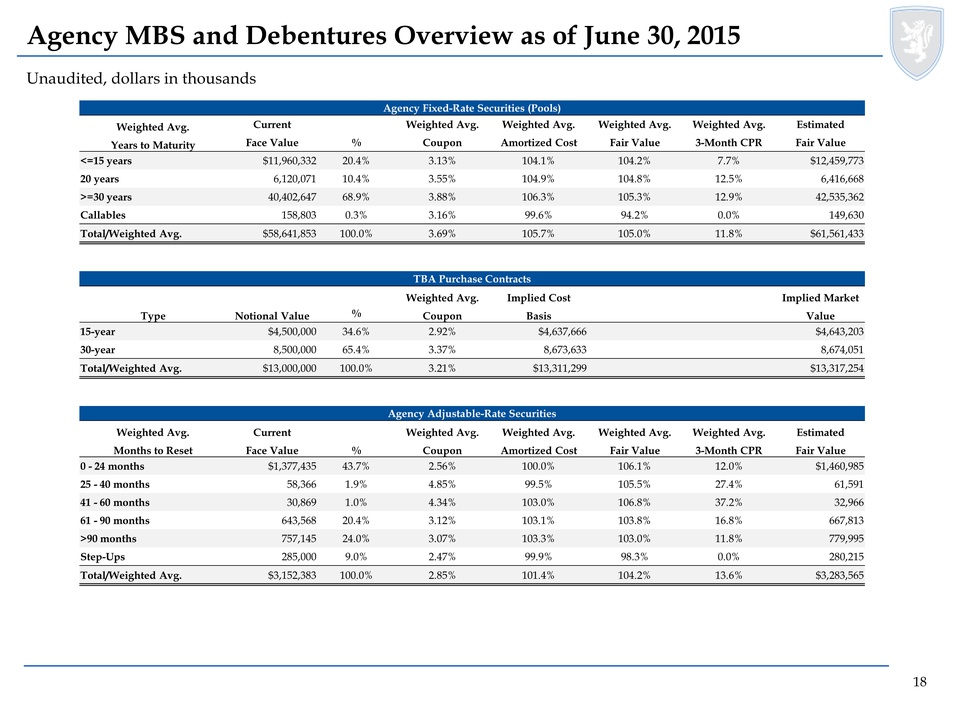
Agency MBS and Debentures Overview as of June 30, 2015 Unaudited, dollars in thousands Agency Fixed-Rate Securities (Pools) Weighted Avg. Current Weighted Avg. Weighted Avg. Weighted Avg. Weighted Avg. Estimated Years to Maturity Face Value % Coupon Amortized Cost Fair Value 3-Month CPR Fair Value <=15 years $11,960,332 20.4% 3.13% 104.1% 104.2% 7.7% $12,459,773 20 years 6,120,071 10.4% 3.55% 104.9% 104.8% 12.5% 6,416,668 >=30 years 40,402,647 68.9% 3.88% 106.3% 105.3% 12.9% 42,535,362 Callables 158,803 0.3% 3.16% 99.6% 94.2% 0.0% 149,630 Total/Weighted Avg. $58,641,853 100.0% 3.69% 105.7% 105.0% 11.8% $61,561,433 TBA Purchase Contracts Weighted Avg. Implied Cost Implied Market Type Notional Value % Coupon Basis Value 15-year $4,500,000 34.6% 2.92% $4,637,666 $4,643,203 30-year 8,500,000 65.4% 3.37% 8,673,633 8,674,051 Total/Weighted Avg. $13,000,000 100.0% 3.21% $13,311,299 $13,317,254 Agency Adjustable-Rate Securities Weighted Avg. Current Weighted Avg. Weighted Avg. Weighted Avg. Weighted Avg. Estimated Months to Reset Face Value % Coupon Amortized Cost Fair Value 3-Month CPR Fair Value 0 - 24 months $1,377,435 43.7% 2.56% 100.0% 106.1% 12.0% $1,460,985 25 - 40 months 58,366 1.9% 4.85% 99.5% 105.5% 27.4% 61,591 41 - 60 months 30,869 1.0% 4.34% 103.0% 106.8% 37.2% 32,966 61 - 90 months 643,568 20.4% 3.12% 103.1% 103.8% 16.8% 667,813 >90 months 757,145 24.0% 3.07% 103.3% 103.0% 11.8% 779,995 Step-Ups 285,000 9.0% 2.47% 99.9% 98.3% 0.0% 280,215 Total/Weighted Avg. $3,152,383 100.0% 2.85% 101.4% 104.2% 13.6% $3,283,565 18
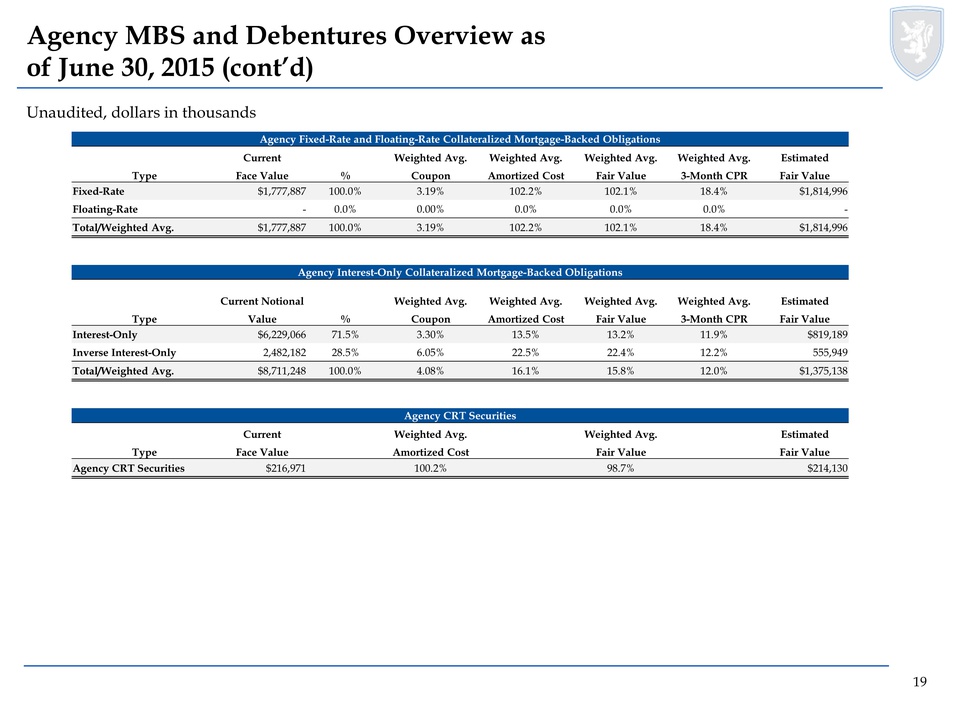
Agency MBS and Debentures Overview as of June 30, 2015 (cont’d) Unaudited, dollars in thousands Agency Fixed-Rate and Floating-Rate Collateralized Mortgage-Backed Obligations Current Weighted Avg. Weighted Avg. Weighted Avg. Weighted Avg. Estimated Type Face Value % Coupon Amortized Cost Fair Value 3-Month CPR Fair Value Fixed-Rate $1,777,887 100.0% 3.19% 102.2% 102.1% 18.4% $1,814,996 Floating-Rate - 0.0% 0.00% 0.0% 0.0% 0.0% - Total/Weighted Avg. $1,777,887 100.0% 3.19% 102.2% 102.1% 18.4% $1,814,996 Agency Interest-Only Collateralized Mortgage-Backed Obligations Current Notional Weighted Avg. Weighted Avg. Weighted Avg. Weighted Avg. Estimated Type Value % Coupon Amortized Cost Fair Value 3-Month CPR Fair Value Interest-Only $6,229,066 71.5% 3.30% 13.5% 13.2% 11.9% $819,189 Inverse Interest-Only 2,482,182 28.5% 6.05% 22.5% 22.4% 12.2% 555,949 Total/Weighted Avg. $8,711,248 100.0% 4.08% 16.1% 15.8% 12.0% $1,375,138 Agency CRT Securities Current Weighted Avg. Weighted Avg. Estimated Type Face Value Amortized Cost Fair Value Fair Value Agency CRT Securities $216,971 100.2% 98.7% $214,130 19
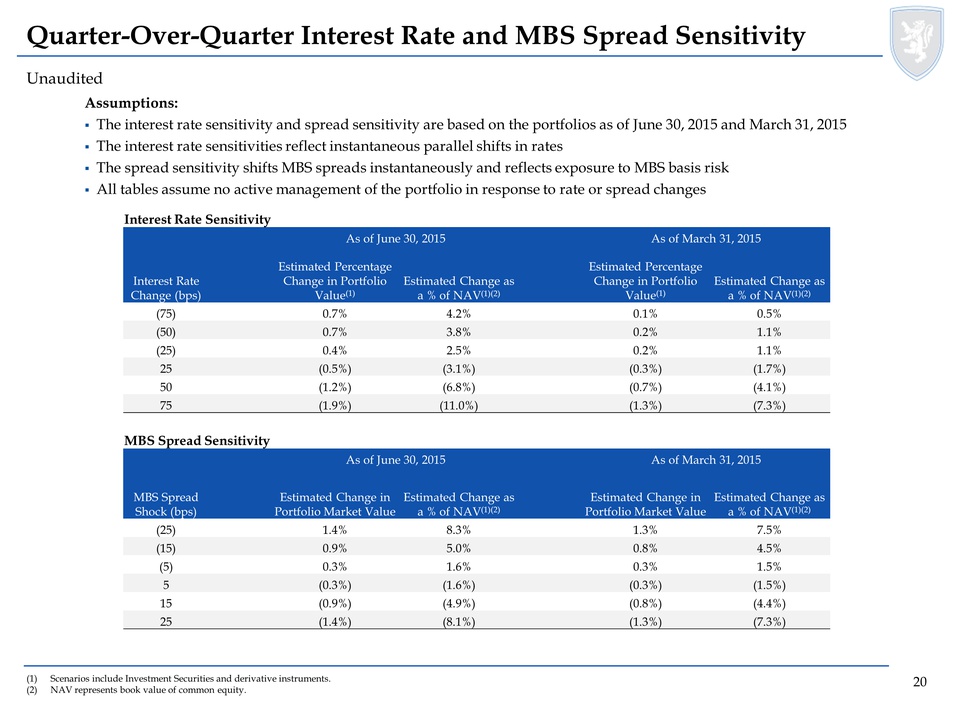
Quarter-Over-Quarter Interest Rate and MBS Spread Sensitivity Unaudited (1) Scenarios include Investment Securities and derivative instruments. (2) NAV represents book value of common equity. Assumptions: The interest rate sensitivity and spread sensitivity are based on the portfolios as of June 30, 2015 and March 31, 2015 The interest rate sensitivities reflect instantaneous parallel shifts in rates The spread sensitivity shifts MBS spreads instantaneously and reflects exposure to MBS basis risk All tables assume no active management of the portfolio in response to rate or spread changes Interest Rate Sensitivity As of June 30, 2015 As of March 31, 2015 Interest Rate Change (bps) Estimated Percentage Change in Portfolio Value(1) Estimated Change as a % of NAV(1)(2) Estimated Percentage Change in Portfolio Value(1) Estimated Change as a % of NAV(1)(2) (75) 0.7% 4.2% 0.1% 0.5% (50) 0.7% 3.8% 0.2% 1.1% (25) 0.4% 2.5% 0.2% 1.1% 25 (0.5%) (3.1%) (0.3%) (1.7%) 50 (1.2%) (6.8%) (0.7%) (4.1%) 75 (1.9%) (11.0%) (1.3%) (7.3%) MBS Spread Sensitivity As of June 30, 2015 As of March 31, 2015 MBS Spread Shock (bps) Estimated Change in Portfolio Market Value Estimated Change as a % of NAV(1)(2) Estimated Change in Portfolio Market Value Estimated Change as a % of NAV(1)(2) (25) 1.4% 8.3% 1.3% 7.5% (15) 0.9% 5.0% 0.8% 4.5% (5) 0.3% 1.6% 0.3% 1.5% 5 (0.3%) (1.6%) (0.3%) (1.5%) 15 (0.9%) (4.9%) (0.8%) (4.4%) 25 (1.4%) (8.1%) (1.3%) (7.3%) 20
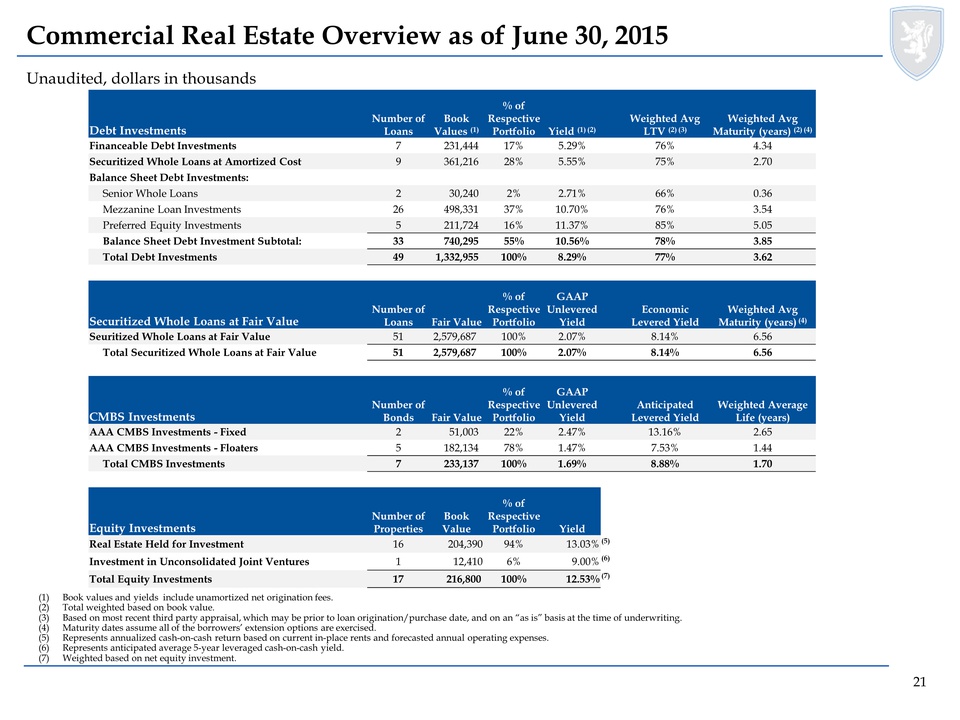
Commercial Real Estate Overview as of June 30, 2015 Unaudited, dollars in thousands (1) Book values and yields include unamortized net origination fees. (2) Total weighted based on book value. (3) Based on most recent third party appraisal, which may be prior to loan origination/purchase date, and on an “as is” basis at the time of underwriting. (4) Maturity dates assume all of the borrowers’ extension options are exercised. (5) Represents annualized cash-on-cash return based on current in-place rents and forecasted annual operating expenses. (6) Represents anticipated average 5-year leveraged cash-on-cash yield. (7) Weighted based on net equity investment. Debt Investments Number of Loans Book Values (1) % of Respective Portfolio Yield (1) (2) Weighted Avg LTV (2) (3) Weighted Avg Maturity (years) (2) (4) Financeable Debt Investments 7 231,444 17% 5.29% 76% 4.34 Securitized Whole Loans at Amortized Cost 9 361,216 28% 5.55% 75% 2.70 Balance Sheet Debt Investments: Senior Whole Loans 2 30,240 2% 2.71% 66% 0.36 Mezzanine Loan Investments 26 498,331 37% 10.70% 76% 3.54 Preferred Equity Investments 5 211,724 16% 11.37% 85% 5.05 Balance Sheet Debt Investment Subtotal: 33 740,295 55% 10.56% 78% 3.85 Total Debt Investments 49 1,332,955 100% 8.29% 77% 3.62 Securitized Whole Loans at Fair Value Number of Loans Fair Value % of Respective Portfolio GAAP Unlevered Yield Economic Levered Yield Weighted Avg Maturity (years) (4) Seuritized Whole Loans at Fair Value 51 2,579,687 100% 2.07% 8.14% 6.56 Total Securitized Whole Loans at Fair Value 51 2,579,687 100% 2.07% 8.14% 6.56 CMBS Investments Number of Bonds Fair Value % of Respective Portfolio GAAP Unlevered Yield Anticipated Levered Yield Weighted Average Life (years) AAA CMBS Investments - Fixed 2 51,003 22% 2.47% 13.16% 2.65 AAA CMBS Investments - Floaters 5 182,134 78% 1.47% 7.53% 1.44 Total CMBS Investments 7 233,137 100% 1.69% 8.88% 1.70 Equity Investments Number of Properties Book Value % of Respective Portfolio Yield Real Estate Held for Investment 16 204,390 94% 13.03%(5) Investment in Unconsolidated Joint Ventures 1 12,410 6% 9.00%(6) Total Equity Investments 17 216,800 100% 12.53%(7) 21
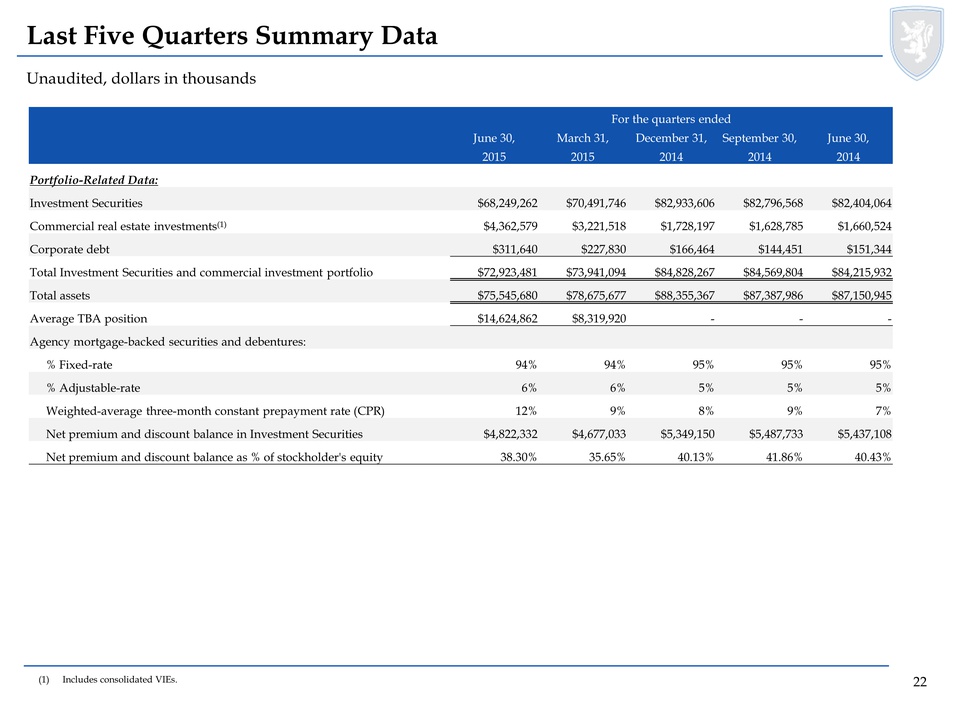
Last Five Quarters Summary Data Unaudited, dollars in thousands (1) Includes consolidated VIEs. For the quarters ended June 30, March 31, December 31, September 30, June 30, 2015 2015 2014 2014 2014 Portfolio-Related Data: Investment Securities $68,249,262 $70,491,746 $82,933,606 $82,796,568 $82,404,064 Commercial real estate investments(1) $4,362,579 $3,221,518 $1,728,197 $1,628,785 $1,660,524 Corporate debt $311,640 $227,830 $166,464 $144,451 $151,344 Total Investment Securities and commercial investment portfolio $72,923,481 $73,941,094 $84,828,267 $84,569,804 $84,215,932 Total assets $75,545,680 $78,675,677 $88,355,367 $87,387,986 $87,150,945 Average TBA position $14,624,862 $8,319,920 - - - Agency mortgage-backed securities and debentures: % Fixed-rate 94% 94% 95% 95% 95% % Adjustable-rate 6% 6% 5% 5% 5% Weighted-average three-month constant prepayment rate (CPR) 12% 9% 8% 9% 7% Net premium and discount balance in Investment Securities $4,822,332 $4,677,033 $5,349,150 $5,487,733 $5,437,108 Net premium and discount balance as % of stockholder's equity 38.30% 35.65% 40.13% 41.86% 40.43% 22
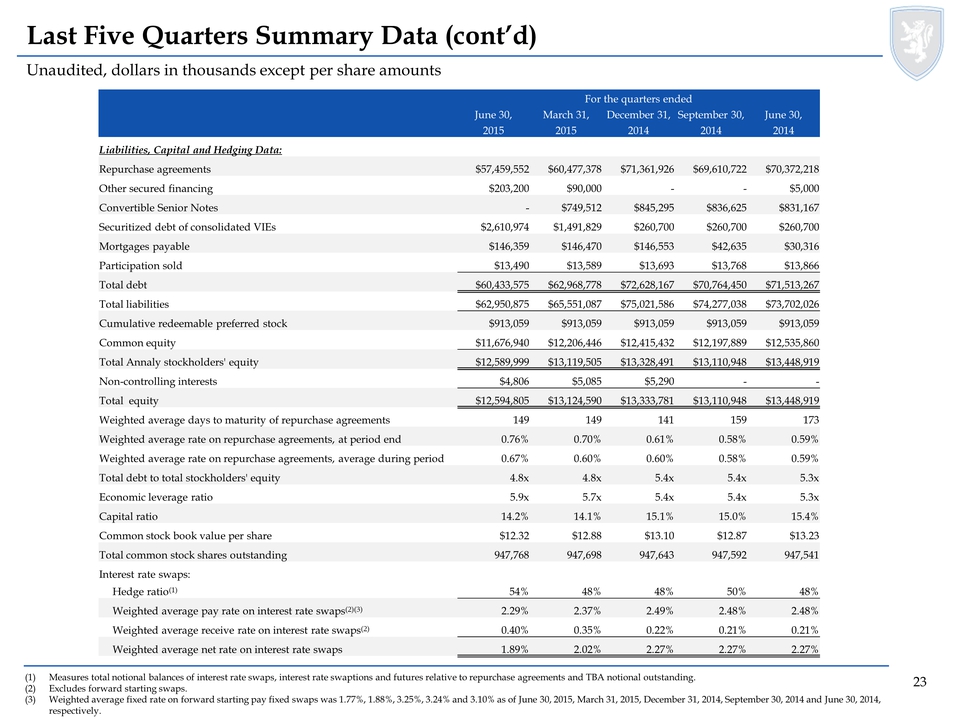
Last Five Quarters Summary Data (cont’d) Unaudited, dollars in thousands except per share amounts (1) Measures total notional balances of interest rate swaps, interest rate swaptions and futures relative to repurchase agreements and TBA notional outstanding. (2) Excludes forward starting swaps. (3) Weighted average fixed rate on forward starting pay fixed swaps was 1.77%, 1.88%, 3.25%, 3.24% and 3.10% as of June 30, 2015,March 31, 2015, December 31, 2014, September 30, 2014 and June 30, 2014, respectively. For the quarters ended June 30, March 31, December 31, September 30, June 30, 2015 2015 2014 2014 2014 Liabilities, Capital and Hedging Data: Repurchase agreements $57,459,552 $60,477,378 $71,361,926 $69,610,722 $70,372,218 Other secured financing $203,200 $90,000 - - - Convertible Senior Notes - $749,512 $845,295 $836,625 $831,167 Securitized debt of consolidated VIEs $2,610,974 $1,491,829 $260,700 $260,700 $260,700 Mortgages payable $146,359 $146,470 $146,553 $42,635 $30,316 Participation sold $13,490 $13,589 $13,693 $13,768 $13,866 Total debt $60,433,575 $62,968,778 $72,628,167 $70,764,450 $71,508,267 Total liabilities $62,950,875 $65,551,087 $75,021,586 $74,277,038 $73,702,026 Cumulative redeemable preferred stock $5,000 $913,059 $913,059 $913,059 $913,059 $913,059 Common equity $11,676,940 $12,206,446 $12,415,432 $12,197,889 $12,535,860 Total Annaly stockholders' equity $12,589,999 $13,119,505 $13,328,491 $13,110,948 $13,448,919 Non-controlling interests $4,806 $5,085 $5,290 - - Total equity $12,594,805 $13,124,590 $13,333,781 $13,110,948 $13,448,919 Weighted average days to maturity of repurchase agreements 149 149 141 159 173 Weighted average rate on repurchase agreements, at period end 0.76% 0.70% 0.61% 0.58% 0.59% Weighted average rate on repurchase agreements, average during period 0.67% 0.60% 0.60% 0.58% 0.59% Total debt to total stockholders' equity 4.8x 4.8x 5.4x 5.4x 5.3x Economic leverage ratio 5.9x 5.7x 5.4x 5.4x 5.3x Capital ratio 14.2% 14.1% 15.1% 15.0% 15.4% Common stock book value per share $12.32 $12.88 $13.10 $12.87 $13.23 Total common stock shares outstanding 947,768 947,698 947,643 947,592 947,541 Interest rate swaps: Hedge ratio(1) 54% 48% 48% 50% 48% Weighted average pay rate on interest rate swaps(2)(3) 2.29% 2.37% 2.49% 2.48% 2.48% Weighted average receive rate on interest rate swaps(2) 0.40% 0.35% 0.22% 0.21% 0.21% Weighted average net rate on interest rate swaps 1.89% 2.02% 2.27% 2.27% 2.27% 23
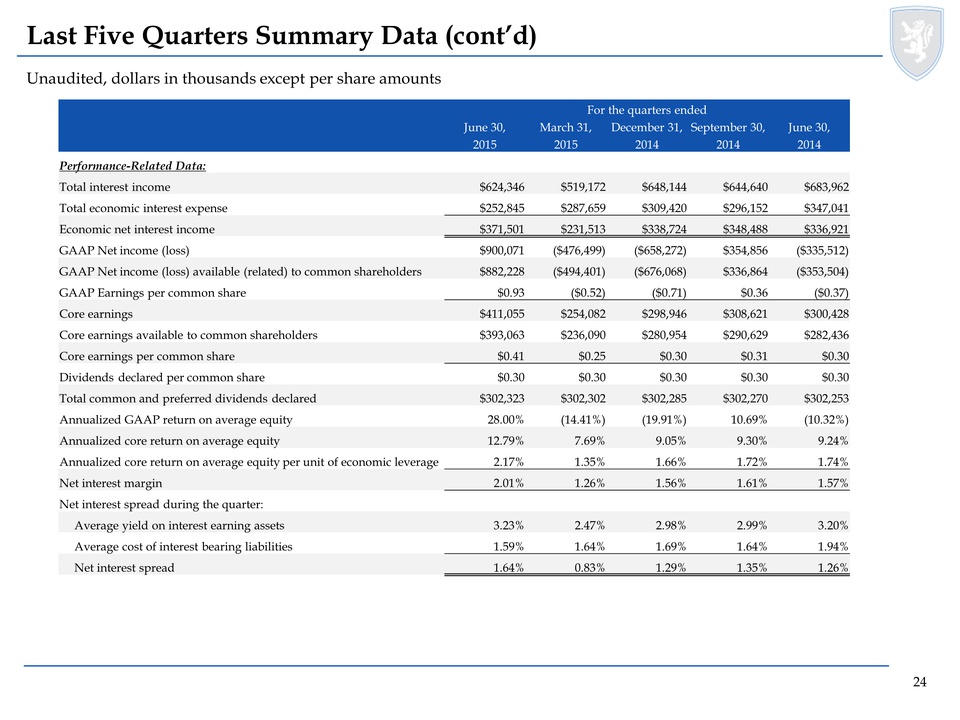
Last Five Quarters Summary Data (cont’d) Unaudited, dollars in thousands except per share amounts For the quarters ended June 30, March 31, December 31, September 30, June 30, 2015 2015 2014 2014 2014 Performance-Related Data: Total interest income $624,346 $519,172 $648,144 $644,640 $683,962 Total economic interest expense $252,845 $287,659 $309,420 $296,152 $347,041 Economic net interest income $371,501 $231,513 $338,724 $348,488 $336,921 GAAP Net income (loss) $900,071 ($476,499) ($658,272) $354,856 ($335,512) GAAP Net income (loss) available (related) to common shareholders $882,228 ($494,401) ($676,068) $336,864 ($353,504) GAAP Earnings per common share $0.93 ($0.52) ($0.71) $0.36 ($0.37) Core earnings $411,055 $254,082 $298,946 $308,621 $300,428 Core earnings available to common shareholders $393,063 $236,090 $280,954 $290,629 $282,436 Core earnings per common share $0.41 $0.25 $0.30 $0.31 $0.30 Dividends declared per common share $0.30 $0.30 $0.30 $0.30 $0.30 Total common and preferred dividends declared $302,323 $302,302 $302,285 $302,270 $302,253 Annualized GAAP return on average equity 28.00% (14.41%) (19.91%) 10.69% (10.32%) Annualized core return on average equity 12.79% 7.69% 9.05% 9.30% 9.24% Annualized core return on average equity per unit of economic leverage 2.17% 1.35% 1.66% 1.72% 1.74% Net interest margin 2.01% 1.26% 1.56% 1.61% 1.57% Net interest spread during the quarter: Average yield on interest earning assets 3.23% 2.47% 2.98% 2.99% 3.20% Average cost of interest bearing liabilities 1.59% 1.64% 1.69% 1.64% 1.94% Net interest spread 1.64% 0.83% 1.29% 1.35% 1.26% 24