Exhibit 99.2
February 24, 2016 Fourth Quarter 2015 Supplemental Information
This presentation, other written or oral communications and our public documents to which we refer contain or incorporate by reference certain forward-looking statements which are based on various assumptions (some of which are beyond our control) and may be identified by reference to a future period or periods or by the use of forward-looking terminology, such as "may," "will," "believe," "expect," "anticipate," "continue," or similar terms or variations on those terms or the negative of those terms. Actual results could differ materially from those set forth in forward-looking statements due to a variety of factors, including, but not limited to, changes in interest rates; changes in the yield curve; changes in prepayment rates; the availability of mortgage-backed securities and other securities for purchase; the availability of financing and, if available, the terms of any financings; changes in the market value of our assets; changes in business conditions and the general economy; our ability to grow our commercial business; our ability to grow our residential mortgage credit business; credit risks related to our investments in credit risk transfer securities, residential mortgage-backed securities and related residential mortgage credit assets, commercial real estate assets and corporate debt; our ability to consummate any contemplated investment opportunities; changes in government regulations affecting our business; our ability to maintain our qualification as a REIT for federal income tax purposes; and our ability to maintain our exemption from registration under the Investment Company Act of 1940, as amended. For a discussion of the risks and uncertainties which could cause actual results to differ from those contained in the forward-looking statements, see "Risk Factors" in our most recent Annual Report on Form 10-K and any subsequent Quarterly Reports on Form 10-Q. We do not undertake, and specifically disclaim any obligation, to publicly release the result of any revisions which may be made to any forward-looking statements to reflect the occurrence of anticipated or unanticipated events or circumstances after the date of such statements. Non-GAAP Financial Measures This presentation includes certain non-GAAP financial measures. Please see the section entitled “Non-GAAP Reconciliations” in the attached Appendix for a reconciliation to the most directly comparable GAAP financial measures. Safe Harbor Notice 1
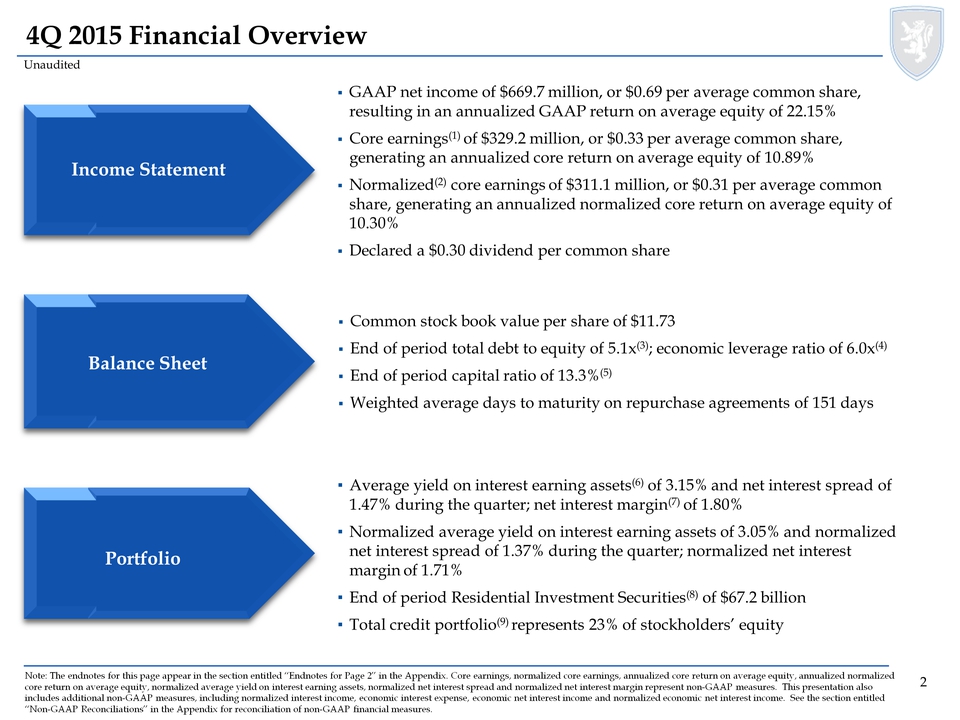
Note: The endnotes for this page appear in the section entitled “Endnotes for Page 2” in the Appendix. Core earnings, normalized core earnings, annualized core return on average equity, annualized normalized core return on average equity, normalized average yield on interest earning assets, normalized net interest spread and normalized net interest margin represent non-GAAP measures. This presentation also includes additional non-GAAP measures, including normalized interest income, economic interest expense, economic net interest income and normalized economic net interest income. See the section entitled “Non-GAAP Reconciliations” in the Appendix for reconciliation of non-GAAP financial measures. 4Q 2015 Financial Overview GAAP net income of $669.7 million, or $0.69 per average common share, resulting in an annualized GAAP return on average equity of 22.15% Core earnings (1) of $329.2 million, or $0.33 per average common share, generating an annualized core return on average equity of 10.89% Normalized(2)core earnings of $311.1 million, or $0.31 per average common share, generating an annualized normalized core return on average equity of 10.30% Declared a $0.30 dividend per common share Common stock book value per share of $11.73 End of period total debt to equity of 5.1x(3); economic leverage ratio of 6.0x(4) End of period capital ratio of 13.3%(5) Weighted average days to maturity on repurchase agreements of 151 days Average yield on interest earning assets(6)of 3.15% and net interest spread of 1.47% during the quarter; net interest margin(7) of 1.80% Normalized average yield on interest earning assets of 3.05% and normalized net interest spread of 1.37% during the quarter; normalized net interest margin of 1.71% End of period Residential Investment Securities(8)of $67.2 billion Total credit portfolio(9) represents 23% of stockholders’ equity Income Statement Balance Sheet Portfolio Unaudited 2
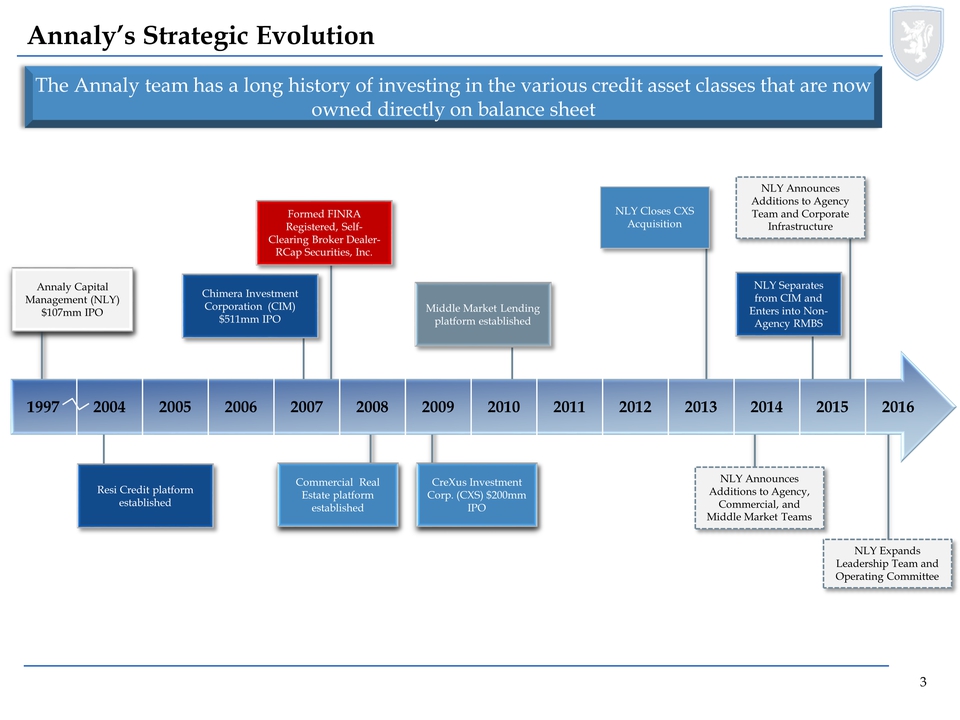
NLY Closes CXS Acquisition Formed FINRA Registered, Self-Clearing Broker Dealer-R Cap Securities, Inc. CreXus Investment Corp. (CXS) $200mm IPO Commercial Real Estate platform established Annaly Capital Management (NLY) $107mm IPO Annaly’s Strategic Evolution 1997 2004 2005 2006 2007 2008 2009 2010 2011 2012 2013 2014 2015 2016 Middle Market Lending platform established The Annaly team has a long history of investing in the various credit asset classes that are now owned directly on balance sheet NLY Announces Additions to Agency, Commercial, and Middle Market Teams Resi Credit platform established Chimera Investment Corporation (CIM) $511mm IPO NLY Announces Additions to Agency Team and Corporate Infrastructure NLY Separates from CIM and Enters into Non-Agency RMBS NLY Expands Leadership Team and Operating Committee 3
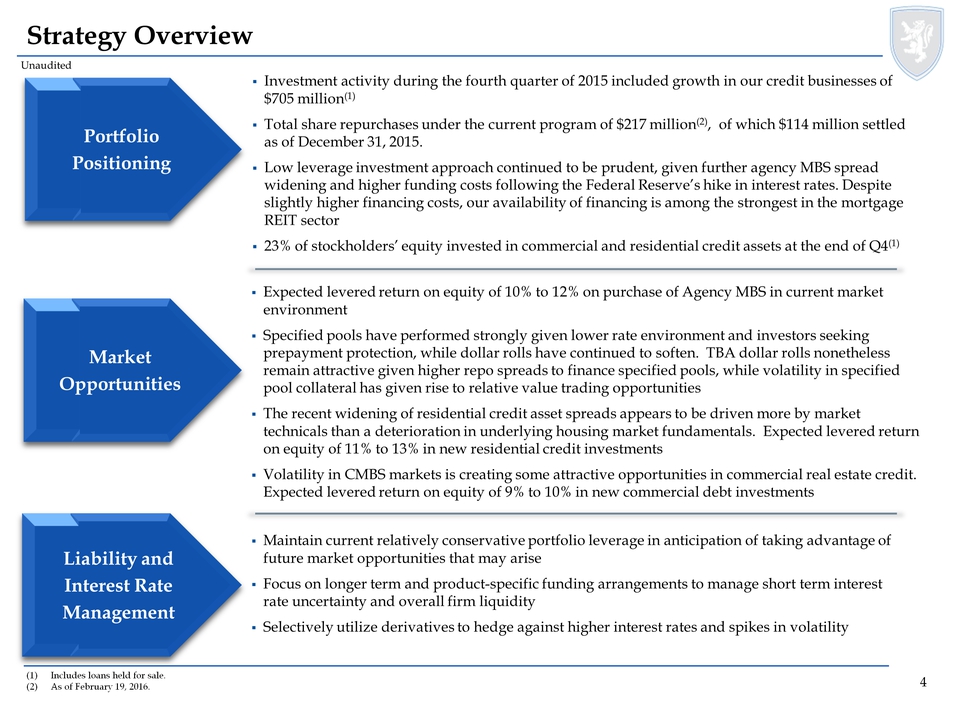
(1)Includes loans held for sale. (2)As of February 19, 2016. Strategy Overview Portfolio Positioning Market Opportunities Liability and Interest Rate Management Unaudited Investment activity during the fourth quarter of 2015 included growth in our credit businesses of $705 million (1) Total share repurchases under the current program of $217 million (2), of which$114 million settled as of December 31, 2015. Low leverage investment approach continued to be prudent, given further agency MBS spread widening and higher funding costs following the Federal Reserve’s hike in interest rates. Despite slightly higher financing costs, our availability of financing is among the strongest in the mortgage REIT sector 23% of stockholders’ equity invested in commercial and residential credit assets at the end of Q4 (1) Expected levered return on equity of 10% to 12% on purchase of Agency MBS in current market environment Specified pools have performed strongly given lower rate environment and investors seeking prepayment protection, while dollar rolls have continued to soften. TBA dollar rolls nonetheless remain attractive given higher repo spreads to finance specified pools, while volatility in specified pool collateral has given rise to relative value trading opportunities The recent widening of residential credit asset spreads appears to be driven more by market technical than a deterioration in underlying housing market fundamentals. Expected levered return on equity of 11% to 13% in new residential credit investments Volatility in CMBS markets is creating some attractive opportunities in commercial real estate credit. Expected levered return on equity of 9% to 10% in new commercial debt investments Maintain current relatively conservative portfolio leverage in anticipation of taking advantage of future market opportunities that may arise Focus on longer term and product-specific funding arrangements to manage short term interest rate uncertainty and overall firm liquidity Selectively utilize derivatives to hedge against higher interest rates and spikes in volatility 4
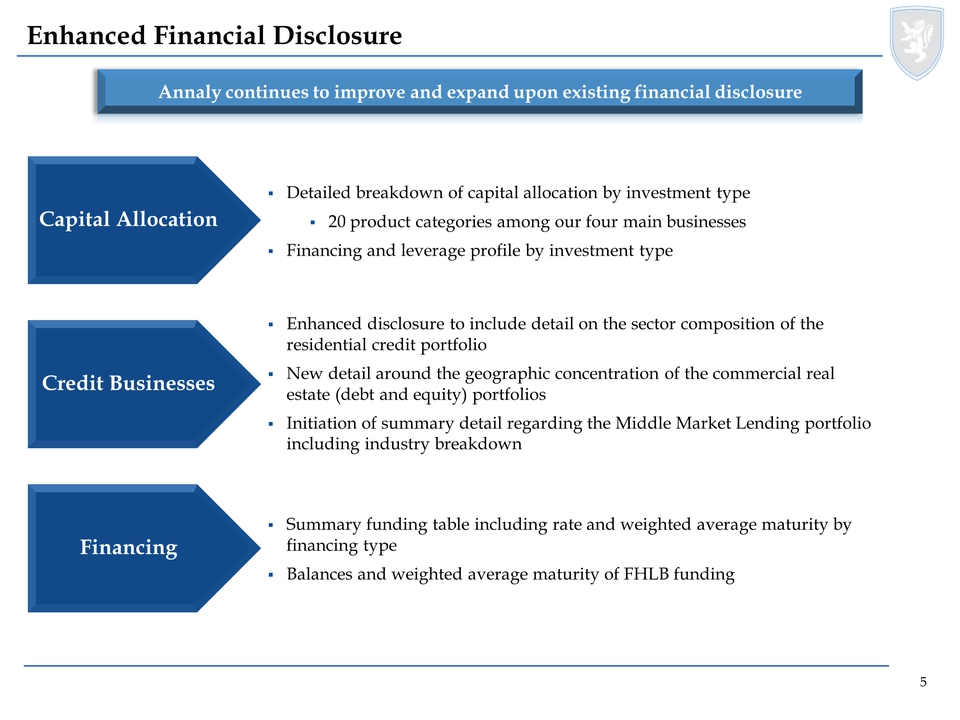
Enhanced Financial Disclosure Annaly continues to improve and expand upon existing financial disclosure Capital Allocation Financing Detailed breakdown of capital allocation by investment type 20 product categories among our four main businesses Financing and leverage profile by investment type Summary funding table including rate and weighted average maturity by financing type Balances and weighted average maturity of FHLB funding Credit Businesses Enhanced disclosure to include detail on the sector composition of the residential credit portfolio New detail around the geographic concentration of the commercial real estate (debt and equity) portfolios Initiation of summary detail regarding the Middle Market Lending portfolio including industry breakdown 5
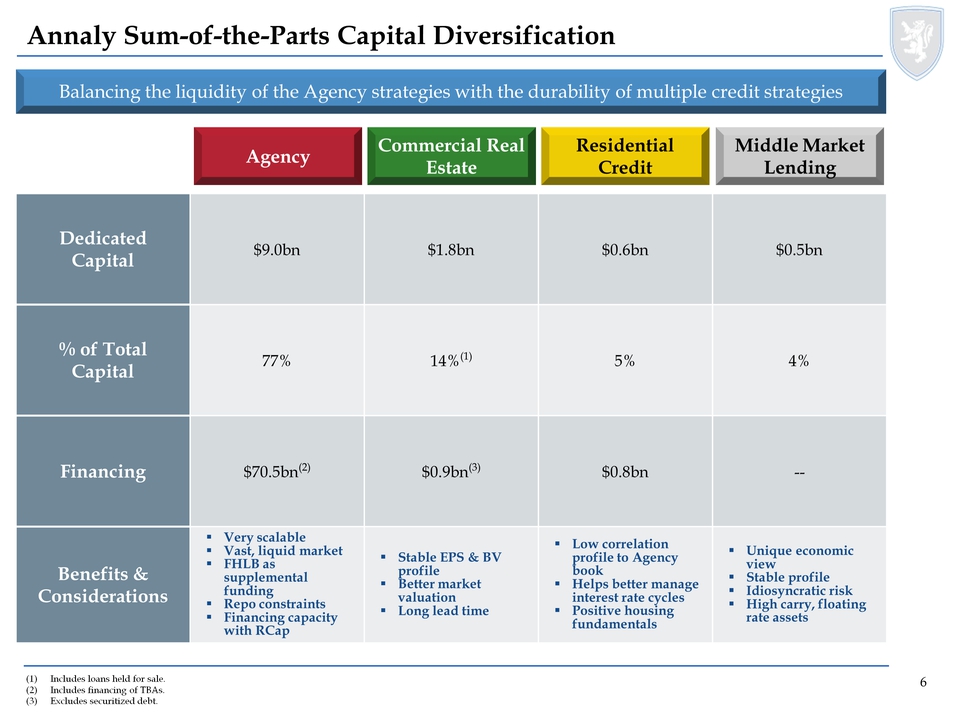
Balancing the liquidity of the Agency strategies with the durability of multiple credit strategies Annaly Sum-of-the-Parts Capital Diversification Agency Residential Credit Commercial Real Estate Middle Market Lending Dedicated Capital $9.0bn $1.8bn $0.6bn $0.5bn % of Total Capital 77% 14% (1) 5% 4% Financing $70.5bn (2) $0.9bn (3) $0.8bn -- Benefits & Considerations Very scalable Vast, liquid market FHLB as supplemental funding Repo constraints Financing capacity with R Cap Stable EPS & BV profile Better market valuation Long lead time Low correlation profile to Agency book Helps better manage interest rate cycles Positive housing fundamentals Unique economic view Stable profile Idiosyncratic risk High carry, floating rate assets (1) Includes loans held for sale. (2) Includes financing of TBAs. (3) Excludes securitized debt. 6
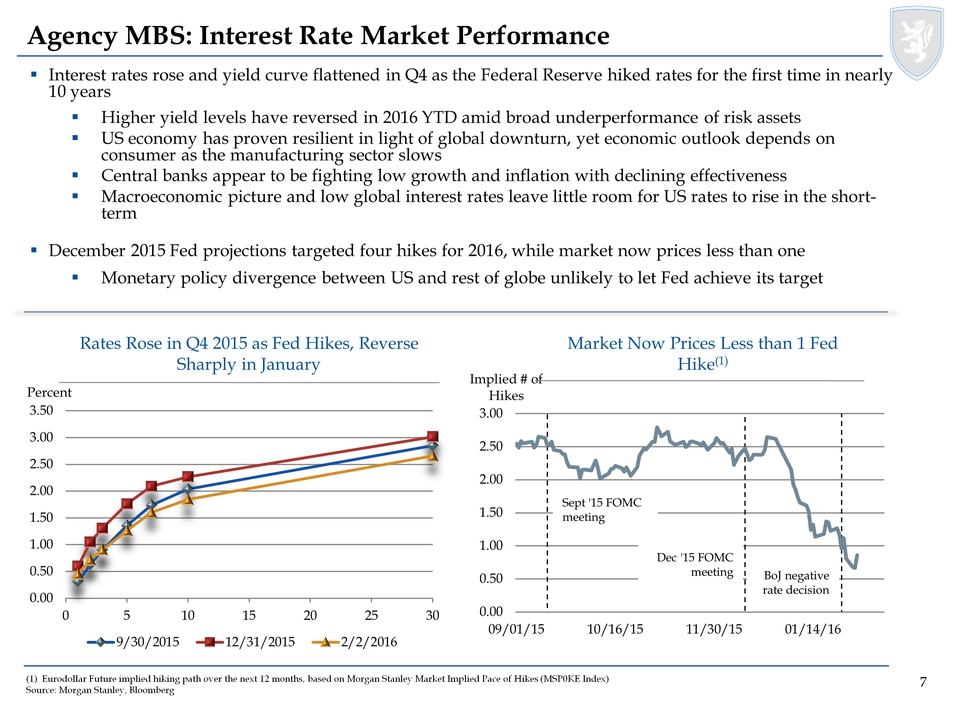
(1) Eurodollar Future implied hiking path over the next 12 months, based on Morgan Stanley Market Implied Pace of Hikes (MSP0KEIndex) Source: Morgan Stanley, Bloomberg Agency MBS: Interest Rate Market Performance Interest rates rose and yield curve flattened in Q4 as the Federal Reserve hiked rates for the first time in nearly 10 years Higher yield levels have reversed in 2016 YTD amid broad underperformance of risk assets US economy has proven resilient in light of global downturn, yet economic outlook depends on consumer as the manufacturing sector slows Central banks appear to be fighting low growth and inflation with declining effectiveness Macroeconomic picture and low global interest rates leave little room for US rates to rise in the short-term December 2015 Fed projections targeted four hikes for 2016, while market now prices less than one Monetary policy divergence between US and rest of globe unlikely to let Fed achieve its target Rates Rose in Q4 2015 as Fed Hikes, Reverse Sharply in January 0.00 0.50 1.00 1.50 2.00 2.50 3.00 3.50 0 5 10 15 20 25 30 Percent 9/30/2015 12/31/2015 2/2/2016 0.00 0.50 1.00 1.50 2.00 2.50 3.00 09/01/15 10/16/15 11/30/15 01/14/16 Implied # of Hikes Sept '15 FOMC meeting Dec '15 FOMC meeting BoJ negative rate decision Market Now Prices Less than 1 Fed Hike (1) 7
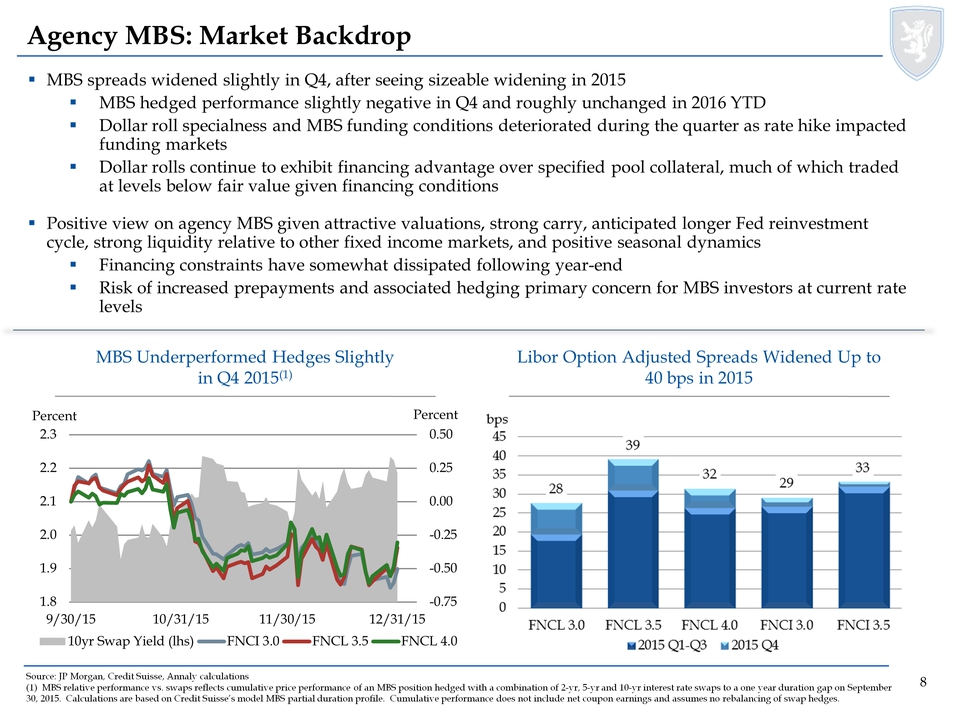
Source: JP Morgan, Credit Suisse, Annaly calculations (1) MBS relative performance vs. swaps reflects cumulative price performance of an MBS position hedged with a combination of2-yr, 5-yr and 10-yr interest rate swaps to a one year duration gap on September 30, 2015. Calculations are based on Credit Suisse’s model MBS partial duration profile. Cumulative performance does not include net coupon earnings and assumes no rebalancing of swap hedges. Agency MBS: Market Backdrop MBS spreads widened slightly in Q4, after seeing sizeable widening in 2015 MBS hedged performance slightly negative in Q4 and roughly unchanged in 2016 YTD Dollar roll specialness and MBS funding conditions deteriorated during the quarter as rate hike impacted funding markets Dollar rolls continue to exhibit financing advantage over specified pool collateral, much of which traded at levels below fair value given financing conditions Positive view on agency MBS given attractive valuations, strong carry, anticipated longer Fed reinvestment cycle, strong liquidity relative to other fixed income markets, and positive seasonal dynamics Financing constraints have somewhat dissipated following year-end Risk of increased prepayments and associated hedging primary concern for MBS investors at current rate levels Libor Option Adjusted Spreads Widened Up to 40 bps in 2015 -0.75 -0.50 -0.25 0.00 0.25 0.50 1.8 1.9 2.0 2.1 2.2 2.3 9/30/15 10/31/15 11/30/15 12/31/15 Percent Percent 10yr Swap Yield (lhs) FNCI 3.0 FNCL 3.5 FNCL 4.0 MBS Underperformed Hedges Slightly in Q4 2015(1) 28 39 32 29 33 0 5 10 15 20 25 30 35 40 45 bps 8
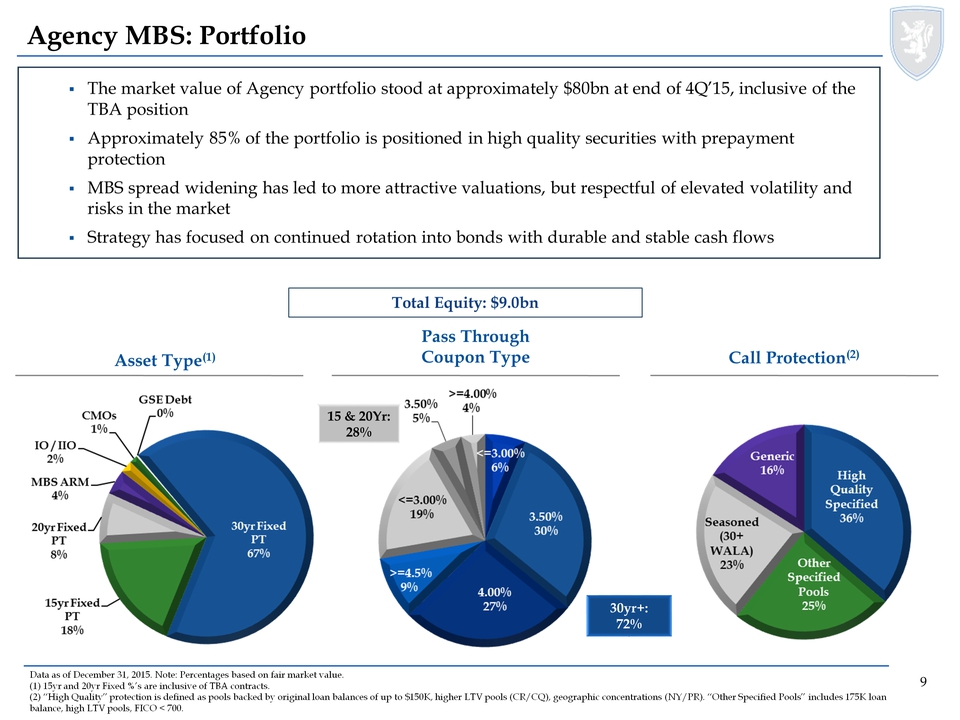
15 & 20Yr: 28% 30yr+: 72% Pass Through Coupon Type Agency MBS: Portfolio Data as of December 31, 2015. Note: Percentages based on fair market value. (1) 15yr and 20yr Fixed %’s are inclusive of TBA contracts. (2) “High Quality” protection is defined as pools backed by original loan balances of up to $150K, higher LTV pools (CR/CQ), geographic concentrations (NY/PR). “Other Specified Pools” includes 175K loan balance, high LTV pools, FICO < 700. The market value of Agency portfolio stood at approximately $80bn at end of 4Q’15, inclusive of the TBA position Approximately 85% of the portfolio is positioned in high quality securities with prepayment protection MBS spread widening has led to more attractive valuations, but respectful of elevated volatility and risks in the market Strategy has focused on continued rotation into bonds with durable and stable cash flows Asset Type(1) Call Protection(2) Total Equity: $9.0bn Agency MBS: Portfolio Asset Type (1) GSE Debt 0 CMOs 1% io/iio 2% MBS ARM 4% 8% 18% 67% .=4.00% 4% 3.50% 5% ,=3.00% 19% .=4.5% 9% 4.00% 27% 3.50% 30% Call Protection (2) Generic 16% High Quality Specified 36% Other Specified Pools 25% Seasoned (30+ WALA) 23% 9
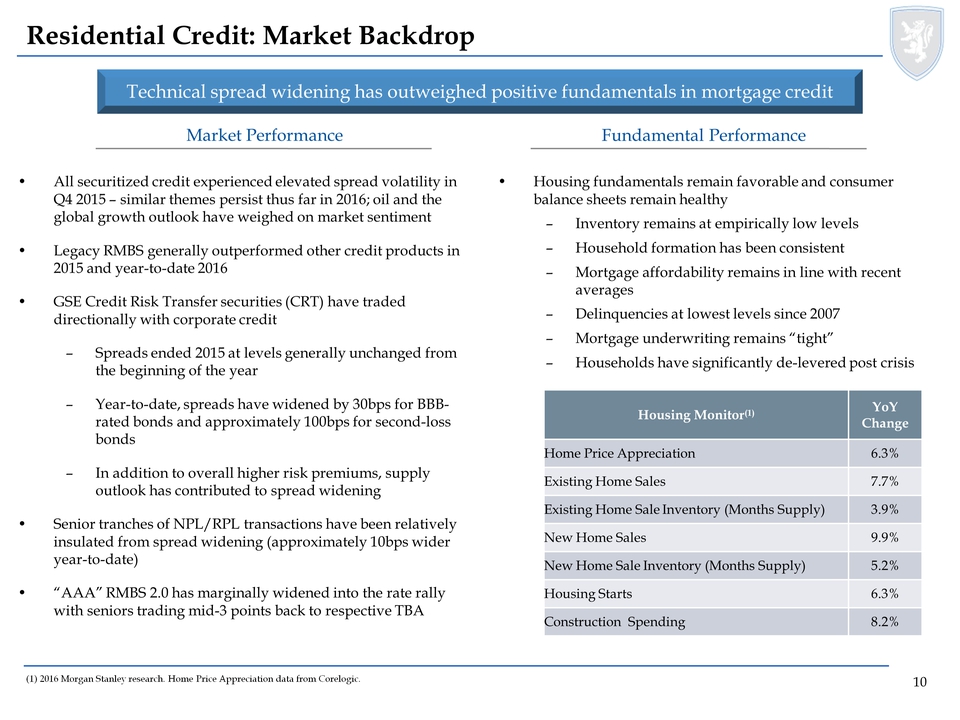
Market Performance Residential Credit: Market Backdrop Technical spread widening has outweighed positive fundamentals in mortgage credit (1) 2016 Morgan Stanley research. Home Price Appreciation data from Corelogic. Fundamental Performance All securitized credit experienced elevated spread volatility in Q4 2015 –similar themes persist thus far in 2016; oil and the global growth outlook have weighed on market sentiment Legacy RMBS generally outperformed other credit products in 2015 and year-to-date 2016 GSE Credit Risk Transfer securities (CRT) have traded directionally with corporate credit Spreads ended 2015 at levels generally unchanged from the beginning of the year Year-to-date, spreads have widened by 30bps for BBB-rated bonds and approximately 100bps for second-loss bonds In addition to overall higher risk premiums, supply outlook has contributed to spread widening Senior tranches of NPL/RPL transactions have been relatively insulated from spread widening (approximately 10bps wider year-to-date) “AAA” RMBS 2.0 has marginally widened into the rate rally with seniors trading mid-3 points back to respective TBA Housing fundamentals remain favorable and consumer balance sheets remain healthy Inventory remains at empirically low levels Household formation has been consistent Mortgage affordability remains in line with recent averages Delinquencies at lowest levels since 2007 Mortgage underwriting remains “tight” Households have significantly de-levered post crisis Housing Monitor(1) YoY Change Home Price Appreciation 6.3% Existing Home Sales 7.7% Existing Home Sale Inventory (Months Supply) 3.9% New Home Sales 9.9% New Home Sale Inventory (Months Supply) 5.2% Housing Starts 6.3% Construction Spending 8.2% 10
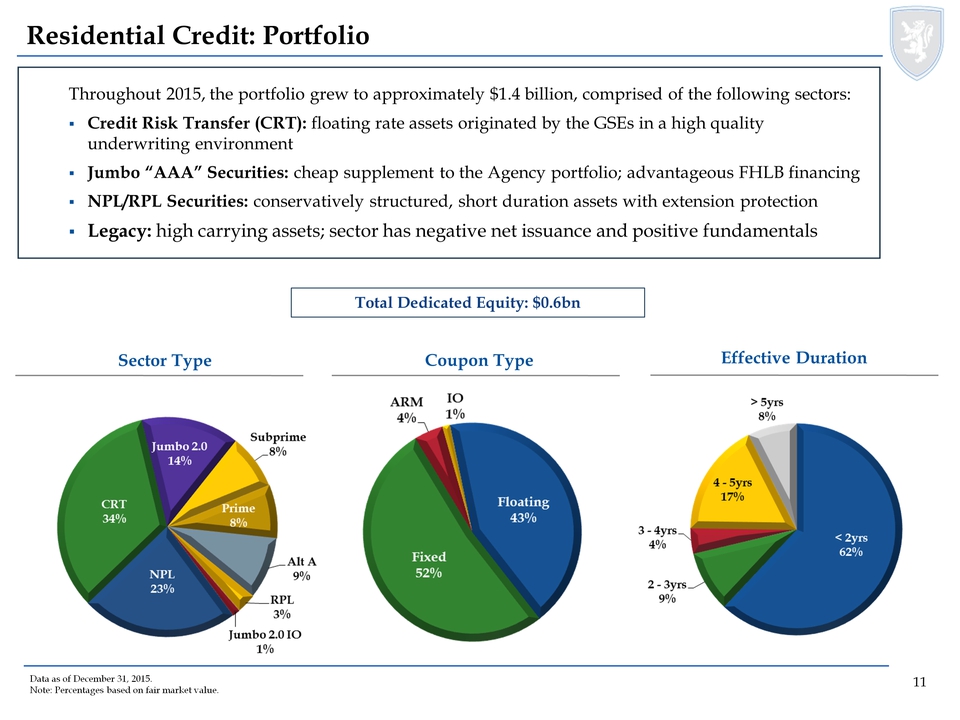
Residential Credit: Portfolio Data as of December 31, 2015. Note: Percentages based on fair market value. Throughout 2015, the portfolio grew to approximately $1.4 billion, comprised of the following sectors: Credit Risk Transfer (CRT): floating rate assets originated by the GSEs in a high quality underwriting environment Jumbo “AAA” Securities: cheap supplement to the Agency portfolio; advantageous FHLB financing NPL/RPL Securities: conservatively structured, short duration assets with extension protection Legacy: high carrying assets; sector has negative net issuance and positive fundamentals Sector Type Coupon Type Effective Duration Total Dedicated Equity: $0.6bn Subprime 8% Jumbo 2.0 14% CRT 34% NPL 23% Alt A 9% RPL 3% Jumbo 2.0 IO 1% ARM 4% IO 1% Floating 43% Fixed 52% >5yrs 8% 4 -5yrs 17% 3 - 4yrs 4% 2 – 3yrs 9% < 2yrs 62% 11

Commercial Real Estate: Portfolio Data as of December 31, 2015. Note: Percentages based on economic interest (1) Includes loans held for sale. Economic interest of $1.5 billion excluding loans held for sale at December 31, 2015. (2) Other includes 38 states, none of which represent more than 5% of total portfolio value. Providing capital for acquisitions and refinancings at higher leverage points in the capital structure on real estate with growth potential Focus on top tier sponsors, operating in good markets with rational business plans, and loan structures that mitigate risk Maximize returns through conservative financing strategies utilizing syndication relationships, credit facilities and the securitization market $1.9 billion Asset Type Sector Type Geographic Concentration(2) Total Dedicated Equity(1): $1.8bn Preferred Equity 7% AAA CMBS 3% B-Piece CMBS 18% Equity 14% First Mortgages 25% Mezzanine 33% Industrial 4% Hotel 6% Retail 16% Office 37% Other 6% Multifamily 31% Other 43% TX 8% FL 5% CA 33% NY 11% 12
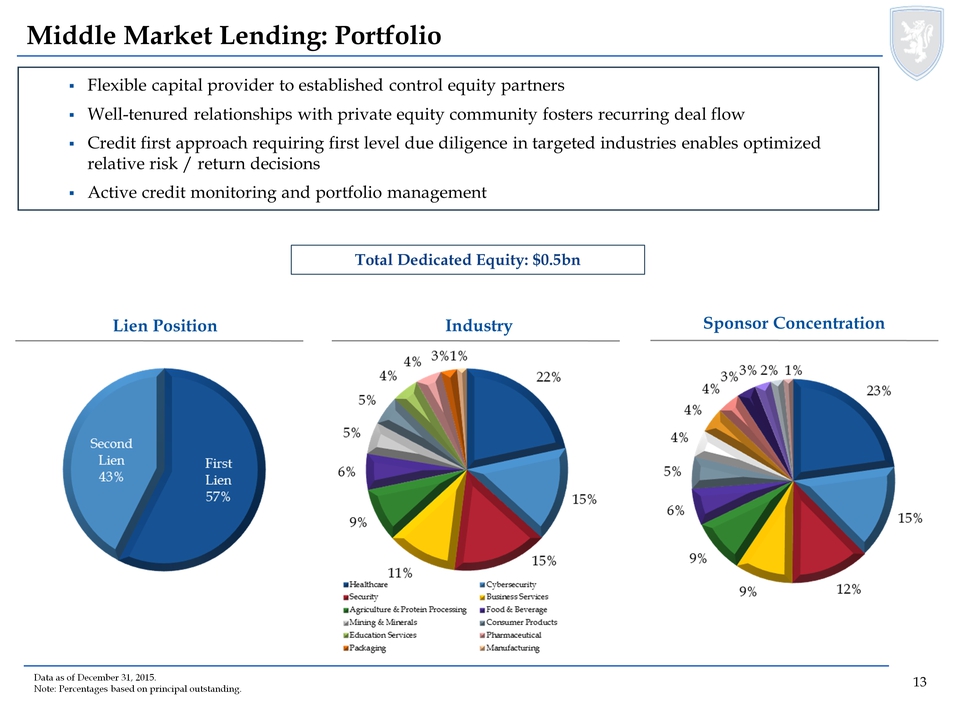
Middle Market Lending: Portfolio Lien Position Industry Sponsor Concentration Flexible capital provider to established control equity partners Well-tenured relationships with private equity community fosters recurring deal flow Credit first approach requiring first level due diligence in targeted industries enables optimized relative risk / return decisions Active credit monitoring and portfolio management Total Dedicated Equity: $0.5bn Data as of December 31, 2015. Note: Percentages based on principal outstanding. Lien Position Second Lien 43% First Lien 57% Industry1% 3% 4% 5% 5% 6% 9% 15% 15% 22% Healthcare Security Agricultural & Protein Processing Mining & Minerals Education Services Packaging Cybersecurity Business Services Food & Beverage Consumer Products Pharmaceutical Manufacturing 1% 2% 3% 3% 4% 4% 4% 5% 6% 9% 9% 12% 15% 23% 13
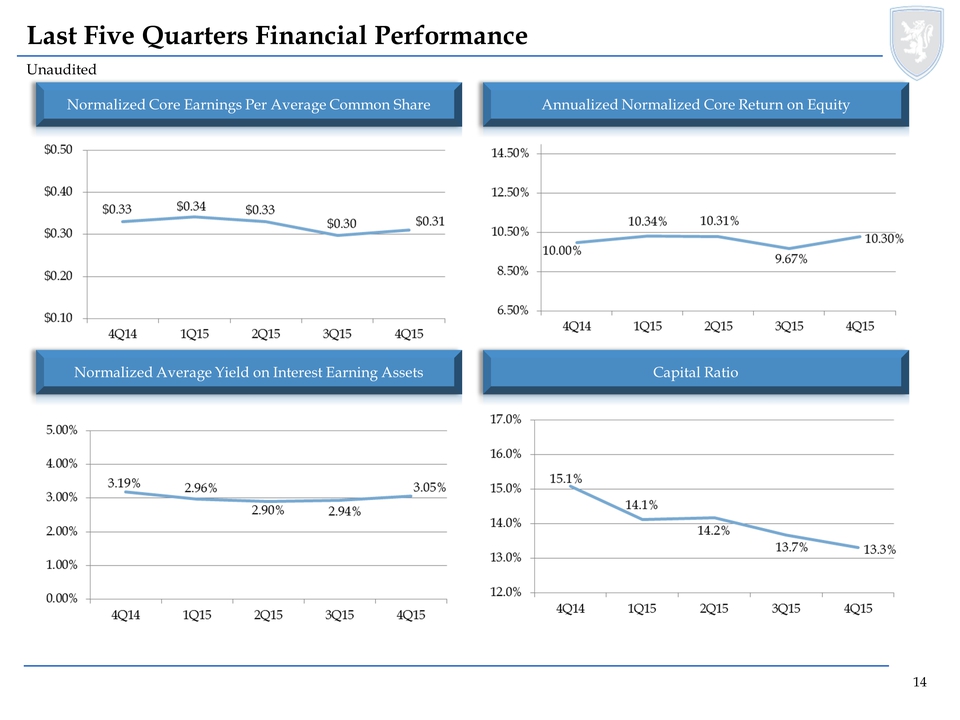
Last Five Quarters Financial Performance Unaudited Normalized Core Earnings Per Average Common Share $0.10 $0.20 $0.30 $0.40 $0.50 4Q14 1Q15 2Q15 3Q15 4Q15 $0.33 $0.34 $0.33 $0.30 $0.31 Annualized Normalized Core Return on Equity 6.50% 8.50% 10.50% 12.50% 14.50% 4Q14 1Q15 2Q15 3Q15 4Q15 10.00% 10.34% 10.31% 9.67% 10.30% Normalized Average Yield on Interest Earning Assets 0.00% 1.00% 2.00% 3.00% 4.00% 5.00% 4Q14 1Q15 2Q15 3Q15 4Q15 3.19% 2.96% 2.90% 2.94% 2.94% 3.05% Capital Ratio 12.0% 13.0% 14.0% 15.0% 16.0% 17.0% 4Q14 1Q15 2Q15 3Q15 4Q15 15.1% 14.1% 14.2% 13.7% 13.3% 14
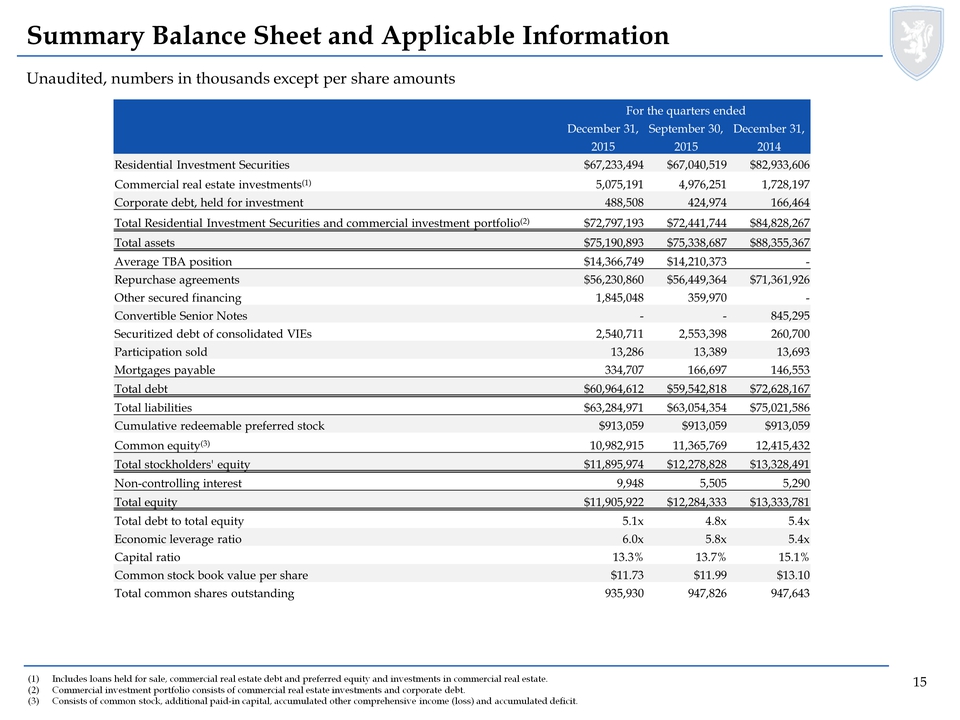
Unaudited, numbers in thousands except per share amounts Summary Balance Sheet and Applicable Information (1)Includes loans held for sale, commercial real estate debt and preferred equity and investments in commercial real estate. (2)Commercial investment portfolio consists of commercial real estate investments and corporate debt. (3)Consists of common stock, additional paid-in capital, accumulated other comprehensive income (loss) and accumulated deficit. For the quarters ended December 31, September 30, December 31, 2015 2015 2014 Residential Investment Securities $67,233,494 $67,040,519 $82,933,606 Commercial real estate investments(1) 5,075,191 4,976,251 1,728,197 Corporate debt, held for investment 488,508 424,974 166,464 Total Residential Investment Securities and commercial investment portfolio(2) $72,797,193 $72,441,744 $84,828,267 Total assets $75,190,893 $75,338,687 $88,355,367 Average TBA position $14,366,749 $14,210,373 - Repurchase agreements $56,230,860 $56,449,364 $71,361,926 Other secured financing 1,845,048 359,970 - Convertible Senior Notes - - 845,295 Securitized debt of consolidated VIEs 2,540,711 2,553,398 260,700 Participation sold 13,286 13,389 13,693 Mortgages payable 334,707 166,697 146,553 Total debt $60,964,612 $59,542,818 $72,628,167 Total liabilities $63,284,971 $63,054,354 $75,021,586 Cumulative redeemable preferred stock $913,059 $913,059 $913,059 Common equity(3) 10,982,915 11,365,769 12,415,432 Total stockholders' equity $11,895,974 $12,278,828 $13,328,491 Non-controlling interest 9,948 5,505 5,290 Total equity $11,905,922 $12,284,333 $13,333,781 Total debt to total equity 5.1x 4.8x 5.4x Economic leverage ratio 6.0x 5.8x 5.4x Capital ratio 13.3% 13.7% 15.1% Common stock book value per share $11.73 $11.99 $13.10 Total common shares outstanding 935,930 947,826 947,643 15
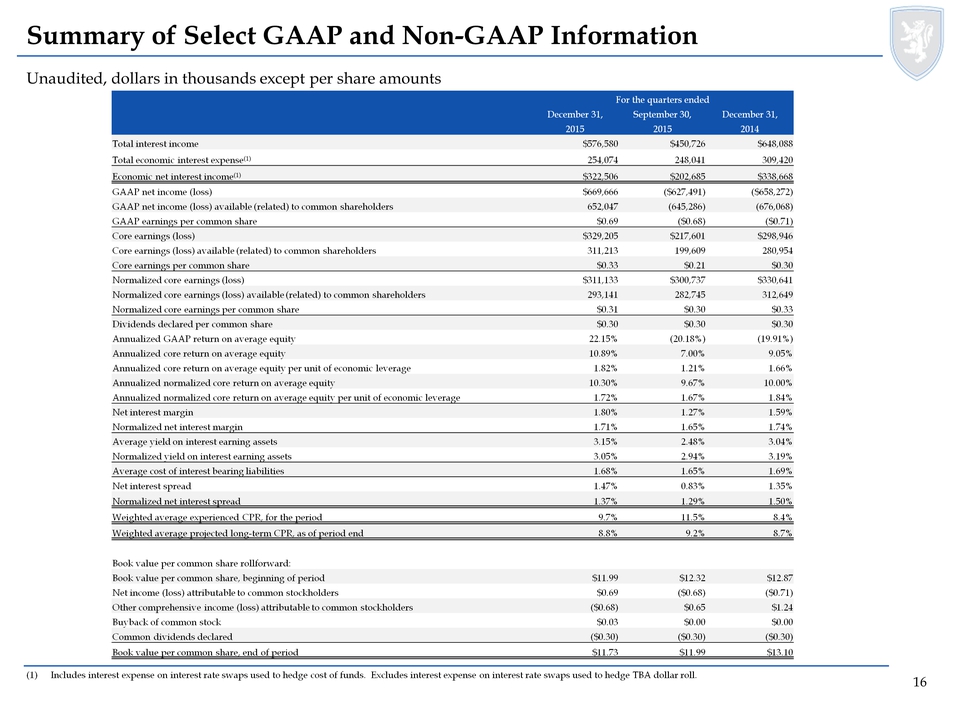
Unaudited, dollars in thousands except per share amounts Summary of Select GAAP and Non-GAAP Information (1)Includes interest expense on interest rate swaps used to hedge cost of funds. Excludes interest expense on interest rate swaps used to hedge TBA dollar roll. For the quarters ended December 31, September 30, December 31, 2015 2015 2014 Total interest income $576,580 $450,726 $648,088 Total economic interest expense(1) 254,074 248,041 309,420 Economic net interest income(1) $322,506 $202,685 $338,668 GAAP net income (loss) $669,666 ($627,491) ($658,272) GAAP net income (loss) available (related) to common shareholders 652,047 (645,286) (676,068) GAAP earnings per common share $0.69 ($0.68) ($0.71) Core earnings (loss) $329,205 $217,601 $298,946 Core earnings (loss) available (related) to common shareholders 311,213 199,609 280,954 Core earnings per common share $0.33 $0.21 $0.30 Normalized core earnings (loss) $311,133 $300,737 $330,641 Normalized core earnings (loss) available (related) to common shareholders 293,141 282,745 312,649 Normalized core earnings per common share $0.31 $0.30 $0.33 Dividends declared per common share $0.30 $0.30 $0.30 Annualized GAAP return on average equity 22.15% (20.18%) (19.91%) Annualized core return on average equity 10.89% 7.00% 9.05% Annualized core return on average equity per unit of economic leverage 1.82% 1.21% 1.66% Annualized normalized core return on average equity 10.30% 9.67% 10.00% Annualized normalized core return on average equity per unit of economic leverage 1.72% 1.67% 1.84% Net interest margin 1.80% 1.27% 1.59% Normalized net interest margin 1.71% 1.65% 1.74% Average yield on interest earning assets 3.15% 2.48% 3.04% Normalized yield on interest earning assets 3.05% 2.94% 3.19% Average cost of interest bearing liabilities 1.68% 1.65% 1.69% Net interest spread 1.47% 0.83% 1.35% Normalized net interest spread 1.37% 1.29% 1.50% Weighted average experienced CPR, for the period 9.7% 11.5% 8.4% Weighted average projected long-term CPR, as of period end 8.8% 9.2% 8.7% Book value per common share rollforward: Book value per common share, beginning of period $11.99 $12.32 $12.87 Net income (loss) attributable to common stockholders $0.69 ($0.68) ($0.71) Other comprehensive income (loss) attributable to common stockholders ($0.68) $0.65 $1.24 Buyback of common stock $0.03 $0.00 $0.00 Common dividends declared ($0.30) ($0.30) ($0.30) Book value per common share, end of period $11.73 $11.99 $13.10 16
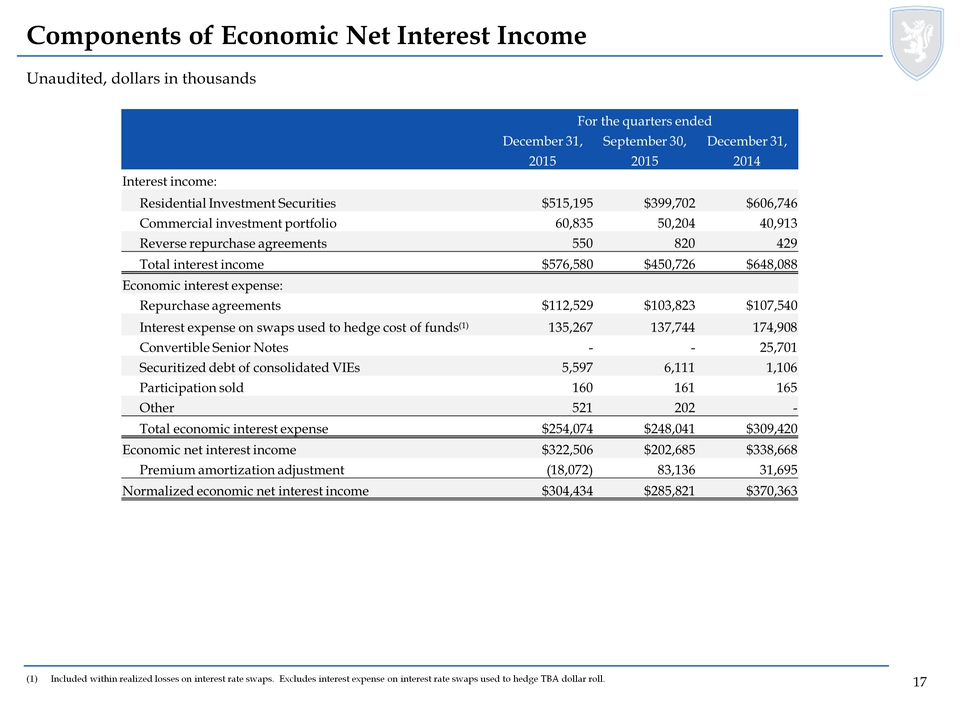
Unaudited, dollars in thousands Components of Economic Net Interest Income (1)Included within realized losses on interest rate swaps. Excludes interest expense on interest rate swaps used to hedge TBA dollar roll. For the quarters ended December 31, September 30, December 31, 2015 2015 2014 Interest income: Residential Investment Securities $515,195 $399,702 $606,746 Commercial investment portfolio 60,835 50,204 40,913 Reverse repurchase agreements 550 820 429 Total interest income $576,580 $450,726 $648,088 Economic interest expense: Repurchase agreements $112,529 $103,823 $107,540 Interest expense on swaps used to hedge cost of funds(1) 135,267 137,744 174,908 Convertible Senior Notes - - 25,701 Securitized debt of consolidated VIEs 5,597 6,111 1,106 Participation sold 160 161 165 Other 521 202 - Total economic interest expense $254,074 $248,041 $309,420 Economic net interest income $322,506 $202,685 $338,668 Premium amortization adjustment (18,072) 83,136 31,695 Normalized economic net interest income $304,434 $285,821 $370,363 17
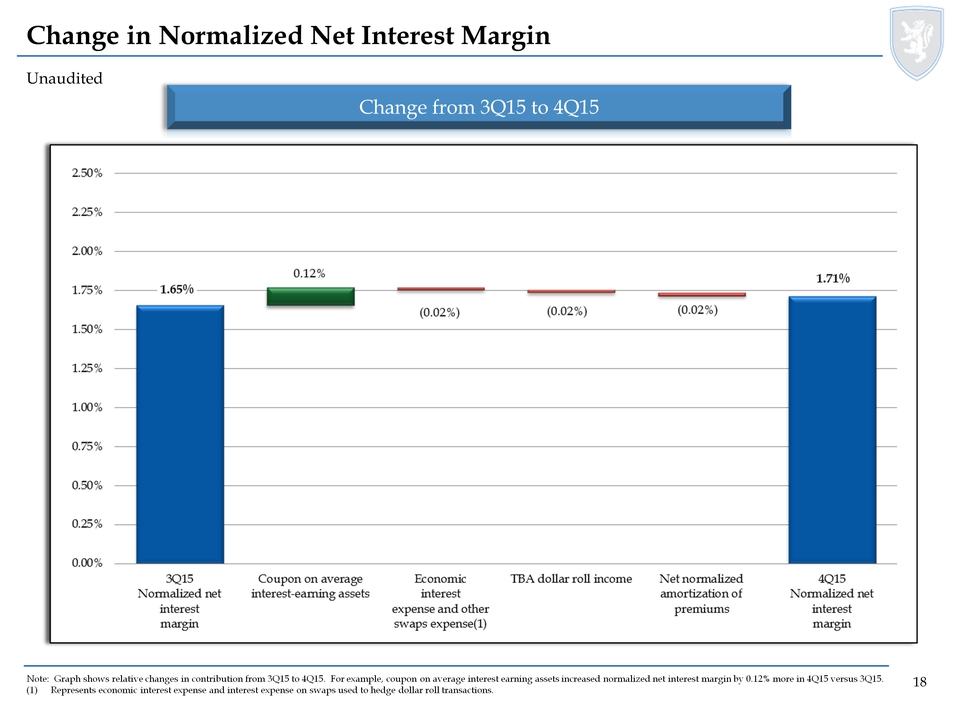
Unaudited Change in Normalized Net Interest Margin Change from 3Q15 to 4Q15 Note: Graph shows relative changes in contribution from 3Q15 to 4Q15. For example, coupon on average interest earning assets increased normalized net interest margin by 0.12% more in 4Q15 versus 3Q15. (1)Represents economic interest expense and interest expense on swaps used to hedge dollar roll transactions. 0.00% 0.25% 0.50% 0.75% 1.00% 1.25% 1.50% 1.75% 2.00% 2.25% 2.50% 3Q15 Normalized net interest margin Coupon on average interest-earnings assets Economic interest expense and other swaps expense (1) TBA dollar roll income Net normalized amortization of premiums 4Q15 Normalized net interest margin 1.65% 0.12% (0.02%) (0.02%) (0.02%) 1.71% 18
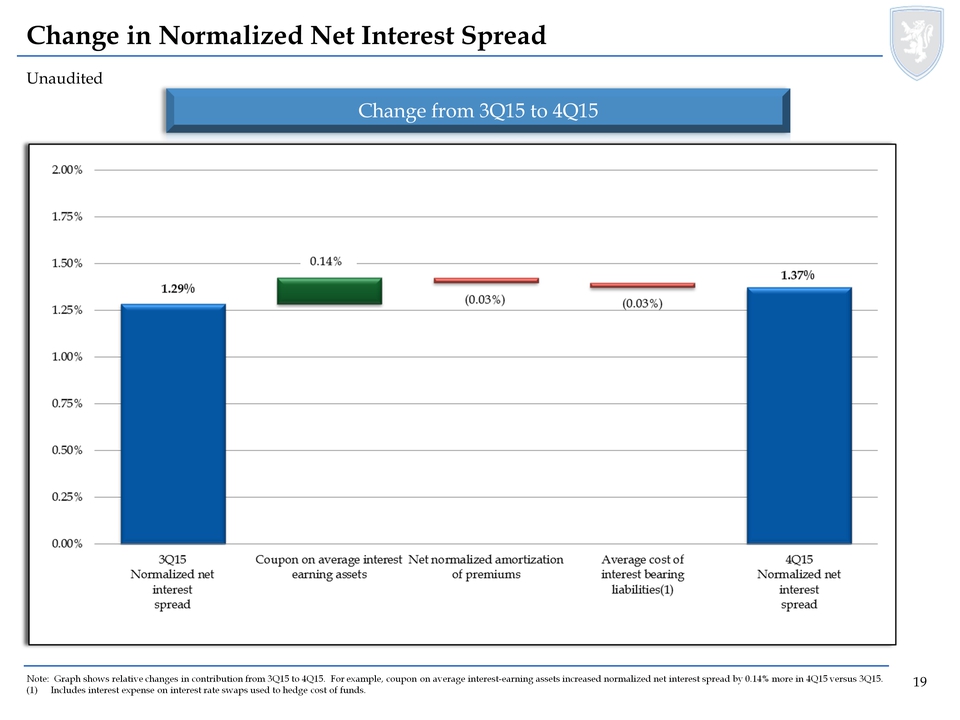
Unaudited Change in Normalized Net Interest Spread Change from 3Q15 to 4Q15 Note: Graph shows relative changes in contribution from 3Q15 to 4Q15. For example, coupon on average interest-earning assets increased normalized net interest spread by 0.14% more in 4Q15 versus 3Q15. (1)Includes interest expense on interest rate swaps used to hedge cost of funds. 0.00% 0.25% 0.50% 0.75% 1.00% 1.25% 1.50% 1.75% 2.00% 3Q15 Normalized net interest spread Coupon on average interest earning assets Net normalized amortization of premiums Average cost of interest bearing liabilities (1) 4Q15 Normalized net interest spread 1.29% 0.14% (0.03%) (0.03%) 1.37% 19
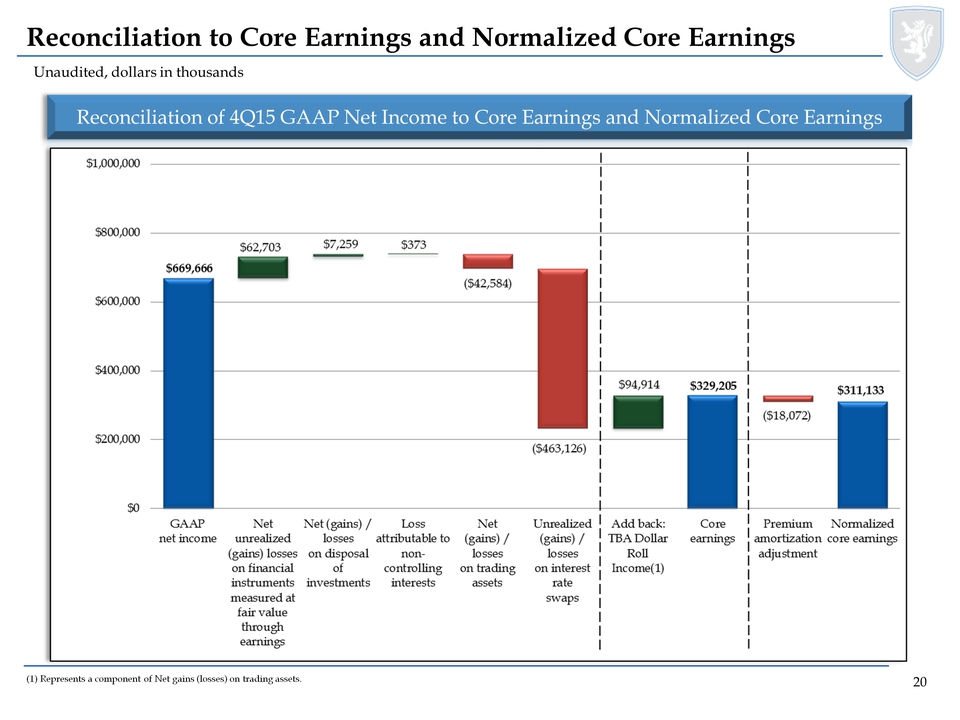
Unaudited, dollars in thousands Reconciliation to Core Earnings and Normalized Core Earnings Reconciliation of 4Q15 GAAP Net Income to Core Earnings and Normalized Core Earnings (1) Represents a component of Net gains (losses) on trading assets. $0 $200,000 $400,000 $600,000 $800,000 $1,000,000 GAAP net income Net unrealized (gains) losses on financial instruments measured at fair value through earnings Net (gains)/ losses on disposal of investments Loss attributable to non-controlling interests Net (gains)/ losses on interest rate swaps Add back: TBA Dollar Roll Income (1) Core earnings Premium amortization adjustment Normalized core earnings $669,666 $62,703 $7,259 $373 ($42,584) ($463,126) $94,914 $329,205 ($18,072) $311,133 20
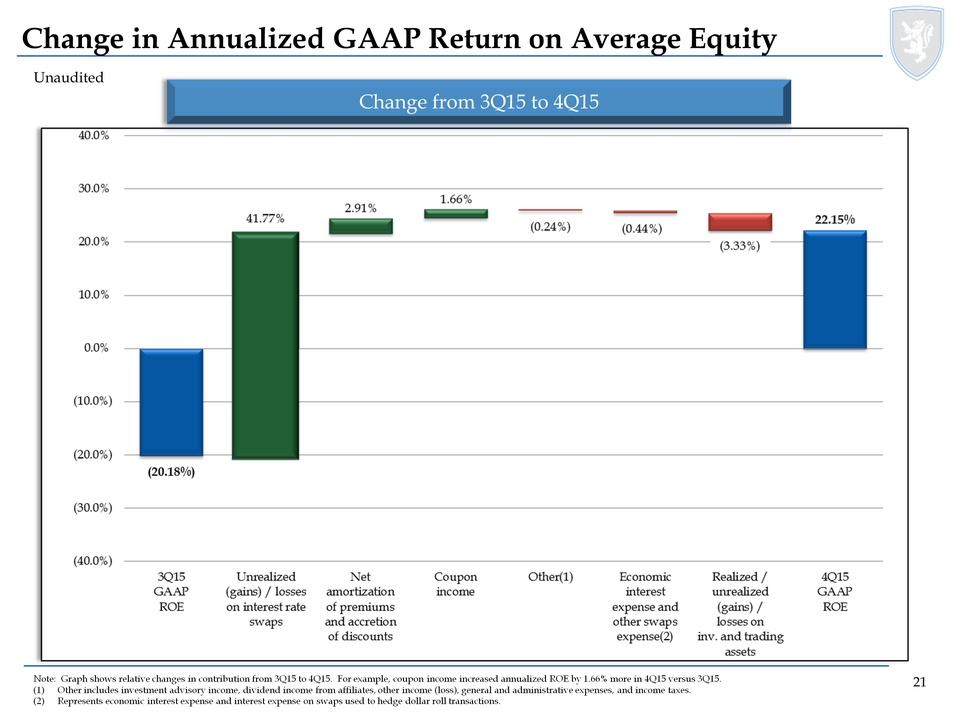
Unaudited Change in Annualized GAAP Return on Average Equity Change from 3Q15 to 4Q15 Note: Graph shows relative changes in contribution from 3Q15 to 4Q15. For example, coupon income increased annualized ROE by 1.66% more in 4Q15 versus 3Q15. (1)Other includes investment advisory income, dividend income from affiliates, other income (loss), general and administrative expenses, and income taxes. (2)Represents economic interest expense and interest expense on swaps used to hedge dollar roll transactions. (40.0%) (30.0%) (20.0%) (10.0%) 0.0% 10.0% 20.0% 30.0% 40.0% 3Q15 GAAP ROE Unrealized (gains)/losses on interest rate swaps Net amortization of premiums and accretion of discounts Coupon income Other (1) Economic interest expense and other swaps expense (2) Realized / unrealized (gains)/losses on inv. And trading assets 4Q15 GAAP ROE (20.18%) 41.77% 2.91% 1.66% (0.24%) (0.44%) (3.33%) 22.15% 21
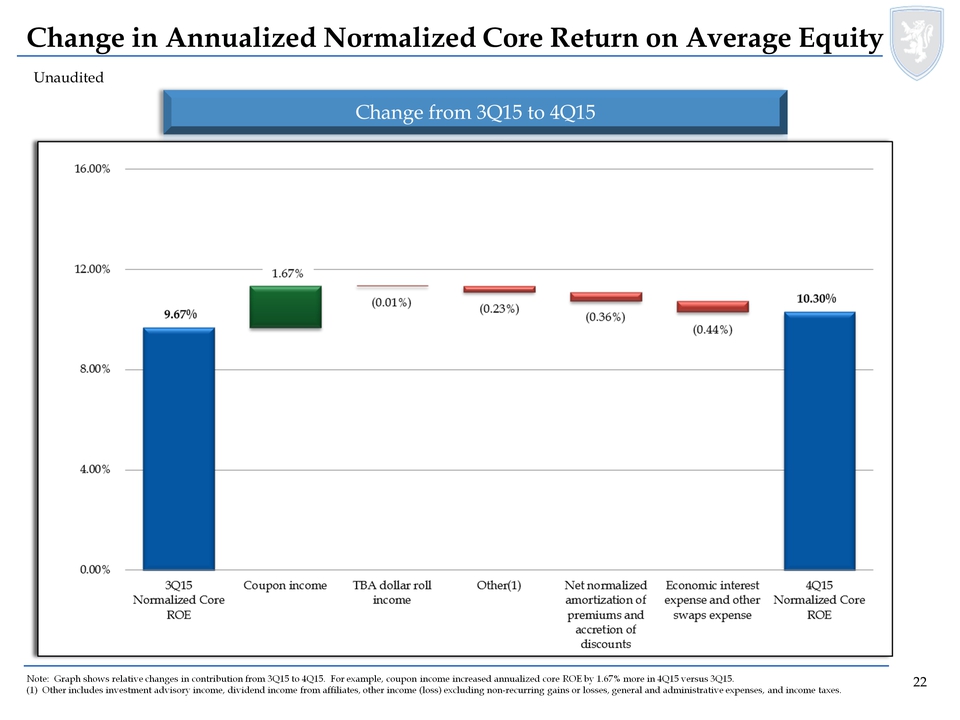
Unaudited Change in Annualized Normalized Core Return on Average Equity Change from 3Q15 to 4Q15 Note: Graph shows relative changes in contribution from 3Q15 to 4Q15. For example, coupon income increased annualized core ROE by 1.67% more in 4Q15 versus 3Q15. (1) Other includes investment advisory income, dividend income from affiliates, other income (loss) excluding non-recurring gains or losses, general and administrative expenses, and income taxes. 0.00% 4.00% 8.00% 12.00% 16.00% 3Q15 Normalized Core ROE Coupon income TBA dollar roll income Other (1) Net normalized amortization of premiums and accretion of discounts Economic interest expense and other swaps expense 4Q15 Normalized Core ROE 9.67% 1.67% (0.01%) (0.23%) (0.36%) (0.44%) 10.30% 22
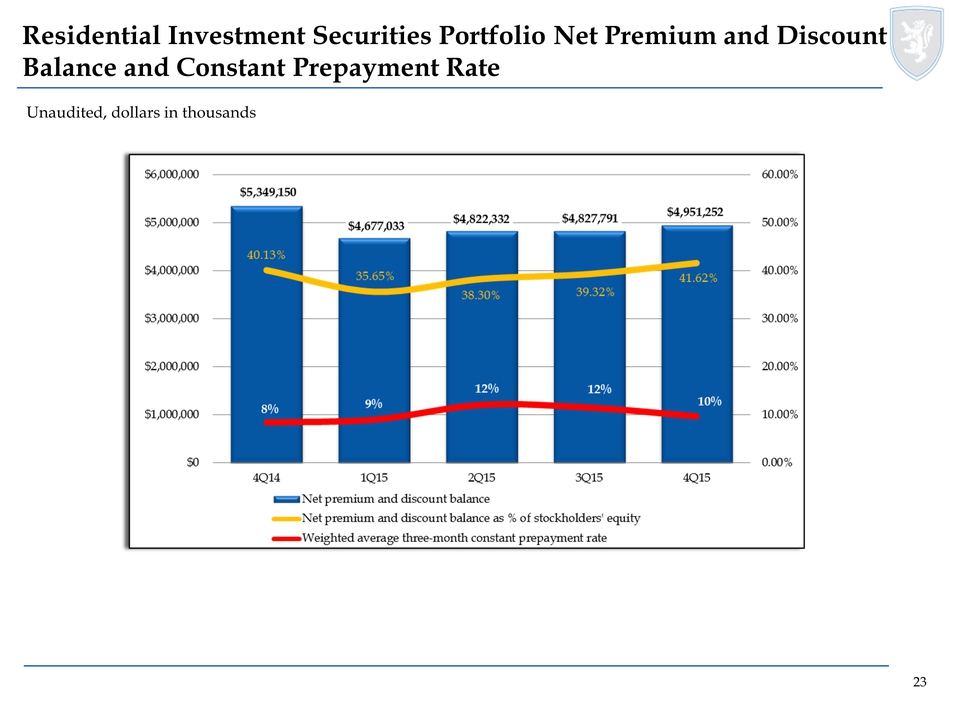
Unaudited, dollars in thousands Residential Investment Securities Portfolio Net Premium and Discount Balance and Constant Prepayment Rate $1,000,000 $2,000,000 $3,000,000 $4,000,000 $5,000,000 $6,000,000 4Q14 1Q15 2Q15 3Q15 4Q15 0.00% 10.00% 20.00% 30.00% 40.00% 50.00% 60.00% 8% 9% 12% 12% 10% 40.13% 36.65% 38.30% 39.32% 41.62% $5,349,150 $4,677,033 $4,822,332 $4,827,791 $4,951,252 Net premium and discount balance Net premium and discount balance as % of stockholders’ equity Weighted average three-month constant prepayment rate 23
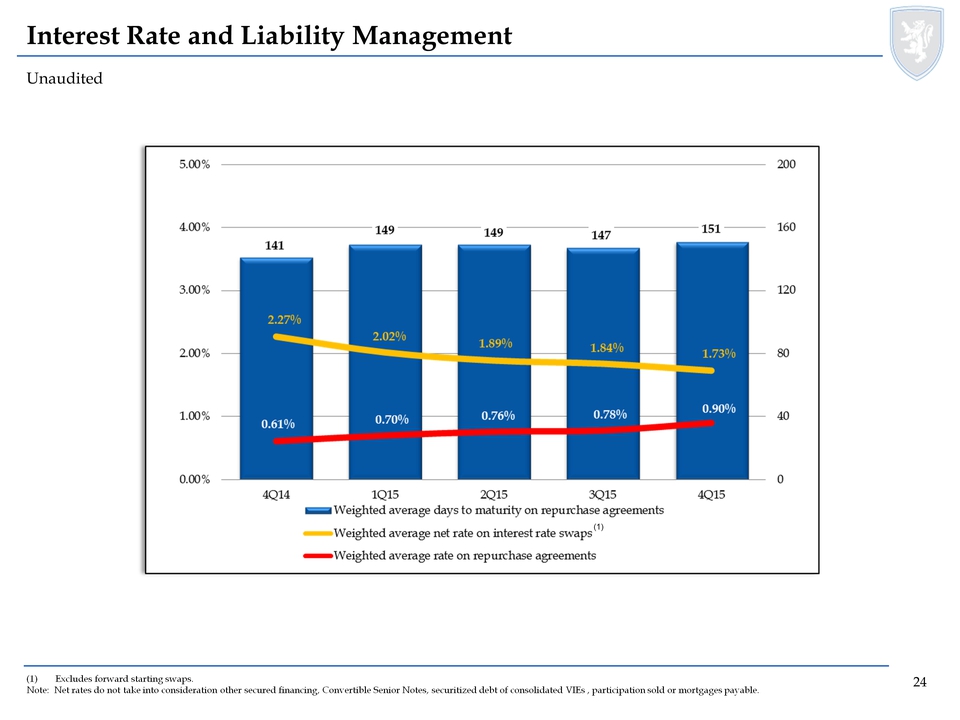
Unaudited Interest Rate and Liability Management (1)Excludes forward starting swaps. Note: Net rates do not take into consideration other secured financing, Convertible Senior Notes, securitized debt of consolidated VIEs , participation sold or mortgages payable. (1) 0.00% 1.00% 2.00% 3.005 4.00% 5.00% 4Q14 1Q15 2Q15 3Q15 4Q15 0 40 80 120 160 200 0.61% 0.70% 0.76% 0.78% 0.90% 2.27% 2.02% 1.89% 1.84% 1.73% 141 149 149 147 151 Weighted average days to maturity on repurchase agreements Weighted average net rate on interest rate swaps (1) Weighted average rate on repurchase agreements 24
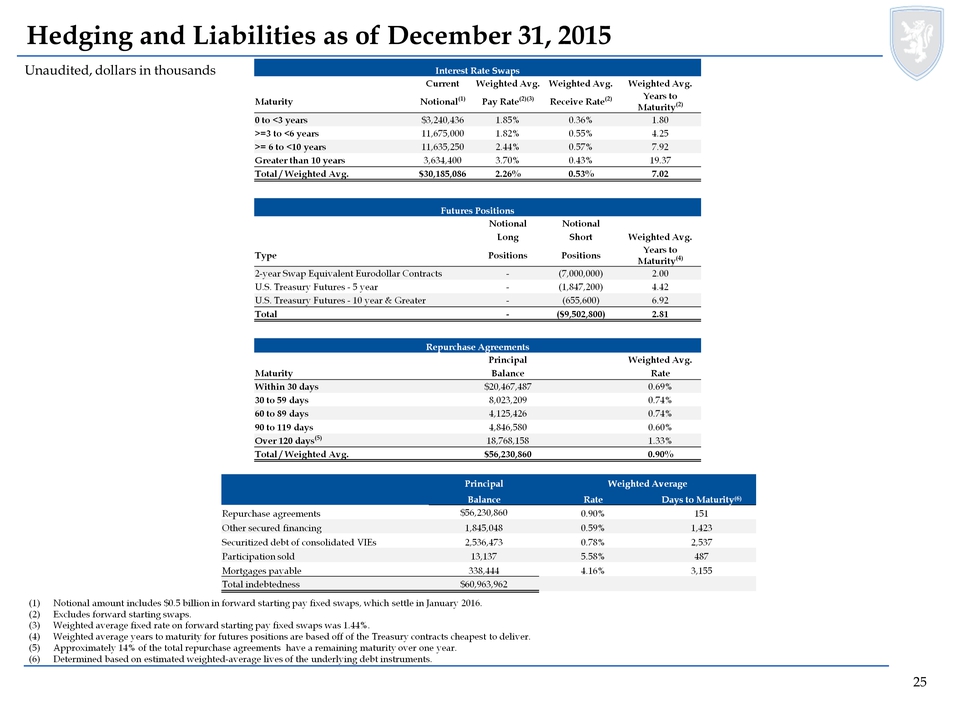
Hedging and Liabilities as of December 31, 2015 Unaudited, dollars in thousands (1)Notional amount includes $0.5 billion in forward starting pay fixed swaps, which settle in January 2016. (2)Excludes forward starting swaps. (3)Weighted average fixed rate on forward starting pay fixed swaps was 1.44%. (4)Weighted average years to maturity for futures positions are based off of the Treasury contracts cheapest to deliver. (5)Approximately 14% of the total repurchase agreements have a remaining maturity over one year. (6)Determined based on estimated weighted-average lives of the underlying debt instruments. Interest Rate Swaps Current Weighted Avg. Weighted Avg. Weighted Avg. Maturity Notional(1) Pay Rate(2)(3) Receive Rate(2) Years to Maturity(2) 0 to <3 years $3,240,436 1.85% 0.36% 1.80 >=3 to <6 years 11,675,000 1.82% 0.55% 4.25 >= 6 to <10 years 11,635,250 2.44% 0.57% 7.92 Greater than 10 years 3,634,400 3.70% 0.43% 19.37 Total / Weighted Avg. $30,185,086 2.26% 0.53% 7.02 Futures Positions Notional Notional Long Short Weighted Avg. Type Positions Positions Years to Maturity(4) 2-year Swap Equivalent Eurodollar Contracts - (7,000,000) 2.00 U.S. Treasury Futures -5 year - (1,847,200) 4.42 U.S. Treasury Futures -10 year & Greater - (655,600) 6.92 Total - ($9,502,800) 2.81 Repurchase Agreements Principal Weighted Avg. Maturity Balance Rate Within 30 days $20,467,487 0.69% 30 to 59 days 8,023,209 0.74% 60 to 89 days 4,125,426 0.74% 90 to 119 days 4,846,580 0.60% Over 120 days(5) 18,768,158 1.33% Total / Weighted Avg. $56,230,860 0.90% Principal Weighted Average Balance Rate Days to Maturity(6) Repurchase agreements $56,230,860 0.90% 151 Other secured financing 1,845,048 0.59% 1,423 Securitized debt of consolidated VIEs 2,536,473 0.78% 2,537 Participation sold 13,137 5.58% 487 Mortgages payable 338,444 4.16% 3,155 Total indebtedness $60,963,962 26 26 Unaudited, dollars in thousands 25
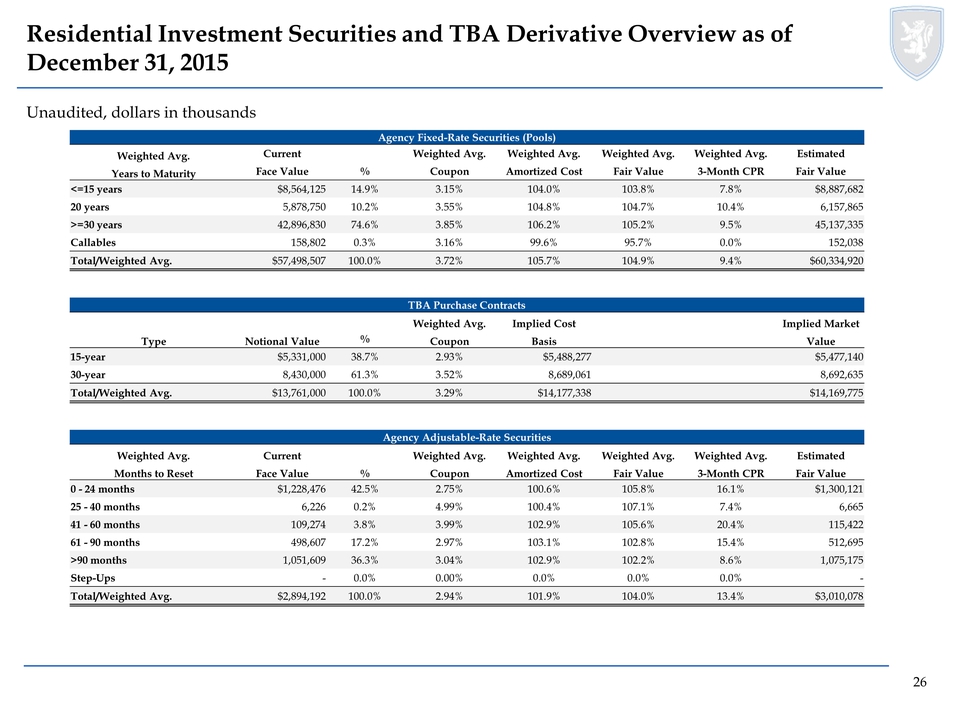
Residential Investment Securities and TBA Derivative Overview as of December 31, 2015 Agency Fixed-Rate Securities (Pools) Weighted Avg. Current Weighted Avg. Weighted Avg. Weighted Avg. Weighted Avg. Estimated Years to Maturity Face Value % Coupon Amortized Cost Fair Value 3-Month CPR Fair Value <=15 years $8,564,125 14.9% 3.15% 104.0% 103.8% 7.8% $8,887,682 20 years 5,878,750 10.2% 3.55% 104.8% 104.7% 10.4% 6,157,865 >=30 years 42,896,830 74.6% 3.85% 106.2% 105.2% 9.5% 45,137,335 Callables 158,802 0.3% 3.16% 99.6% 95.7% 0.0% 152,038 Total/Weighted Avg. $57,498,507 100.0% 3.72% 105.7% 104.9% 9.4% $60,334,920 TBA Purchase Contracts Weighted Avg. Implied Cost Implied Market Type Notional Value % Coupon Basis Value 15-year $5,331,000 38.7% 2.93% $5,488,277 $5,477,140 30-year 8,430,000 61.3% 3.52% 8,689,061 8,692,635 Total/Weighted Avg. $13,761,000 100.0% 3.29% $14,177,338 $14,169,775 Agency Adjustable-Rate Securities Weighted Avg. Current Weighted Avg. Weighted Avg. Weighted Avg. Weighted Avg. Estimated Months to Reset Face Value % Coupon Amortized Cost Fair Value 3-Month CPR Fair Value 0 -24 months $1,228,476 42.5% 2.75% 100.6% 105.8% 16.1% $1,300,121 25 -40 months 6,226 0.2% 4.99% 100.4% 107.1% 7.4% 6,665 41 -60 months 109,274 3.8% 3.99% 102.9% 105.6% 20.4% 115,422 61 -90 months 498,607 17.2% 2.97% 103.1% 102.8% 15.4% 512,695 >90 months 1,051,609 36.3% 3.04% 102.9% 102.2% 8.6% 1,075,175 Step-Ups - 0.0% 0.00% 0.0% 0.0% 0.0% - Total/Weighted Avg. $2,894,192 100.0% 2.94% 101.9% 104.0% 13.4% $3,010,078 26

Unaudited, dollars in thousands Residential Investment Securities and TBA Derivative Overview as of December 31, 2015 (cont’d) (1) Weighted by fair value. Agency Fixed-Rate and Floating-Rate Collateralized Mortgage-Backed Obligations Current Weighted Avg. Weighted Avg. Weighted Avg. Weighted Avg. Estimated Type Face Value % Coupon Amortized Cost Fair Value 3-Month CPR Fair Value Fixed-Rate $964,095 100.0% 3.29% 102.8% 102.4% 12.8% $987,079 Floating-Rate - 0.0% 0.00% 0.0% 0.0% 0.0% - Total/Weighted Avg. $964,095 100.0% 3.29% 102.8% 102.4% 12.8% $987,079 Agency Interest-Only Collateralized Mortgage-Backed Obligations Current Notional Weighted Avg. Weighted Avg. Weighted Avg. Weighted Avg. Estimated Type Value % Coupon Amortized Cost Fair Value 3-Month CPR Fair Value Interest-Only $5,779,924 60.8% 3.30% 13.6% 12.7% 10.8% $733,814 Inverse Interest-Only 3,719,408 39.2% 5.78% 22.8% 21.6% 10.1% 804,371 Total/Weighted Avg. $9,499,332 100.0% 4.27% 17.2% 16.2% 10.5% $1,538,185 Residential Credit Portfolio Current Face / Weighted Avg. Weighted Avg. Weighted Avg. Estimated Sector Notional Value %(1) Coupon Amortized Cost Fair Value Fair Value Credit Risk Transfer Securities $476,084 33.4% 4.34% 97.8% 95.9% $456,510 Legacy 378,527 25.1% 3.56% 90.4% 90.3% 341,708 NPL/RPL 354,945 25.9% 3.91% 99.6% 99.3% 352,541 Prime Jumbo (>=2010 Vintage) 197,695 14.5% 3.50% 100.3% 99.8% 197,201 Prime Jumbo (>=2010 Vintage) IO 811,245 1.1% 0.44% 1.9% 1.9% 15,272 Total/Weighted Avg $2,218,496 100.0% 2.64% 62.0% 61.4% $1,363,232 27
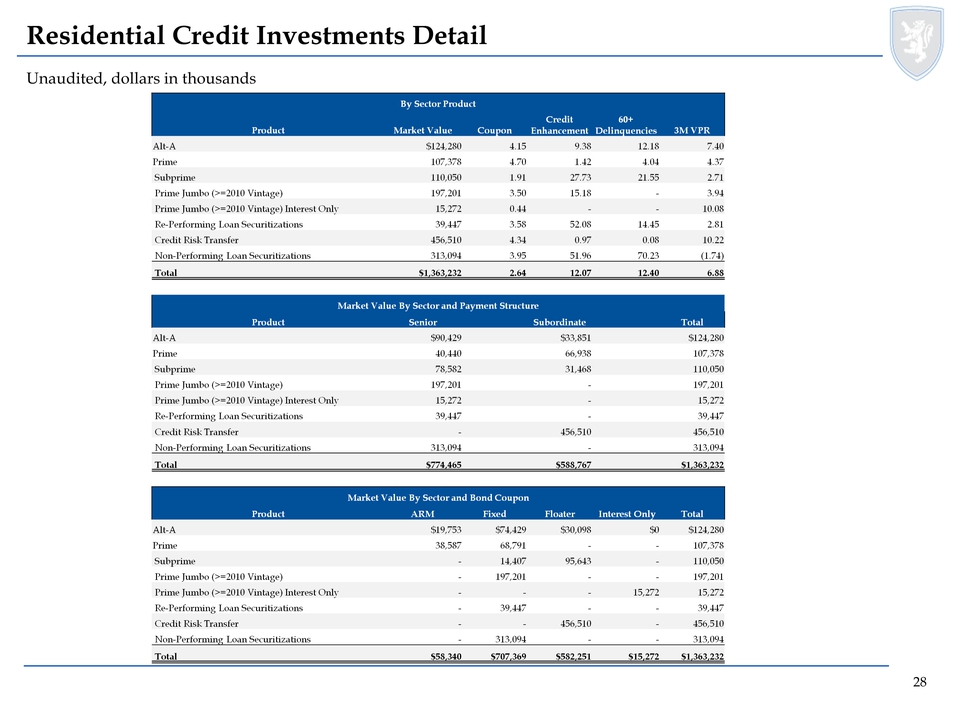
Residential Credit Investments Detail Unaudited, dollars in thousands By Sector Product Product Market Value Coupon Credit Enhancement 60+ Delinquencies 3M VPR Alt-A $124,280 4.15 9.38 12.18 7.40 Prime 107,378 4.70 1.42 4.04 4.37 Subprime 110,050 1.91 27.73 21.55 2.71 Prime Jumbo (>=2010 Vintage) 197,201 3.50 15.18 - 3.94 Prime Jumbo (>=2010 Vintage) Interest Only 15,272 0.44 - - 10.08 Re-Performing Loan Securitizations 39,447 3.58 52.08 14.45 2.81 Credit Risk Transfer 456,510 4.34 0.97 0.08 10.22 Non-Performing Loan Securitizations 313,094 3.95 51.96 70.23 (1.74) Total $1,363,232 2.64 12.07 12.40 6.88 Market Value By Sector and Payment Structure Product Senior Subordinate Total Alt-A $90,429 $33,851 $124,280 Prime 40,440 66,938 107,378 Subprime 78,582 31,468 110,050 Prime Jumbo (>=2010 Vintage) 197,201 - 197,201 Prime Jumbo (>=2010 Vintage) Interest Only 15,272 - 15,272 Re-Performing Loan Securitizations 39,447 - 39,447 Credit Risk Transfer - 456,510 456,510 Non-Performing Loan Securitizations 313,094 - 313,094 Total $774,465 $588,767 $1,363,232 Market Value By Sector and Bond Coupon Product ARM Fixed Floater Interest Only Total Alt-A $19,753 $74,429 $30,098 $0 $124,280 Prime 38,587 68,791 - - 107,378 Subprime - 14,407 95,643 - 110,050 Prime Jumbo (>=2010 Vintage) - 197,201 - - 197,201 Prime Jumbo (>=2010 Vintage) Interest Only - - - 15,272 15,272 Re-Performing Loan Securitizations - 39,447 - - 39,447 Credit Risk Transfer - - 456,510 - 456,510 Non-Performing Loan Securitizations - 313,094 - - 313,094 Total $58,340 $707,369 $582,251 $15,272 $1,363,232 28
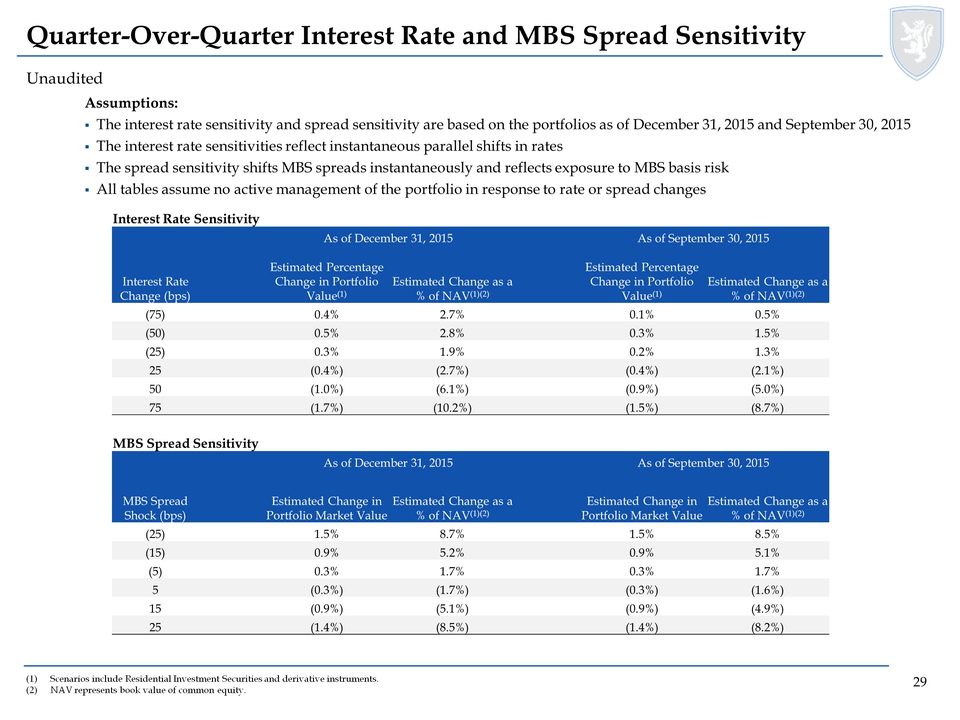
Unaudited Quarter-Over-Quarter Interest Rate and MBS Spread Sensitivity (1)Scenarios include Residential Investment Securities and derivative instruments. (2)NAV represents book value of common equity. Assumptions: The interest rate sensitivity and spread sensitivity are based on the portfolios as of December 31, 2015 and September 30, 2015 The interest rate sensitivities reflect instantaneous parallel shifts in rates The spread sensitivity shifts MBS spreads instantaneously and reflects exposure to MBS basis risk All tables assume no active management of the portfolio in response to rate or spread changes Interest Rate Sensitivity As of December 31, 2015 As of September 30, 2015 Interest Rate Change (bps) Estimated Percentage Change in Portfolio Value(1) Estimated Change as a % of NAV(1)(2) Estimated Percentage Change in Portfolio Value(1) Estimated Change as a % of NAV(1)(2) (75) 0.4% 2.7% 0.1% 0.5% (50) 0.5% 2.8% 0.3% 1.5% (25) 0.3% 1.9% 0.2% 1.3% 25 (0.4%) (2.7%) (0.4%) (2.1%) 50 (1.0%) (6.1%) (0.9%) (5.0%) 75 (1.7%) (10.2%) (1.5%) (8.7%) MBS Spread Sensitivity As of December 31, 2015 As of September 30, 2015 MBS Spread Shock (bps) Estimated Change in Portfolio Market Value Estimated Change as a % of NAV(1)(2) Estimated Change in Portfolio Market Value Estimated Change as a % of AV(1)(2) (25) 1.5% 8.7% 1.5% 8.5% (15) 0.9% 5.2% 0.9% 5.1% (5) 0.3% 1.7% 0.3% 1.7% 5 (0.3%) (1.7%) (0.3%) (1.6%) 15 (0.9%) (5.1%) (0.9%) (4.9%) 25 (1.4%) (8.5%) (1.4%) (8.2%) 29
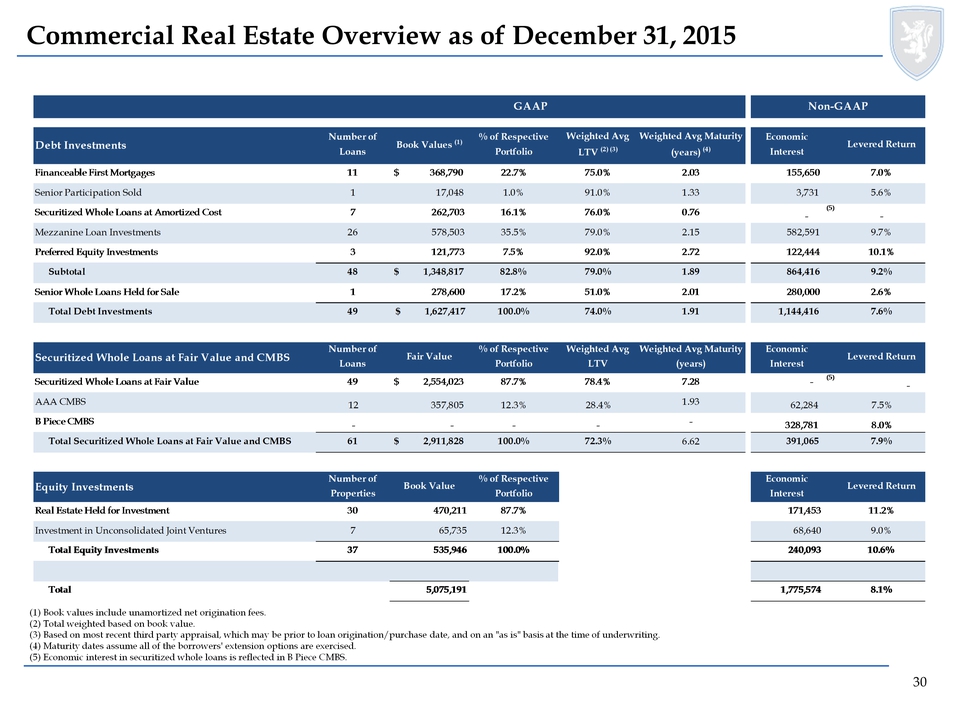
Commercial Real Estate Overview as of December 31, 2015 (1) Book values include unamortized net origination fees. (2) Total weighted based on book value. (3) Based on most recent third party appraisal, which may be prior to loan origination/purchase date, and on an "as is" basis at the time of underwriting. (4) Maturity dates assume all of the borrowers' extension options are exercised. (5) Economic interest in securitized whole loans is reflected in B Piece CMBS. Debt Investments Number of Loans Book Values (1)% of Respective Portfolio Weighted Avg LTV (2) (3)Weighted Avg Maturity (years) (4)Economic Interest Levered Return Financeable First Mortgages11 $ 368,790 22.7%75.0%2.03 155,650 7.0%Senior Participation Sold1 17,048 1.0%91.0%1.33 3,731 5.6%Securitized Whole Loans at Amortized Cost7 262,703 16.1%76.0%0.76- (5) -Mezzanine Loan Investments26 578,503 35.5%79.0%2.15 582,591 9.7%Preferred Equity Investments3 121,773 7.5%92.0%2.72 122,444 10.1%Subtotal48 $ 1,348,817 82.8%79.0%1.89 864,416 9.2%Senior Whole Loans Held for Sale1 278,600 17.2%51.0%2.01 280,000 2.6%Total Debt Investments 49 $ 1,627,417 100.0%74.0%1.91 1,144,416 7.6%Securitized Whole Loans at Fair Value and CMBS Number of Loans Fair Value% of Respective Portfolio Weighted Avg LTV Weighted Avg Maturity (years) Economic Interest Levered Return Securitized Whole Loans at Fair Value49 $ 2,554,023 87.7%78.4%7.28 - (5) - AAA CMBS12357,805 12.3%28.4%1.9362,284 7.5%B Piece CMBS-- ---328,781 8.0%Total Securitized Whole Loans at Fair Value and CMBS61 $ 2,911,828 100.0%72.3%6.62 391,065 7.9%Equity Investments Number of Properties Book Value% of Respective Portfolio Economic Interest Levered Return Real Estate Held for Investment30470,21187.7% 171,453 11.2%Investment in Unconsolidated Joint Ventures765,73512.3% 68,640 9.0%Total Equity Investments37535,946100.0% 240,093 10.6%Total 5,075,191 1,775,574 8.1%GAAPNon-GAAP 30
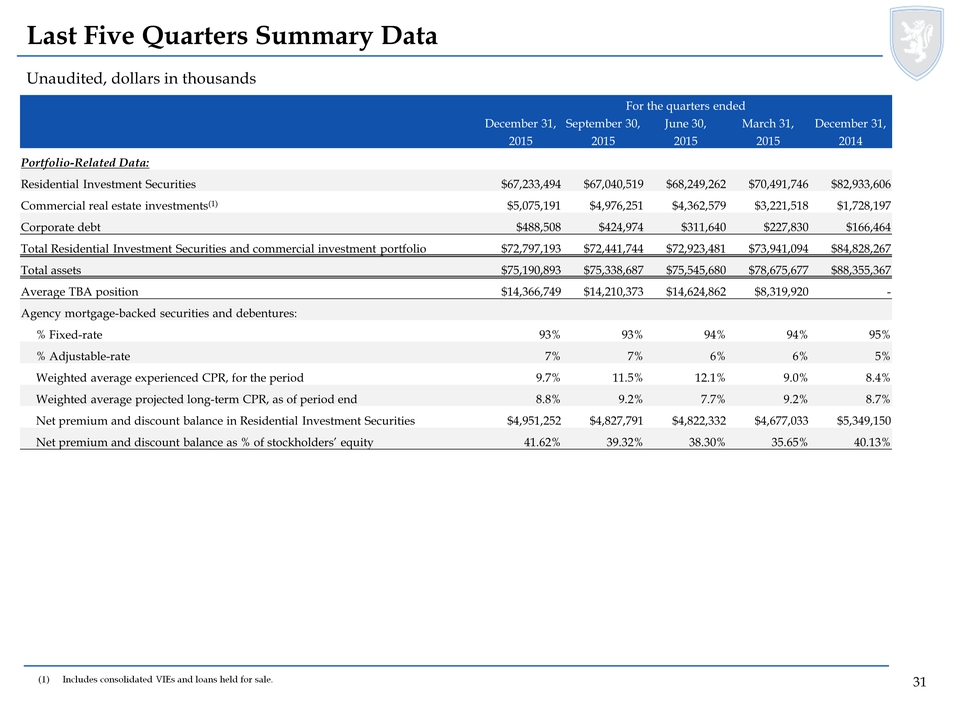
Unaudited, dollars in thousands Last Five Quarters Summary Data (1)Includes consolidated VIEs and loans held for sale. For the quarters ended December 31, September 30, June 30, March 31, December 31, 2015 2015 2015 2015 2014 Portfolio-Related Data: Residential Investment Securities $67,233,494 $67,040,519 $68,249,262 $70,491,746 $82,933,606 Commercial real estate investments(1) $5,075,191 $4,976,251 $4,362,579 $3,221,518 $1,728,197 Corporate debt $488,508 $424,974 $311,640 $227,830 $166,464 Total Residential Investment Securities and commercial investment portfolio $72,797,193 $72,441,744 $72,923,481 $73,941,094 $84,828,267 Total assets $75,190,893 $75,338,687 $75,545,680 $78,675,677 $88,355,367 Average TBA position $14,366,749 $14,210,373 $14,624,862 $8,319,920 - Agency mortgage-backed securities and debentures: % Fixed-rate 93% 93% 94% 94% 95% % Adjustable- rate 7% 7% 6% 6% 5% Weighted average experienced CPR, for the period 9.7% 11.5% 12.1% 9.0% 8.4% Weighted average projected long-term CPR, as of period end 8.8% 9.2% 7.7% 9.2% 8.7% Net premium and discount balance in Residential Investment Securities $4,951,252 $4,827,791 $4,822,332 $4,677,033 $5,349,150 Net premium and discount balance as % of stockholders’ equity 41.62% 39.32% 38.30% 35.65% 40.13% 31
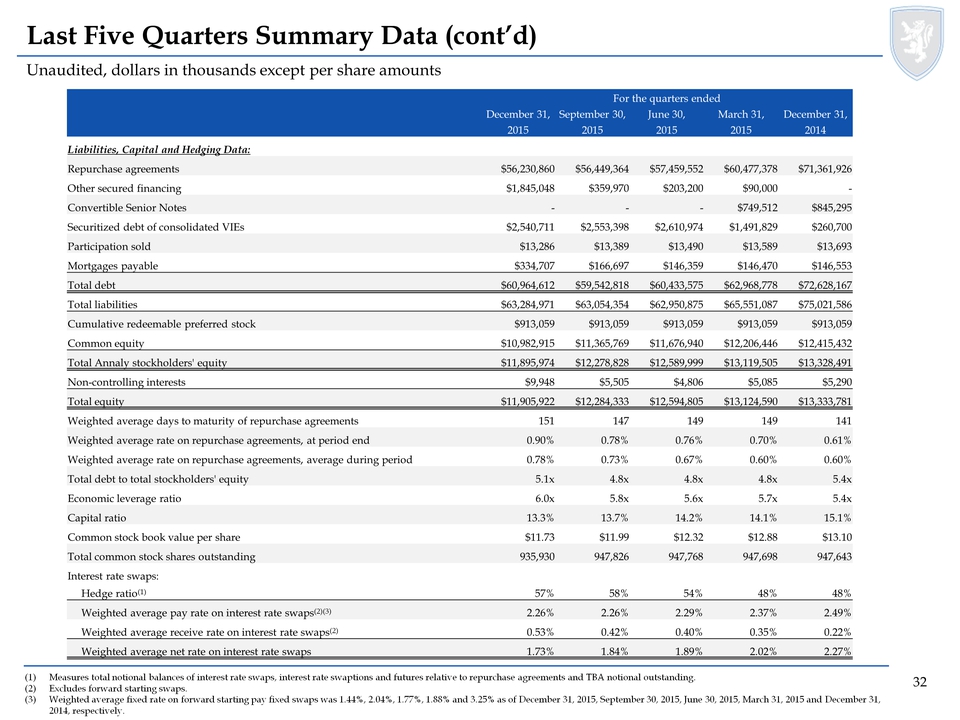
Unaudited, dollars in thousands except per share amounts Last Five Quarters Summary Data (cont’d) (1)Measures total notional balances of interest rate swaps, interest rate swaptionsand futures relative to repurchase agreements and TBA notional outstanding. (2)Excludes forward starting swaps. (3)Weighted average fixed rate on forward starting pay fixed swaps was 1.44%, 2.04%, 1.77%, 1.88% and 3.25% as of December 31, 2015, September 30, 2015, June 30, 2015, March 31, 2015 and December 31, 2014, respectively. For the quarters ended December 31, September 30, June 30, March 31, December 31, 2015 2015 2015 2015 2014 Liabilities, Capital and Hedging Data: Repurchase agreements $56,230,860 $56,449,364 $57,459,552 $60,477,378 $71,361,926 Other secured financing $1,845,048 $359,970 $203,200 $90,000 - Convertible Senior Notes - - - $749,512 $845,295 Securitized debt of consolidated VIEs $2,540,711 $2,553,398 $2,610,974 $1,491,829 $260,700 Participation sold $13,286 $13,389 $13,490 $13,589 $13,693 Mortgages payable $334,707 $166,697 $146,359 $146,470 $146,553 Total debt $60,964,612 $59,542,818 $60,433,575 $62,968,778 $72,628,167 Total liabilities $63,284,971 $63,054,354 $62,950,875 $65,551,087 $75,021,586 Cumulative redeemable preferred stock $913,059 $913,059 $913,059 $913,059 $913,059 Common equity $10,982,915 $11,365,769 $11,676,940 $12,206,446 $12,415,432 Total Annaly stockholders' equity $11,895,974 $12,278,828 $12,589,999 $13,119,505 $13,328,491 Non-controlling interests $9,948 $5,505 $4,806 $5,085 $5,290 Total equity $11,905,922 $12,284,333 $12,594,805 $13,124,590 $13,333,781 Weighted average days to maturity of repurchase agreements 151 147 149 149 141 Weighted average rate on repurchase agreements, at period end 0.90% 0.78% 0.76% 0.70% 0.61% Weighted average rate on repurchase agreements, average during period 0.78% 0.73% 0.67% 0.60% 0.60% Total debt to total stockholders' equity 5.1x 4.8x 4.8x 4.8x 5.4x Economic leverage ratio 6.0x 5.8x 5.6x 5.7x 5.4x Capital ratio 13.3% 13.7% 14.2% 14.1% 15.1% Common stock book value per share $11.73 $11.99 $12.32 $12.88 $13.10 Total common stock shares outstanding 935,930 947,826 947,768 947,698 947,643 Interest rate swaps: Hedge ratio(1) 57% 58% 54% 48% 48% Weighted average pay rate on interest rate swaps(2)(3) 2.26% 2.26% 2.29% 2.37% 2.49% Weighted average receive rate on interest rate swaps(2) 0.53% 0.42% 0.40% 0.35% 0.22% Weighted average net rate on interest rate swaps 1.73% 1.84% 1.89% 2.02% 2.27% 32
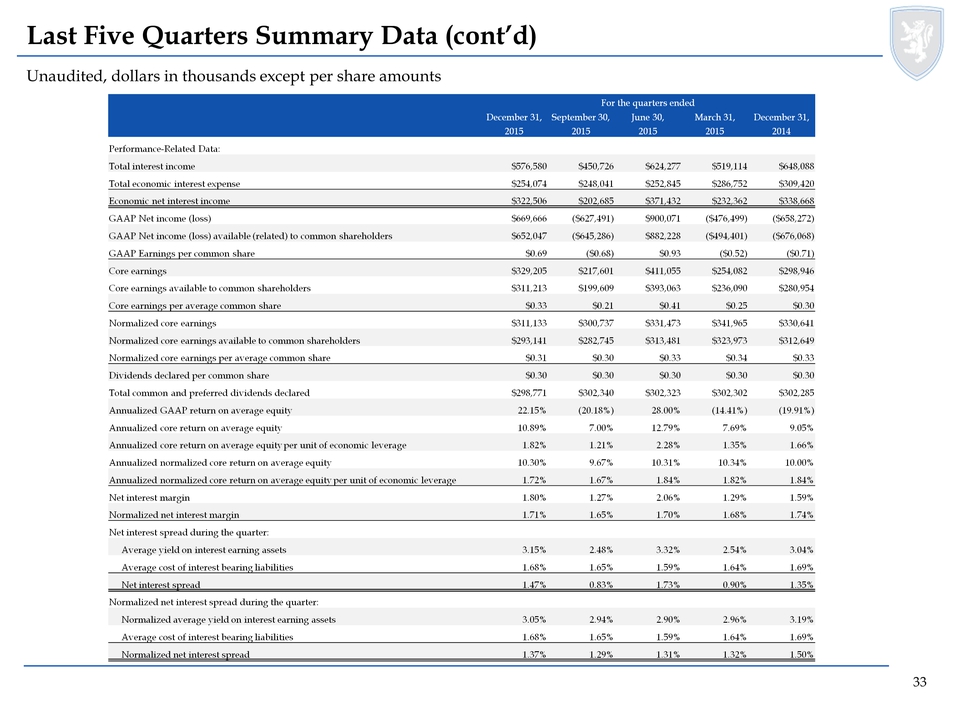
Unaudited, dollars in thousands except per share amounts Last Five Quarters Summary Data (cont’d) For the quarters ended December 31, September 30, June 30, March 31, December 31, 2015 2015 2015 2015 2014 Performance-Related Data: Total interest income $576,580 $450,726 $624,277 $519,114 $648,088 Total economic interest expense $254,074 $248,041 $252,845 $286,752 $309,420 Economic net interest income $322,506 $202,685 $371,432 $232,362 $338,668 GAAP Net income (loss) $669,666 ($627,491) $900,071 ($476,499) ($658,272) GAAP Net income (loss) available (related) to common shareholders $652,047 ($645,286) $882,228 ($494,401) ($676,068) GAAP Earnings per common share $0.69 ($0.68) $0.93 ($0.52) ($0.71) Core earnings $329,205 $217,601 $411,055 $254,082 $298,946 Core earnings available to common shareholders $311,213 $199,609 $393,063 $236,090 $280,954 Core earnings per average common share $0.33 $0.21 $0.41 $0.25 $0.30 Normalized core earnings $311,133 $300,737 $331,473 $341,965 $330,641 Normalized core earnings available to common shareholders $293,141 $282,745 $313,481 $323,973 $312,649 Normalized core earnings per average common share $0.31 $0.30 $0.33 $0.34 $0.33 Dividends declared per common share $0.30 $0.30 $0.30 $0.30 $0.30 Total common and preferred dividends declared $298,771 $302,340 $302,323 $302,302 $302,285 Annualized GAAP return on average equity 22.15% (20.18%) 28.00% (14.41%) (19.91%) Annualized core return on average equity 10.89% 7.00% 12.79% 7.69% 9.05% Annualized core return on average equity per unit of economic leverage 1.82% 1.21% 2.28% 1.35% 1.66% Annualized normalized core return on average equity 10.30% 9.67% 10.31% 10.34% 10.00% Annualized normalized core return on average equity per unit of economic leverage 1.72% 1.67% 1.84% 1.82% 1.84% Net interest margin 1.80% 1.27% 2.06% 1.29% 1.59% Normalized net interest margin 1.71% 1.65% 1.70% 1.68% 1.74% Net interest spread during the quarter: Average yield on interest earning assets 3.15% 2.48% 3.32% 2.54% 3.04% Average cost of interest bearing liabilities 1.68% 1.65% 1.59% 1.64% 1.69% Net interest spread 1.47% 0.83% 1.73% 0.90% 1.35% Normalized net interest spread during the quarter: Normalized average yield on interest earning assets 3.05% 2.94% 2.90% 2.96% 3.19% Average cost of interest bearing liabilities 1.68% 1.65% 1.59% 1.64% 1.69% Normalized net interest spread 1.37% 1.29% 1.31% 1.32% 1.50% 33

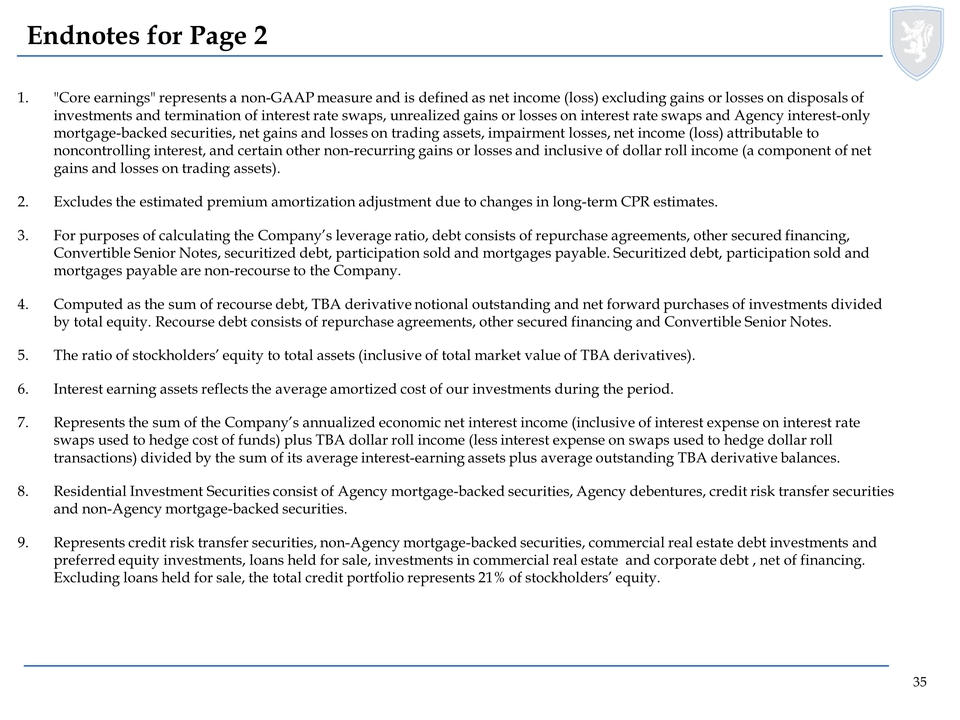
Endnotes for Page 2 1."Core earnings" represents a non-GAAP measure and is defined as net income (loss) excluding gains or losses on disposals of investments and termination of interest rate swaps, unrealized gains or losses on interest rate swaps and Agency interest-only mortgage-backed securities, net gains and losses on trading assets, impairment losses, net income (loss) attributable to noncontrolling interest, and certain other non-recurring gains or losses and inclusive of dollar roll income (a component of net gains and losses on trading assets). 2.Excludes the estimated premium amortization adjustment due to changes in long-term CPR estimates. 3.For purposes of calculating the Company’s leverage ratio, debt consists of repurchase agreements, other secured financing, Convertible Senior Notes, securitized debt, participation sold and mortgages payable. Securitized debt, participation sold and mortgages payable are non-recourse to the Company. 4.Computed as the sum of recourse debt, TBA derivative notional outstanding and net forward purchases of investments divided by total equity. Recourse debt consists of repurchase agreements, other secured financing and Convertible Senior Notes. 5.The ratio of stockholders’ equity to total assets (inclusive of total market value of TBA derivatives). 6.Interest earning assets reflects the average amortized cost of our investments during the period. 7.Represents the sum of the Company’s annualized economic net interest income (inclusive of interest expense on interest rate swaps used to hedge cost of funds) plus TBA dollar roll income (less interest expense on swaps used to hedge dollar roll transactions) divided by the sum of its average interest-earning assets plus average outstanding TBA derivative balances. 8.Residential Investment Securities consist of Agency mortgage-backed securities, Agency debentures, credit risk transfer securities and non-Agency mortgage-backed securities. 9.Represents credit risk transfer securities, non-Agency mortgage-backed securities, commercial real estate debt investments and preferred equity investments, loans held for sale, investments in commercial real estate and corporate debt , net of financing. Excluding loans held for sale, the total credit portfolio represents 21% of stockholders’ equity. 35
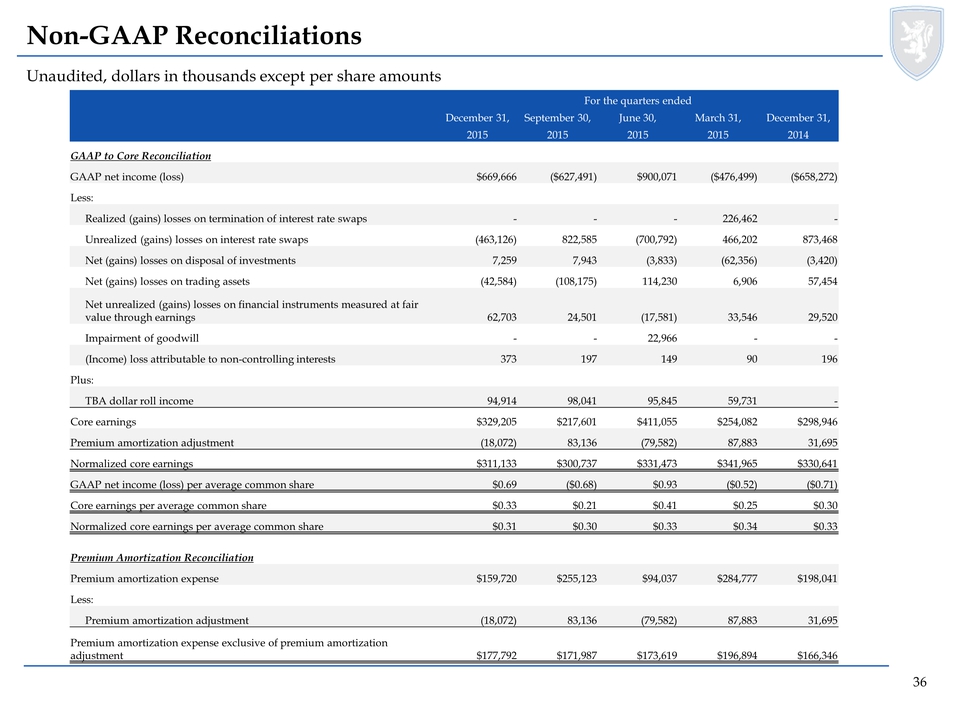
Non-GAAP Reconciliations Unaudited, dollars in thousands except per share amounts For the quarters ended December 31, September 30, June 30, March 31, December 31, 2015 2015 2015 2015 2014 GAAP to Core Reconciliation GAAP net income (loss) $669,666 ($627,491) $900,071 ($476,499) ($658,272) Less: Realized (gains) losses on termination of interest rate swaps - - - 226,462 - Unrealized (gains) losses on interest rate swaps (463,126) 822,585 (700,792) 466,202 873,468 Net (gains) losses on disposal of investments 7,259 7,943 (3,833) (62,356) (3,420) Net (gains) losses on trading assets (42,584) (108,175) 114,230 6,906 57,454 Net unrealized (gains) losses on financial instruments measured at fair value through earnings 62,703 24,501 (17,581) 33,546 29,520 Impairment of goodwill - - 22,966 - - (Income) loss attributable to non-controlling interests 373 197 149 90 196 Plus: TBA dollar roll income 94,914 98,041 95,845 59,731 - Core earnings $329,205 $217,601 $411,055 $254,082 $298,946 Premium amortization adjustment (18,072) 83,136 (79,582) 87,883 31,695 Normalized core earnings $311,133 $300,737 $331,473 $341,965 $330,641 GAAP net income (loss) per average common share $0.69 ($0.68) $0.93 ($0.52) ($0.71) Core earnings per average common share $0.33 $0.21 $0.41 $0.25 $0.30 Normalized core earnings per average common share $0.31 $0.30 $0.33 $0.34 $0.33 Premium Amortization Reconciliation Premium amortization expense $159,720 $255,123 $94,037 $284,777 $198,041 Less: Premium amortization adjustment (18,072) 83,136 (79,582) 87,883 31,695 Premium amortization expense exclusive of premium amortization adjustment $177,792 $171,987 $173,619 $196,894 $166,346 36
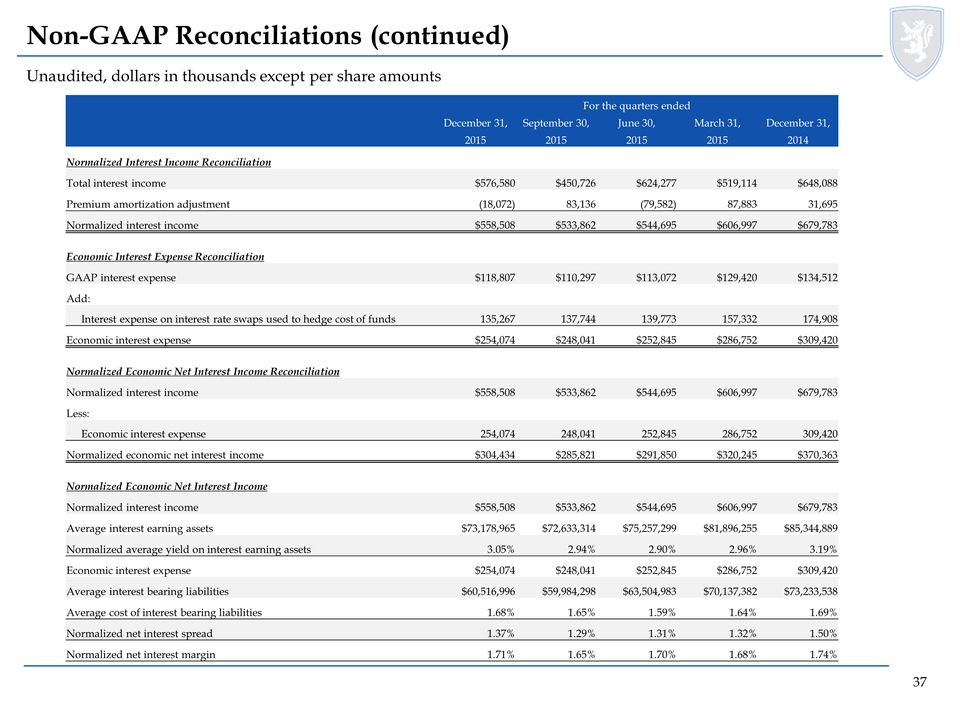
Non-GAAP Reconciliations (continued) Unaudited, dollars in thousands except per share amounts For the quarters ended December 31, September 30, June 30, March 31, December 31, 2015 2015 2015 2015 2014 Normalized Interest Income Reconciliation Total interest income $576,580 $450,726 $624,277 $519,114 $648,088 Premium amortization adjustment (18,072) 83,136 (79,582) 87,883 31,695 Normalized interest income $558,508 $533,862 $544,695 $606,997 $679,783 Economic Interest Expense Reconciliation GAAP interest expense $118,807 $110,297 $113,072 $129,420 $134,512 Add: Interest expense on interest rate swaps used to hedge cost of funds 135,267 137,744 139,773 157,332 174,908 Economic interest expense $254,074 $248,041 $252,845 $286,752 $309,420 Normalized Economic Net Interest Income Reconciliation Normalized interest income $558,508 $533,862 $544,695 $606,997 $679,783 Less: Economic interest expense 254,074 248,041 252,845 286,752 309,420 Normalized economic net interest income $304,434 $285,821 $291,850 $320,245 $370,363 Normalized Economic Net Interest Income Normalized interest income $558,508 $533,862 $544,695 $606,997 $679,783 Average interest earning assets $73,178,965 $72,633,314 $75,257,299 $81,896,255 $85,344,889 Normalized average yield on interest earning assets 3.05% 2.94% 2.90% 2.96% 3.19% Economic interest expense $254,074 $248,041 $252,845 $286,752 $309,420 Average interest bearing liabilities $60,516,996 $59,984,298 $63,504,983 $70,137,382 $73,233,538 Average cost of interest bearing liabilities 1.68% 1.65% 1.59% 1.64% 1.69% Normalized net interest spread 1.37% 1.29% 1.31% 1.32% 1.50% Normalized net interest margin 1.71% 1.65% 1.70% 1.68% 1.74% 37