Exhibit 99.1

October 2016 Investor Presentation ANNALY
2 This presentation, other written or oral communications and our public documents to which we refer contain or incorporate by reference certain forward-looking statements which are based on various assumptions (some of which are beyond our control) and may be identified by reference to a future period or periods or by the use of forward-looking terminology, such as "may," "will," "believe," "expect," "anticipate," "continue," or similar terms or variations on those terms or the negative of those terms. Actual results could differ materially from those set forth in forward-looking statements due to a variety of factors, including, but not limited to, changes in interest rates; changes in the yield curve; changes in prepayment rates; the availability of mortgage-backed securities and other securities for purchase; the availability of financing and, if available, the terms of any financings; changes in the market value of our assets; changes in business conditions and the general economy; our ability to grow our commercial business; our ability to grow our residential mortgage credit business; credit risks related to our investments in credit risk transfer securities, residential mortgage-backed securities and related residential mortgage credit assets, commercial real estate assets and corporate debt; risks related to investments in mortgage servicing rights and ownership of a servicer; any potential business disruption following the acquisition of Hatteras Financial Corp.; our ability to consummate any contemplated investment opportunities; changes in government regulations affecting our business; our ability to maintain our qualification as a REIT; and our ability to maintain our exemption from registration under the Investment Company Act of 1940, as amended. For a discussion of the risks and uncertainties which could cause actual results to differ from those contained in the forward-looking statements, see "Risk Factors" in our most recent Annual Report on Form 10-K and any subsequent Quarterly Reports on Form 10-Q. We do not undertake, and specifically disclaim any obligation, to publicly release the result of any revisions which may be made to any forward-looking statements to reflect the occurrence of anticipated or unanticipated events or circumstances after the date of such statements, except as required by law. This presentation includes unaudited pro forma information reflecting the acquisition of Hatteras Financial Corp. The unaudited pro forma information should be read in conjunction with the historical financial information and accompanying notes of Annaly Capital Management, Inc. and Hatteras Financial Corp. Non-GAAP Financial Measures This presentation includes certain non-GAAP financial measures. The non-GAAP financial measures should not be viewed in isolation and are not a substitute for financial measures computed in accordance with GAAP. Please see the section entitled “Non-GAAP Reconciliations” in the attached Appendix for a reconciliation to the most directly comparable GAAP financial measures. Safe Harbor Notice
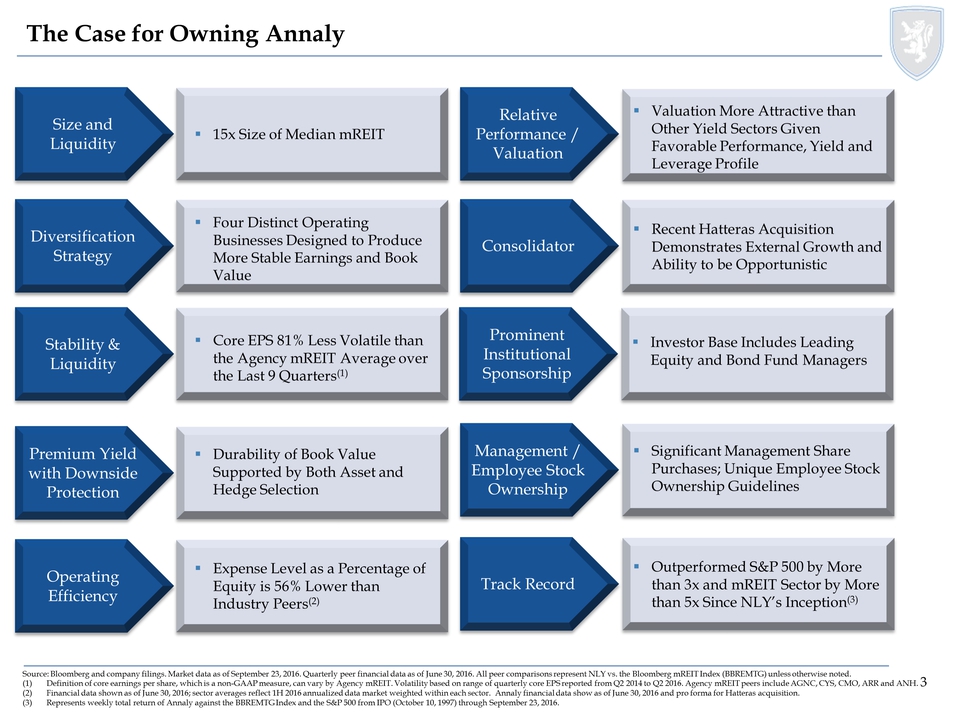
3 15x Size of Median mREIT Size and Liquidity Consolidator Recent Hatteras Acquisition Demonstrates External Growth and Ability to be Opportunistic Diversification Strategy Four Distinct Operating Businesses Designed to Produce More Stable Earnings and Book Value Relative Performance / Valuation Valuation More Attractive than Other Yield Sectors Given Favorable Performance, Yield and Leverage Profile Stability & Liquidity Management / Employee Stock Ownership Core EPS 81% Less Volatile than the Agency mREIT Average over the Last 9 Quarters(1) Significant Management Share Purchases; Unique Employee Stock Ownership Guidelines Operating Efficiency Track Record Expense Level as a Percentage of Equity is 56% Lower than Industry Peers(2) Outperformed S&P 500 by More than 3x and mREIT Sector by More than 5x Since NLY’s Inception(3) Premium Yield with Downside Protection Durability of Book Value Supported by Both Asset and Hedge Selection Source: Bloomberg and company filings. Market data as of September 23, 2016. Quarterly peer financial data as of June 30, 2016. All peer comparisons represent NLY vs. the Bloomberg mREIT Index (BBREMTG) unless otherwise noted. (1) Definition of core earnings per share, which is a non-GAAP measure, can vary by Agency mREIT. Volatility based on range of quarterly core EPS reported from Q2 2014 to Q2 2016. Agency mREIT peers include AGNC, CYS, CMO, ARR and ANH. (2) Financial data shown as of June 30, 2016; sector averages reflect 1H 2016 annualized data market weighted within each sector. Annaly financial data show as of June 30, 2016 and pro forma for Hatteras acquisition. (3) Represents weekly total return of Annaly against the BBREMTG Index and the S&P 500 from IPO (October 10, 1997) through September 23, 2016. The Case for Owning Annaly
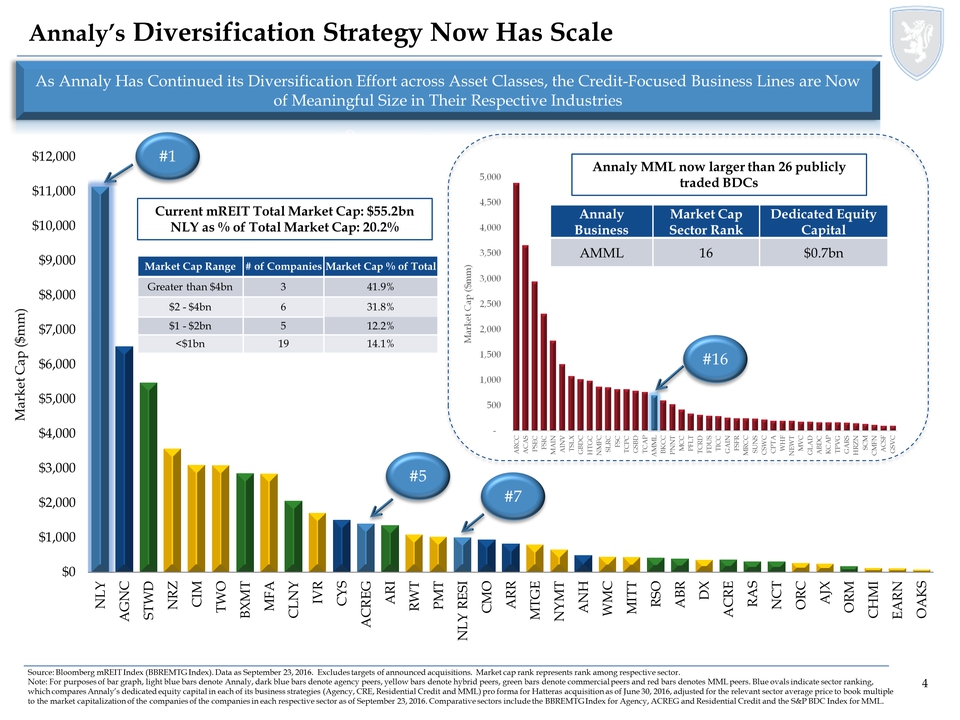
4 – 500 1,000 1,500 2,000 2,500 3,000 3,500 4,000 4,500 5,000 ARCC ACAS PSEC FSIC MAIN AINV TSLX GBDC HTGC NMFC SLRC FSC TCPC GSBD TCAP AMML BKCC PNNT MCC PFLT TCRD FDUS TICC GAIN FSFR MRCC SUNS CSWC CPTA WHF NEWT MVC GLAD ABDC KCAP TPVG GARS HRZN SCM CMFN ACSF GSVC Market Cap ($mm) Annaly’s Diversification Strategy Now Has Scale Source: Bloomberg mREIT Index (BBREMTG Index). Data as September 23, 2016. Excludes targets of announced acquisitions. Market cap rank represents rank among respective sector. Note: For purposes of bar graph, light blue bars denote Annaly, dark blue bars denote agency peers, yellow bars denote hybrid peers, green bars denote commercial peers and red bars denotes MML peers. Blue ovals indicate sector ranking, which compares Annaly’s dedicated equity capital in each of its business strategies (Agency, CRE, Residential Credit and MML) pro forma for Hatteras acquisition as of June 30, 2016, adjusted for the relevant sector average price to book multiple to the market capitalization of the companies of the companies in each respective sector as of September 23, 2016. Comparative sectors include the BBREMTG Index for Agency, ACREG and Residential Credit and the S&P BDC Index for MML. As Annaly Has Continued its Diversification Effort across Asset Classes, the Credit-Focused Business Lines are Now of Meaningful Size in Their Respective Industries #1 #7 #5 Current mREIT Total Market Cap: $55.2bn NLY as % of Total Market Cap: 20.2% Annaly Business Market Cap Sector Rank Dedicated Equity Capital AMML 16 $0.7bn Annaly MML now larger than 26 publicly traded BDCs #16 Market Cap Range # of Companies Market Cap % of Total Greater than $4bn 3 41.9% $2 - $4bn 6 31.8% $1 - $2bn 5 12.2% <$1bn 19 14.1% $0 $1,000 $2,000 $3,000 $4,000 $5,000 $6,000 $7,000 $8,000 $9,000 $10,000 $11,000 $12,000 NLY AGNC STWD NRZ CIM TWO BXMT MFA CLNY IVR CYS ACREG ARI RWT PMT NLY RESI CMO ARR MTGE NYMT ANH WMC MITT RSO ABR DX ACRE RAS NCT ORC AJX ORM CHMI EARN OAKS Market Cap ($mm)
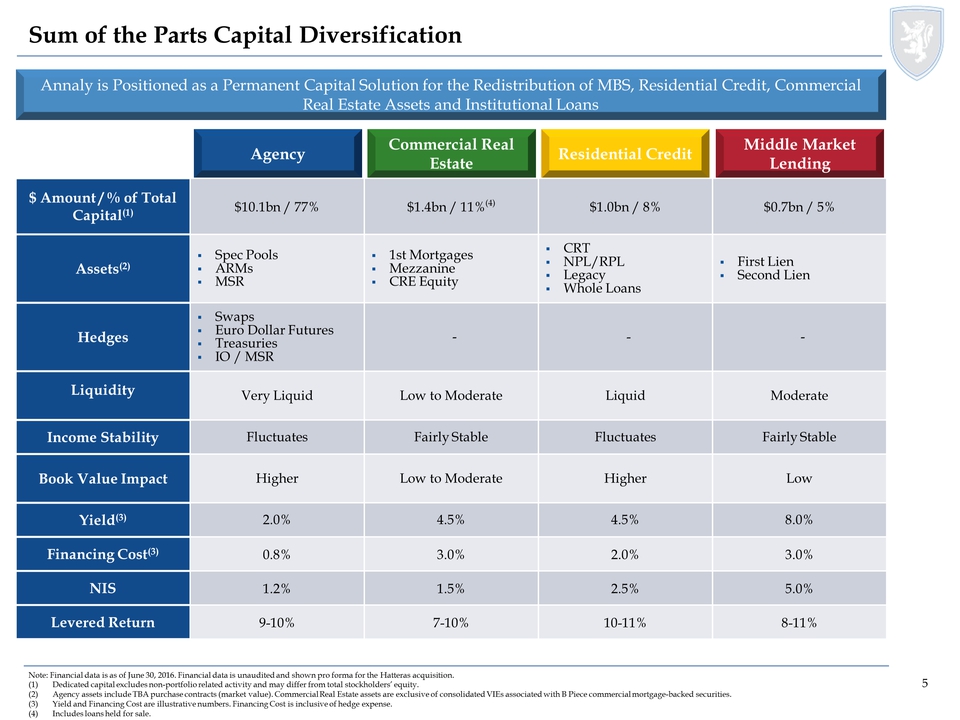
Sum of the Parts Capital Diversification 5 Annaly is Positioned as a Permanent Capital Solution for the Redistribution of MBS, Residential Credit, Commercial Real Estate Assets and Institutional Loans Sum of the Parts Capital Diversification Agency Commercial Real Residential Credit Estate Middle Market Lending $ Amount / % of Total Capital(1) $10.1bn / 77% $1.4bn / 11%(4) $1.0bn / 8% $0.7bn / 5% Assets(2) Spec Pools ARMs MSR 1st Mortgages Mezzanine CRE Equity CRT NPL/RPL Legacy Whole Loans First Lien Second Lien Hedges Swaps Euro Dollar Futures Treasuries IO / MSR - - - Liquidity Very Liquid Low to Moderate Liquid Moderate Income Stability Fluctuates Fairly Stable Fluctuates Fairly Stable Book Value Impact Higher Low to Moderate Higher Low Yield(3) 2.0% 4.5% 4.5% 8.0% Financing Cost(3) 0.8% 3.0% 2.0% 3.0% NIS 1.2% 1.5% 2.5% 5.0% Levered Return 9-10% 7-10% 10-11% 8-11% Note: Financial data is as of June 30, 2016. Financial data is unaudited and shown pro forma for the Hatteras acquisition. (1) Dedicated capital excludes non-portfolio related activity and may differ from total stockholders’ equity. (2) Agency assets include TBA purchase contracts (market value). Commercial Real Estate assets are exclusive of consolidated VIEs associated with B Piece commercial mortgage-backed securities. (3) Yield and Financing Cost are illustrative numbers. Financing Cost is inclusive of hedge expense. (4) Includes loans held for sale.
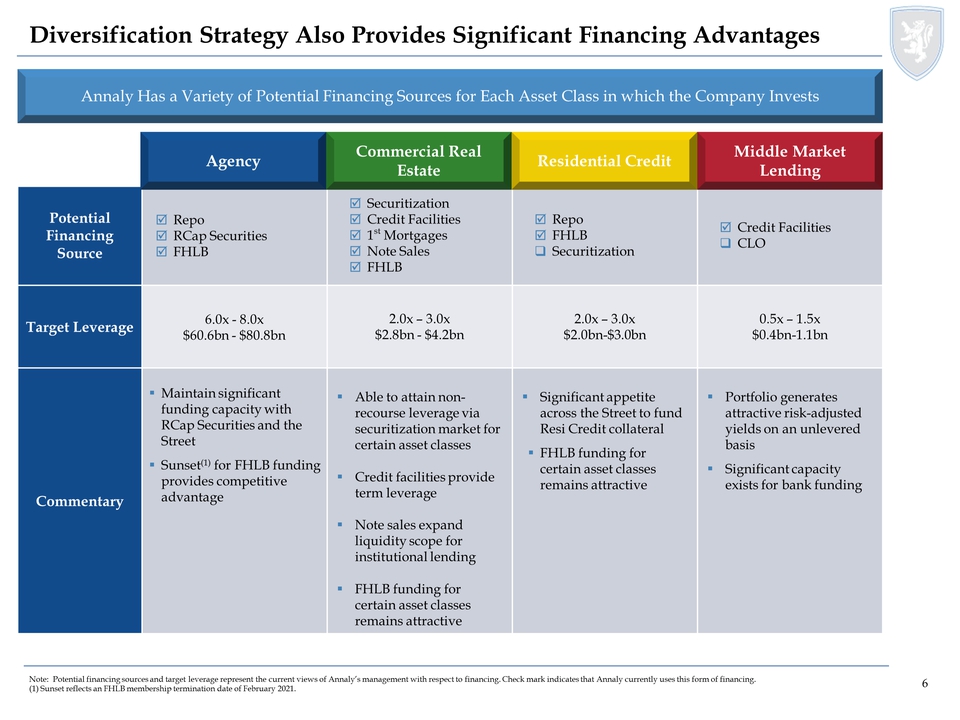
6 Diversification Strategy Also Provides Significant Financing Advantages Agency Resi Credit MML Potential Financing Source Repo RCap Securities FHLB Securitization Credit Facilities 1st Mortgages Note Sales FHLB Repo FHLB Securitization Credit Facilities CLO Target Leverage 6.0x - 8.0x $60.6bn - $80.8bn 2.0x – 3.0x $2.8bn - $4.2bn 2.0x – 3.0x $2.0bn-$3.0bn 0.5x – 1.5x $0.4bn-1.1bn Commentary Maintain significant funding capacity with RCap Securities and the Street Sunset(1) for FHLB funding provides competitive advantage Able to attain nonrecourse leverage via securitization market for certain asset classes Credit facilities provide term leverage Note sales expand liquidity scope for institutional lending FHLB funding for certain asset classes remains attractive Significant appetite across the Street to fund Resi Credit collateral FHLB funding for certain asset classes remains attractive Portfolio generates attractive risk-adjusted yields on an unlevered basis Significant capacity exists for bank funding Annaly Has a Variety of Potential Financing Sources for Each Asset Class in which the Company Invests Note: Potential financing sources and target leverage represent the current views of Annaly’s management with respect to financing. Check mark indicates that Annaly currently uses this form of financing. (1) Sunset reflects an FHLB membership termination date of February 2021. Agency Commercial Real Residential Credit Estate Middle Market Lending
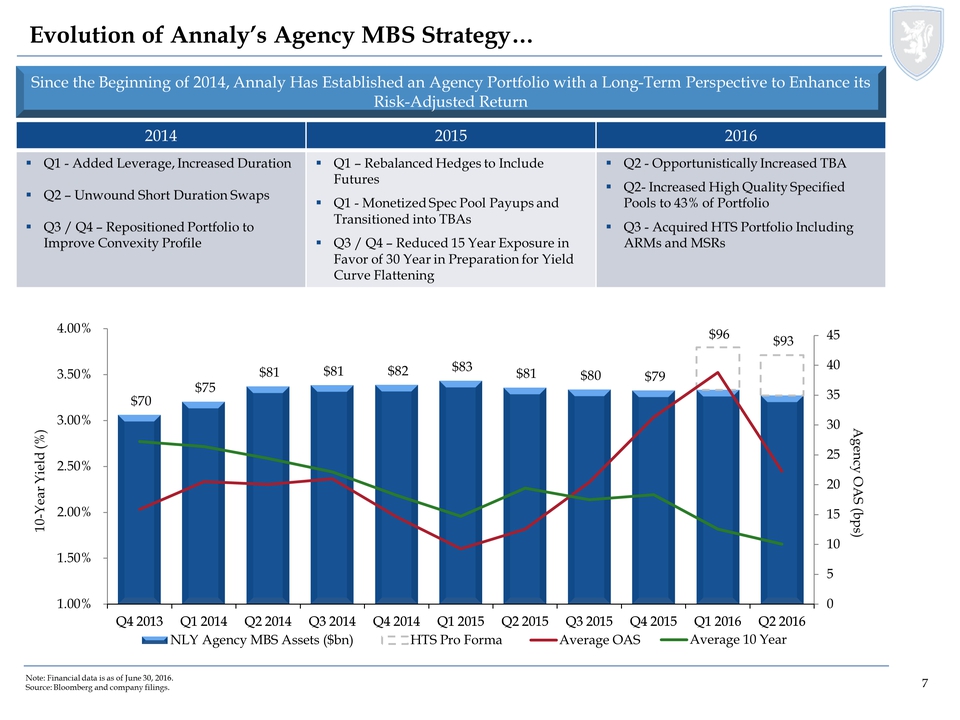
Evolution of Annaly’s Agency MBS Strategy … Since the Beginning of 2014, Annaly Has Established an Agency Portfolio with a Long-Term Perspective to Enhance its Risk-Adjusted Return 2014 2015 2016 Q1 - Added Leverage, Increased Duration Q2 – Unwound Short Duration Swaps Q3 / Q4 – Repositioned Portfolio to Improve Convexity Profile Q1 – Rebalanced Hedges to Include Futures Q1 - Monetized Spec Pool Payups and Transitioned into TBAs Q3 / Q4 – Reduced 15 Year Exposure in Favor of 30 Year in Preparation for Yield Curve Flattening Q2 - Opportunistically Increased TBA Q2- Increased High Quality Specified Pools to 43% of Portfolio Q3 - Acquired HTS Portfolio Including ARMs and MSRs $70 $75 $81 $81 $82 $83 $81 $80 $79 $96 $93 0 5 10 15 20 25 30 35 40 45 $0 $10 $20 $30 $40 $50 $60 $70 $80 $90 $100 Q4 2013 Q1 2014 Q2 2014 Q3 2014 Q4 2014 Q1 2015 Q2 2015 Q3 2015 Q4 2015 Q1 2016 Q2 2016 Agency OAS (bps) NLY Agency MBS Assets ($bn) HTS Pro Forma Average OAS 1.00% 1.50% 2.00% 2.50% 3.00% 3.50% 4.00% 10-Year Yield (%) Average 10 Year
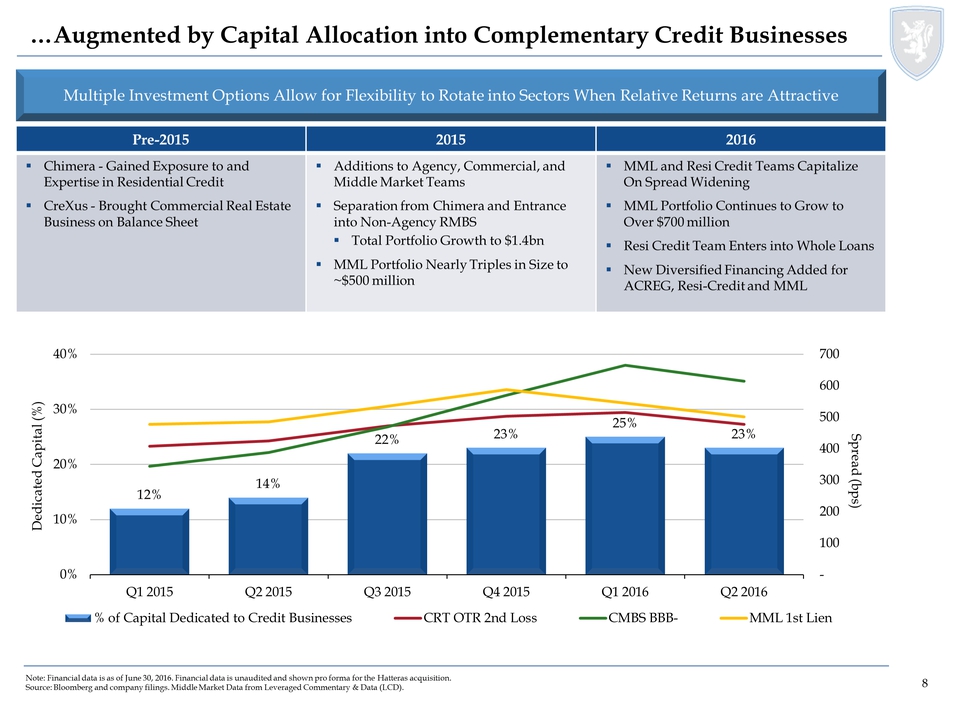
8 …Augmented by Capital Allocation into Complementary Credit Businesses Multiple Investment Options Allow for Flexibility to Rotate into Sectors When Relative Returns are Attractive Pre-2015 2015 2016 Chimera - Gained Exposure to and Expertise in Residential Credit CreXus - Brought Commercial Real Estate Business on Balance Sheet Additions to Agency, Commercial, and Middle Market Teams Separation from Chimera and Entrance into Non-Agency RMBS Total Portfolio Growth to $1.4bn MML Portfolio Nearly Triples in Size to ~$500 million MML and Resi Credit Teams Capitalize On Spread Widening MML Portfolio Continues to Grow to Over $700 million Resi Credit Team Enters into Whole Loans New Diversified Financing Added for ACREG, Resi-Credit and MML Note: Financial data is as of June 30, 2016. Financial data is unaudited and shown pro forma for the Hatteras acquisition. Source: Bloomberg and company filings. Middle Market Data from Leveraged Commentary & Data (LCD). 12% 14% 22% 23% 25% 23% - 100 200 300 400 500 600 700 0% 10% 20% 30% 40% Q1 2015 Q2 2015 Q3 2015 Q4 2015 Q1 2016 Q2 2016 Spread (bps) Dedicated Capital (%) % of Capital Dedicated to Credit Businesses CRT OTR 2nd Loss CMBS BBB- MML 1st Lien
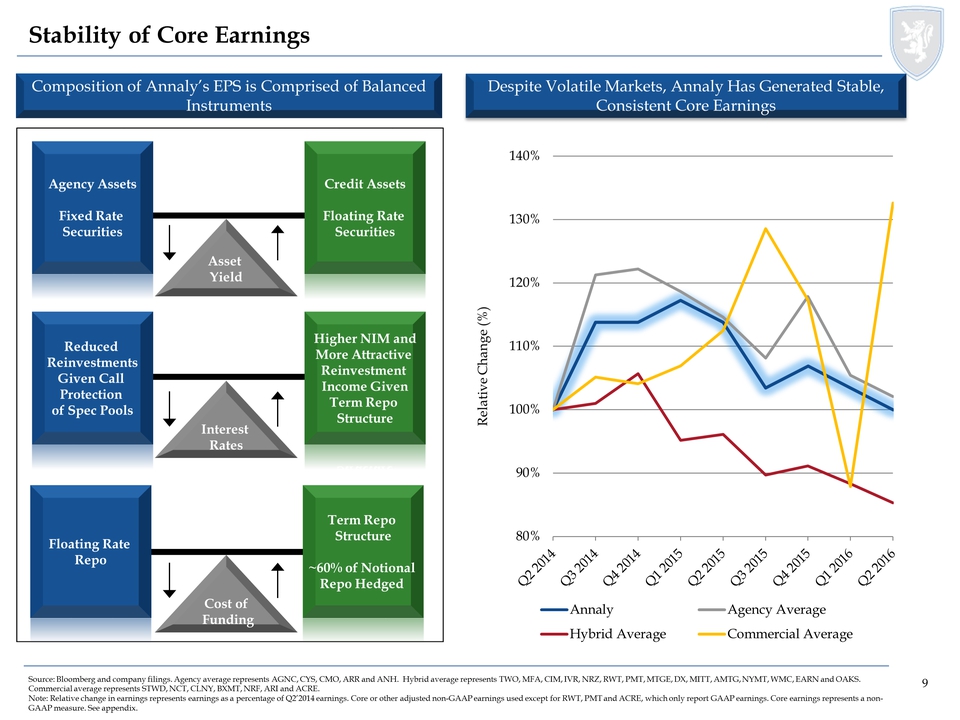
9 Stability of Core Earnings Composition of Annaly’s EPS is Comprised of Balanced Instruments Despite Volatile Markets, Annaly Has Generated Stable, Consistent Core Earnings Asset Yield Interest Rates Credit Assets Floating Rate Securities Agency Assets Fixed Rate Securities Higher NIM and More Attractive Reinvestment Income Given Term Repo Structure Reduced Reinvestments Given Call Protection of Spec Pools Cost of Funding Floating Rate Repo Term Repo Structure ~60% of Notional Repo Hedged 80% 90% 100% 110% 120% 130% 140% Annaly Agency Average Hybrid Average Commercial Average Relative Change (%) Source: Bloomberg and company filings. Agency average represents AGNC, CYS, CMO, ARR and ANH. Hybrid average represents TWO, MFA, CIM, IVR, NRZ, RWT, PMT, MTGE, DX, MITT, AMTG, NYMT, WMC, EARN and OAKS. Commercial average represents STWD, NCT, CLNY, BXMT, NRF, ARI and ACRE. Note: Relative change in earnings represents earnings as a percentage of Q2’2014 earnings. Core or other adjusted non-GAAP earnings used except for RWT, PMT and ACRE, which only report GAAP earnings. Core earnings represents a non- GAAP measure. See appendix. Q2 2014 Q3 2014 Q4 2014 Q1 2015 Q2 2015 Q3 2015 Q4 2015 Q1 2016 Q2 2016
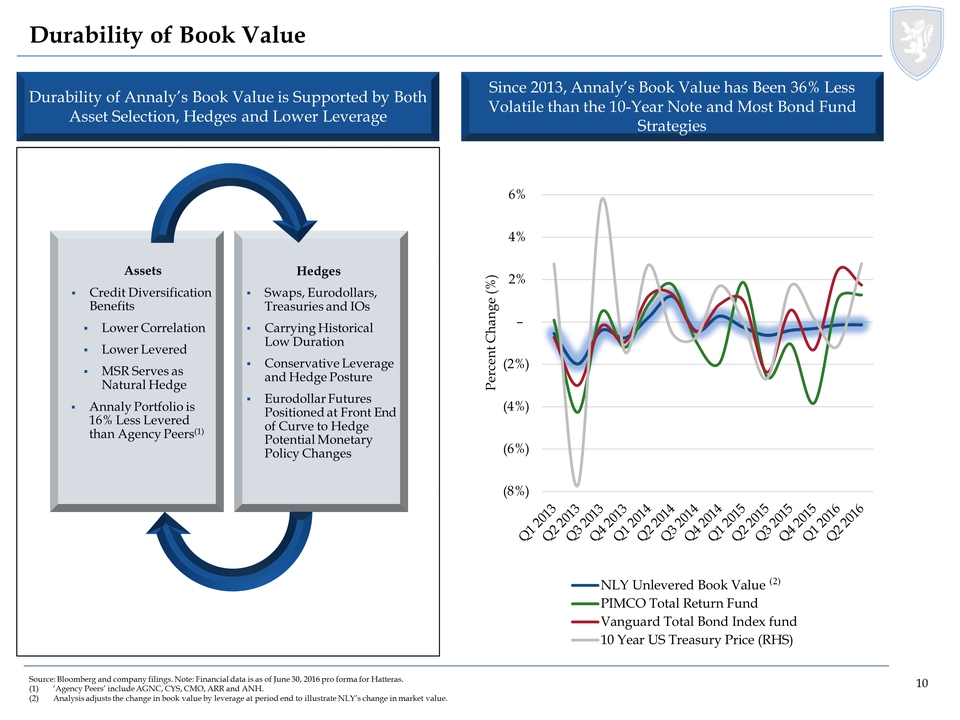
10 10 Durability of Book Value Since 2013, Annaly’s Book Value has Been 36% Less Volatile than the 10-Year Note and Most Bond Fund Strategies Durability of Annaly’s Book Value is Supported by Both Asset Selection, Hedges and Lower Leverage Assets Credit Diversification Benefits Lower Correlation Lower Levered MSR Serves as Natural Hedge Annaly Portfolio is 16% Less Levered than Agency Peers(1) Hedges Swaps, Eurodollars, Treasuries and IOs Carrying Historical Low Duration Conservative Leverage and Hedge Posture Eurodollar Futures Positioned at Front End of Curve to Hedge Potential Monetary Policy Changes Source: Bloomberg and company filings. Note: Financial data is as of June 30, 2016 pro forma for Hatteras. (1) ‘Agency Peers’ include AGNC, CYS, CMO, ARR and ANH. (2) Analysis adjusts the change in book value by leverage at period end to illustrate NLY’s change in market value. (8%) (6%) (4%) (2%) – 2% 4% 6% Percent Change (%) NLY Unlevered Book Value PIMCO Total Return Fund Vanguard Total Bond Index fund 10 Year US Treasury Price (RHS) Q2 2014 Q3 2014 Q4 2014 Q1 2015 Q2 2015 Q3 2015 Q4 2015 Q1 2016 Q2 2016 Q1 2013 Q2 2013 Q3 2013 Q4 2013
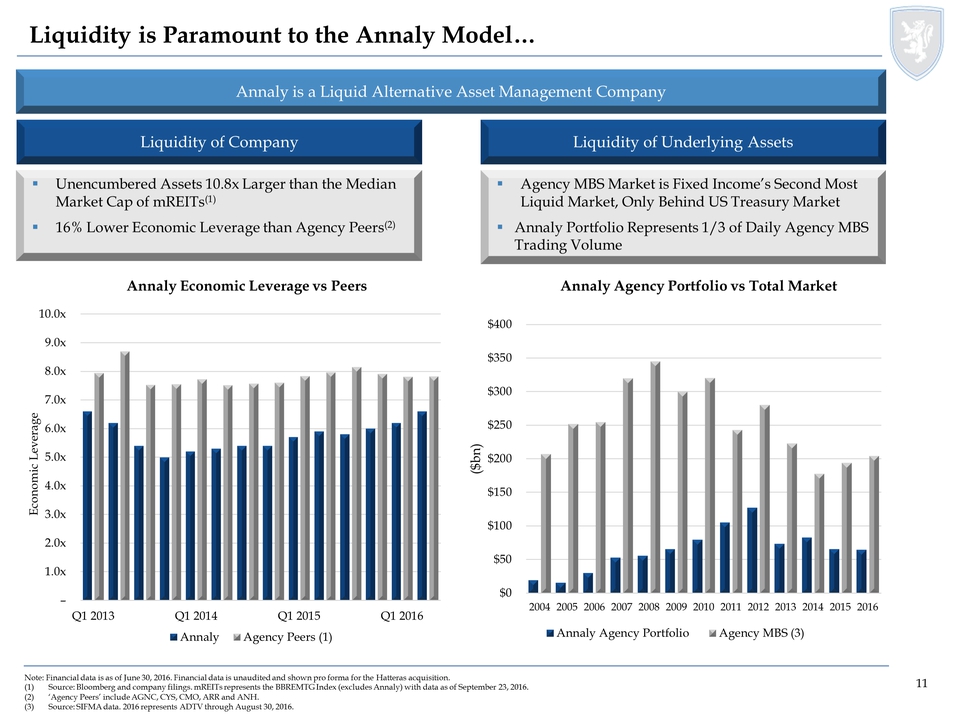
Liquidity is Paramount to the Annaly Model… Annaly is a Liquid Alternative Asset Management Company Liquidity of Company Note: Financial data is as of June 30, 2016. Financial data is unaudited and shown pro forma for the Hatteras acquisition. (1) Source: Bloomberg and company filings. mREITs represents the BBREMTG Index (excludes Annaly) with data as of September 23, 2016. (2) ‘Agency Peers’ include AGNC, CYS, CMO, ARR and ANH. (3) Source: SIFMA data. 2016 represents ADTV through August 30, 2016. Liquidity of Underlying Assets Unencumbered Assets 10.8x Larger than the Median Market Cap of mREITs(1) 16% Lower Economic Leverage than Agency Peers(2) Agency MBS Market is Fixed Income’s Second Most Liquid Market, Only Behind US Treasury Market Annaly Portfolio Represents 1/3 of Daily Agency MBS Trading Volume Annaly Economic Leverage vs Peers Annaly Agency Portfolio vs Total Market $0 $50 $100 $150 $200 $250 $300 $350 $400 2004 2005 2006 2007 2008 2009 2010 2011 2012 2013 2014 2015 2016 ($bn) Annaly Agency Portfolio Agency MBS (3) – 1.0x 2.0x 3.0x 4.0x 5.0x 6.0x 7.0x 8.0x 9.0x 10.0x Q1 2013 Q1 2014 Q1 2015 Q1 2016 Economic Leverage 11
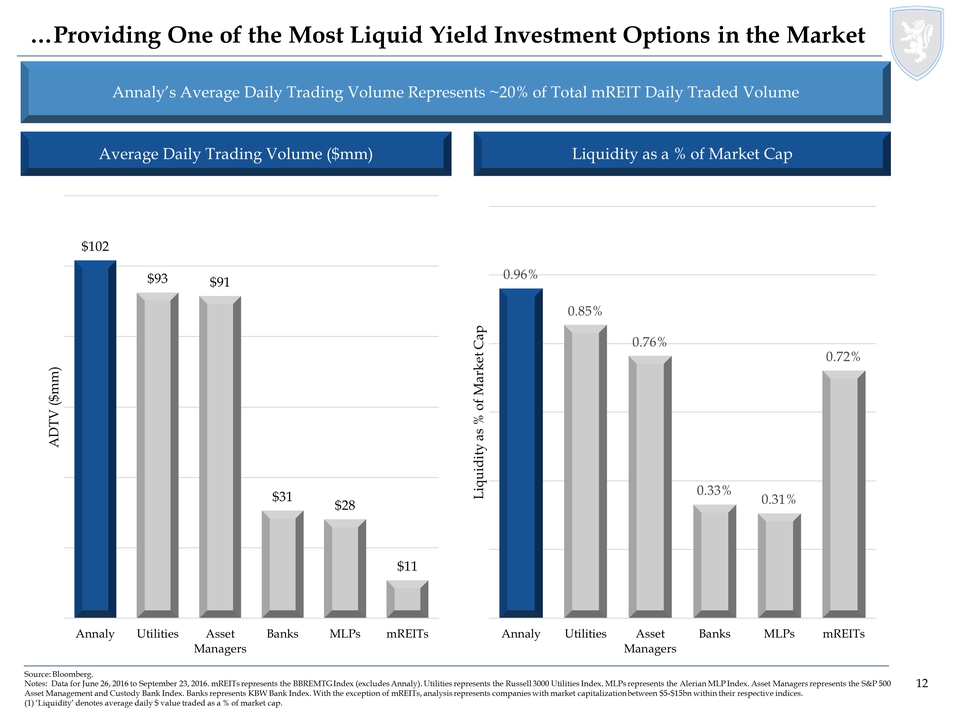
12 12 …Providing One of the Most Liquid Yield Investment Options in the Market Liquidity as a % of Market Cap Source: Bloomberg. Notes: Data for June 26, 2016 to September 23, 2016. mREITs represents the BBREMTG Index (excludes Annaly). Utilities represents the Russell 3000 Utilities Index. MLPs represents the Alerian MLP Index. Asset Managers represents the S&P 500 Asset Management and Custody Bank Index. Banks represents KBW Bank Index. With the exception of mREITs, analysis represents companies with market capitalization between $5-$15bn within their respective indices. (1) ‘Liquidity’ denotes average daily $ value traded as a % of market cap. Average Daily Trading Volume ($mm) Annaly’s Average Daily Trading Volume Represents ~20% of Total mREIT Daily Traded Volume $102 $93 $91 $31 $28 $11 Annaly Utilities Asset Managers Banks MLPs mREITs ADTV ($mm) 0.96% 0.85% 0.76% 0.33% 0.31% 0.72% Annaly Utilities Asset Managers Banks MLPs mREITs Liquidity as % of Market Cap
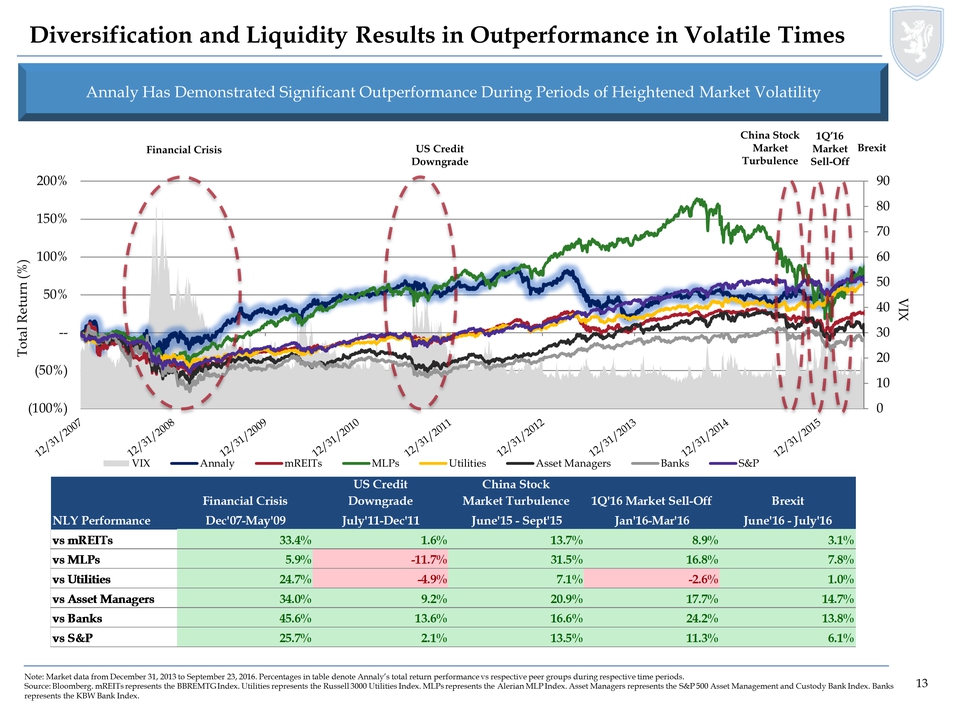
13 0 10 20 30 40 50 60 70 80 90 (100%) (50%) -- 50% 100% 150% 200% VIX Total Return (%) VIX Annaly mREITs MLPs Utilities Asset Managers Banks S&P Diversification and Liquidity Results in Outperformance in Volatile Times Annaly Has Demonstrated Significant Outperformance During Periods of Heightened Market Volatility Note: Market data from December 31, 2013 to September 23, 2016. Percentages in table denote Annaly’s total return performance vs respective peer groups during respective time periods. Source: Bloomberg. mREITs represents the BBREMTG Index. Utilities represents the Russell 3000 Utilities Index. MLPs represents the Alerian MLP Index. Asset Managers represents the S&P 500 Asset Management and Custody Bank Index. Banks represents the KBW Bank Index. US Credit Downgrade China Stock Market Turbulence 1Q’16 Market Sell-Off Financial Crisis Brexit Financial Crisis US Credit Downgrade China Stock Market Turbulence 1Q'16 Market Sell-Off Brexit NLY Performance Dec'07-May'09 July'11-Dec'11 June'15 - Sept'15 Jan'16-Mar'16 June'16 - July'16 vs mREITs 33.4% 1.6% 13.7% 8.9% 3.1% vs MLPs 5.9% -11.7% 31.5% 16.8% 7.8% vs Utilities 24.7% -4.9% 7.1% -2.6% 1.0% vs Asset Managers 34.0% 9.2% 20.9% 17.7% 14.7% vs Banks 45.6% 13.6% 16.6% 24.2% 13.8% vs S&P 25.7% 2.1% 13.5% 11.3% 6.1% 12/31/2007 12/31/2008 12/31/2009 12/31/2010 12/31/2011 12/31/2012 12/31/2013 12/31/2014 12/31/2015
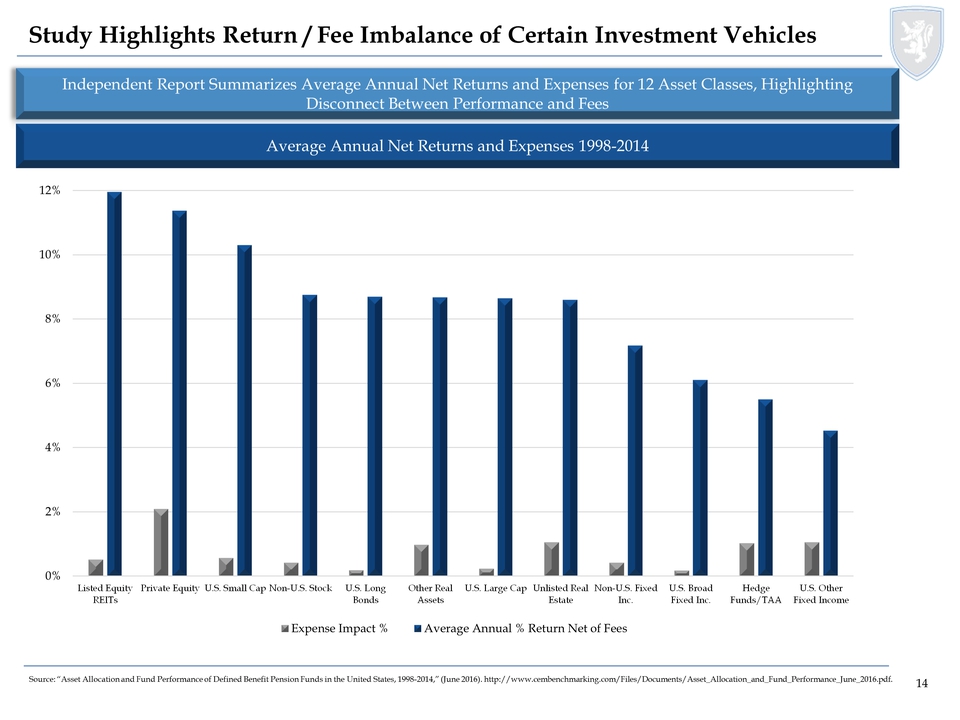
14 Study Highlights Return / Fee Imbalance of Certain Investment Vehicles Source: “Asset Allocation and Fund Performance of Defined Benefit Pension Funds in the United States, 1998-2014,” (June 2016). http://www.cembenchmarking.com/Files/Documents/Asset_Allocation_and_Fund_Performance_June_2016.pdf. 0% 2% 4% 6% 8% 10% 12% Listed Equity REITs Private Equity U.S. Small Cap Non-U.S. Stock U.S. Long Bonds Other Real Assets U.S. Large Cap Unlisted Real Estate Non-U.S. Fixed Inc. U.S. Broad Fixed Inc. Hedge Funds/TAA U.S. Other Fixed Income Expense Impact % Average Annual % Return Net of Fees Independent Report Summarizes Average Annual Net Returns and Expenses for 12 Asset Classes, Highlighting Disconnect Between Performance and Fees Average Annual Net Returns and Expenses 1998-2014
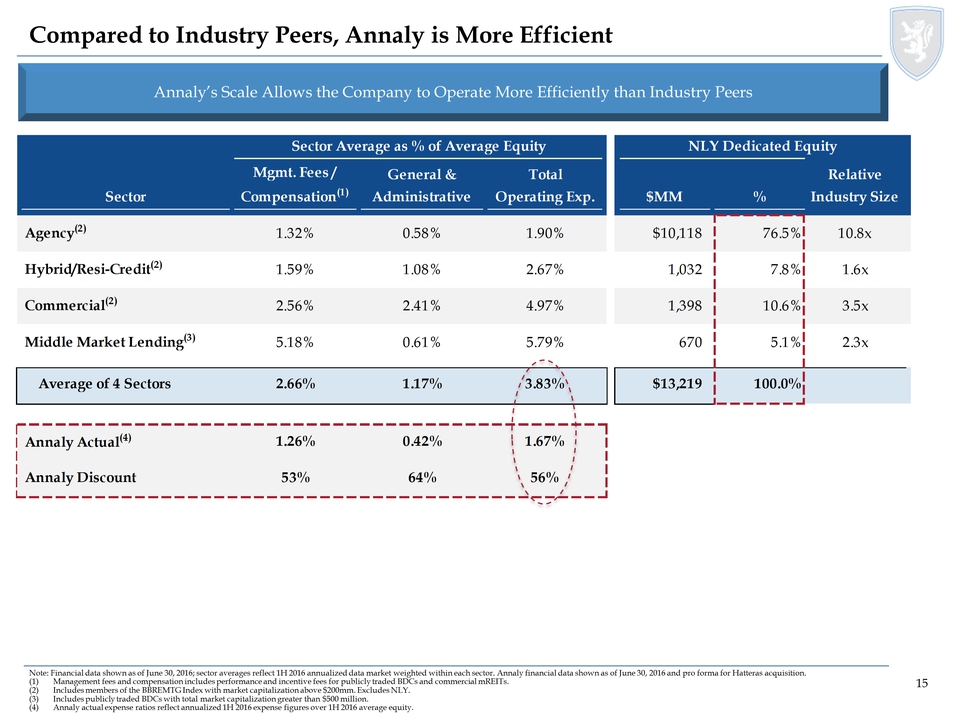
15 Compared to Industry Peers, Annaly is More Efficient Annaly’s Scale Allows the Company to Operate More Efficiently than Industry Peers Sector Average as % of Average Equity NLY Dedicated Equity Sector Mgmt. Fees / Compensation(1) General & Administrative Total Operating Exp. $MM % Relative Industry Size Agency(2) 1.32% 0.58% 1.90% $10,118 76.5% 10.8x Hybrid/Resi-Credit(2) 1.59% 1.08% 2.67% 1,032 7.8% 1.6x Commercial(2) 2.56% 2.41% 4.97% 1,398 10.6% 3.5x Middle Market Lending(3) 5.18% 0.61% 5.79% 670 5.1% 2.3x Average of 4 Sectors 2.66% 1.17% 3.83% $13,219 100.0% Annaly Actual(4) 1.26% 0.42% 1.67% Annaly Discount 53% 64% 56% Note: Financial data shown as of June 30, 2016; sector averages reflect 1H 2016 annualized data market weighted within each sector. Annaly financial data shown as of June 30, 2016 and pro forma for Hatteras acquisition. (1) Management fees and compensation includes performance and incentive fees for publicly traded BDCs and commercial mREITs. (2) Includes members of the BBREMTG Index with market capitalization above $200mm. Excludes NLY. (3) Includes publicly traded BDCs with total market capitalization greater than $500 million. (4) Annaly actual expense ratios reflect annualized 1H 2016 expense figures over 1H 2016 average equity.
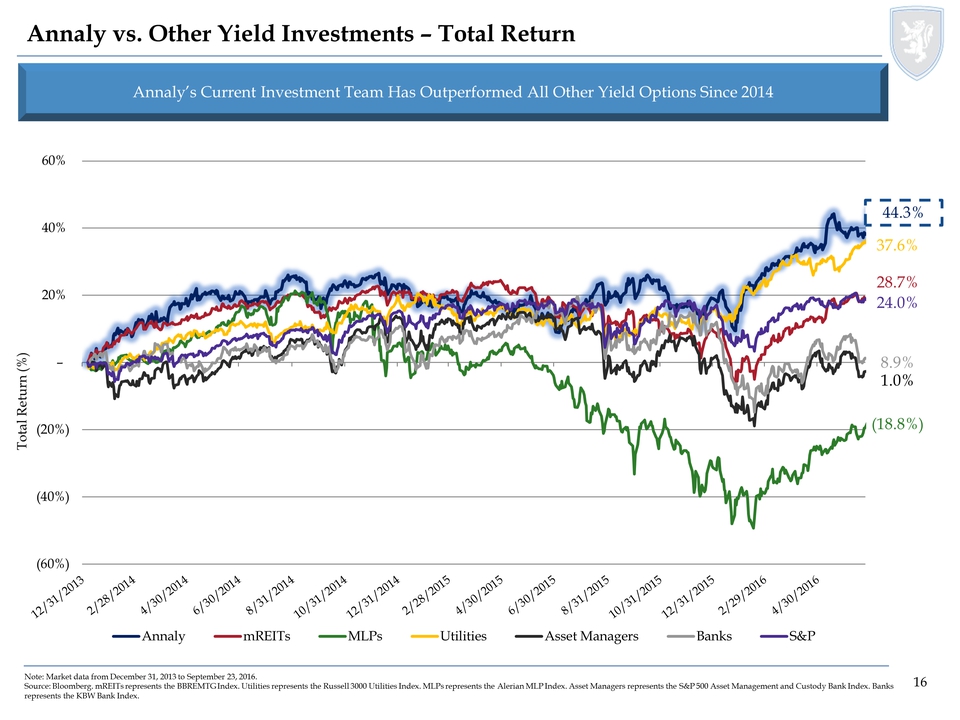
16 (60%) (40%) (20%) – 20% 40% 60% Total Return (%) Annaly mREITs MLPs Utilities Asset Managers Banks S&P Annaly vs. Other Yield Investments – Total Return Note: Market data from December 31, 2013 to September 23, 2016. Source: Bloomberg. mREITs represents the BBREMTG Index. Utilities represents the Russell 3000 Utilities Index. MLPs represents the Alerian MLP Index. Asset Managers represents the S&P 500 Asset Management and Custody Bank Index. Banks represents the KBW Bank Index. Annaly’s Current Investment Team Has Outperformed All Other Yield Options Since 2014 44.3% 28.7% (18.8%) 1.0% 8.9% 24.0% 37.6% 12/31/2013 2/28/2014 4/30/2014 8/31/2014 10/31/2014 2/28/2015 4/30/2015 6/30/2015 8/31/2015 10/31/2015 12/31/2015 2/29/2016 4/30/2016
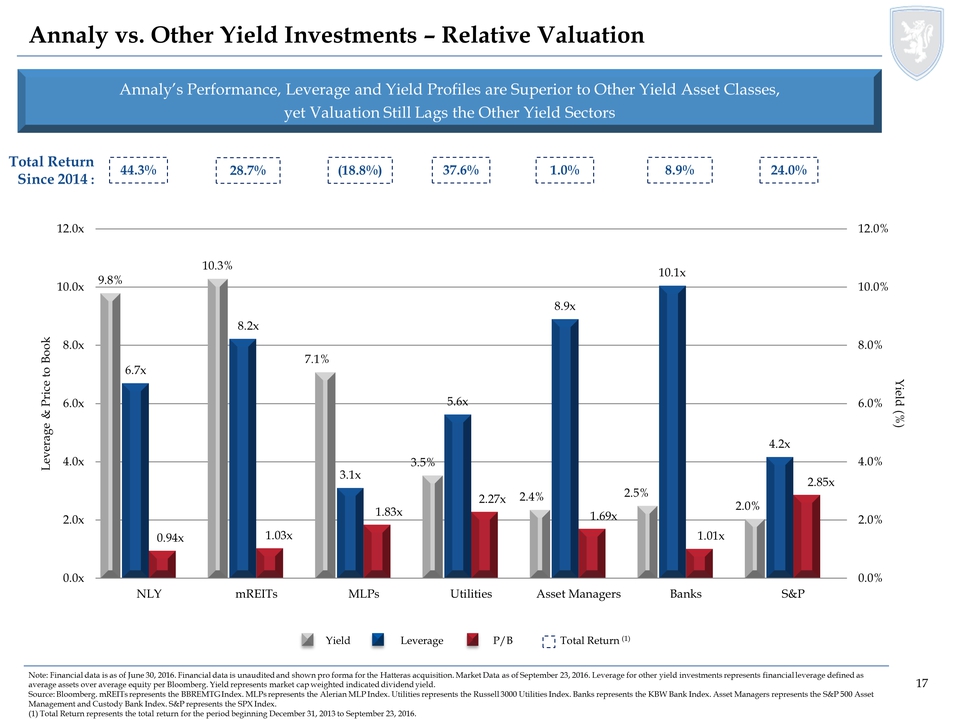
17 Note: Financial data is as of June 30, 2016. Financial data is unaudited and shown pro forma for the Hatteras acquisition. Market Data as of September 23, 2016. Leverage for other yield investments represents financial leverage defined as average assets over average equity per Bloomberg. Yield represents market cap weighted indicated dividend yield. Source: Bloomberg. mREITs represents the BBREMTG Index. MLPs represents the Alerian MLP Index. Utilities represents the Russell 3000 Utilities Index. Banks represents the KBW Bank Index. Asset Managers represents the S&P 500 Asset Management and Custody Bank Index. S&P represents the SPX Index. (1) Total Return represents the total return for the period beginning December 31, 2013 to September 23, 2016. Annaly’s Performance, Leverage and Yield Profiles are Superior to Other Yield Asset Classes, yet Valuation Still Lags the Other Yield Sectors Annaly vs. Other Yield Investments – Relative Valuation Yield Leverage P/B Total Return 44.3% (18.8%) 37.6% 1.0% 8.9% Since 2014 : Total Return (1) 28.7% 24.0% 6.7x 8.2x 3.1x 5.6x 8.9x 10.1x 4.2x 0.94x 1.03x 1.83x 2.27x 1.69x 1.01x 2.85x 9.8% 10.3% 7.1% 3.5% 2.4% 2.5% 2.0% 0.0% 2.0% 4.0% 6.0% 8.0% 10.0% 12.0% 0.0x 2.0x 4.0x 6.0x 8.0x 10.0x 12.0x NLY mREITs MLPs Utilities Asset Managers Banks S&P Yield (%) Leverage & Price to Book
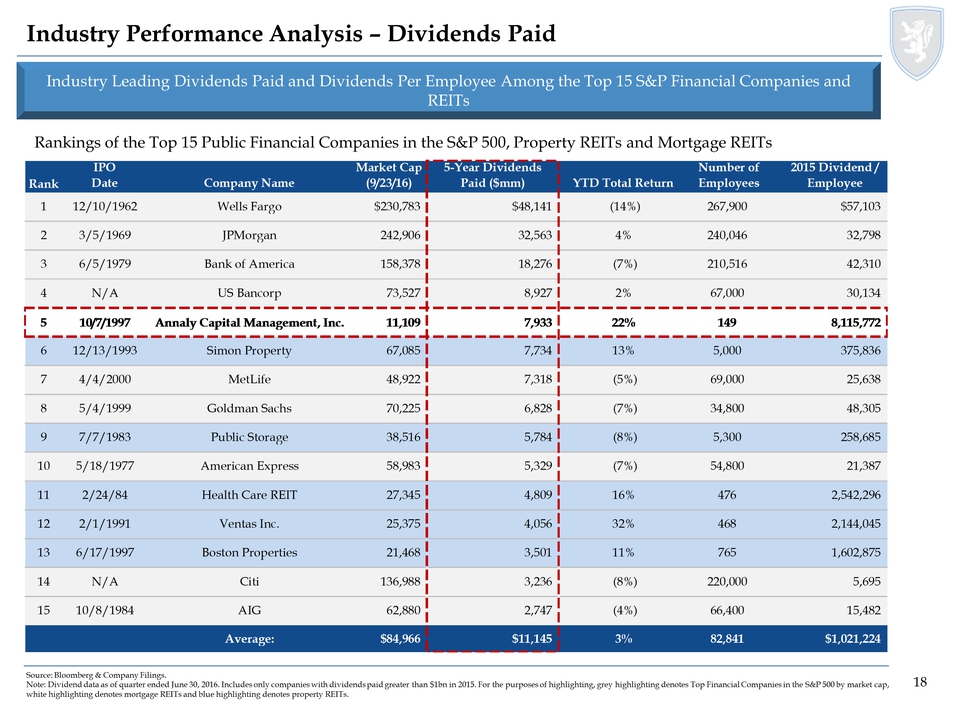
18 Industry Performance Analysis – Dividends Paid Rankings of the Top 15 Public Financial Companies in the S&P 500, Property REITs and Mortgage REITs Industry Leading Dividends Paid and Dividends Per Employee Among the Top 15 S&P Financial Companies and REITs Rank IPO Date Company Name Market Cap (9/23/16) 5-Year Dividends Paid ($mm) YTD Total Return Number of Employees 2015 Dividend / Employee 1 12/10/1962 Wells Fargo $230,783 $48,141 (14%) 267,900 $57,103 2 3/5/1969 JPMorgan 242,906 32,563 4% 240,046 32,798 3 6/5/1979 Bank of America 158,378 18,276 (7%) 210,516 42,310 4 N/A US Bancorp 73,527 8,927 2% 67,000 30,134 5 10/7/1997 Annaly Capital Management, Inc. 11,109 7,933 22% 149 8,115,772 6 12/13/1993 Simon Property 67,085 7,734 13% 5,000 375,836 7 4/4/2000 MetLife 48,922 7,318 (5%) 69,000 25,638 8 5/4/1999 Goldman Sachs 70,225 6,828 (7%) 34,800 48,305 9 7/7/1983 Public Storage 38,516 5,784 (8%) 5,300 258,685 10 5/18/1977 American Express 58,983 5,329 (7%) 54,800 21,387 11 2/24/84 Health Care REIT 27,345 4,809 16% 476 2,542,296 12 2/1/1991 Ventas Inc. 25,375 4,056 32% 468 2,144,045 13 6/17/1997 Boston Properties 21,468 3,501 11% 765 1,602,875 14 N/A Citi 136,988 3,236 (8%) 220,000 5,695 15 10/8/1984 AIG 62,880 2,747 (4%) 66,400 15,482 Average: $84,966 $11,145 3% 82,841 $1,021,224 Source: Bloomberg & Company Filings. Note: Dividend data as of quarter ended June 30, 2016. Includes only companies with dividends paid greater than $1bn in 2015. For the purposes of highlighting, grey highlighting denotes Top Financial Companies in the S&P 500 by market cap, white highlighting denotes mortgage REITs and blue highlighting denotes property REITs.
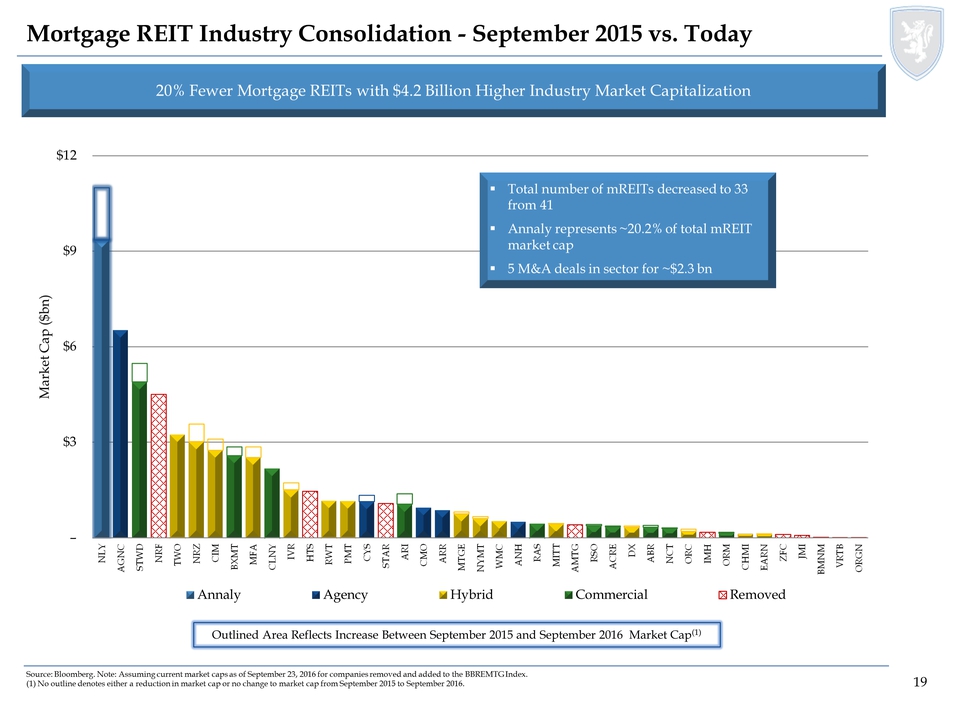
19 $3 $6 $9 $12 NLY AGNC STWD NRF TWO NRZ CIM BXMT MFA CLNY IVR HTS RWT PMT CYS STAR ARI CMO ARR MTGE NYMT WMC ANH RAS MITT AMTG RSO ACRE DX ABR NCT ORC IMH ORM CHMI EARN ZFC JMI BMNM VRTB ORGN Market Cap ($bn) Annaly Agency Hybrid Commercial Removed Mortgage REIT Industry Consolidation - September 2015 vs. Today Source: Bloomberg. Note: Assuming current market caps as of September 23, 2016 for companies removed and added to the BBREMTG Index. (1) No outline denotes either a reduction in market cap or no change to market cap from September 2015 to September 2016. 20% Fewer Mortgage REITs with $4.2 Billion Higher Industry Market Capitalization Outlined Area Reflects Increase Between September 2015 and September 2016 Market Cap(1) Total number of mREITs decreased to 33 from 41 Annaly represents ~20.2% of total mREIT market cap 5 M&A deals in sector for ~$2.3 bn
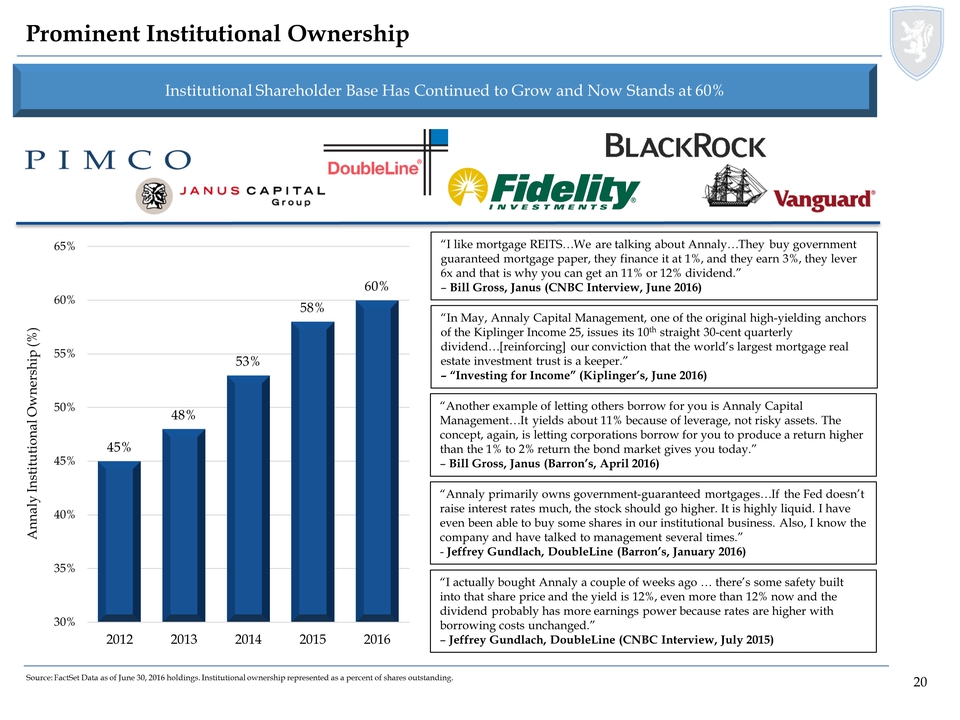
20 Prominent Institutional Ownership Source: FactSet Data as of June 30, 2016 holdings. Institutional ownership represented as a percent of shares outstanding. Institutional Shareholder Base Has Continued to Grow and Now Stands at 60% 45% 48% 53% 58% 60% 30% 35% 40% 45% 50% 55% 60% 65% 2012 2013 2014 2015 2016 Annaly Institutional Ownership (%) “I like mortgage REITS…We are talking about Annaly…They buy government guaranteed mortgage paper, they finance it at 1%, and they earn 3%, they lever 6x and that is why you can get an 11% or 12% dividend.” – Bill Gross, Janus (CNBC Interview, June 2016) “In May, Annaly Capital Management, one of the original high-yielding anchors of the Kiplinger Income 25, issues its 10th straight 30-cent quarterly dividend…[reinforcing] our conviction that the world’s largest mortgage real estate investment trust is a keeper.” – “Investing for Income” (Kiplinger’s, June 2016) “Another example of letting others borrow for you is Annaly Capital Management…It yields about 11% because of leverage, not risky assets. The concept, again, is letting corporations borrow for you to produce a return higher than the 1% to 2% return the bond market gives you today.” – Bill Gross, Janus (Barron’s, April 2016) “Annaly primarily owns government-guaranteed mortgages…If the Fed doesn’t raise interest rates much, the stock should go higher. It is highly liquid. I have even been able to buy some shares in our institutional business. Also, I know the company and have talked to management several times.” - Jeffrey Gundlach, DoubleLine (Barron’s, January 2016) “I actually bought Annaly a couple of weeks ago … there’s some safety built into that share price and the yield is 12%, even more than 12% now and the dividend probably has more earnings power because rates are higher with borrowing costs unchanged.” – Jeffrey Gundlach, DoubleLine (CNBC Interview, July 2015)
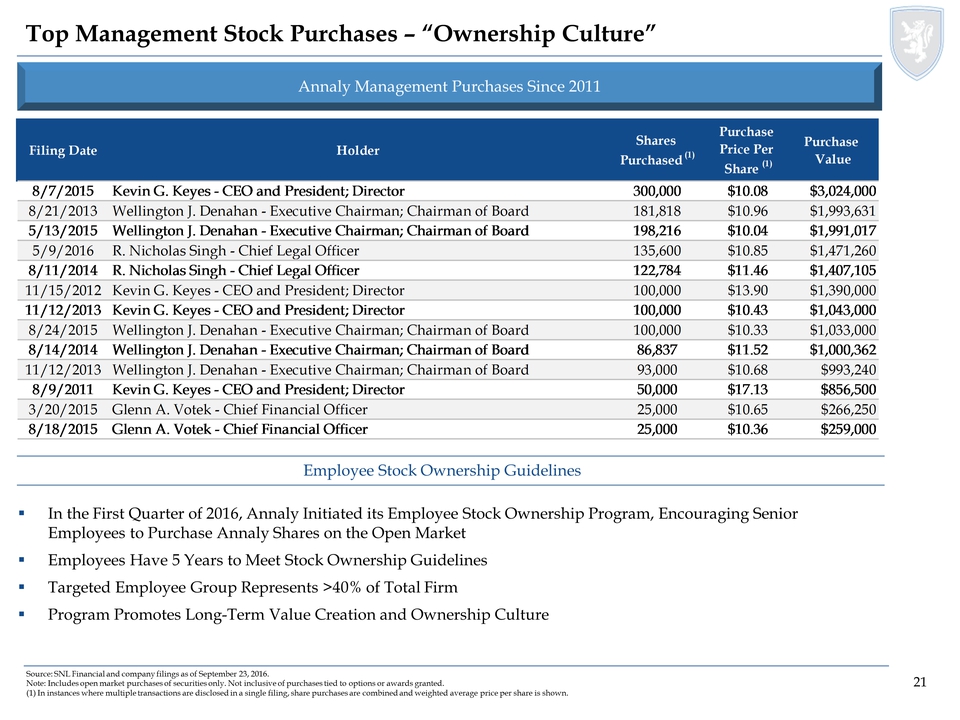
21 Employee Stock Ownership Guidelines Top Management Stock Purchases – “Ownership Culture” Source: SNL Financial and company filings as of September 23, 2016. Note: Includes open market purchases of securities only. Not inclusive of purchases tied to options or awards granted. (1) In instances where multiple transactions are disclosed in a single filing, share purchases are combined and weighted average price per share is shown. In the First Quarter of 2016, Annaly Initiated its Employee Stock Ownership Program, Encouraging Senior Employees to Purchase Annaly Shares on the Open Market Employees Have 5 Years to Meet Stock Ownership Guidelines Targeted Employee Group Represents >40% of Total Firm Program Promotes Long-Term Value Creation and Ownership Culture Filing Date Holder Shares Purchased (1) Purchase Price Per Share (1) Purchase Value 8/7/2015 Kevin G. Keyes - CEO and President; Director 300,000 $10.08 $3,024,000 8/21/2013 Wellington J. Denahan - Executive Chairman; Chairman of Board 181,818 $10.96 $1,993,631 5/13/2015 Wellington J. Denahan - Executive Chairman; Chairman of Board 198,216 $10.04 $1,991,017 5/9/2016 R. Nicholas Singh - Chief Legal Officer 135,600 $10.85 $1,471,260 8/11/2014 R. Nicholas Singh - Chief Legal Officer 122,784 $11.46 $1,407,105 11/15/2012 Kevin G. Keyes - CEO and President; Director 100,000 $13.90 $1,390,000 11/12/2013 Kevin G. Keyes - CEO and President; Director 100,000 $10.43 $1,043,000 8/24/2015 Wellington J. Denahan - Executive Chairman; Chairman of Board 100,000 $10.33 $1,033,000 8/14/2014 Wellington J. Denahan - Executive Chairman; Chairman of Board 86,837 $11.52 $1,000,362 11/12/2013 Wellington J. Denahan - Executive Chairman; Chairman of Board 93,000 $10.68 $993,240 8/9/2011 Kevin G. Keyes - CEO and President; Director 50,000 $17.13 $856,500 3/20/2015 Glenn A. Votek - Chief Financial Officer 25,000 $10.65 $266,250 8/18/2015 Glenn A. Votek - Chief Financial Officer 25,000 $10.36 $259,000
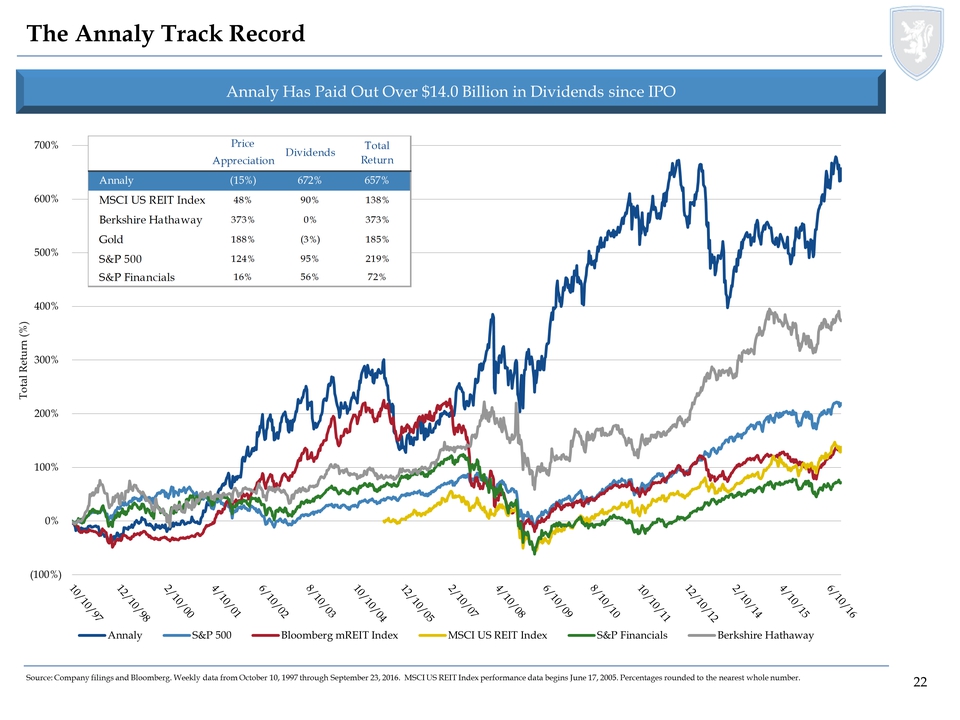
22 (100%) 0% 100% 200% 300% 400% 500% 600% 700% Total Return (%) Annaly S&P 500 Bloomberg mREIT Index MSCI US REIT Index S&P Financials Berkshire Hathaway The Annaly Track Record Annaly Has Paid Out Over $14.0 Billion in Dividends since IPO Source: Company filings and Bloomberg. Weekly data from October 10, 1997 through September 23, 2016. MSCI US REIT Index performance data begins June 17, 2005. Percentages rounded to the nearest whole number. Price Appreciation Annaly (15%) 72% 657% MSCI US REIT Index 48% 90% 138% Berkshire Hathaway 373% 0% 373% Gold 188% (3%) 185% S&P 500 124% 95% 219% S&P Financials 16% 56% 72% Dividends Total Return 10/10/97 12/10/98 2/10/00 4/10/01 6/10/02 8/10/03 10/10/04 12/10/05 2/10/07 4/10/08 6/10/09 4/10/08 8/10/10 10/10/11 12/10/12 2/10/14 4/10/15 6/10/16

23 ANNALY Business Line Overview and Non-GAAP Reconciliation
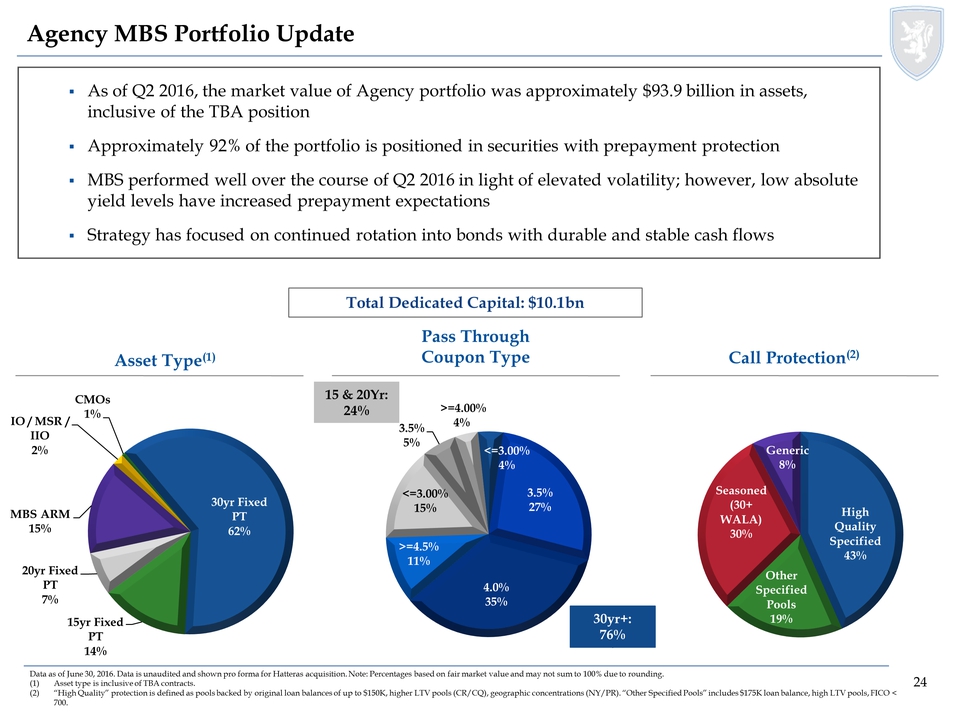
24 Pass Through Coupon Type Agency MBS Portfolio Update Data as of June 30, 2016. Data is unaudited and shown pro forma for Hatteras acquisition. Note: Percentages based on fair market value and may not sum to 100% due to rounding. (1) Asset type is inclusive of TBA contracts. (2) “High Quality” protection is defined as pools backed by original loan balances of up to $150K, higher LTV pools (CR/CQ), geographic concentrations (NY/PR). “Other Specified Pools” includes $175K loan balance, high LTV pools, FICO < 700. As of Q2 2016, the market value of Agency portfolio was approximately $93.9 billion in assets, inclusive of the TBA position Approximately 92% of the portfolio is positioned in securities with prepayment protection MBS performed well over the course of Q2 2016 in light of elevated volatility; however, low absolute yield levels have increased prepayment expectations Strategy has focused on continued rotation into bonds with durable and stable cash flows Asset Type(1) Call Protection(2) Total Dedicated Capital: $10.1bn High Quality Specified 43% Other Specified Pools 19% Seasoned (30+ WALA) 30% Generic 8% <=3.00% 4% 3.5% 27% 4.0% 35% >=4.5% 11% <=3.00% 15% 3.5% 5% >=4.00% 4% 15 & 20Yr: 24% 30yr+: 76% 30yr Fixed PT 62% 15yr Fixed PT 14% 20yr Fixed PT 7% MBS ARM 15% IO / MSR / IIO 2% CMOs 1%
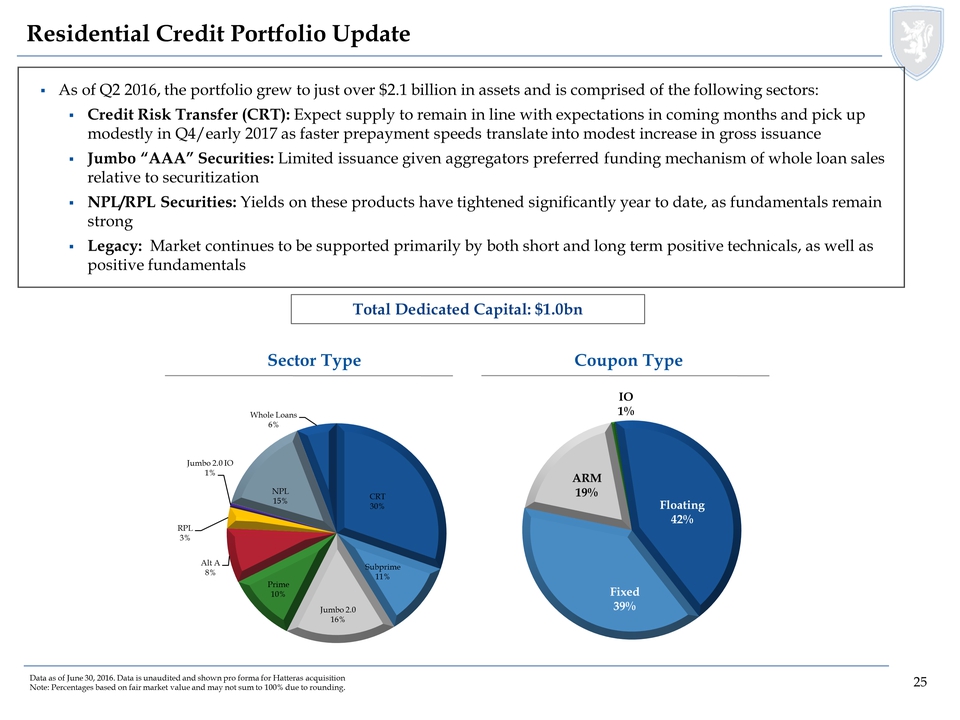
25 Residential Credit Portfolio Update Data as of June 30, 2016. Data is unaudited and shown pro forma for Hatteras acquisition Note: Percentages based on fair market value and may not sum to 100% due to rounding. As of Q2 2016, the portfolio grew to just over $2.1 billion in assets and is comprised of the following sectors: Credit Risk Transfer (CRT): Expect supply to remain in line with expectations in coming months and pick up modestly in Q4/early 2017 as faster prepayment speeds translate into modest increase in gross issuance Jumbo “AAA” Securities: Limited issuance given aggregators preferred funding mechanism of whole loan sales relative to securitization NPL/RPL Securities: Yields on these products have tightened significantly year to date, as fundamentals remain strong Legacy: Market continues to be supported primarily by both short and long term positive technicals, as well as positive fundamentals Sector Type Coupon Type Total Dedicated Capital: $1.0bn CRT 30% Subprime 11% Jumbo 2.0 16% Prime 10% Alt A 8% RPL 3% Jumbo 2.0 IO 1% NPL 15% Whole Loans 6% Fixed 39% ARM 19% IO 1% Floating 42%
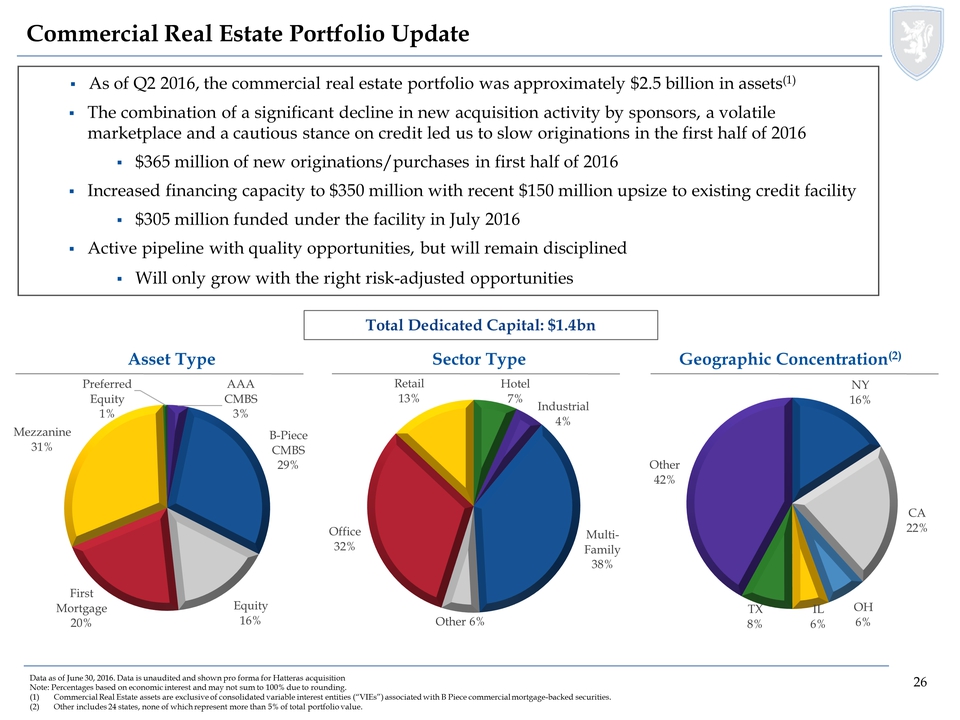
26 Commercial Real Estate Portfolio Update Data as of June 30, 2016. Data is unaudited and shown pro forma for Hatteras acquisition Note: Percentages based on economic interest and may not sum to 100% due to rounding. (1) Commercial Real Estate assets are exclusive of consolidated variable interest entities (“VIEs”) associated with B Piece commercial mortgage-backed securities. (2) Other includes 24 states, none of which represent more than 5% of total portfolio value. As of Q2 2016, the commercial real estate portfolio was approximately $2.5 billion in assets(1) The combination of a significant decline in new acquisition activity by sponsors, a volatile marketplace and a cautious stance on credit led us to slow originations in the first half of 2016 $365 million of new originations/purchases in first half of 2016 Increased financing capacity to $350 million with recent $150 million upsize to existing credit facility $305 million funded under the facility in July 2016 Active pipeline with quality opportunities, but will remain disciplined Will only grow with the right risk-adjusted opportunities1.9 billion Asset Type Sector Type Geographic Concentration(2) Total Dedicated Capital: $1.4bn AAA CMBS 3% B-Piece CMBS 29% Equity 16% First Mortgage 20% Mezzanine 31% Preferred Equity 1% NY 16% CA 22% OH 6% IL 6% TX 8% Other 42% Hotel 7% Industrial 4% Multi-Family 38% Other 6% Office 32% Retail 13%
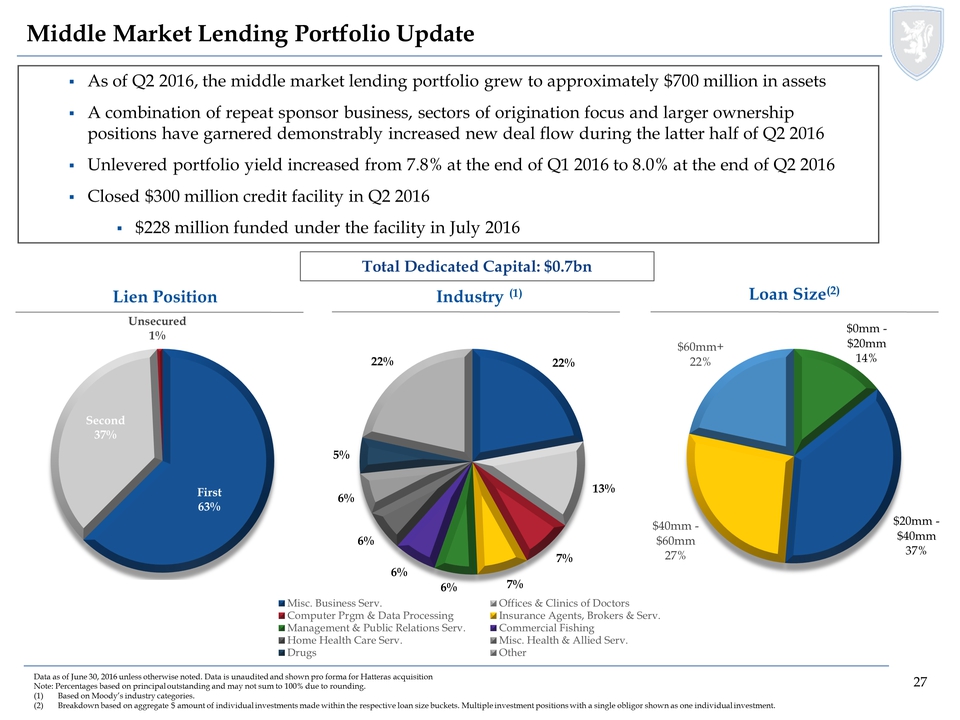
27 Middle Market Lending Portfolio Update Lien Position Industry (1) Loan Size(2) As of Q2 2016, the middle market lending portfolio grew to approximately $700 million in assets A combination of repeat sponsor business, sectors of origination focus and larger ownership positions have garnered demonstrably increased new deal flow during the latter half of Q2 2016 Unlevered portfolio yield increased from 7.8% at the end of Q1 2016 to 8.0% at the end of Q2 2016 Closed $300 million credit facility in Q2 2016 $228 million funded under the facility in July 2016 Total Dedicated Capital: $0.7bn Data as of June 30, 2016 unless otherwise noted. Data is unaudited and shown pro forma for Hatteras acquisition Note: Percentages based on principal outstanding and may not sum to 100% due to rounding. (1) Based on Moody’s industry categories. (2) Breakdown based on aggregate $ amount of individual investments made within the respective loan size buckets. Multiple investment positions with a single obligor shown as one individual investment. [ TBU ] 22% 13% 7% 6% 7% 6% 6% 6% 5% 22% Misc. Business Serv. Offices & Clinics of Doctors Computer Prgm & Data Processing Insurance Agents, Brokers & Serv. Management & Public Relations Serv. Commercial Fishing Home Health Care Serv. Misc. Health & Allied Serv. Drugs Other First 63% Second 37% Unsecured 1% $0mm - $20mm 14% $20mm - $40mm 37% $40mm - $60mm 27% $60mm+ 22%
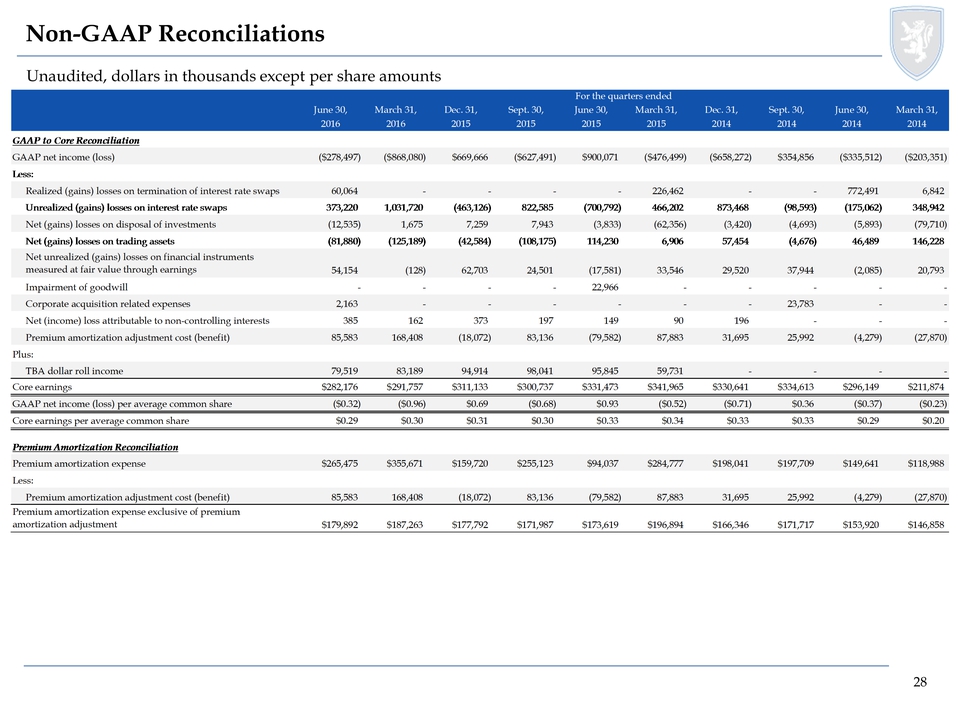
28 Non-GAAP Reconciliations Unaudited, dollars in thousands except per share amounts For the quarters ended June 30, March 31, Dec. 31, Sept. 30, June 30, March 31, Dec. 31, Sept. 30, June 30, March 31, 2016 2016 2015 2015 2015 2015 2014 2014 2014 2014 GAAP to Core Reconciliation GAAP net income (loss) ($278,497) ($868,080) $669,666 ($627,491) $900,071 ($476,499) ($658,272) $354,856 ($335,512) ($203,351) Less: Realized (gains) losses on termination of interest rate swaps 60,064 - - - - 226,462 - - 772,491 6,842 Unrealized (gains) losses on interest rate swaps 373,220 1,031,720 (463,126) 822,585 (700,792) 466,202 873,468 (98,593) (175,062) 348,942 Net (gains) losses on disposal of investments (12,535) 1,675 7,259 7,943 (3,833) (62,356) (3,420) (4,693) (5,893) (79,710) Net (gains) losses on trading assets (81,880) (125,189) (42,584) (108,175) 114,230 6,906 57,454 (4,676) 46,489 146,228 Net unrealized (gains) losses on financial instruments measured at fair value through earnings 54,154 (128) 62,703 24,501 (17,581) 33,546 29,520 37,944 (2,085) 20,793 Impairment of goodwill - - - - 22,966 - - - - - Corporate acquisition related expenses 2,163 - - - - - - 23,783 - - Net (income) loss attributable to non-controlling interests 385 162 373 197 149 90 196 - - - Premium amortization adjustment cost (benefit) 85,583 168,408 (18,072) 83,136 (79,582) 87,883 31,695 25,992 (4,279) (27,870) Plus: TBA dollar roll income 79,519 83,189 94,914 98,041 95,845 59,731 - - - - Core earnings $282,176 $291,757 $311,133 $300,737 $331,473 $341,965 $330,641 $334,613 $296,149 $211,874 GAAP net income (loss) per average common share ($0.32) ($0.96) $0.69 ($0.68) $0.93 ($0.52) ($0.71) $0.36 ($0.37) ($0.23) Core earnings per average common share $0.29 $0.30 $0.31 $0.30 $0.33 $0.34 $0.33 $0.33 $0.29 $0.20 Premium Amortization Reconciliation Premium amortization expense $265,475 $355,671 $159,720 $255,123 $94,037 $284,777 $198,041 $197,709 $149,641 $118,988 Less: Premium amortization adjustment cost (benefit) 85,583 168,408 (18,072) 83,136 (79,582) 87,883 31,695 25,992 (4,279) (27,870) $179,892 $187,263 $177,792 $171,987 $173,619 $196,894 $166,346 $171,717 $153,920 $146,858 Premium amortization expense exclusive of premium amortization adjustment