Exhibit 99.2
![](https://capedge.com/proxy/8-K/0001157523-16-007198/a51451959ex99_2slide1.jpg)
November 2, 2016 Third Quarter 2016 Financial Summary
![](https://capedge.com/proxy/8-K/0001157523-16-007198/a51451959ex99_2slide2.jpg)
This presentation, other written or oral communications, and our public documents to which we refer contain or incorporate by reference certain forward-looking statements which are based on various assumptions (some of which are beyond our control) and may be identified by reference to a future period or periods or by the use of forward-looking terminology, such as “may,” “will,” “believe,” “expect,” “anticipate,” “continue,” or similar terms or variations on those terms or the negative of those terms. Actual results could differ materially from those set forth in forward-looking statements due to a variety of factors, including, but not limited to, changes in interest rates; changes in the yield curve; changes in prepayment rates; the availability of mortgage-backed securities (“MBS”) and other securities for purchase; the availability of financing and, if available, the terms of any financings; changes in the market value of our assets; changes in business conditions and the general economy; our ability to grow our commercial business; our ability to grow our residential mortgage credit business; credit risks related to our investments in credit risk transfer securities, residential mortgage-backed securities and related residential mortgage credit assets, commercial real estate assets and corporate debt; risks related to investments in mortgage servicing rights and ownership of a servicer; any potential business disruption following the acquisition of Hatteras Financial Corp.; our ability to consummate any contemplated investment opportunities; changes in government regulations affecting our business; our ability to maintain our qualification as a REIT; and our ability to maintain our exemption from registration under the Investment Company Act of 1940, as amended. For a discussion of the risks and uncertainties which could cause actual results to differ from those contained in the forward-looking statements, see “Risk Factors” in our most recent Annual Report on Form 10-K and any subsequent Quarterly Reports on Form 10-Q. We do not undertake, and specifically disclaim any obligation, to publicly release the result of any revisions which may be made to any forward-looking statements to reflect the occurrence of anticipated or unanticipated events or circumstances after the date of such statements, except as required by law.Non-GAAP Financial MeasuresThis presentation includes certain non-GAAP financial measures. The non-GAAP financial measures should not be viewed in isolation and are not a substitute for financial measures computed in accordance with GAAP. Please see the section entitled “Non-GAAP Reconciliations” in the attached Appendix for a reconciliation to the most directly comparable GAAP financial measures. A reconciliation of GAAP net income (loss) to non-GAAP core earnings is provided on page 7 of this financial summary. Safe Harbor Notice
![](https://capedge.com/proxy/8-K/0001157523-16-007198/a51451959ex99_2slide3.jpg)
Note: The endnotes for this page appear in the section entitled “Endnotes for Page 2” in the Appendix. Core earnings, core earnings per common share, annualized core return on average equity, core average yield on interest earning assets, core net interest margin and core net interest spread represent non-GAAP measures. This presentation also includes additional non-GAAP measures, including core interest income, economic interest expense and economic core net interest income. See the section entitled “Non-GAAP Reconciliations” in the Appendix for a reconciliation of non-GAAP financial measures to the most directly comparable GAAP financial measures. A reconciliation of GAAP net income (loss) to non-GAAP core earnings is provided on page 7 of this financial summary. 3Q 2016 Financial Snapshot Unaudited, dollars in thousands except per share amounts
![](https://capedge.com/proxy/8-K/0001157523-16-007198/a51451959ex99_2slide4.jpg)
Unaudited, dollars in thousands Last Five Quarters Summary Data Includes consolidated variable interest entities (“VIEs”) and loans held for sale.The current quarter change in constant prepayment rate (“CPR”) measures also reflects the change in portfolio mix due to the Company’s acquisition of Hatteras Financial Corp (The “Hatteras Acquisition”). For the quarters ended September 30, June 30, March 31, December 31, September 30, 2016 2016 2016 2015 2015 Portfolio-Related Data: Agency mortgage-backed securities and debentures $73,476,105 $64,862,992 $65,596,859 $65,870,262 $66,219,755 Mortgage servicing rights $492,169 - - - - Residential credit portfolio $2,439,704 $1,717,870 $1,658,674 $1,363,232 $820,764 Commercial real estate investments (1) $6,033,576 $6,168,723 $6,385,579 $5,075,191 $4,976,251 Corporate debt $716,831 $669,612 $639,481 $488,508 $424,974 Total Residential Investment Securities and commercial investment portfolio $83,158,385 $73,419,197 $74,280,593 $72,797,193 $72,441,744 Total assets $86,909,306 $77,716,470 $77,443,965 $75,190,893 $75,338,687 Average TBA position $17,280,237 $14,592,236 $15,110,947 $14,366,749 $14,210,373 Residential investment securities: % Fixed-rate 81% 92% 93% 93% 93% % Adjustable-rate 19% 8% 7% 7% 7% Weighted average experienced CPR, for the period (2) 15.9% 12.7% 8.8% 9.7% 11.5% Weighted average projected long-term CPR, as of period end (2) 14.4% 13.0% 11.8% 8.8% 9.2% Net premium and discount balance in Residential Investment Securities $4,920,750 $4,626,548 $4,741,900 $4,951,252 $4,827,791 Net premium and discount balance as % of stockholders' equity 37.13% 40.05% 40.71% 41.62% 39.32%
![](https://capedge.com/proxy/8-K/0001157523-16-007198/a51451959ex99_2slide5.jpg)
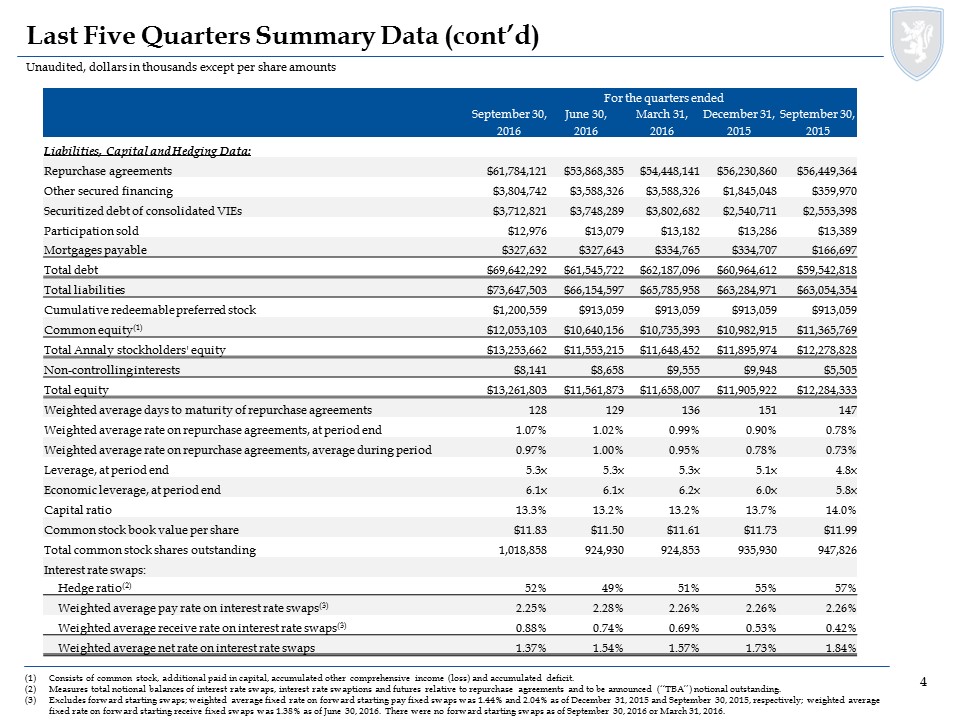
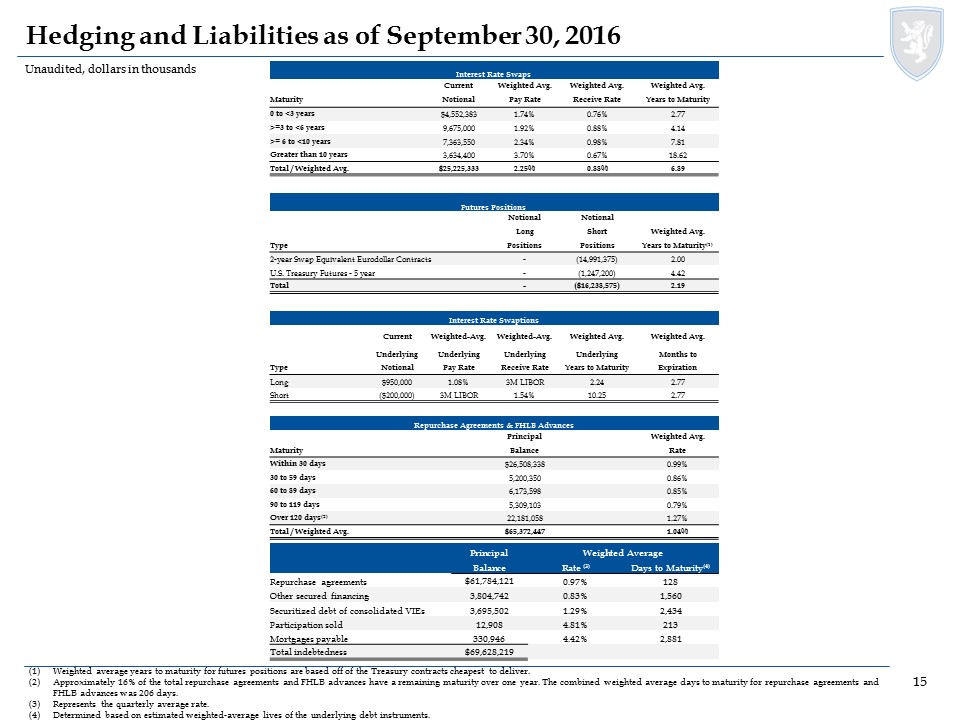
Unaudited, dollars in thousands except per share amounts Last Five Quarters Summary Data (cont’d) Consists of common stock, additional paid in capital, accumulated other comprehensive income (loss) and accumulated deficit.Measures total notional balances of interest rate swaps, interest rate swaptions and futures relative to repurchase agreements and to be announced (“TBA”) notional outstanding.Excludes forward starting swaps; weighted average fixed rate on forward starting pay fixed swaps was 1.44% and 2.04% as of December 31, 2015 and September 30, 2015, respectively; weighted average fixed rate on forward starting receive fixed swaps was 1.38% as of June 30, 2016. There were no forward starting swaps as of September 30, 2016 or March 31, 2016. For the quarters ended September 30, June 30, March 31, December 31, September 30, 2016 2016 2016 2015 2015 Liabilities, Capital and Hedging Data: Repurchase agreements $61,784,121 $53,868,385 $54,448,141 $56,230,860 $56,449,364 Other secured financing $3,804,742 $3,588,326 $3,588,326 $1,845,048 $359,970 Securitized debt of consolidated VIEs $3,712,821 $3,748,289 $3,802,682 $2,540,711 $2,553,398 Participation sold $12,976 $13,079 $13,182 $13,286 $13,389 Mortgages payable $327,632 $327,643 $334,765 $334,707 $166,697 Total debt $69,642,292 $61,545,722 $62,187,096 $60,964,612 $59,542,818 Total liabilities $73,647,503 $66,154,597 $65,785,958 $63,284,971 $63,054,354 Cumulative redeemable preferred stock $1,200,559 $913,059 $913,059 $913,059 $913,059 Common equity(1) $12,053,103 $10,640,156 $10,735,393 $10,982,915 $11,365,769 Total Annaly stockholders' equity $13,253,662 $11,553,215 $11,648,452 $11,895,974 $12,278,828 Non-controlling interests $8,141 $8,658 $9,555 $9,948 $5,505 Total equity $13,261,803 $11,561,873 $11,658,007 $11,905,922 $12,284,333 Weighted average days to maturity of repurchase agreements 128 129 136 151 147 Weighted average rate on repurchase agreements, at period end 1.07% 1.02% 0.99% 0.90% 0.78% Weighted average rate on repurchase agreements, average during period 0.97% 1.00% 0.95% 0.78% 0.73% Leverage, at period end 5.3x 5.3x 5.3x 5.1x 4.8x Economic leverage, at period end 6.1x 6.1x 6.2x 6.0x 5.8x Capital ratio 13.3% 13.2% 13.2% 13.7% 14.0% Common stock book value per share $11.83 $11.50 $11.61 $11.73 $11.99 Total common stock shares outstanding 1,018,858 924,930 924,853 935,930 947,826 Interest rate swaps: Hedge ratio(2) 52% 49% 51% 55% 57% Weighted average pay rate on interest rate swaps(3) 2.25% 2.28% 2.26% 2.26% 2.26% Weighted average receive rate on interest rate swaps(3) 0.88% 0.74% 0.69% 0.53% 0.42% Weighted average net rate on interest rate swaps 1.37% 1.54% 1.57% 1.73% 1.84%
![](https://capedge.com/proxy/8-K/0001157523-16-007198/a51451959ex99_2slide6.jpg)
Unaudited, dollars in thousands except per share amounts Last Five Quarters Summary Data (cont’d) Includes interest expense on interest rate swaps used to hedge cost of funds. Excludes interest expense on interest rate swaps used to hedge TBA dollar rolls. For the quarters ended September 30, June 30, March 31, December 31, September 30, 2016 2016 2016 2015 2015 Performance-Related Data: Total interest income $558,668 $457,118 $388,143 $576,580 $450,726 Total interest expense $174,154 $152,755 $147,447 $118,807 $110,297 Net interest income $384,514 $304,363 $240,696 $457,773 $340,429 Total core interest income $562,559 $542,701 $556,551 $558,508 $533,862 Total economic interest expense (1) $277,254 $261,056 $270,571 $254,074 $248,041 Economic core net interest income (1) $285,305 $281,645 $285,980 $304,434 $285,821 GAAP net income (loss) $730,880 ($278,497) ($868,080) $669,666 ($627,491) GAAP net income (loss) available (related) to common shareholders $708,413 ($296,104) ($885,910) $652,047 ($645,286) GAAP earnings per common share $0.70 ($0.32) ($0.96) $0.69 ($0.68) Core earnings $312,893 $282,176 $291,757 $311,133 $300,737 Core earnings available to common shareholders $290,090 $264,184 $273,765 $293,141 $282,745 Core earnings per average common share $0.29 $0.29 $0.30 $0.31 $0.30 Dividends declared per common share $0.30 $0.30 $0.30 $0.30 $0.30 Total common and preferred dividends declared $325,091 $295,471 $295,448 $298,771 $302,340 Annualized return on average equity 23.55% (9.60%) (29.47%) 22.15% (20.18%) Annualized return on average equity per unit of economic leverage 3.86% (1.57%) (4.75%) 3.69% (3.48%) Annualized core return on average equity 10.09% 9.73% 9.91% 10.30% 9.67% Annualized core return on average equity per unit of economic leverage 1.65% 1.60% 1.60% 1.72% 1.67% Net interest margin 1.40% 1.15% 0.79% 1.80% 1.27% Core net interest margin 1.42% 1.54% 1.54% 1.71% 1.65% Average yield on interest earning assets 2.70% 2.48% 2.09% 3.15% 2.48% Core average yield on interest earning assets 2.72% 2.95% 3.00% 3.05% 2.94% Average cost of interest bearing liabilities 1.57% 1.68% 1.73% 1.68% 1.65% Net interest spread 1.13% 0.80% 0.36% 1.47% 0.83% Core net interest spread 1.15% 1.27% 1.27% 1.37% 1.29%
![](https://capedge.com/proxy/8-K/0001157523-16-007198/a51451959ex99_2slide7.jpg)
Unaudited, dollars in thousands Components of Economic Net Interest Income Included within realized losses on interest rate swaps. Excludes interest expense on interest rate swaps used to hedge TBA dollar rolls. For the quarters ended September 30, June 30, March 31, December 31, September 30, 2016 2016 2016 2015 2015 Interest income: Residential Investment Securities $493,226 $394,850 $315,717 $515,195 $399,702 Residential loans 1,608 - - - - Commercial investment portfolio 61,240 59,578 70,187 60,835 50,204 Reverse repurchase agreements 2,594 2,690 2,239 550 820 Total interest income $558,668 $457,118 $388,143 $576,580 $450,726 Economic interest expense: Repurchase agreements $154,083 $136,176 $132,891 $112,529 $103,823 Interest expense on swaps used to hedge cost of funds(1) 103,100 108,301 123,124 135,267 137,744 Securitized debt of consolidated VIEs 12,046 11,226 9,033 5,597 6,111 Participation sold 157 157 158 160 161 Other 7,868 5,196 5,365 521 202 Total economic interest expense $277,254 $261,056 $270,571 $254,074 $248,041 Economic net interest income $281,414 $196,062 $117,572 $322,506 $202,685 Premium amortization adjustment cost (benefit) 3,891 85,583 168,408 (18,072) 83,136 Economic core net interest income $285,305 $281,645 $285,980 $304,434 $285,821
![](https://capedge.com/proxy/8-K/0001157523-16-007198/a51451959ex99_2slide8.jpg)
Unaudited, dollars in thousands Reconciliations and Changes in Key Metrics Represents transaction costs incurred in connection with the Hatteras Acquisition.Represents a component of Net gains (losses) on trading assets.Represents a component of Net unrealized gains (losses) on investments measured at fair value through earnings. For the quarters ended September 30, June 30, March 31, December 31, September 30, 2016 2016 2016 2015 2015 Core earnings reconciliation GAAP net income $730,880 ($278,497) ($868,080) $669,666 ($627,491) Less: Realized (gains) losses on termination of interest rate swaps (1,337) 60,064 - - - Unrealized (gains) / losses on interest rate swaps (256,462) 373,220 1,031,720 (463,126) 822,585 Net (gains) / losses on disposal of investments (14,447) (12,535) 1,675 7,259 7,943 Net (gains) / losses on trading assets (162,981) (81,880) (125,189) (42,584) (108,175) Net unrealized (gains) losses on investments measured at fair value through earnings (29,675) 54,154 (128) 62,703 24,501 Bargain purchase gain (72,576) - - - - Corporate acquisition related expenses(1) 46,724 2,163 - - - Net (income) loss attributable to noncontrolling interest 336 385 162 373 197 Premium amortization adjustment cost (benefit) 3,891 85,583 168,408 (18,072) 83,136 Plus: TBA Dollar Roll Income(2) 90,174 79,519 83,189 94,914 98,041 MSR amortization(3) (21,634) - - - - Core earnings $312,893 $282,176 $291,757 $311,133 $300,737 Book value per common share rollforward: Book value per common share, beginning of period $11.50 $11.61 $11.73 $11.99 $12.32 Net income (loss) attributable to common stockholders 0.70 (0.32) (0.96) 0.69 (0.68) Other comprehensive income (loss) attributable to common stockholders 0.00 0.51 1.11 (0.68) 0.65 Common dividends declared (0.30) (0.30) (0.30) (0.30) (0.30) Issuance of common stock (0.07) 0.00 0.00 0.00 0.00 Buyback of common stock 0.00 0.00 0.03 0.03 0.00 Book value per common share, end of period $11.83 $11.50 $11.61 $11.73 $11.99
![](https://capedge.com/proxy/8-K/0001157523-16-007198/a51451959ex99_2slide9.jpg)
Unaudited Changes in Key Metrics Includes interest expense on interest rate swaps used to hedge cost of funds. For the quarters ended September 30, June 30, March 31, December 31, September 30, 2016 2016 2016 2015 2015 Changes in net interest margin Prior quarter net interest margin 1.15% 0.79% 1.80% 1.27% 2.06% Quarter-over-quarter changes in contribution: Net amortization of premiums 0.34% 0.39% (0.86%) 0.44% (0.76%) Interest expense and related realized gain (loss) on interest rate swaps 0.09% 0.03% (0.05%) (0.01%) (0.11%) TBA dollar roll income 0.00% (0.01%) (0.06%) (0.02%) 0.03% Coupon on average interest-earning assets (0.18%) (0.05%) (0.04%) 0.12% 0.05% Current quarter net interest margin 1.40% 1.15% 0.79% 1.80% 1.27% Changes in core net interest margin Prior quarter core net interest margin 1.54% 1.54% 1.71% 1.65% 1.70% Quarter-over-quarter changes in contribution: Interest expense and related realized gain (loss) on interest rate swaps 0.09% 0.04% (0.05%) (0.02%) (0.11%) TBA dollar roll income 0.00% (0.01%) (0.06%) (0.02%) 0.03% Net amortization of premiums, exclusive of premium amortization adjustment (0.03%) 0.03% (0.02%) (0.02%) (0.02%) Coupon on average interest-earning assets (0.18%) (0.06%) (0.04%) 0.12% 0.05% Current quarter core net interest margin 1.42% 1.54% 1.54% 1.71% 1.65% Changes in net interest spread Prior quarter core net interest spread 0.80% 0.36% 1.47% 0.83% 1.73% Quarter-over-quarter changes in contribution: Net amortization of premiums 0.41% 0.48% (1.04%) 0.53% (0.91%) Average cost of interest bearing liabilities(1) 0.11% 0.05% (0.05%) (0.03%) (0.06%) Coupon on average interest earning assets (0.19%) (0.09%) (0.02%) 0.14% 0.07% Current quarter core net interest spread 1.13% 0.80% 0.36% 1.47% 0.83% Changes in core net interest spread Prior quarter core net interest spread 1.27% 1.27% 1.37% 1.29% 1.31% Quarter-over-quarter changes in contribution: Average cost of interest bearing liabilities(1) 0.11% 0.05% (0.05%) (0.03%) (0.06%) Net amortization of premiums, exclusive of premium amortization adjustment (0.04%) 0.04% (0.03%) (0.03%) (0.03%) Coupon on average interest earning assets (0.19%) (0.09%) (0.02%) 0.14% 0.07% Current quarter core net interest spread 1.15% 1.27% 1.27% 1.37% 1.29%
![](https://capedge.com/proxy/8-K/0001157523-16-007198/a51451959ex99_2slide10.jpg)
Unaudited Changes in Key Metrics Includes investment advisory income, other income (loss), general and administrative expenses and income taxes.Includes investment advisory income, other income (loss), mortgage servicing rights (“MSR”) amortization (a component of Net unrealized gains (losses) on financial instruments measured at fair value through earnings), general and administrative expenses (excluding corporate acquisition related expenses) and income taxes. For the quarters ended September 30, June 30, March 31, December 31, September 30, 2016 2016 2016 2015 2015 Changes in GAAP return on average equity Prior quarter GAAP return on average equity (9.60%) (29.47%) 22.15% (20.18%) 28.00% Quarter-over-quarter changes in contribution: Unrealized (gains) / losses on interest rate swaps 21.12% 22.17% (50.34%) 41.77% (48.25%) Realized / unrealized (gains) / losses on investments and trading assets 5.29% (2.81%) 5.10% (3.33%) 5.32% Bargain purchase gain 2.34% 0.00% 0.00% 0.00% 0.00% Net amortization of premiums and accretion of discounts 2.24% 2.94% (6.76%) 2.91% (5.28%) Realized (gains) losses on termination of interest rate swaps 2.11% (2.07%) 0.00% 0.00% 0.00% Interest expense and related realized gain (loss) on interest rate swaps 0.14% 0.24% (0.81%) (0.44%) (0.75%) Coupon income 0.02% (0.37%) 0.87% 1.66% 0.35% Impairment of goodwill 0.00% 0.00% 0.00% 0.00% 0.71% Other(1) (0.11%) (0.23%) 0.32% (0.24%) (0.28%) Current quarter GAAP return on average equity 23.55% (9.60%) (29.47%) 22.15% (20.18%) Changes in core return on average equity Prior quarter core return on average equity 9.73% 9.91% 10.30% 9.67% 10.31% Quarter-over-quarter changes in contribution: Other(2) 0.62% (0.15%) 0.31% (0.23%) (0.28%) TBA dollar roll income 0.17% (0.08%) (0.32%) (0.01%) 0.17% Economic interest expense and other swaps expense 0.14% 0.24% (0.81%) (0.44%) (0.76%) Coupon income 0.02% (0.37%) 0.88% 1.67% 0.36% Net amortization of premiums, exclusive of premium amortization adjustment (0.59%) 0.18% (0.45%) (0.36%) (0.13%) Current quarter core return on average equity 10.09% 9.73% 9.91% 10.30% 9.67%
![](https://capedge.com/proxy/8-K/0001157523-16-007198/a51451959ex99_2slide11.jpg)
Unaudited, dollars in thousands Residential Investment Securities and TBA Derivative Overview as of September 30, 2016 Agency Fixed-Rate Securities (Pools) Weighted Avg. Current Weighted Avg. Weighted Avg. Weighted Avg. Weighted Avg. Estimated Years to Maturity Face Value % Coupon Amortized Cost Fair Value 3-Month CPR Fair Value <=15 years $7,588,745 13.6% 3.15% 103.8% 105.7% 12.3% $8,023,809 20 years 5,626,694 10.1% 3.50% 104.3% 106.8% 16.6% 6,007,378 >=30 years 42,497,808 76.3% 3.86% 106.2% 108.0% 14.9% 45,911,382 Total/Weighted Avg. $55,713,247 100.0% 3.73% 105.70% 107.59% 14.7% $59,942,569 TBA Purchase Contracts Weighted Avg. Implied Cost Implied Market Type Notional Value % Coupon Basis Value 15-year $1,890,000 11.8% 2.50% $1,948,871 $1,957,087 30-year 14,060,000 88.2% 3.30% 14,722,325 14,772,922 Total/Weighted Avg. $15,950,000 100.0% 3.21% $16,671,196 $16,730,009 Agency Adjustable-Rate Securities Weighted Avg. Current Weighted Avg. Weighted Avg. Weighted Avg. Weighted Avg. Estimated Months to Reset Face Value % Coupon Amortized Cost Fair Value 3-Month CPR Fair Value 0 - 24 months $4,527,844 38.5% 2.85% 103.8% 105.0% 25.6% $4,754,870 25 - 40 months 4,162,726 35.4% 2.54% 103.3% 103.3% 25.7% 4,298,752 41 - 60 months 1,535,152 13.1% 2.60% 103.1% 103.1% 18.4% 1,582,059 61 - 90 months 612,283 5.2% 2.83% 103.6% 103.8% 6.6% 635,525 >90 months 922,628 7.8% 3.03% 102.7% 103.8% 19.4% 957,421 Total/Weighted Avg. $11,760,633 100.0% 2.72% 103.4% 104.0% 23.2% $12,228,627
![](https://capedge.com/proxy/8-K/0001157523-16-007198/a51451959ex99_2slide12.jpg)
Unaudited, dollars in thousands Residential Investment Securities and TBA Derivative Overview as of September 30, 2016 (cont’d) (1) Weighted by fair value. Agency Interest-Only Collateralized Mortgage-Backed Obligations Current Notional Weighted Avg. Weighted Avg. Weighted Avg. Weighted Avg. Estimated Type Value % Coupon Amortized Cost Fair Value 3-Month CPR Fair Value Interest-Only $4,942,802 57.7% 3.28% 13.3% 10.4% 14.9% $516,195 Inverse Interest-Only 3,620,035 42.3% 5.58% 23.3% 21.8% 13.6% 788,714 Total/Weighted Avg. $8,562,837 100.0% 4.26% 17.5% 15.2% 14.4% $1,304,909 Mortgage Servicing Rights Excess Weighted Avg. Unpaid Principal Weighted Avg. Servicing Loan Age Estimated Type Balance Coupon Spread (months) Fair Value Total/Weighted Avg. $53,397,163 3.86% 0.23% 7.0 $492,169 Residential Credit Portfolio Current Face / Weighted Avg. Weighted Avg. Weighted Avg. Estimated Sector Notional Value % (1) Coupon Amortized Cost Fair Value Fair Value Credit Risk Transfer Securities $641,531 27.4% 4.73% 99.3% 104.3% $669,295 Legacy 1,075,956 38.3% 2.92% 84.4% 86.8% 934,167 NPL/RPL 347,105 14.3% 4.08% 99.9% 100.4% 348,435 New Issue 161,275 6.8% 3.56% 100.4% 103.1% 166,330 New Issue IO 935,395 0.5% 0.38% 1.8% 1.2% 11,329 Residential Mortgage Loans 301,957 12.7% 3.45% 102.7% 102.7% 310,148 Total/Weighted Avg $3,463,219 100.0% 2.77% 68.7% 70.4% $2,439,704
![](https://capedge.com/proxy/8-K/0001157523-16-007198/a51451959ex99_2slide13.jpg)
Residential Credit Investments Detail as of September 30, 2016 (1) Excludes Residential Mortgage Loans. Unaudited, dollars in thousands (1) By Sector Product Product Market Value Coupon Credit Enhancement 60+ Delinquencies 3M VPR Alt-A $160,233 4.41% 7.21% 15.07% 5.90% Prime 230,140 4.52% 1.55% 10.45% 2.50% Subprime 549,754 1.91% 23.21% 19.96% 1.85% Prime Jumbo (>=2010 Vintage) 160,370 3.50% 15.59% 0.00% 24.41% Prime Jumbo (>=2010 Vintage) Interest Only 11,329 0.39% 0.00% 0.00% 17.46% Re-Performing Loan Securitizations 80,212 3.86% 45.17% 14.37% 3.34% Agency Credit Risk Transfer 616,761 4.61% 1.02% 0.14% 18.89% Private Label Credit Risk Transfer 52,534 6.06% 7.77% 1.42% 4.00% Non-Performing Loan Securitizations 268,223 4.15% 51.52% 67.23% 1.35% Total $2,129,556 2.70% 11.85% 11.87% 11.07% Market Value By Sector and Payment Structure Product Senior Subordinate Total Alt-A $83,319 $76,914 $160,233 Prime 37,779 192,361 230,140 Subprime 189,236 360,517 549,753 Prime Jumbo (>=2010 Vintage) 149,870 10,500 160,370 Prime Jumbo (>=2010 Vintage) Interest Only 11,329 - 11,329 Re-Performing Loan Securitizations 80,212 - 80,212 Agency Credit Risk Transfer - 616,762 616,762 Private Label Credit Risk Transfer - 52,534 52,534 Non-Performing Loan Securitizations 264,735 3,488 268,223 Total $816,480 $1,313,076 $2,129,556 Market Value By Sector and Bond Coupon Product ARM Fixed Floater Interest Only Total Alt-A $18,628 $99,947 $41,658 $ - $160,233 Prime 107,269 122,871 - - 230,140 Subprime - 60,675 489,078 - 549,753 Prime Jumbo (>=2010 Vintage) - 149,870 10,500 - 160,370 Prime Jumbo (>=2010 Vintage) Interest Only - - - 11,329 11,329 Re-Performing Loan Securitizations - 80,212 - - 80,212 Agency Credit Risk Transfer - - 616,762 - 616,762 Private Label Credit Risk Transfer - - 52,534 - 52,534 Non-Performing Loan Securitizations - 268,223 - - 268,223 Total $125,897 $781,798 $1,210,532 $11,329 $2,129,556
![](https://capedge.com/proxy/8-K/0001157523-16-007198/a51451959ex99_2slide14.jpg)
Commercial Real Estate Overview as of September 30, 2016 Book values include unamortized net origination fees.Total weighted based on book value.Based on an internal valuation or the most recent third party appraisal, which may be prior to loan origination/purchase date, and on an “as is” basis at the time of underwriting.Maturity dates assume all of the borrowers' extension options are exercised.Levered Return – Debt Investments, Securitized Whole Loans at Fair Value and commercial mortgage-backed securities (“CMBS”): represents the current coupon plus fees amortized over initial loan term, less any related financing costs. Levered return – Equity Investments: is based on projected year 1 cash-on-cash returns for 2015 acquisitions.Economic interest in securitized whole loans is reflected in B Piece CMBS. Unaudited, dollars in thousands
![](https://capedge.com/proxy/8-K/0001157523-16-007198/a51451959ex99_2slide15.jpg)
Middle Market Lending Overview as of September 30, 2016 Industry Dispersion Industry Fixed Rate Floating Rate Total Airports, Flying Fields and Airport Terminal $ - $ 47,184 $ 47,184 Commercial Fishing - 40,590 40,590 Computer Programming & Data Processing - 63,253 63,253 Drugs - 34,247 34,247 Home Health Care Services - 39,339 39,339 Insurance Agents, Brokers & Services 4,380 44,344 48,724 Management & Public Relations Services - 39,116 39,116 Medical & Dental Laboratories - 17,324 17,324 Miscellaneous Business Services 84,448 63,677 148,125 Miscellaneous Health & Allied Services - 38,886 38,886 Miscellaneous Nonmetallic Minerals - 24,682 24,682 Miscellaneous Plastic Products - 27,075 27,075 Motor Vehicles, Parts & Supplies - 12,347 12,347 Offices & Clinics of Doctors of Medicine - 83,582 83,582 Research, Development & Testing Services - 17,739 17,739 Schools & Educational Services - 21,042 21,042 Surgical, Medical & Dental Instruments - 13,576 13,576 Total $ 88,828 $ 628,003 $ 716,831 Loan Size Dispersion Loan Size Amount Percentage $0 - $20 million $ 126,210 17.6% $20 - $40 million 215,270 30.0% $40 - $60 million 229,951 32.1% greater than $60 million 145,400 20.3% Total $ 716,831 100.0% Loan Tenor Dispersion Remaining Term Amount Percentage One year or less $ - 0.0% One to three years - 0.0% Three to five years 438,092 61.1% Greater than five years 278,739 38.9% Total $ 716,831 100.0% Lien Position Amount First lien loans $ 466,099 65.0% Second lien loans 161,904 22.6% Second lien notes 84,448 11.8% Subordinated notes 4,380 0.6% Total $ 716,831 100.0% Unaudited, dollars in thousands
![](https://capedge.com/proxy/8-K/0001157523-16-007198/a51451959ex99_2slide16.jpg)
Hedging and Liabilities as of September 30, 2016 Unaudited, dollars in thousands Weighted average years to maturity for futures positions are based off of the Treasury contracts cheapest to deliver.Approximately 16% of the total repurchase agreements and FHLB advances have a remaining maturity over one year. The combined weighted average days to maturity for repurchase agreements and FHLB advances was 206 days.Represents the quarterly average rate.Determined based on estimated weighted-average lives of the underlying debt instruments. Interest Rate Swaps Current Weighted Avg. Weighted Avg. Weighted Avg. Maturity Notional Pay Rate Receive Rate Years to Maturity 0 to <3 years $4,552,383 1.74% 0.76% 2.77 >=3 to <6 years 9,675,000 1.92% 0.88% 4.14 >= 6 to <10 years 7,363,550 2.34% 0.98% 7.81 Greater than 10 years 3,634,400 3.70% 0.67% 18.62 Total / Weighted Avg. $25,225,333 2.25% 0.88% 6.89 Futures Positions Notional Notional Long Short Weighted Avg. Type Positions Positions Years to Maturity(1) 2-year Swap Equivalent Eurodollar Contracts - (14,991,375) 2.00 U.S. Treasury Futures - 5 year - (1,247,200) 4.42 Total - ($16,238,575) 2.19 Interest Rate Swaptions Current Weighted-Avg. Weighted-Avg. Weighted Avg. Weighted Avg. Underlying Underlying Underlying Underlying Months to Type Notional Pay Rate Receive Rate Years to Maturity Expiration Long $950,000 1.08% 3M LIBOR 2.24 2.77 Short ($200,000) 3M LIBOR 1.54% 10.25 2.77 Repurchase Agreements & FHLB Advances Principal Weighted Avg. Maturity Balance Rate Within 30 days $26,508,338 0.99% 30 to 59 days 5,200,350 0.86% 60 to 89 days 6,173,598 0.85% 90 to 119 days 5,309,103 0.79% Over 120 days(2) 22,181,058 1.27% Total / Weighted Avg. $65,372,447 1.04% Principal Weighted Average Balance Rate (3) Days to Maturity(4) Repurchase agreements $61,784,121 0.97% 128 Other secured financing 3,804,742 0.83% 1,560 Securitized debt of consolidated VIEs 3,695,502 1.29% 2,434 Participation sold 12,908 4.81% 213 Mortgages payable 330,946 4.42% 2,881 Total indebtedness $69,628,219
![](https://capedge.com/proxy/8-K/0001157523-16-007198/a51451959ex99_2slide17.jpg)
Unaudited Quarter-Over-Quarter Interest Rate and MBS Spread Sensitivity Scenarios include Residential Investment Securities and derivative instruments.Net asset value (“NAV”) represents book value of common equity. Assumptions:The interest rate sensitivity and spread sensitivity are based on the portfolios as of September 30, 2016 and June 30, 2016. The interest rate sensitivity reflects instantaneous parallel shifts in rates.The spread sensitivity shifts mortgage-backed securities spreads instantaneously and reflects exposure to mortgage-backed securities basis risk.All tables assume no active management of the portfolio in response to rate or spread changes. Interest Rate Sensitivity As of September 30, 2016 As of June 30, 2016 Interest Rate Change (bps) Estimated Percentage Change in Portfolio Value(1) Estimated Change as a % of NAV(1)(2) Estimated Percentage Change in Portfolio Value(1) Estimated Change as a % of NAV(1)(2) (75) 0.5% 3.1% 0.3% 1.8% (50) 0.4% 2.3% 0.3% 1.7% (25) 0.2% 1.3% 0.2% 1.0% 25 (0.3%) (1.7%) (0.2%) (1.3%) 50 (0.6%) (3.8%) (0.5%) (3.2%) 75 (1.1%) (6.6%) (0.9%) (5.6%) MBS Spread Sensitivity As of September 30, 2016 As of June 30, 2016 MBS Spread Shock (bps) Estimated Change in Portfolio Market Value Estimated Change as a % of NAV(1)(2) Estimated Change in Portfolio Market Value Estimated Change as a % of NAV(1)(2) (25) 1.3% 8.2% 1.3% 7.8% (15) 0.8% 4.9% 0.8% 4.7% (5) 0.3% 1.6% 0.3% 1.6% 5 (0.3%) (1.6%) (0.3%) (1.5%) 15 (0.8%) (4.8%) (0.8%) (4.6%) 25 (1.3%) (8.0%) (1.3%) (7.7%)
![](https://capedge.com/proxy/8-K/0001157523-16-007198/a51451959ex99_2slide18.jpg)
Appendix
![](https://capedge.com/proxy/8-K/0001157523-16-007198/a51451959ex99_2slide19.jpg)
Endnotes for Page 2 Core earnings is defined as net income (loss) excluding gains or losses on disposals of investments and termination of interest rate swaps, unrealized gains or losses on interest rate swaps and investments measured at fair value through earnings, net gains and losses on trading assets, impairment losses, net income (loss) attributable to noncontrolling interest, the premium amortization adjustment resulting from the quarter-over-quarter change in estimated long-term CPR, corporate acquisition related expenses and certain other non-recurring gains or losses, and inclusive of dollar roll income (a component of Net gains (losses) on trading assets) and realized amortization of MSRs (a component of Net unrealized gains (losses) on investments measured at fair value through earnings).For purposes of calculating the Company’s leverage ratio, debt consists of repurchase agreements, other secured financing, Convertible Senior Notes, securitized debt, participation sold and mortgages payable. Securitized debt, participation sold and mortgages payable are non-recourse to the Company.Computed as the sum of recourse debt, TBA derivative notional outstanding and net forward purchases of investments divided by total equity. Recourse debt consists of repurchase agreements, other secured financing and Convertible Senior Notes. The ratio of total equity to total assets (inclusive of total market value of TBA derivatives and exclusive of consolidated VIEs associated with B Piece commercial mortgage-backed securities).Comprised of non-Agency mortgage-backed securities, credit risk transfer securities and residential mortgage loans.Includes consolidated VIEs and loans held for sale.Represents the sum of the Company’s annualized economic core net interest income (inclusive of interest expense on interest rate swaps used to hedge cost of funds) plus TBA dollar roll income (less interest expense on swaps used to hedge dollar roll transactions) divided by the sum of its average interest-earning assets plus average outstanding TBA derivative balances.Represents annualized core interest income divided by average interest earning assets. Interest earning assets reflects the average amortized cost of our investments during the period. Excludes transaction costs incurred in connection with the Company’s acquisition of Hatteras Financial Corp.Represents general and administrative expenses divided by core earnings before general and administrative expenses.
![](https://capedge.com/proxy/8-K/0001157523-16-007198/a51451959ex99_2slide20.jpg)
Non-GAAP Reconciliations To supplement its consolidated financial statements, which are prepared and presented in accordance with U.S. generally accepted accounting principles (“GAAP”), the Company provides non-GAAP financial measures. These measures should not be considered a substitute for, or superior to, financial measures computed in accordance with GAAP. These non-GAAP measures provide additional detail to enhance investor understanding of the Company’s period-over-period operating performance and business trends, as well as for assessing the Company’s performance versus that of industry peers.Reconciliations of these non-GAAP financial measures to their most directly comparable GAAP results are provided above. A reconciliation of GAAP net income (loss) to non-GAAP core earnings for the quarters ended September 30, 2016, June 30, 2016, March 31, 3016, December 31, 2015 and September 30, 2015, is provided on page 7 of this financial summary. Unaudited, dollars in thousands except per share amounts For the quarters ended September 30, June 30, March 31, December 31, September 30, 2016 2016 2016 2015 2015 Premium Amortization Reconciliation Premium amortization expense $213,241 $265,475 $355,671 $159,720 $255,123 Less: Premium amortization adjustment cost (benefit) 3,891 85,583 168,408 (18,072) 83,136 Premium amortization expense exclusive of premium amortization adjustment $209,350 $179,892 $187,263 $177,792 $171,987 Core Interest Income Reconciliation Total interest income $558,668 $457,118 $388,143 $576,580 $450,726 Premium amortization adjustment cost (benefit) 3,891 85,583 168,408 (18,072) 83,136 Core interest income $562,559 $542,701 $556,551 $558,508 $533,862 Economic Interest Expense Reconciliation GAAP interest expense $174,154 $152,755 $147,447 $118,807 $110,297 Add: Interest expense on interest rate swaps used to hedge cost of funds 103,100 108,301 123,124 135,267 137,744 Economic interest expense $277,254 $261,056 $270,571 $254,074 $248,041 Economic Core Net Interest Income Reconciliation Core interest income $562,559 $542,701 $556,551 $558,508 $533,862 Less: Economic interest expense 277,254 261,056 270,571 254,074 248,041 Economic core net interest income $285,305 $281,645 $285,980 $304,434 $285,821 Economic Core Metrics Core interest income $562,559 $542,701 $556,551 $558,508 $533,862 Average interest earning assets $82,695,270 $73,587,753 $74,171,943 $73,178,965 $72,633,314 Core average yield on interest earning assets 2.72% 2.95% 3.00% 3.05% 2.94% Economic interest expense $277,254 $261,056 $270,571 $254,074 $248,041 Average interest bearing liabilities $70,809,712 $62,049,474 $62,379,695 $60,516,996 $59,984,298 Average cost of interest bearing liabilities 1.57% 1.68% 1.73% 1.68% 1.65% Core net interest spread 1.15% 1.27% 1.27% 1.37% 1.29% Core net interest margin 1.42% 1.54% 1.54% 1.71% 1.65%