Exhibit 99.1
![](https://capedge.com/proxy/8-K/0001157523-16-007202/a51451968ex99_1slide1.jpg)
Third Quarter 2016 Investor PresentationNovember 2, 2016
![](https://capedge.com/proxy/8-K/0001157523-16-007202/a51451968ex99_1slide2.jpg)
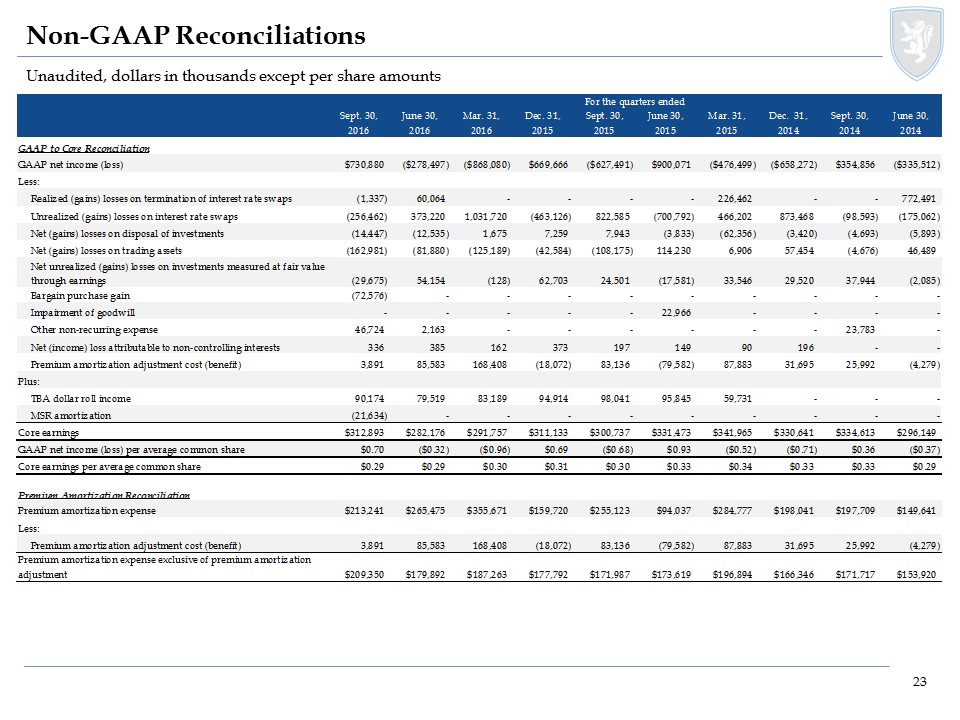
This presentation, other written or oral communications and our public documents to which we refer contain or incorporate by reference certain forward-looking statements which are based on various assumptions (some of which are beyond our control) and may be identified by reference to a future period or periods or by the use of forward-looking terminology, such as "may," "will," "believe," "expect," "anticipate," "continue," or similar terms or variations on those terms or the negative of those terms. Actual results could differ materially from those set forth in forward-looking statements due to a variety of factors, including, but not limited to, changes in interest rates; changes in the yield curve; changes in prepayment rates; the availability of mortgage-backed securities and other securities for purchase; the availability of financing and, if available, the terms of any financings; changes in the market value of our assets; changes in business conditions and the general economy; our ability to grow our commercial business; our ability to grow our residential mortgage credit business; credit risks related to our investments in credit risk transfer securities, residential mortgage-backed securities and related residential mortgage credit assets, commercial real estate assets and corporate debt; risks related to investments in mortgage servicing rights and ownership of a servicer; any potential business disruption following the acquisition of Hatteras Financial Corp.; our ability to consummate any contemplated investment opportunities; changes in government regulations affecting our business; our ability to maintain our qualification as a REIT; and our ability to maintain our exemption from registration under the Investment Company Act of 1940, as amended. For a discussion of the risks and uncertainties which could cause actual results to differ from those contained in the forward-looking statements, see "Risk Factors" in our most recent Annual Report on Form 10-K and any subsequent Quarterly Reports on Form 10-Q. We do not undertake, and specifically disclaim any obligation, to publicly release the result of any revisions which may be made to any forward-looking statements to reflect the occurrence of anticipated or unanticipated events or circumstances after the date of such statements, except as required by law.Non-GAAP Financial MeasuresThis presentation includes certain non-GAAP financial measures. The non-GAAP financial measures should not be viewed in isolation and are not a substitute for financial measures computed in accordance with GAAP. Please see the section entitled “Non-GAAP Reconciliations” in the attached Appendix for a reconciliation to the most directly comparable GAAP financial measures. Safe Harbor Notice
![](https://capedge.com/proxy/8-K/0001157523-16-007202/a51451968ex99_1slide3.jpg)
Overview
![](https://capedge.com/proxy/8-K/0001157523-16-007202/a51451968ex99_1slide4.jpg)
Source: Bloomberg and company filings. Market data as of September 30, 2016. Quarterly peer financial data as of September 30, 2016, unless otherwise noted. All peer comparisons represent NLY vs. the Bloomberg mREIT Index (BBREMTG) unless otherwise noted.Agency peers include AGNC, CMO, ANH, CYS and ARR.Represents average expense levels from 2012 through first half of 2016 annualized as a percentage of average equity. Represents weekly total return of Annaly against the BBREMTG Index and the S&P 500 from IPO (October 10, 1997) through September 30, 2016. ~15x Size of Median mREIT Size and Liquidity Consolidator Recent Hatteras Acquisition Demonstrates External Growth and Ability to be Opportunistic Diversification Strategy Four Distinct Businesses Designed to Produce More Stable Earnings and Book Value Relative Performance / Valuation Valuation More Attractive than Other Yield Sectors Given Favorable Performance, Yield and Leverage Profile Stability & Liquidity Management / Employee Stock Ownership Financial Performance Significantly Less Volatile than the Agency mREIT Sector(1) Significant Management Share Purchases; Unique Employee Stock Ownership Guidelines Operating Efficiency Track Record Expense Level as a Percentage of Equity is 52% Lower than the mREIT Sector Average(2) Outperformed S&P 500 by 3x and mREIT Sector by Nearly 5x since Annaly’s IPO(3) Premium Yield with Downside Protection Durability of Book Value Supported by Diversification, Asset and Hedge Selection The Case for Owning Annaly Expense Levels as a Percentage of Equity and Assets are 51% and 66% Lower than mREIT Sector Average (2) Financial data shown as of June 30, 2016; sector averages reflect 1H 2016 annualized data market weighted within each sector. Includes members of the BBREMTG Index with market capitalization above $200mm. Excludes NLY. Includes publicly traded BDCs with total market capitalization greater than $500 million.Annaly actual expense ratios reflect annualized 1H 2016 expense figures over 1H 2016 average equity. Prominent Institutional Sponsorship Investor Base Includes Leading Equity and Bond Fund Managers
![](https://capedge.com/proxy/8-K/0001157523-16-007202/a51451968ex99_1slide5.jpg)
Benefits of Diversification Expansion of Annaly’s capital into credit as well as diversification within the Agency portfolio has helped to produce more stable returns and protect book value Book Value Protection Stability of Core Earnings(1) Annaly’s current interest rate sensitivity has been significantly reduced through its diversification efforts Annaly’s core earnings per share have been between $0.29 and $0.34 in each of the last 10 quarters, which is 81% more stable than its Agency peers (5) “Core earnings” represents a non-GAAP financial measure; see Appendix. Illustrative Agency Portfolio assumes an 8.0x levered portfolio with a composition similar to NLY’s 12/31/12 portfolio, utilizing NLY’s current prepayment model. Represents the number of quarterly dividends required to earn back the book value loss from 9/30/16 (NLY dividend assumed as $0.30, which is current Bloomberg consensus estimate for Q4 2016). Over the past 15 quarters (since Q4 2012), the percentage shown reflects the frequency with which the rate scenario materialized from beginning to end of quarter. Methodologies or definitions of core earnings and other non-GAAP earnings measures vary by Agency peers (AGNC, CMO, ANH, CYS, ARR). AGNC refers to net spread and dollar roll income excluding estimated “catch-up” premium amortization cost. CYS and ARR refer to core income plus drop income. CMO and ANH refer to core earnings. Volatility based on core earnings and other adjusted earnings measures from Q2 2014 to Q3 2016 for NLY, AGNC, CYS, and CMO and Q2 2014 to Q2 2016 for ANH and ARR. Basis Point Change +50 +25 -25 -50 Breakeven Quarters (3) < 2 < 1 N/A N/A Scenario Probability Last 15 Qtrs (4) 13% 20% 33% 0% (2)
![](https://capedge.com/proxy/8-K/0001157523-16-007202/a51451968ex99_1slide6.jpg)
Stability of Annaly’s Core Earnings(1) vs. Other Yield Investments Despite heightened market volatility, Annaly has continued to offer stable core earnings over the past 2 years, particularly when compared to other yield strategies Source: Bloomberg, Company filings, SNL Financial. Agency mREITs include AGNC, ARR, ANH, CMO and CYS. Hybrid and Commercial mREITs include 5 largest companies in each sector by market cap as of September 30, 2016. Utilities represent the Russell 3000 Utilities Index. MLPs represent the Alerian MLP Index. Banks represent the KBW Bank Index. Financials represent the S&P 500 Financial Index. Equity REITs represent the FTSE NAREIT Index. “Core Earnings” represents a non-GAAP financial measure; see Appendix.Variability calculated as the percentage range between the highest and lowest quarterly “Adjusted Earnings” figures for each company from Q3 2014 to Q2 2016. Annaly and all mREITs utilize “Core” or similarly adjusted EPS; Banks and Financials utilize adjusted net income; and Equity REITs, Utilities and MLPs utilize EBITDA. 2-Year Variability of Adjusted Earnings(1)(2)
![](https://capedge.com/proxy/8-K/0001157523-16-007202/a51451968ex99_1slide7.jpg)
Annaly’s liability profile and large capital base provide the Companywith a unique competitive advantage Annaly’s Strong Balance Sheet and Liquidity Note: Financial data is as of September 30, 2016.mREITs represent the Bloomberg mREIT Index.Publicly traded REITs defined as all REITs within the Bloomberg United States REIT list. Calculation as of September 30, 2016. At 128 days, represents one of the longest weighted average maturities in the mREIT sector(1)RCap, in place since 2008, provides beneficial access to FICC marketStrong counterparty credit quality and significant capacity available Initial 5 year sunset (ending February 2021) for FHLB financing provides significant competitive advantageCurrent weighted average maturity of over 4 yearsAllows for financing of credit assets at levels not achievable by most other REITs without access to FHLB funding Currently $650 million of total credit facility size with incremental capacity availableAsset diversification provides more opportunities for lending relationships Largest preferred capital base in the mREIT sector and larger than 97% of all publicly traded REITs (2)mREIT sector-low(1) weighted average coupon of 7.62% Largest capital base in the mREIT sector and larger than 99% of all publicly traded REITs (2)Provides liquidity to investors and for future market opportunities not available to many other industry participants Common Equity$12.1bn Preferred Equity$1.2bn Commercial Facilities$0.5bn FHLB$3.6bn Agency & Non-Agency Repo$61.5bn Total Capitalization of $78+ bn In addition to Annaly’s multiple funding sources, approximately $8 billion in unencumbered assets provide the Company with significant liquidity
![](https://capedge.com/proxy/8-K/0001157523-16-007202/a51451968ex99_1slide8.jpg)
Annaly’s Diversified Financing Sources Source: Bloomberg, SNL Financial, and Company filings as of September 30, 2016 or most recent quarter available. Includes top 5 Mortgage REITs in each sector by market cap as of September 30, 2016, excluding Annaly.Note: Full Harvey Ball credit given to Annaly for each financing alternative that it currently utilizes or has previously utilized. Full Harvey Ball credit given to FHLB with initial 5-year sunset ending February 2021. No Harvey Ball credit given to FHLB with 1-year sunset ending February 2017. Annaly continues to maintain one of the most diverse funding profiles in the real estate finance sector Top 5 mREITs of each sector by market cap Agency Hybrid Commercial 4-5 mREITs 3 mREITs 2 mREITs 1 mREIT 0 mREITs No. of Top 5 mREITs in each sector that have utilized specified financing:
![](https://capedge.com/proxy/8-K/0001157523-16-007202/a51451968ex99_1slide9.jpg)
From 2012 through annualized 1H 2016, Annaly significantly outperformed its mREIT peers with respect to operating expenditures as a percentage of assets and as a percentage of equity Annaly’s average expense levels over the period were 67% lower as a percentage of average assets and 52% lower as a percentage of average equityAnnaly expense levels averaged 0.23% as a percentage of assets and 1.60% as a percentage of equity, while mREIT peers averaged 0.71% and 3.30%, respectively Efficiency of Operating Model Source: Company Filings, SNL and Bloomberg. Averages are market weighted based on market capitalization as of December 31 of each respective year, except 2016E which is as of September 30, 2016.Note: Internal Management and External Management represent the respective internally- and externally-managed members of the BBREMTG Index with market capitalization above $200mm as of the corresponding year end. Excludes Annaly and companies during years in which they became public or first listed. Operating Expense is defined as: (i) for Internally-Managed Peers, the sum of compensation & benefits, general & administrative expenses and other operating expenses, and (ii) for Externally-Managed Peers, the sum of net management fees, compensation & benefits (if any), general & administrative expenses and other operating expenses.2016E represents annualized operating expenses as of June 30, 2016. Average Assets and Average Equity are as of June 30, 2016. Annaly’s diversified platform operates more efficiently than the averageinternally and externally managed mREIT
![](https://capedge.com/proxy/8-K/0001157523-16-007202/a51451968ex99_1slide10.jpg)
Annaly’s Performance vs. Other Yield Investments Source: Bloomberg. mREITs represent the Bloomberg mREIT Index. Utilities represent the Russell 3000 Utilities Index. MLPs represent the Alerian MLP Index. Asset Managers represent the S&P 500 Asset Management and Custody Bank Index. Banks represent the KBW Bank Index. Note: Market data from December 31, 2013 to September 30, 2016. Annaly’s current investment team has outperformed all other yield options since 2014 N:\Capital Markets\Marketing\Internal\OpCo Offsite\June 2016\Excel\VIX and Yield Sectors vs NLY TR (AM Index) Since 2014.xlsx 43.9% 33.9% 28.4% (18.1%) 8.4% (0.7%) 24.3%
![](https://capedge.com/proxy/8-K/0001157523-16-007202/a51451968ex99_1slide11.jpg)
Market Positioning
![](https://capedge.com/proxy/8-K/0001157523-16-007202/a51451968ex99_1slide12.jpg)
Post-Crisis Regulation Has Had a Meaningful Impact on Banks… Source: FDIC. Capital Liquidity Resolution Supplementary Leverage Ratio (SLR) Common Equity Tier 1 (CET1) Liquidity Coverage Ratio (LCR) Net Stable Funding Ratio (NSFR) Total Loss Absorbing Capacity (TLAC) Current regulatory climate has forced fundamental changes to banks’ business modelsAsset management, advisory, electronic trading, payments and clearing business are more attractiveNon-agency MBS, credit products, mortgage servicing and prime brokerage are less desirable businessesRegulations force banks to remain ultra liquid; real estate loans have been sacrificed in order to hold more cash and securities Regulation Key Takeaways This secular trend has created a need for dedicated permanent capital to fill the void US Bank Assets by Category
![](https://capedge.com/proxy/8-K/0001157523-16-007202/a51451968ex99_1slide13.jpg)
…And Annaly is Well Positioned for the New Regulatory Environment Risk retention, bank capital standards and the maturity wall all pose challenges to the current CMBS landscape Notably, risk retention rules requiring CMBS sponsors to retain 5% of a securitization for five years takes effect at the end of the yearThis regulatory environment is in effect driving origination efforts away from traditional CMBS lenders Sources: Federal Reserve Bank of New York, Fannie Mae, Freddie Mac, Nomura. Sources: S&P Capital IQ Leveraged Commentary (S&P LCD). As of June 30, 2016. Residential Credit Market Share of MML Landscape(2) Private Label CMBS Cumulative Issuance ($bn) FNMA Mortgage Portfolio Balance and Portfolio Cap ($bn)(1) GSEs continue to shrink their portfolios by mandateGiven punitive capital charges, banks have bought merely 3% of the almost $20 billion shed by Fannie Mae in the form of risk sharing transactions since 2013REITs as private capital vehicles have capitalized on these transactions Commercial Real Estate Middle Market Lending Regulatory focus on the underwriting of leveraged loans has led to the migration of market share away from traditional banks and toward specialty lenders with expertise in the asset classSpecifically, Basel III and Dodd-Frank have opened the doors for institutional investors by making it difficult for banks to invest in the middle market
![](https://capedge.com/proxy/8-K/0001157523-16-007202/a51451968ex99_1slide14.jpg)
Annaly’s Diversification Strategy Now Has Scale and Impact Source: Bloomberg mREIT Index (BBREMTG Index). Data as of September 30, 2016. Excludes targets of announced acquisitions. Market cap rank represents rank among respective sector.Note: For purposes of bar graph, light blue bars denote Annaly, dark blue bars denote agency peers, yellow bars denote hybrid peers, green bars denote commercial peers and red bars denotes MML peers. Blue ovals indicate sector ranking, which compares Annaly’s dedicated equity capital in each of its business strategies (Agency, CRE, Residential Credit and MML) as of September 30, 2016, adjusted for the relevant sector average price to book multiple to the market capitalization of the companies in each respective sector as of September 30, 2016. Comparative sectors include the BBREMTG Index for Agency, ACREG and Residential Credit and the S&P BDC Index for MML. As Annaly has continued its diversification effort across asset classes, the credit-focused business lines are now of meaningful size in their respective industries #1 #8 #4 Current mREIT Total Market Cap: $53.7bnNLY as % of Total Market Cap: 19.9% Annaly Business Market Cap Sector Rank Dedicated Equity Capital AMML 17 $0.5bn Annaly MML now larger than 24 publicly traded BDCs #17 Market Cap Range # of Companies Market Cap % of Total Greater than $4bn 3 41.9% $2 - $4bn 6 31.7% $1 - $2bn 5 12.1% <$1bn 19 14.3%
![](https://capedge.com/proxy/8-K/0001157523-16-007202/a51451968ex99_1slide15.jpg)
Annaly is positioned as a permanent capital solution for the redistribution of MBS, residential credit, commercial real estate assets and institutional loans Sum of the Parts Capital Diversification Agency Residential Credit Commercial Real Estate Middle Market Lending $ Amount / % of Total Capital(1) $10.6bn / 78% $1.4bn / 10%(2) $1.0bn / 8% $0.5bn / 4% Assets Spec PoolsARMsMSR 1st MortgagesMezzanine/Pref. EquityCRE EquityCMBS CRTNPL/RPLLegacyWhole Loans First LienSecond Lien Hedges SwapsEuro Dollar FuturesTreasuriesIO / MSR - - - Financing RepoRCap SecuritiesFHLB SecuritizationCredit Facilities1st MortgagesNote SalesFHLB RepoFHLB Credit Facilities Liquidity Very Liquid Low to Moderate Liquid Moderate Income Stability Fluctuates Fairly Stable Fluctuates Fairly Stable Book Value Impact Higher Low to Moderate Higher Low Levered Return 9-10% 9-10% 10-11% 10-11% Note: Financial data is as of September 30, 2016. Financial data is unaudited.Dedicated capital excludes non-portfolio related activity and varies from total stockholders’ equity.Includes loans held for sale.
![](https://capedge.com/proxy/8-K/0001157523-16-007202/a51451968ex99_1slide16.jpg)
Q3 2016 Business Update
![](https://capedge.com/proxy/8-K/0001157523-16-007202/a51451968ex99_1slide17.jpg)
Macro Economic & Interest Rate Market Outlook Yields are rising off lows amid changing perceptions around fiscal stimulus/ Central Bank policy Source: Bloomberg, JP Morgan, Damodaran Online Blog, Annaly Capital Calculations.Estimate of S&P 500 members’ weighted average cost of capital: Risk-free rate = U.S. 10-year, Credit Spread = JP Morgan JULI A Index Portfolio Spread over Treasuries, ERP as estimated by Aswath Damodaran of NYU Stern, Areas represent their contribution to the aggregate WACC using 33% debt financing assumption. Low growth has led to an increased focus on implementing structural reforms given apparent limits to monetary policy accommodationAfter reaching long-term lows, yields have risen and yield curves have steepened amid a convergence of factors including: fiscal stimulus talk, rising inflation expectations, monetary policy addressing yield curve slope, declining neutral policy rates, shifting investor positioning Company Financing Costs Are Little Changed in Recent Years Despite QE Curves and Inflation Breakevens Have Trended Wider Since Early July
![](https://capedge.com/proxy/8-K/0001157523-16-007202/a51451968ex99_1slide18.jpg)
Pass Through Coupon Type Agency MBS Portfolio Note: Data as of September 30, 2016. Percentages based on fair market value and may not sum to 100% due to rounding.Asset type is inclusive of TBA contracts.“High Quality Spec” protection is defined as pools backed by original loan balances of up to $150K, higher LTV pools (CR/CQ), geographic concentrations (NY/PR). “Other Specified Pools” includes $175K loan balance, high LTV pools, FICO < 700. “30+ WALA” is defined as weighted average loan age greater than 30 years. As of Q3 2016, the market value of the Agency portfolio was approximately $91 billion in assets, inclusive of the TBA positionApproximately 94% of the Agency portfolio is positioned in securities with prepayment protectionAgency MBS performed well in Q3 given declining interest rate volatility and strong demand amid the global search for yieldStrategy has continued to focus on rotation into Agency MBS with durable and stable cash flows Asset Type(1) Call Protection(2) Total Dedicated Capital: $10.6bn
![](https://capedge.com/proxy/8-K/0001157523-16-007202/a51451968ex99_1slide19.jpg)
Residential Credit Portfolio As of Q3 2016, the portfolio grew to $2.4 billion in assets and is comprised of the following sectors:Credit Risk Transfer (CRT): Expect liquidity to continue to improve as more investors enter the sector; CRT is now the most efficient way to express long credit views on residential creditJumbo “AAA” Securities: Scarcity of “AAA” residential credit product and muted prepayments have caused the sector to trade at the tightest levels since 2013NPL/RPL Securities: Unrated senior yields have tightened to 3.50% from increased institutional demandLegacy: Market continues to be supported by long term positive technicals and continued strong fundamental performanceWhole Loans: Opportunities exist in new origination whole loans driven by FHLB funding Sector Type Coupon Type Effective Duration Total Dedicated Capital: $1.0bn Note: Data as of September 30, 2016. Percentages based on fair market value and may not sum to 100% due to rounding. Whole loan composition includes loans in a securitization entity required to be consolidated under US GAAP.
![](https://capedge.com/proxy/8-K/0001157523-16-007202/a51451968ex99_1slide20.jpg)
Commercial Real Estate Portfolio Note: Data as of September 30, 2016. Percentages based on economic interest and may not sum to 100% due to rounding.Commercial Real Estate assets are exclusive of consolidated variable interest entities (“VIEs”) associated with B Piece commercial mortgage-backed securities.Other includes 24 states, none of which represent more than 5% of total portfolio value. As of Q3 2016, the commercial real estate portfolio was approximately $2.4 billion in assets(1)The combination of a significant decline in new acquisition activity by sponsors, a volatile marketplace and a cautious stance on credit has resulted in a decrease in new originations in 2016$365 million of new originations/purchases in 2016Increased financing capacity under the existing credit facility to $350 million in Q2$295 million funded under the facility at the end of Q3 2016 Active pipeline with quality opportunities, but will remain disciplined Portfolio will only grow with the right risk-adjusted opportunities1.9 billion Asset Type Sector Type Geographic Concentration(2) Total Dedicated Capital: $1.4bn
![](https://capedge.com/proxy/8-K/0001157523-16-007202/a51451968ex99_1slide21.jpg)
Middle Market Lending Portfolio Lien Position Industry(1) Loan Size(2) As of Q3 2016, the middle market lending portfolio grew to over $700 million in assetsA combination of repeat sponsor business, sectors of origination focus and larger ownership positions resulted in increased new deal origination during Q3 2016Unlevered portfolio yield of 7.7% at the end of Q3 2016Closed $300 million credit facility in Q2 2016 $212 million funded under the facility at the end of Q3 2016 Total Dedicated Capital: $0.5bn Note: Data as of September 30, 2016 unless otherwise noted. Percentages based on principal outstanding and may not sum to 100% due to rounding.Based on Moody’s industry categories.Breakdown based on aggregate $ amount of individual investments made within the respective loan size buckets. Multiple investment positions with a single obligor shown as one individual investment. [ TBU ]
![](https://capedge.com/proxy/8-K/0001157523-16-007202/a51451968ex99_1slide22.jpg)
Performance Highlights and Trends Unaudited, dollars in thousands except per share amounts *Represents a non-GAAP financial measure; see Appendix.Core earnings is defined as net income (loss) excluding gains or losses on disposals of investments and termination of interest rate swaps, unrealized gains or losses on interest rate swaps and investments measured at fair value through earnings, net gains and losses on trading assets, impairment losses, net income (loss) attributable to noncontrolling interest, the premium amortization adjustment resulting from the quarter-over-quarter change in estimated long-term CPR, corporate acquisition related expenses and certain other non-recurring gains or losses, and inclusive of dollar roll income (a component of Net gains (losses) on trading assets) and realized amortization of MSRs (a component of Net unrealized gains (losses) on investments measured at fair value through earnings).Includes non-Agency securities and credit risk transfer securities and residential mortgage loans.Includes consolidated VIEs and loans held for sale.Includes repurchase agreements, other secured financing, securitized debt of consolidated VIEs, participation sold and mortgages payable.Computed as the sum of recourse debt, TBA derivative notional outstanding and net forward purchases of investments divided by total equity. Recourse debt consists of repurchase agreements, other secured financing and Convertible Senior Notes. Securitized debt, participation sold and mortgages payable are non-recourse to the Company and are excluded from this measure.Represents credit risk transfer securities, non-Agency mortgage-backed securities, residential mortgage loans, commercial real estate debt investments and preferred equity investments, loans held for sale, investments in commercial real estate and corporate debt, net of financing.
![](https://capedge.com/proxy/8-K/0001157523-16-007202/a51451968ex99_1slide23.jpg)
Appendix: Non-GAAP Reconciliation
![](https://capedge.com/proxy/8-K/0001157523-16-007202/a51451968ex99_1slide24.jpg)
Non-GAAP Reconciliations Unaudited, dollars in thousands except per share amounts
![](https://capedge.com/proxy/8-K/0001157523-16-007202/a51451968ex99_1slide25.jpg)
Non-GAAP Reconciliations (Cont’d) Unaudited, dollars in thousands except per share amounts