Exhibit 99.1

Fourth Quarter 2016 Investor PresentationFebruary 15, 2017
This presentation, other written or oral communications and our public documents to which we refer contain or incorporate by reference certain forward-looking statements which are based on various assumptions (some of which are beyond our control) and may be identified by reference to a future period or periods or by the use of forward-looking terminology, such as "may," "will," "believe," "expect," "anticipate," "continue," or similar terms or variations on those terms or the negative of those terms. Actual results could differ materially from those set forth in forward-looking statements due to a variety of factors, including, but not limited to, changes in interest rates; changes in the yield curve; changes in prepayment rates; the availability of mortgage-backed securities and other securities for purchase; the availability of financing and, if available, the terms of any financings; changes in the market value of our assets; changes in business conditions and the general economy; our ability to grow our commercial business; our ability to grow our residential mortgage credit business; credit risks related to our investments in credit risk transfer securities, residential mortgage-backed securities and related residential mortgage credit assets, commercial real estate assets and corporate debt; risks related to investments in mortgage servicing rights and ownership of a servicer; our ability to consummate any contemplated investment opportunities; changes in government regulations affecting our business; our ability to maintain our qualification as a REIT; and our ability to maintain our exemption from registration under the Investment Company Act of 1940, as amended. For a discussion of the risks and uncertainties which could cause actual results to differ from those contained in the forward-looking statements, see "Risk Factors" in our most recent Annual Report on Form 10-K and any subsequent Quarterly Reports on Form 10-Q. We do not undertake, and specifically disclaim any obligation, to publicly release the result of any revisions which may be made to any forward-looking statements to reflect the occurrence of anticipated or unanticipated events or circumstances after the date of such statements, except as required by law.Non-GAAP Financial MeasuresThis presentation includes certain non-GAAP financial measures. Based upon recent regulatory guidance and interpretations on the use of non-GAAP financial measures, beginning with the fourth quarter 2016, the Company will report core earnings metrics (revised) that include the PAA. In addition, this is the final quarter that the Company will report core earnings metrics (unrevised) that exclude the PAA. In future periods, the Company will not make an adjustment to GAAP net income (loss) to exclude the PAA. However, given its usefulness in evaluating the Company’s financial performance, the Company will continue to separately disclose the PAA. Additionally, comparative prior period results reported in future periods will conform to the revised presentation. The Company believes its non-GAAP financial measures are useful for management, investors, analysts, and other interested parties in evaluating the Company’s performance but should not be viewed in isolation and are not a substitute for financial measurements computed in accordance with GAAP. Please see the section entitled “Non-GAAP Reconciliations” in the attached Appendix for a reconciliation to the most directly comparable GAAP financial measures. Safe Harbor Notice

Overview
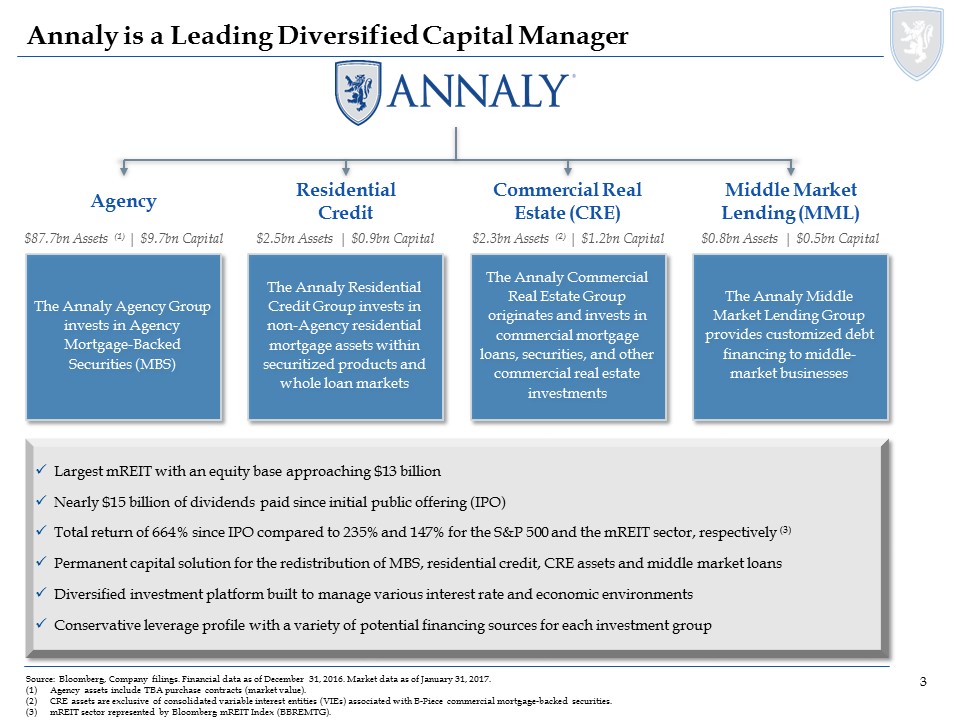
Source: Bloomberg, Company filings. Financial data as of December 31, 2016. Market data as of January 31, 2017.Agency assets include TBA purchase contracts (market value).CRE assets are exclusive of consolidated variable interest entities (VIEs) associated with B-Piece commercial mortgage-backed securities.mREIT sector represented by Bloomberg mREIT Index (BBREMTG). Annaly is a Leading Diversified Capital Manager Annaly Capital Management Agency The Annaly Agency Group invests in Agency Mortgage-Backed Securities (MBS) Residential Credit The Annaly Residential Credit Group invests in non-Agency residential mortgage assets within securitized products and whole loan markets Commercial Real Estate (CRE) The Annaly Commercial Real Estate Group originates and invests in commercial mortgage loans, securities, and other commercial real estate investments Middle Market Lending (MML) The Annaly Middle Market Lending Group provides customized debt financing to middle-market businesses Largest mREIT with an equity base approaching $13 billion Nearly $15 billion of dividends paid since initial public offering (IPO)Total return of 664% since IPO compared to 235% and 147% for the S&P 500 and the mREIT sector, respectively (3)Permanent capital solution for the redistribution of MBS, residential credit, CRE assets and middle market loansDiversified investment platform built to manage various interest rate and economic environmentsConservative leverage profile with a variety of potential financing sources for each investment group $87.7bn Assets (1) | $9.7bn Capital $2.5bn Assets | $0.9bn Capital $2.3bn Assets (2) | $1.2bn Capital $0.8bn Assets | $0.5bn Capital
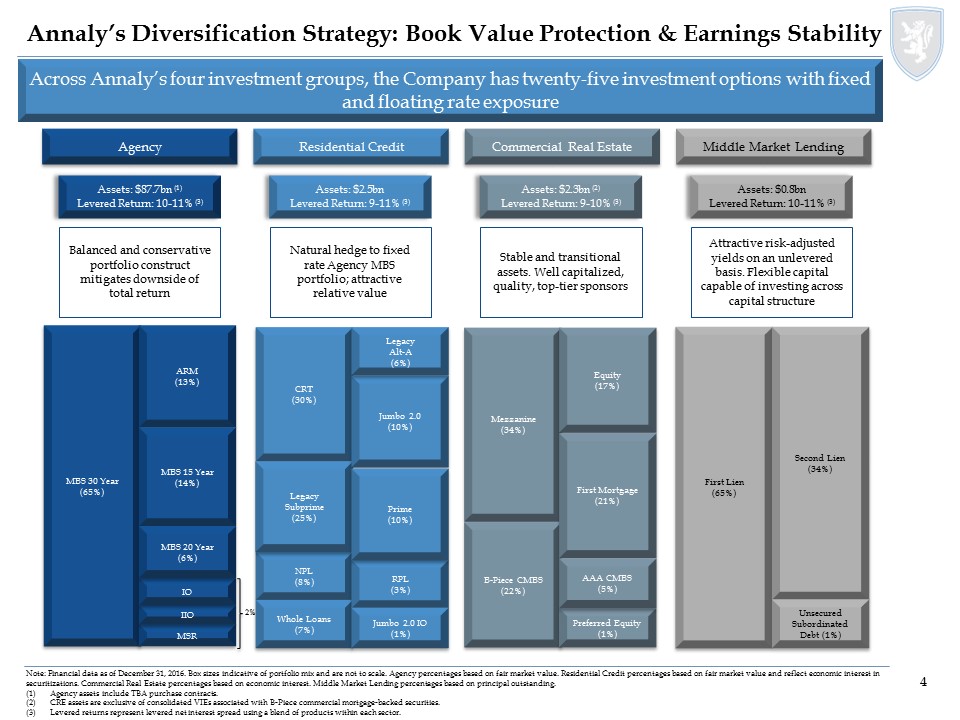
First Lien(65%) Mezzanine(34%) B-Piece CMBS(22%) CRT(30%) NPL(8%) LegacySubprime(25%) Whole Loans (7%) MBS 30 Year(65%) Annaly’s Diversification Strategy: Book Value Protection & Earnings Stability Insurance Asset Managers/ Pension/ Other Across Annaly’s four investment groups, the Company has twenty-five investment options with fixed and floating rate exposure MSR RPL(3%) Jumbo 2.0(10%) Jumbo 2.0 IO(1%) Preferred Equity(1%) Equity(17%) Second Lien(34%) LegacyAlt-A(6%) ARM(13%) Prime(10%) First Mortgage(21%) AAA CMBS(5%) IIO IO MBS 15 Year(14%) MBS 20 Year(6%) Note: Financial data as of December 31, 2016. Box sizes indicative of portfolio mix and are not to scale. Agency percentages based on fair market value. Residential Credit percentages based on fair market value and reflect economic interest in securitizations. Commercial Real Estate percentages based on economic interest. Middle Market Lending percentages based on principal outstanding.Agency assets include TBA purchase contracts. CRE assets are exclusive of consolidated VIEs associated with B-Piece commercial mortgage-backed securities. Levered returns represent levered net interest spread using a blend of products within each sector. Assets: $87.7bn (1)Levered Return: 10-11% (3) Assets: $2.5bnLevered Return: 9-11% (3) Assets: $2.3bn (2)Levered Return: 9-10% (3) Assets: $0.8bnLevered Return: 10-11% (3) Balanced and conservative portfolio construct mitigates downside of total return Natural hedge to fixed rate Agency MBS portfolio; attractive relative value Stable and transitional assets. Well capitalized, quality, top-tier sponsors Attractive risk-adjusted yields on an unlevered basis. Flexible capital capable of investing across capital structure Unsecured Subordinated Debt (1%) Agency Residential Credit Commercial Real Estate Middle Market Lending 2%
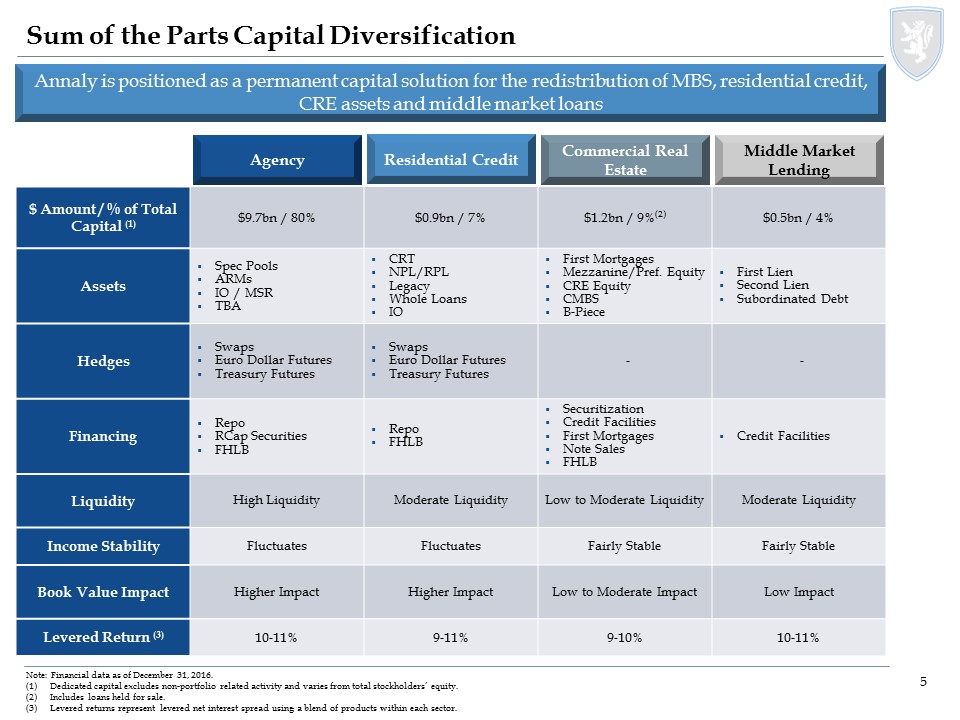
Annaly is positioned as a permanent capital solution for the redistribution of MBS, residential credit, CRE assets and middle market loans Sum of the Parts Capital Diversification Agency Residential Credit Commercial Real Estate Middle Market Lending $ Amount / % of Total Capital (1) $9.7bn / 80% $0.9bn / 7% $1.2bn / 9%(2) $0.5bn / 4% Assets Spec PoolsARMsIO / MSRTBA CRTNPL/RPLLegacyWhole LoansIO First MortgagesMezzanine/Pref. EquityCRE EquityCMBSB-Piece First LienSecond LienSubordinated Debt Hedges SwapsEuro Dollar FuturesTreasury Futures SwapsEuro Dollar FuturesTreasury Futures - - Financing RepoRCap SecuritiesFHLB RepoFHLB SecuritizationCredit FacilitiesFirst MortgagesNote SalesFHLB Credit Facilities Liquidity High Liquidity Moderate Liquidity Low to Moderate Liquidity Moderate Liquidity Income Stability Fluctuates Fluctuates Fairly Stable Fairly Stable Book Value Impact Higher Impact Higher Impact Low to Moderate Impact Low Impact Levered Return (3) 10-11% 9-11% 9-10% 10-11% Note: Financial data as of December 31, 2016.Dedicated capital excludes non-portfolio related activity and varies from total stockholders’ equity.Includes loans held for sale.Levered returns represent levered net interest spread using a blend of products within each sector.
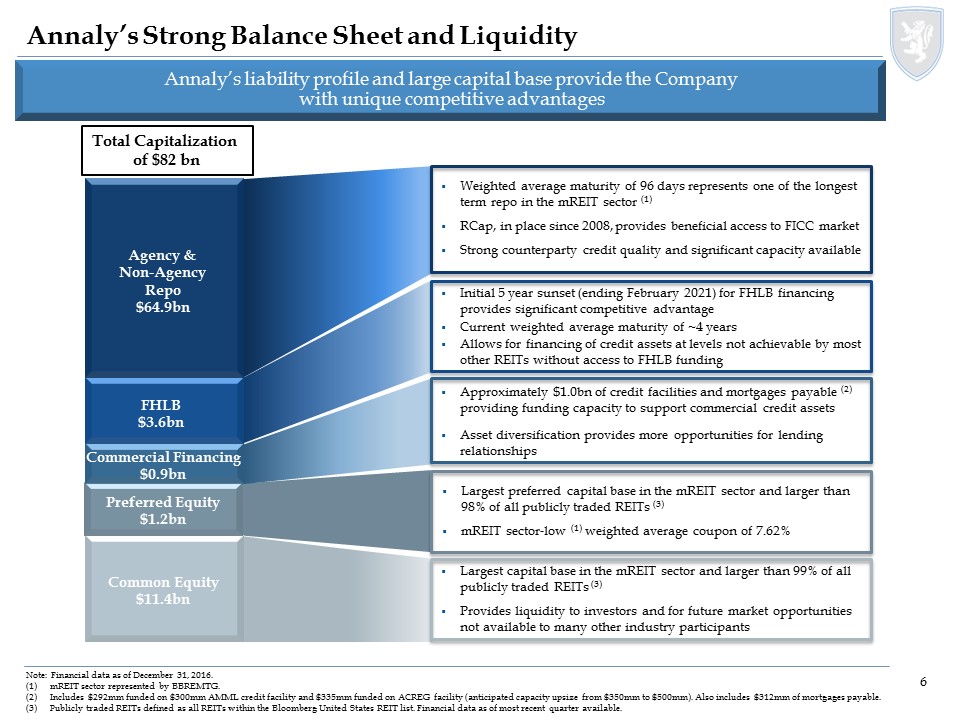
Annaly’s liability profile and large capital base provide the Companywith unique competitive advantages Annaly’s Strong Balance Sheet and Liquidity Note: Financial data as of December 31, 2016.mREIT sector represented by BBREMTG.Includes $292mm funded on $300mm AMML credit facility and $335mm funded on ACREG facility (anticipated capacity upsize from $350mm to $500mm). Also includes $312mm of mortgages payable. Publicly traded REITs defined as all REITs within the Bloomberg United States REIT list. Financial data as of most recent quarter available. Weighted average maturity of 96 days represents one of the longest term repo in the mREIT sector (1)RCap, in place since 2008, provides beneficial access to FICC marketStrong counterparty credit quality and significant capacity available Initial 5 year sunset (ending February 2021) for FHLB financing provides significant competitive advantageCurrent weighted average maturity of ~4 yearsAllows for financing of credit assets at levels not achievable by most other REITs without access to FHLB funding Approximately $1.0bn of credit facilities and mortgages payable (2) providing funding capacity to support commercial credit assetsAsset diversification provides more opportunities for lending relationships Largest preferred capital base in the mREIT sector and larger than 98% of all publicly traded REITs (3)mREIT sector-low (1) weighted average coupon of 7.62% Largest capital base in the mREIT sector and larger than 99% of all publicly traded REITs (3)Provides liquidity to investors and for future market opportunities not available to many other industry participants Common Equity$11.4bn Preferred Equity$1.2bn Commercial Financing$0.9bn FHLB$3.6bn Agency & Non-Agency Repo$64.9bn Total Capitalization of $82 bn
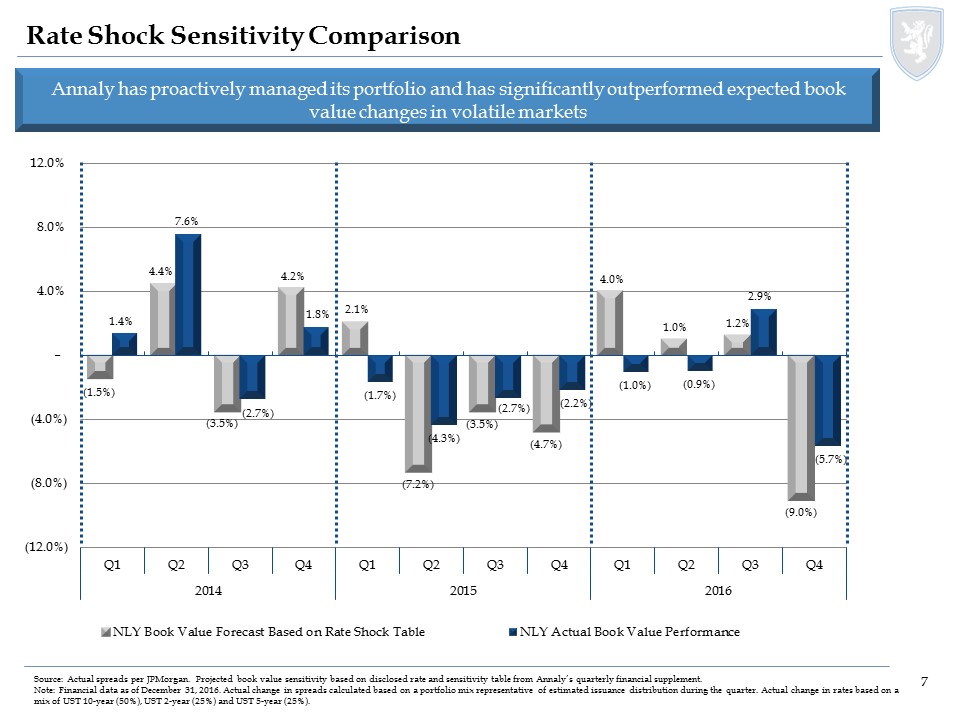
Rate Shock Sensitivity Comparison Annaly has proactively managed its portfolio and has significantly outperformed expected book value changes in volatile markets Source: Actual spreads per JPMorgan. Projected book value sensitivity based on disclosed rate and sensitivity table from Annaly’s quarterly financial supplement.Note: Financial data as of December 31, 2016. Actual change in spreads calculated based on a portfolio mix representative of estimated issuance distribution during the quarter. Actual change in rates based on a mix of UST 10-year (50%), UST 2-year (25%) and UST 5-year (25%). \\nyprodfs02\fidac\Capital Markets\Quarterly Earnings Supplement\16'Q4\Excel\Rate and Spread Sensitivity_v4Q16 IP - KERWICK UPDATE (002).xlsx
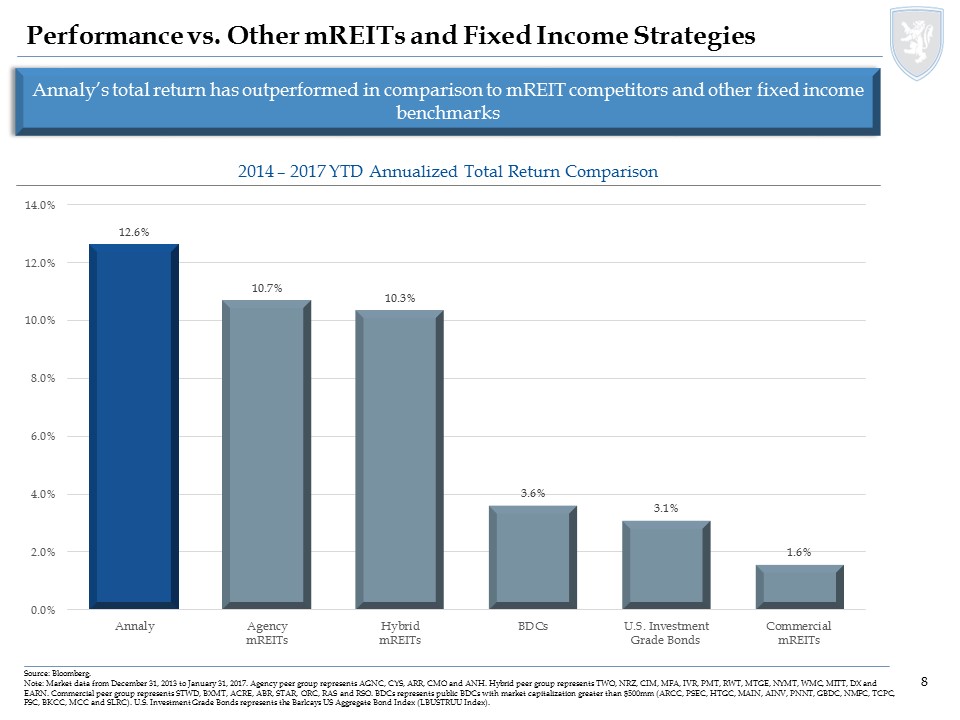
Performance vs. Other mREITs and Fixed Income Strategies Annaly’s total return has outperformed in comparison to mREIT competitors and other fixed income benchmarks 2014 – 2017 YTD Annualized Total Return Comparison Source: Bloomberg. Note: Market data from December 31, 2013 to January 31, 2017. Agency peer group represents AGNC, CYS, ARR, CMO and ANH. Hybrid peer group represents TWO, NRZ, CIM, MFA, IVR, PMT, RWT, MTGE, NYMT, WMC, MITT, DX and EARN. Commercial peer group represents STWD, BXMT, ACRE, ABR, STAR, ORC, RAS and RSO. BDCs represents public BDCs with market capitalization greater than $500mm (ARCC, PSEC, HTGC, MAIN, AINV, PNNT, GBDC, NMFC, TCPC, FSC, BKCC, MCC and SLRC). U.S. Investment Grade Bonds represents the Barlcays US Aggregate Bond Index (LBUSTRUU Index).
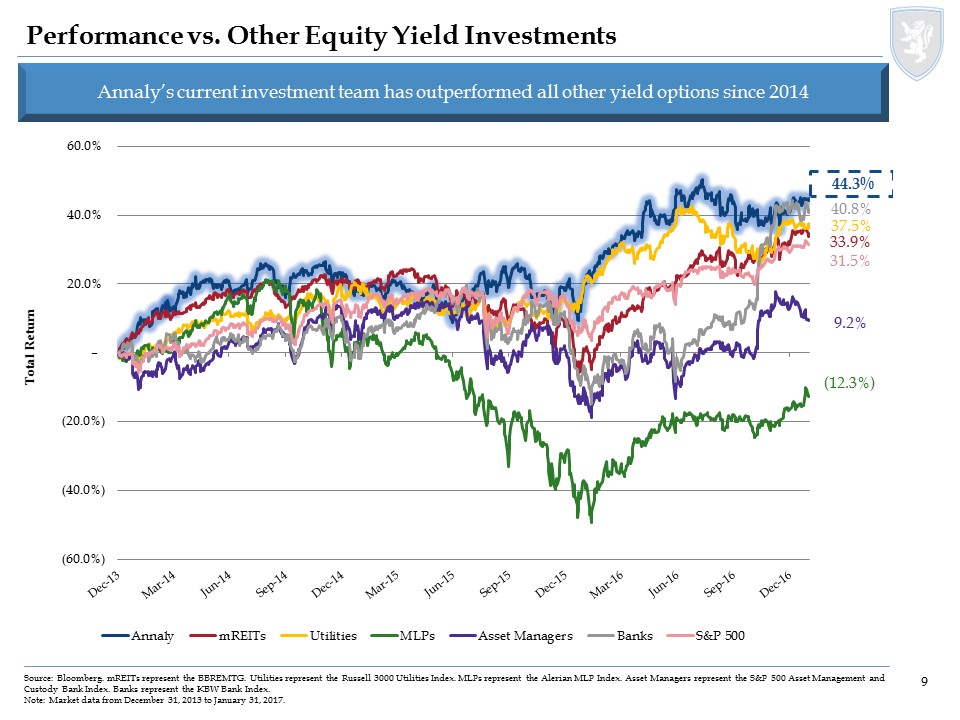
Performance vs. Other Equity Yield Investments Source: Bloomberg. mREITs represent the BBREMTG. Utilities represent the Russell 3000 Utilities Index. MLPs represent the Alerian MLP Index. Asset Managers represent the S&P 500 Asset Management and Custody Bank Index. Banks represent the KBW Bank Index. Note: Market data from December 31, 2013 to January 31, 2017. Annaly’s current investment team has outperformed all other yield options since 2014 N:\Capital Markets\Marketing\Internal\OpCo Offsite\June 2016\Excel\VIX and Yield Sectors vs NLY TR (AM Index) Since 2014.xlsx

Market Positioning

2017 Macro Outlook Evolving political and economic themes will drive the global macro landscape and markets in 2017 TrumpEconomics Federal Reserve U.S. Dollar (USD) & Global Divergence Rising Rates / Volatility Political Uncertainty Details and impact of economic measures, as well as priorities of new Administration remain uncertainQuestionable if proposed measures will result in sustainable growth Administration has the ability to appoint 3 Fed Governors in 2017, replace Chair and Vice Chair in 2018, and potentially pass legislation impacting the FedNumerous questions around the Fed’s reaction function amid organizational changes and impact of fiscal policy at this stage of the economic cycle USD has reached highest level since 2002 given the diverging economic prospects between the U.S. and other developed economiesRising USD should act as a governor on U.S. growth and inflation U.S. – G7 yield spread is at a multi-decade high amid diverging monetary policies; it remains uncertain how this atypical divergence will be overcomeInflation break-evens and term premia have increased, as has volatility to a lesser extent Brexit negotiations to begin at end of Q1 2017Upcoming elections in the Netherlands, France, and Germany (all face rising populism from the right)

Hiking Cycle Comparison Market Environment Portfolio Positioning Annaly’s diversified platform is now built to manage various rate environments 2004 / 2005 2016 Key Takeaways Market Cap(1) $1.4bn $10.2bn Largest mREIT globally Asset Classes Agency MBS Agency MBSResi CreditCRE Debt & EquityCorporate DebtMortgage Servicing Rights More durable earnings and book value Agency Portfolio Mix 30% - 40% Fixed / Floating60%-70% ARMs 65% Spec Pools16% Dollar Roll13% ARMS5% Other (2) Agency strategy has evolved over time to better manage various rate environments Hedge Instruments No explicit hedges usedBarbelled portfolio Pay Fixed/Receiver SwapsTreasuriesEuroDollar Futures Greater use of hedging to protect earnings and book value Economic Leverage 9.0 - 9.8x 6.4x Conservative leverage profile Net Interest Margin (NIM) 0.70% - 1.70% 0.75% - 2.50% Reinvestment spreads remain attractive Source: Bloomberg and Company filings. Financial data for 2004/2005 and 2016 are as of December 31, 2005 and December 31, 2016, respectively. Market data for 2004/2005 and 2016 are as of December 31, 2005 and December 31, 2016, respectively. CMO, Derivatives, GSE Credit Risk Sharing debt and Callable debt. Key Takeaways In contrast to the last hiking cycle, the yield curve has steepened despite the rise in short-term rates This is primarily attributable to growth and inflation expectations associated with new administration 2004 / 2005 2016 Spread 2s vs 10s
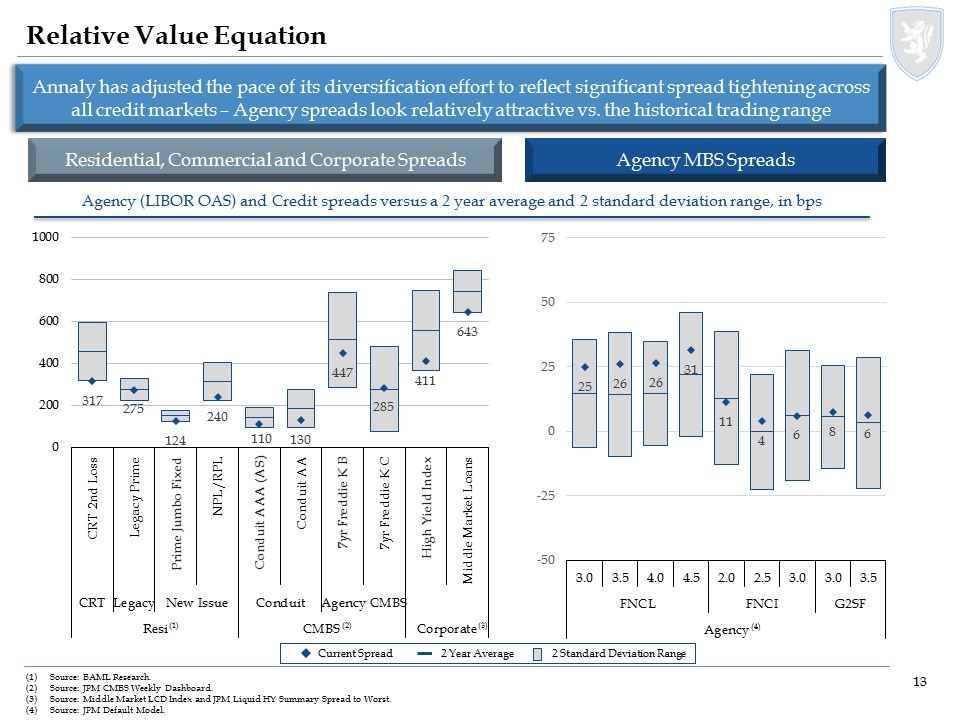
Relative Value Equation Annaly has adjusted the pace of its diversification effort to reflect significant spread tightening across all credit markets – Agency spreads look relatively attractive vs. the historical trading range Source: BAML Research. Source: JPM CMBS Weekly Dashboard.Source: Middle Market LCD Index and JPM Liquid HY Summary Spread to Worst.Source: JPM Default Model. Agency (LIBOR OAS) and Credit spreads versus a 2 year average and 2 standard deviation range, in bps Residential, Commercial and Corporate Spreads Agency MBS Spreads (1) (2) (3) (4) Current Spread 2 Year Average 2 Standard Deviation Range

Business Update
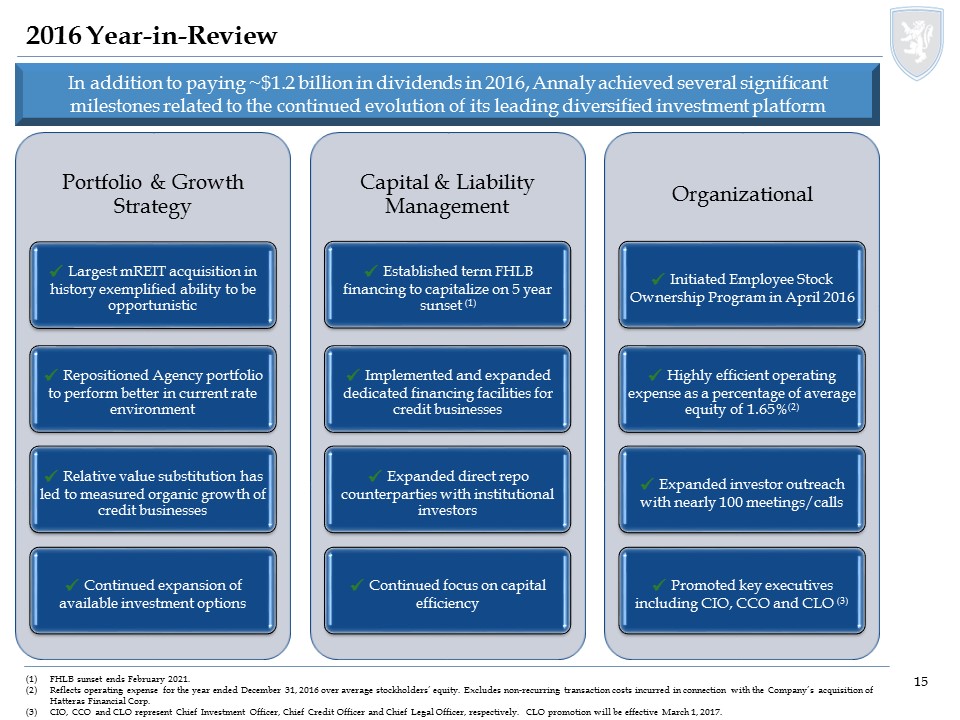
2016 Year-in-Review In addition to paying ~$1.2 billion in dividends in 2016, Annaly achieved several significant milestones related to the continued evolution of its leading diversified investment platform FHLB sunset ends February 2021.Reflects operating expense for the year ended December 31, 2016 over average stockholders’ equity. Excludes non-recurring transaction costs incurred in connection with the Company’s acquisition of Hatteras Financial Corp.CIO, CCO and CLO represent Chief Investment Officer, Chief Credit Officer and Chief Legal Officer, respectively. CLO promotion will be effective March 1, 2017.
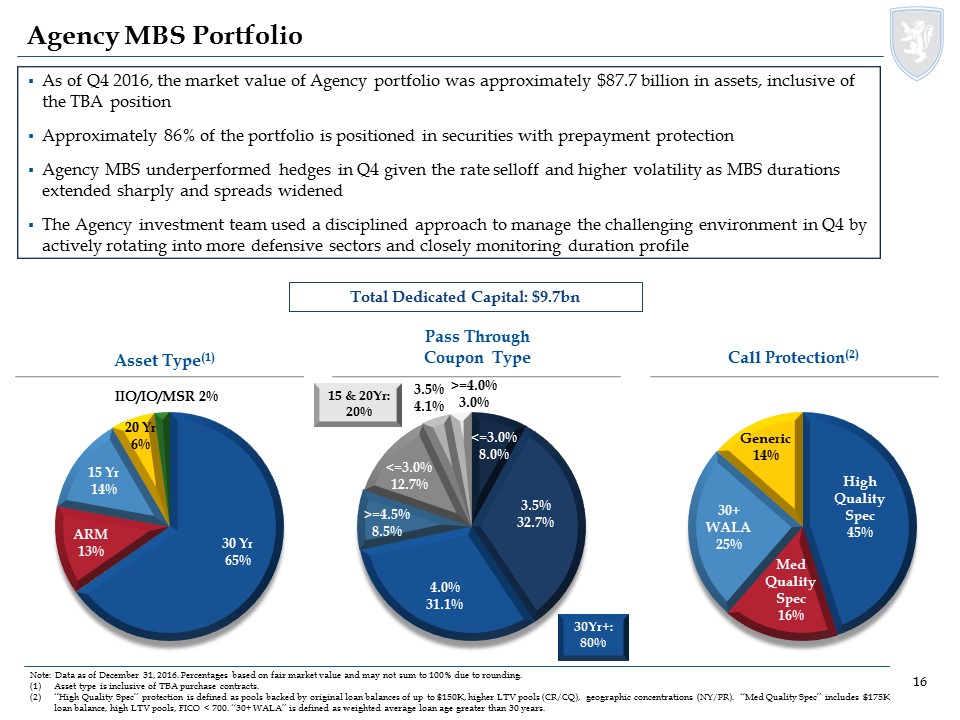
Pass Through Coupon Type Agency MBS Portfolio Note: Data as of December 31, 2016. Percentages based on fair market value and may not sum to 100% due to rounding.Asset type is inclusive of TBA purchase contracts.“High Quality Spec” protection is defined as pools backed by original loan balances of up to $150K, higher LTV pools (CR/CQ), geographic concentrations (NY/PR). “Med Quality Spec” includes $175K loan balance, high LTV pools, FICO < 700. “30+ WALA” is defined as weighted average loan age greater than 30 years. As of Q4 2016, the market value of Agency portfolio was approximately $87.7 billion in assets, inclusive of the TBA positionApproximately 86% of the portfolio is positioned in securities with prepayment protectionAgency MBS underperformed hedges in Q4 given the rate selloff and higher volatility as MBS durations extended sharply and spreads widenedThe Agency investment team used a disciplined approach to manage the challenging environment in Q4 by actively rotating into more defensive sectors and closely monitoring duration profile Asset Type(1) Call Protection(2) Total Dedicated Capital: $9.7bn 15 & 20Yr: 20% 30Yr+:80% \\nyprodfs02\fidac\Capital Markets\Quarterly Earnings Supplement\16'Q4\Excel\Agency Portfolio - Q4 2016 Pie Charts.xlsx

Residential Credit Portfolio Note: Data as of December 31, 2016. Percentages based on fair market value and reflect economic interest in securitizations. Jumbo 2.0 includes the economic interest of certain positions that are classified as Residential Mortgage Loans within our Consolidated Financial Statements. Percentages may not sum to 100% due to rounding. (1) Legacy includes subprime, prime and Alt-A. As of Q4 2016, the portfolio grew to $2.5 billion in assets and is comprised of the following sectors:Credit Risk Transfer: Faster speeds resulted in shortening spread duration and increased credit enhancement; expect increased liquidity in assets and fundingJumbo 2.0 Securities: AAA seniors ended 2016 trading significantly tighter to Agency collateral compared to year end 2015. Securitization execution is now marginally more profitable than outright loan salesNPL/RPL Securities: Unrated senior yields have tightened approximately 75bps year over year, while funding costs are higher, driven by an uptick in LIBORLegacy(1): Market has started to trade with empirical duration due to higher discount rates/rate selloff Whole Loans: Expect continued expansion of whole loan platform to maximize efficiency of FHLB funding Sector Type Coupon Type Effective Duration Total Dedicated Capital: $0.9bn
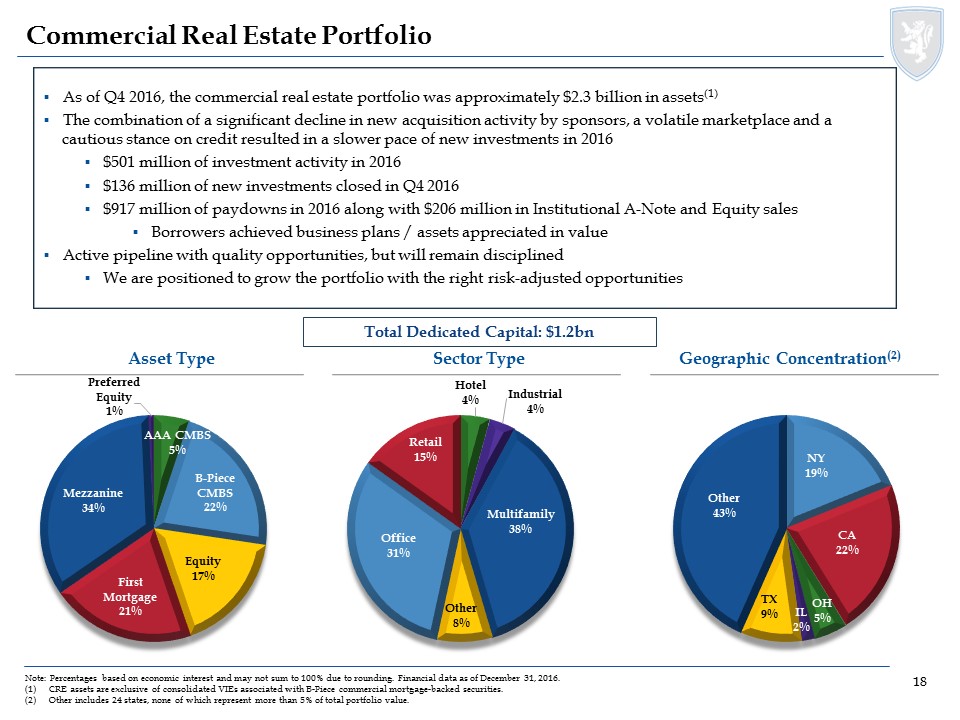
Commercial Real Estate Portfolio Note: Percentages based on economic interest and may not sum to 100% due to rounding. Financial data as of December 31, 2016.CRE assets are exclusive of consolidated VIEs associated with B-Piece commercial mortgage-backed securities.Other includes 24 states, none of which represent more than 5% of total portfolio value. As of Q4 2016, the commercial real estate portfolio was approximately $2.3 billion in assets(1)The combination of a significant decline in new acquisition activity by sponsors, a volatile marketplace and a cautious stance on credit resulted in a slower pace of new investments in 2016$501 million of investment activity in 2016$136 million of new investments closed in Q4 2016$917 million of paydowns in 2016 along with $206 million in Institutional A-Note and Equity salesBorrowers achieved business plans / assets appreciated in valueActive pipeline with quality opportunities, but will remain disciplined We are positioned to grow the portfolio with the right risk-adjusted opportunities Asset Type Sector Type Geographic Concentration(2) Total Dedicated Capital: $1.2bn
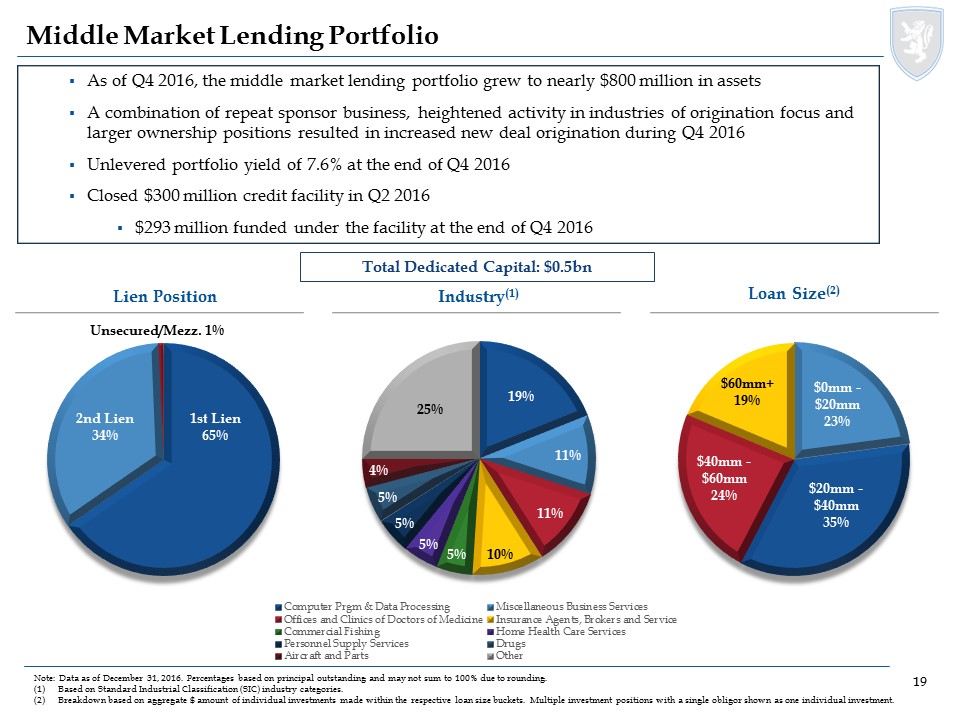
Middle Market Lending Portfolio Lien Position Industry(1) Loan Size(2) As of Q4 2016, the middle market lending portfolio grew to nearly $800 million in assetsA combination of repeat sponsor business, heightened activity in industries of origination focus and larger ownership positions resulted in increased new deal origination during Q4 2016Unlevered portfolio yield of 7.6% at the end of Q4 2016Closed $300 million credit facility in Q2 2016 $293 million funded under the facility at the end of Q4 2016 Total Dedicated Capital: $0.5bn Note: Data as of December 31, 2016. Percentages based on principal outstanding and may not sum to 100% due to rounding.Based on Standard Industrial Classification (SIC) industry categories.Breakdown based on aggregate $ amount of individual investments made within the respective loan size buckets. Multiple investment positions with a single obligor shown as one individual investment.
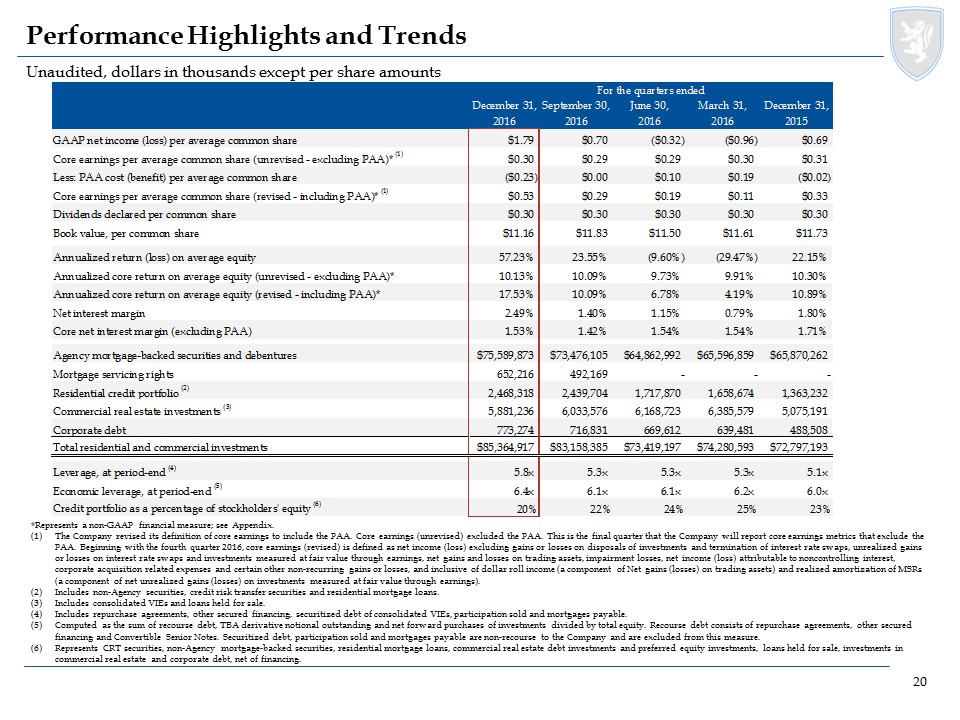
Performance Highlights and Trends Unaudited, dollars in thousands except per share amounts *Represents a non-GAAP financial measure; see Appendix.The Company revised its definition of core earnings to include the PAA. Core earnings (unrevised) excluded the PAA. This is the final quarter that the Company will report core earnings metrics that exclude the PAA. Beginning with the fourth quarter 2016, core earnings (revised) is defined as net income (loss) excluding gains or losses on disposals of investments and termination of interest rate swaps, unrealized gains or losses on interest rate swaps and investments measured at fair value through earnings, net gains and losses on trading assets, impairment losses, net income (loss) attributable to noncontrolling interest, corporate acquisition related expenses and certain other non-recurring gains or losses, and inclusive of dollar roll income (a component of Net gains (losses) on trading assets) and realized amortization of MSRs (a component of net unrealized gains (losses) on investments measured at fair value through earnings).Includes non-Agency securities, credit risk transfer securities and residential mortgage loans.Includes consolidated VIEs and loans held for sale.Includes repurchase agreements, other secured financing, securitized debt of consolidated VIEs, participation sold and mortgages payable.Computed as the sum of recourse debt, TBA derivative notional outstanding and net forward purchases of investments divided by total equity. Recourse debt consists of repurchase agreements, other secured financing and Convertible Senior Notes. Securitized debt, participation sold and mortgages payable are non-recourse to the Company and are excluded from this measure.Represents CRT securities, non-Agency mortgage-backed securities, residential mortgage loans, commercial real estate debt investments and preferred equity investments, loans held for sale, investments in commercial real estate and corporate debt, net of financing.

Appendix: Non-GAAP Reconciliations
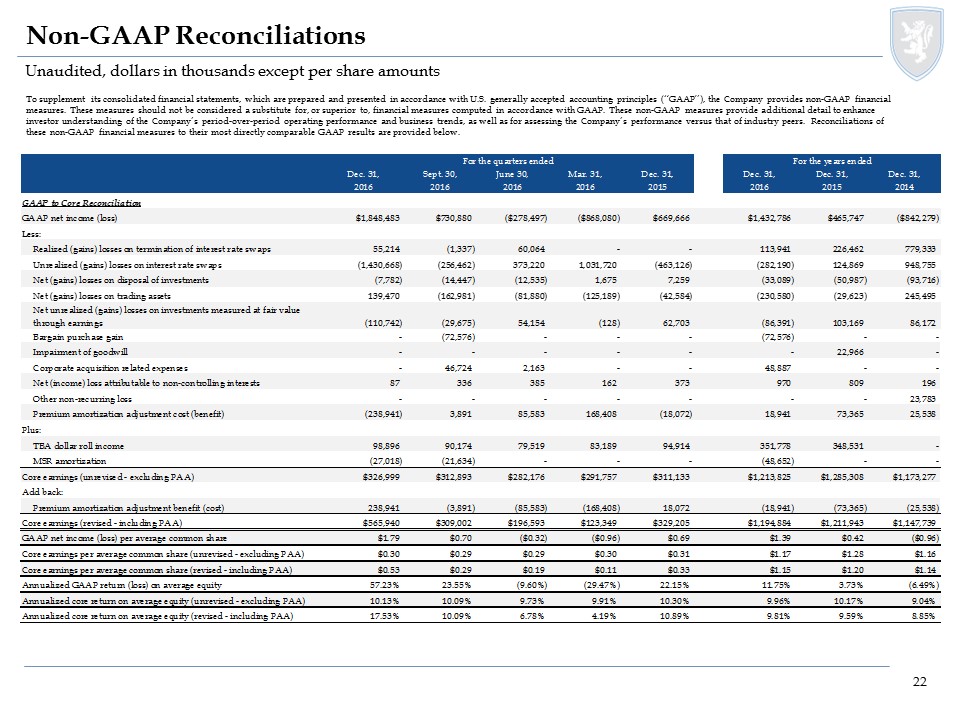
Non-GAAP Reconciliations To supplement its consolidated financial statements, which are prepared and presented in accordance with U.S. generally accepted accounting principles (“GAAP”), the Company provides non-GAAP financial measures. These measures should not be considered a substitute for, or superior to, financial measures computed in accordance with GAAP. These non-GAAP measures provide additional detail to enhance investor understanding of the Company’s period-over-period operating performance and business trends, as well as for assessing the Company’s performance versus that of industry peers. Reconciliations of these non-GAAP financial measures to their most directly comparable GAAP results are provided below. Unaudited, dollars in thousands except per share amounts

Non-GAAP Reconciliations (Cont’d) To supplement its consolidated financial statements, which are prepared and presented in accordance with U.S. generally accepted accounting principles (“GAAP”), the Company provides non-GAAP financial measures. These measures should not be considered a substitute for, or superior to, financial measures computed in accordance with GAAP. These non-GAAP measures provide additional detail to enhance investor understanding of the Company’s period-over-period operating performance and business trends, as well as for assessing the Company’s performance versus that of industry peers. Reconciliations of these non-GAAP financial measures to their most directly comparable GAAP results are provided below. Unaudited, dollars in thousands except per share amounts