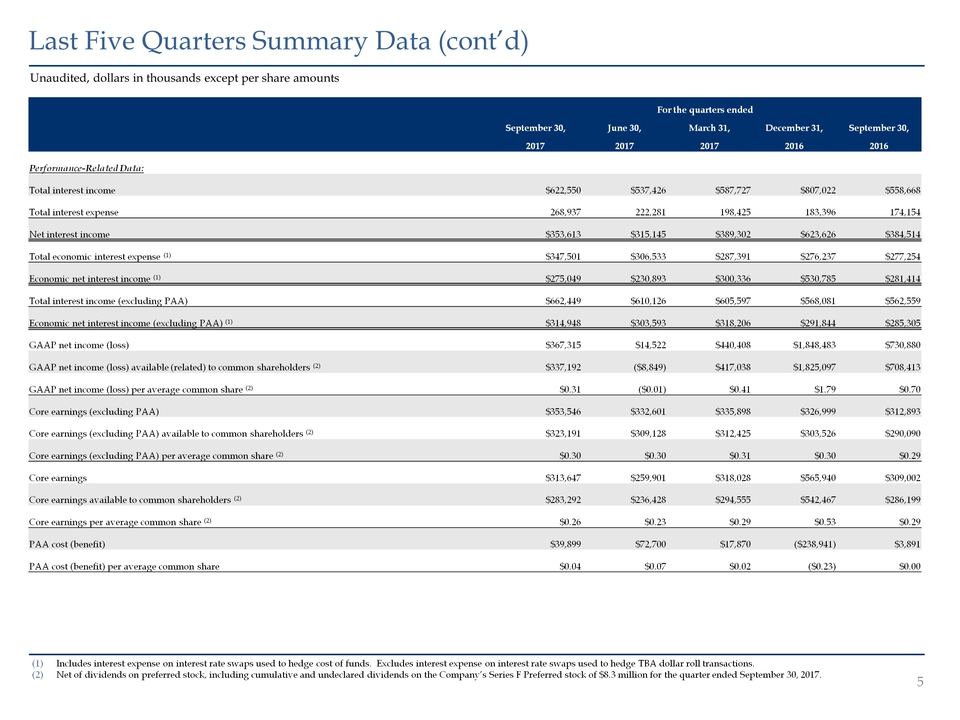
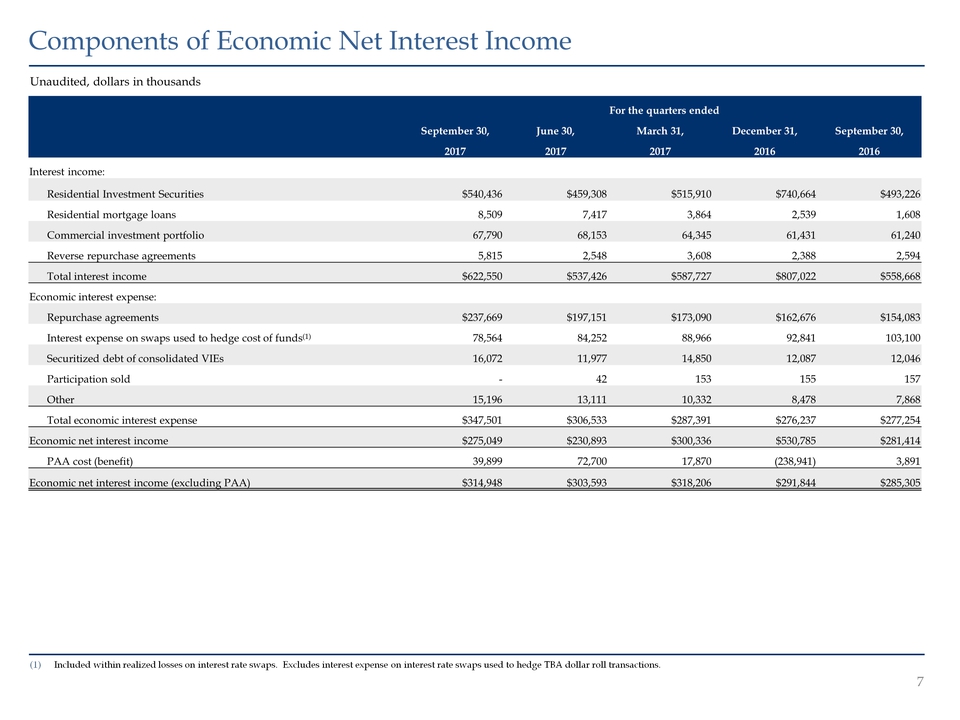
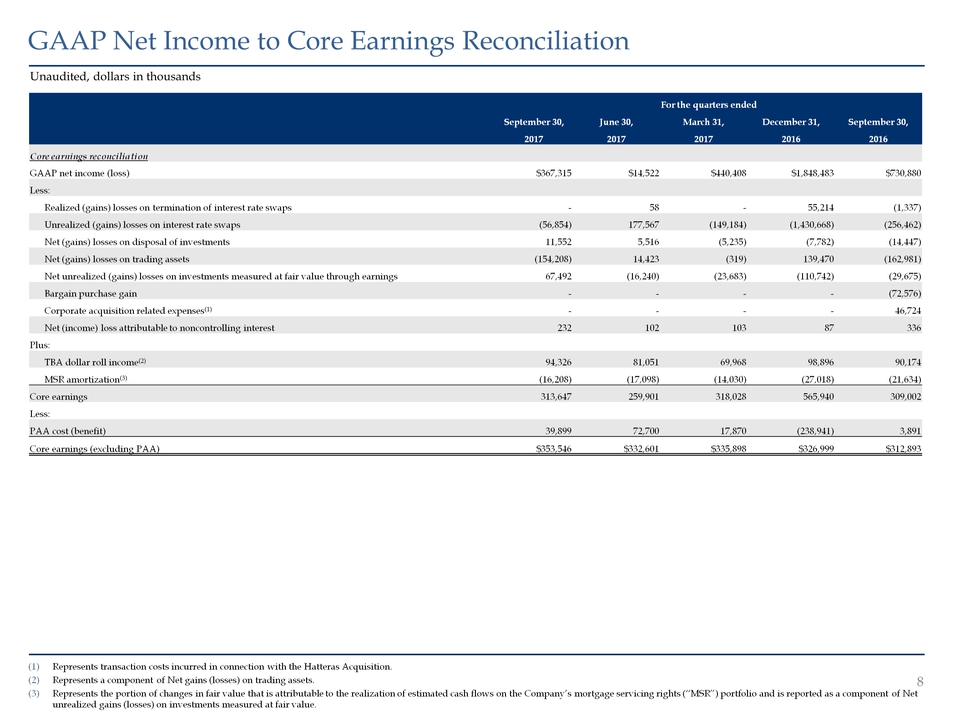
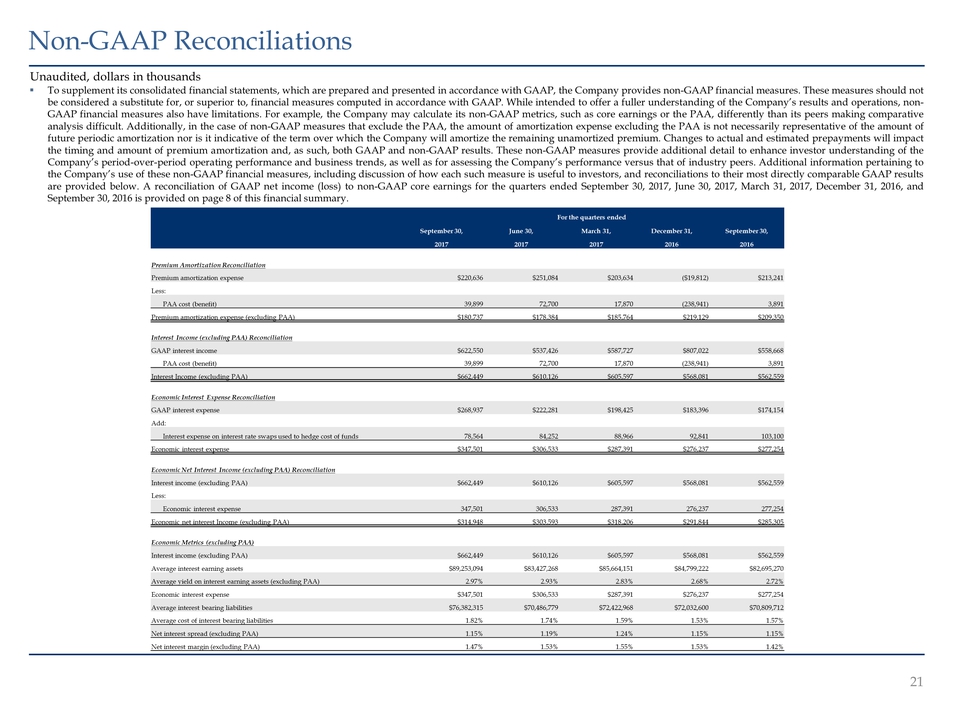
To supplement its consolidated financial statements, which are prepared and presented in accordance with GAAP, the Company provides non-GAAP financial measures. These measures should not be considered a substitute for, or superior to, financial measures computed in accordance with GAAP. While intended to offer a fuller understanding of the Company’s results and operations, non-GAAP financial measures also have limitations. For example, the Company may calculate its non-GAAP metrics, such as core earnings or the PAA, differently than its peers making comparative analysis difficult. Additionally, in the case of non-GAAP measures that exclude the PAA, the amount of amortization expense excluding the PAA is not necessarily representative of the amount of future periodic amortization nor is it indicative of the term over which the Company will amortize the remaining unamortized premium. Changes to actual and estimated prepayments will impact the timing and amount of premium amortization and, as such, both GAAP and non-GAAP results. These non-GAAP measures provide additional detail to enhance investor understanding of the Company’s period-over-period operating performance and business trends, as well as for assessing the Company’s performance versus that of industry peers. Additional information pertaining to the Company’s use of these non-GAAP financial measures, including discussion of how each such measure is useful to investors, and reconciliations to their most directly comparable GAAP results are provided below. A reconciliation of GAAP net income (loss) to non-GAAP core earnings for the quarters ended September 30, 2017, June 30, 2017, March 31, 2017, December 31, 2016, and September 30, 2016 is provided on page 8 of this financial summary. Unaudited, dollars in thousands 21 Non-GAAP Reconciliations For the quarters ended September 30, June 30, March 31, December 31, September 30, 2017 2017 2017 2016 2016 Premium Amortization Reconciliation Premium amortization expense $220,636 $251,084 $203,634 ($19,812) $213,241 Less: PAA cost (benefit) 39,899 72,700 17,870 (238,941) 3,891 Premium amortization expense (excluding PAA) $180,737 $178,384 $185,764 $219,129 $209,350 Interest Income (excluding PAA) Reconciliation GAAP interest income $622,550 $537,426 $587,727 $807,022 $558,668 PAA cost (benefit) 39,899 72,700 17,870 (238,941) 3,891 Interest Income (excluding PAA) $662,449 $610,126 $605,597 $568,081 $562,559 Economic Interest Expense Reconciliation GAAP interest expense $268,937 $222,281 $198,425 $183,396 $174,154 Add: Interest expense on interest rate swaps used to hedge cost of funds 78,564 84,252 88,966 92,841 103,100 Economic interest expense $347,501 $306,533 $287,391 $276,237 $277,254 Economic Net Interest Income (excluding PAA) Reconciliation Interest income (excluding PAA) $662,449 $610,126 $605,597 $568,081 $562,559 Less: Economic interest expense 347,501 306,533 287,391 276,237 277,254 Economic net interest Income (excluding PAA) $314,948 $303,593 $318,206 $291,844 $285,305 Economic Metrics (excluding PAA) Interest income (excluding PAA) $662,449 $610,126 $605,597 $568,081 $562,559 Average interest earning assets $89,253,094 $83,427,268 $85,664,151 $84,799,222 $82,695,270 Average yield on interest earning assets (excluding PAA) 2.97% 2.93% 2.83% 2.68% 2.72% Economic interest expense $347,501 $306,533 $287,391 $276,237 $277,254 Average interest bearing liabilities $76,382,315 $70,486,779 $72,422,968 $72,032,600 $70,809,712 Average cost of interest bearing liabilities 1.82% 1.74% 1.59% 1.53% 1.57% Net interest spread (excluding PAA) 1.15% 1.19% 1.24% 1.15% 1.15% Net interest margin (excluding PAA) 1.47% 1.53% 1.55% 1.53% 1.42%