
Second Quarter 2019 Investor Presentation July 31, 2019

© Copyright 2019 Annaly Capital Management, Inc. All rights reserved. Safe Harbor Notice Forward-Looking Statements This presentation, other written or oral communications, and our public documents to which we refer contain or incorporate by reference certain forward-looking statements which are based on various assumptions (some of which are beyond our control) and may be identified by reference to a future period or periods or by the use of forward-looking terminology, such as “may,” “will,” “believe,” “expect,” “anticipate,” “continue,” or similar terms or variations on those terms or the negative of those terms. Such statements include those relating to our future performance, macro outlook, the interest rate and credit environments, tax reform and future opportunities. Actual results could differ materially from those set forth in forward-looking statements due to a variety of factors, including, but not limited to, changes in interest rates; changes in the yield curve; changes in prepayment rates; the availability of mortgage-backed securities (“MBS”) and other securities for purchase; the availability of financing and, if available, the terms of any financing; changes in the market value of our assets; changes in business conditions and the general economy; our ability to grow our commercial real estate business; our ability to grow our residential credit business; our ability to grow our middle market lending business; credit risks related to our investments in credit risk transfer securities, residential mortgage-backed securities and related residential mortgage credit assets, commercial real estate assets and corporate debt; risks related to investments in mortgage servicing rights; our ability to consummate any contemplated investment opportunities; changes in government regulations or policy affecting our business; our ability to maintain our qualification as a REIT for U.S. federal income tax purposes; and our ability to maintain our exemption from registration under the Investment Company Act of 1940, as amended. For a discussion of the risks and uncertainties which could cause actual results to differ from those contained in the forward-looking statements, see “Risk Factors” in our most recent Annual Report on Form 10-K and any subsequent Quarterly Reports on Form 10-Q. We do not undertake, and specifically disclaim any obligation, to publicly release the result of any revisions which may be made to any forward-looking statements to reflect the occurrence of anticipated or unanticipated events or circumstances after the date of such statements, except as required by law. We routinely post important information for investors on our website, www.annaly.com. We intend to use this webpage as a means of disclosing material, non-public information, for complying with our disclosure obligations under Regulation FD and to post and update investor presentations and similar materials on a regular basis. Annaly encourages investors, analysts, the media and others interested in Annaly to monitor the Investors section of our website, in addition to following our press releases, SEC filings, public conference calls, presentations, webcasts and other information we post from time to time on our website. To sign-up for email-notifications, please visit the “Email Alerts” section of our website, www.annaly.com, under the “Investors” section and enter the required information to enable notifications. The information contained on, or that may be accessed through, our webpage is not incorporated by reference into, and is not a part of, this document. Past performance is no guarantee of future results. There is no guarantee that any investment strategy referenced herein will work under all market conditions. Prior to making any investment decision, you should evaluate your ability to invest for the long-term, especially during periods of downturns in the market. You alone assume the responsibility of evaluating the merits and risks associated with any potential investment or investment strategy referenced herein. To the extent that this material contains reference to any past specific investment recommendations or strategies which were or would have been profitable to any person, it should not be assumed that recommendations made in the future will be profitable or will equal the performance of such past investment recommendations or strategies. Non-GAAP Financial Measures This presentation includes certain non-GAAP financial measures, including core earnings metrics, which are presented both inclusive and exclusive of the premium amortization adjustment (“PAA”). We believe the non-GAAP financial measures are useful for management, investors, analysts, and other interested parties in evaluating our performance but should not be viewed in isolation and are not a substitute for financial measures computed in accordance with U.S. generally accepted accounting principles (“GAAP”). In addition, we may calculate non-GAAP metrics, which include core earnings, and the PAA, differently than our peers making comparative analysis difficult. Please see the section entitled “Non-GAAP Reconciliations” in the attached Appendix for a reconciliation to the most directly comparable GAAP financial measures. 2

Overview
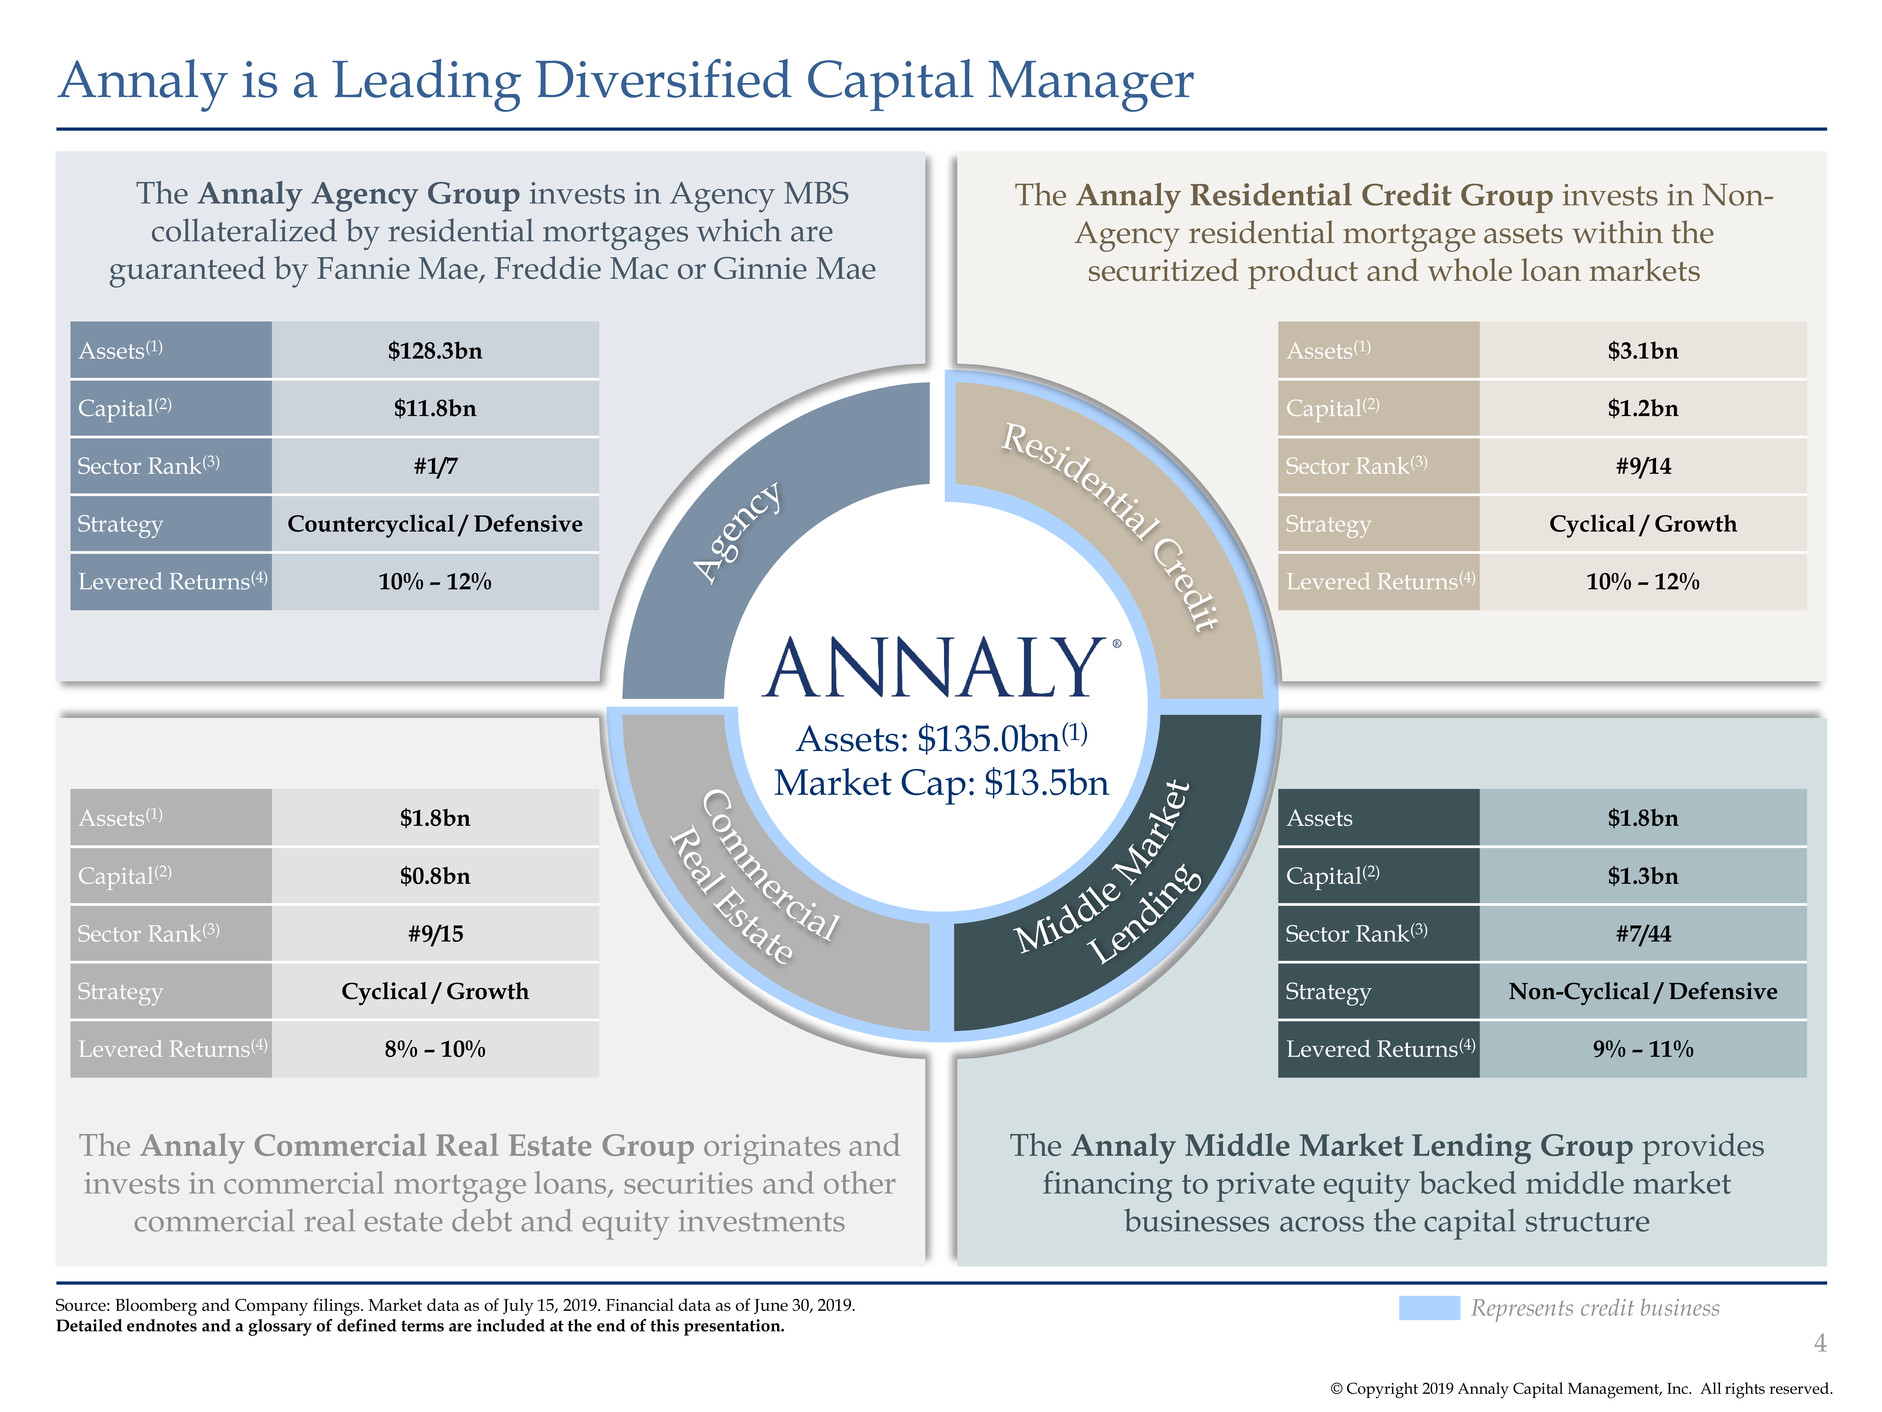
© Copyright 2019 Annaly Capital Management, Inc. All rights reserved. Annaly is a Leading Diversified Capital Manager 4 Source: Bloomberg and Company filings. Market data as of July 15, 2019. Financial data as of June 30, 2019. Detailed endnotes and a glossary of defined terms are included at the end of this presentation. The Annaly Middle Market Lending Group provides financing to private equity backed middle market businesses across the capital structure The Annaly Commercial Real Estate Group originates and invests in commercial mortgage loans, securities and other commercial real estate debt and equity investments The Annaly Residential Credit Group invests in Non- Agency residential mortgage assets within the securitized product and whole loan markets The Annaly Agency Group invests in Agency MBS collateralized by residential mortgages which are guaranteed by Fannie Mae, Freddie Mac or Ginnie Mae Assets(1) $128.3bn Capital(2) $11.8bn Sector Rank(3) #1/7 Strategy Countercyclical / Defensive Levered Returns(4) 10% – 12% Assets(1) $3.1bn Capital(2) $1.2bn Sector Rank(3) #9/14 Strategy Cyclical / Growth Levered Returns(4) 10% – 12% Assets(1) $1.8bn Capital(2) $0.8bn Sector Rank(3) #9/15 Strategy Cyclical / Growth Levered Returns(4) 8% – 10% Assets $1.8bn Capital(2) $1.3bn Sector Rank(3) #7/44 Strategy Non-Cyclical / Defensive Levered Returns(4) 9% – 11% Represents credit business Assets: $135.0bn(1) Market Cap: $13.5bn

© Copyright 2019 Annaly Capital Management, Inc. All rights reserved. Second Quarter 2019 Financial Highlights 5 Earnings & Book Value Investment Portfolio Financing, Liquidity & Hedging Earnings (Loss) per Share Dividend per Share Net Interest Margin (ex. PAA)* Book Value per Share ($1.24) | $0.25 $0.25 $9.33 Capital Allocation(3) Dividend Yield(1) 10.95% Core (ex. PAA)*GAAP Financing & Liquidity Average Cost of Funds(6)Economic Leverage $2.5bn of residential whole loan and commercial securitizations YTD’19(4) $7.8bn of unencumbered assets Hedge Ratio(5) $135.0bn Total Portfolio(2) $15.7bn Total Stockholders’ Equity Average Yield on Interest Earning Assets (ex. PAA)* Source: Company filings. Financial data as of June 30, 2019, unless otherwise noted. * Represents a non-GAAP financial measure; see Appendix. Detailed endnotes and a glossary of defined terms are included at the end of this presentation. Total Hedge Portfolio $88bn Hedge portfolio includes $67bn of swaps, $3bn of swaptions and $18bn of futures contracts Net Interest Margin 3.45% 3.48% Q1 2019 Q2 2019 Agency 78% AMML 9% ARC 8% ACREG 5% Credit 22% 2.15% 2.41% Q1 2019 Q2 2019 85% 74% Q1 2019 Q2 2019 7.0x 7.6x Q1 2019 Q2 2019 1.25% 0.87% Q1 2019 Q2 2019 1.51% 1.28% Q1 2019 Q2 2019

© Copyright 2019 Annaly Capital Management, Inc. All rights reserved. Annaly has announced a number of strategic initiatives and achievements since the beginning of Q2 2019 Recent Achievements 6 Note: For more information and to review the complete Press Releases referenced above, please visit www.annaly.com/investors. Detailed endnotes and a glossary of defined terms are included at the end of this presentation. Capital Optimization Ownership Culture “The recent stock purchases made by Annaly’s Board, executive officers and employees further emphasize our belief in this Company and its future... Having an established ownership culture at our Firm is extremely important and our very unique stock purchase guidelines support alignment of the long-term interests of our management and employees with our shareholders. Our continued purchases, coupled with the fact that all current executives have never sold any stock, exemplify our ongoing commitment to our shareholders.” – Kevin Keyes Chairman, CEO & President Provides Update on Employee Stock Ownership Guidelines and Recent Purchases by Officers and Directors July 8, 2019 Gender Diversity / Human Capital Women’s Networks Host New York City Nonprofit Board Fair June 19, 2019 “We are proud to have worked with Wells Fargo and Youth INC on this inspiring event, which underscores the continued success and reach of Annaly’s Women’s Interactive Network…Aligned with Annaly’s emphasis on diversity and professional development throughout our corporate culture, we are also focused on proactively creating opportunities, such as this Fair, to promote female representation on nonprofit Boards that meaningfully contribute to the communities in which we live and work.” – Kevin Keyes Chairman, CEO & President & Announces Share Repurchase Program of $1.5 Billion June 3, 2019 Announces Redemption of $55 Million 8.125% Series H Cumulative Redeemable Preferred Stock(1) May 1, 2019 Announces Redemption of $175 Million 7.625% Series C Cumulative Redeemable Preferred Stock(3) June 21, 2019 Announces Pricing of Public Offering of $442.5 Million(2) Series I Fixed-to-Floating Rate Cumulative Redeemable Preferred Stock June 20, 2019

Investment Highlights
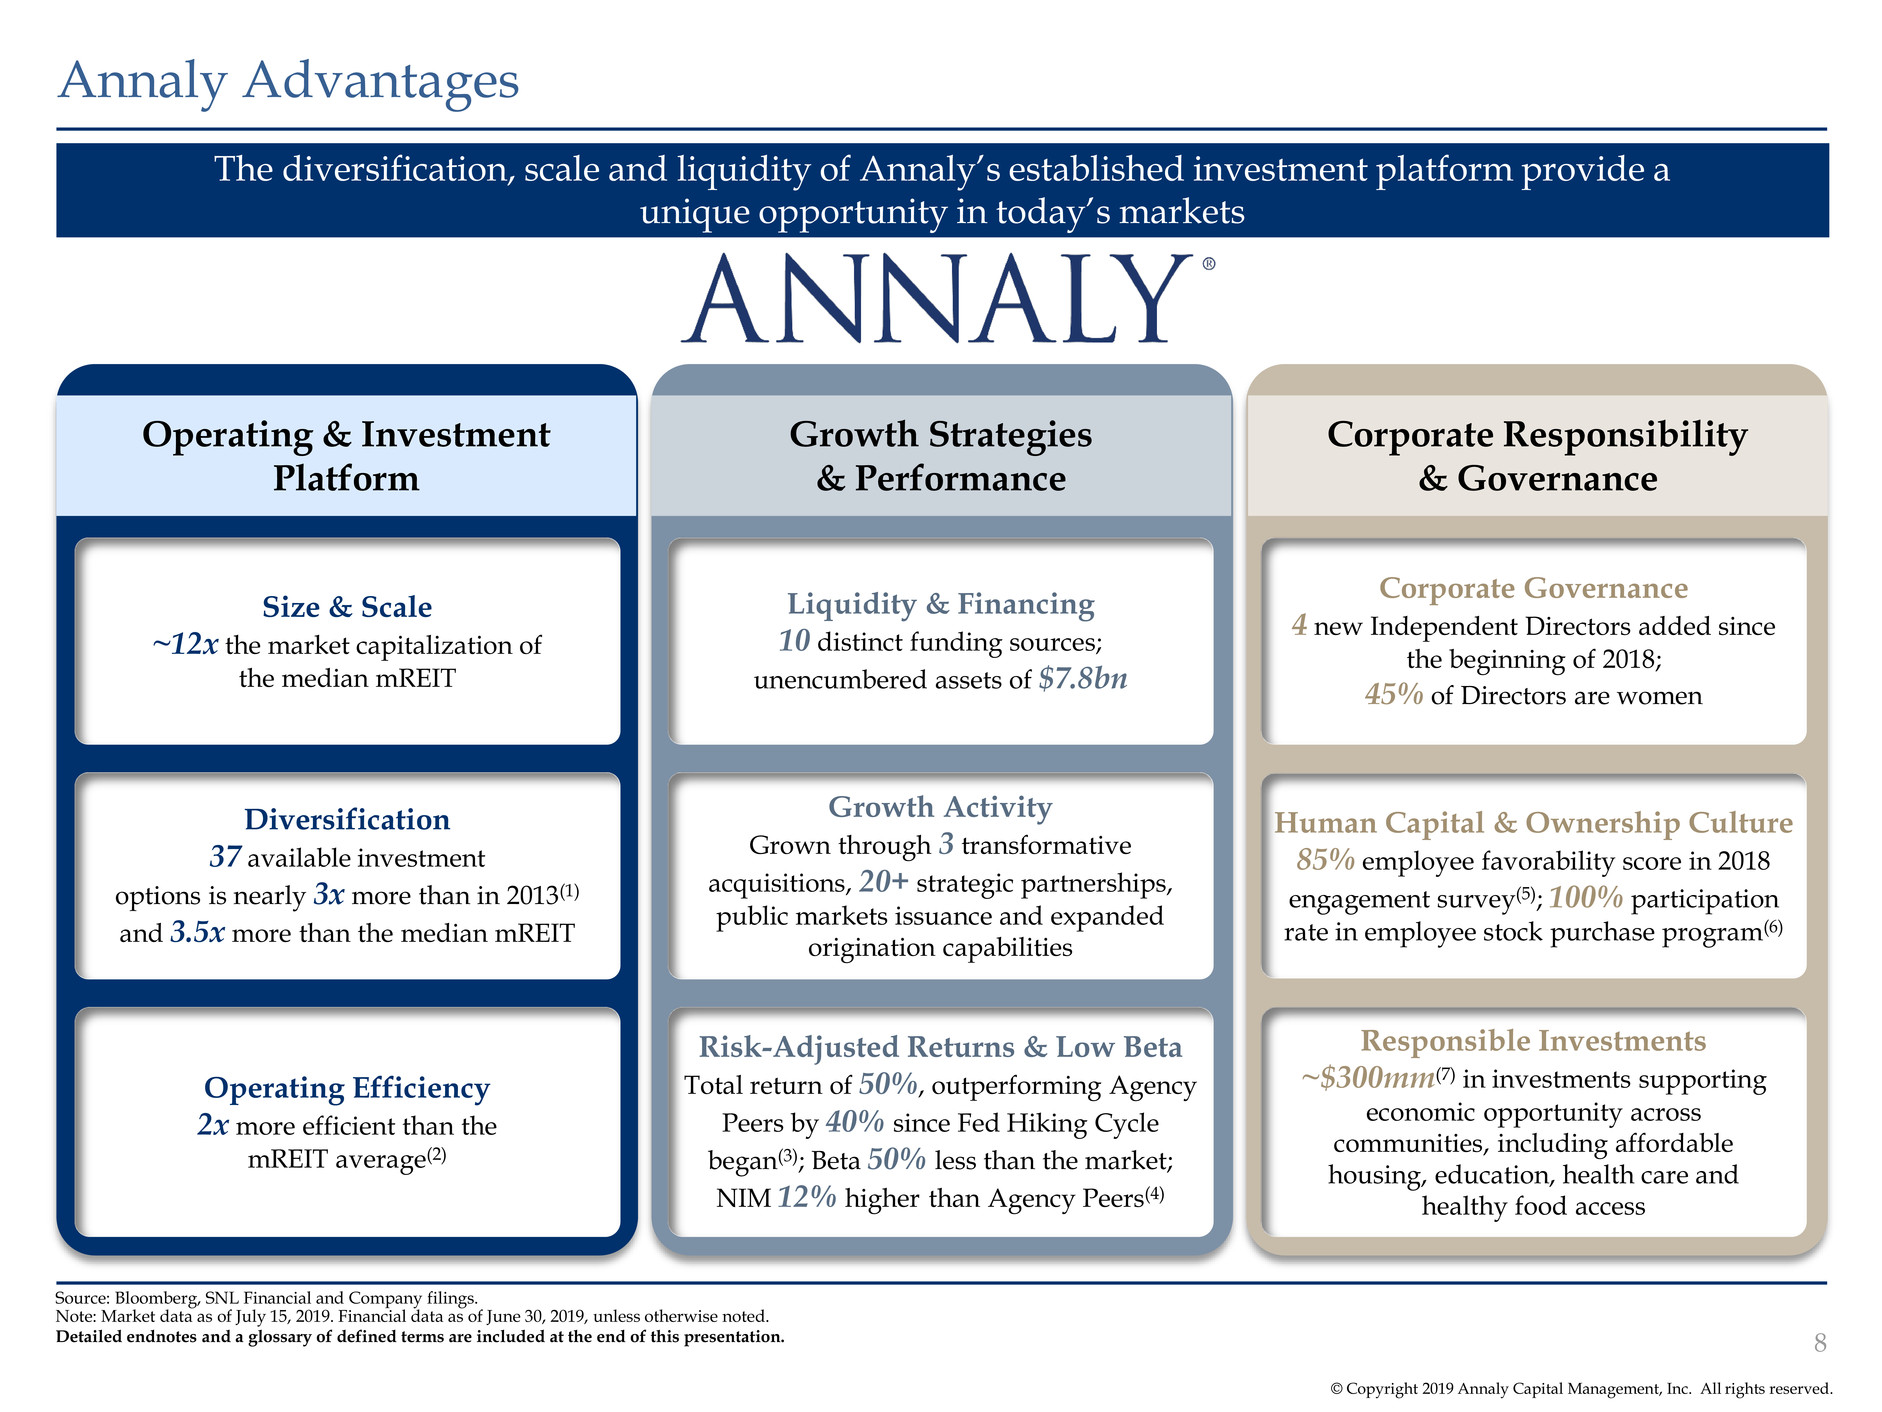
© Copyright 2019 Annaly Capital Management, Inc. All rights reserved. 8 The diversification, scale and liquidity of Annaly’s established investment platform provide a unique opportunity in today’s markets Annaly Advantages Source: Bloomberg, SNL Financial and Company filings. Note: Market data as of July 15, 2019. Financial data as of June 30, 2019, unless otherwise noted. Detailed endnotes and a glossary of defined terms are included at the end of this presentation. Operating & Investment Platform Growth Strategies & Performance Corporate Responsibility & Governance Diversification 37 available investment options is nearly 3x more than in 2013(1) and 3.5x more than the median mREIT Size & Scale ~12x the market capitalization of the median mREIT Operating Efficiency 2x more efficient than the mREIT average(2) Growth Activity Grown through 3 transformative acquisitions, 20+ strategic partnerships, public markets issuance and expanded origination capabilities Risk-Adjusted Returns & Low Beta Total return of 50%, outperforming Agency Peers by 40% since Fed Hiking Cycle began(3); Beta 50% less than the market; NIM 12% higher than Agency Peers(4) Liquidity & Financing 10 distinct funding sources; unencumbered assets of $7.8bn Corporate Governance 4 new Independent Directors added since the beginning of 2018; 45% of Directors are women Human Capital & Ownership Culture 85% employee favorability score in 2018 engagement survey(5); 100% participation rate in employee stock purchase program(6) Responsible Investments ~$300mm(7) in investments supporting economic opportunity across communities, including affordable housing, education, health care and healthy food access
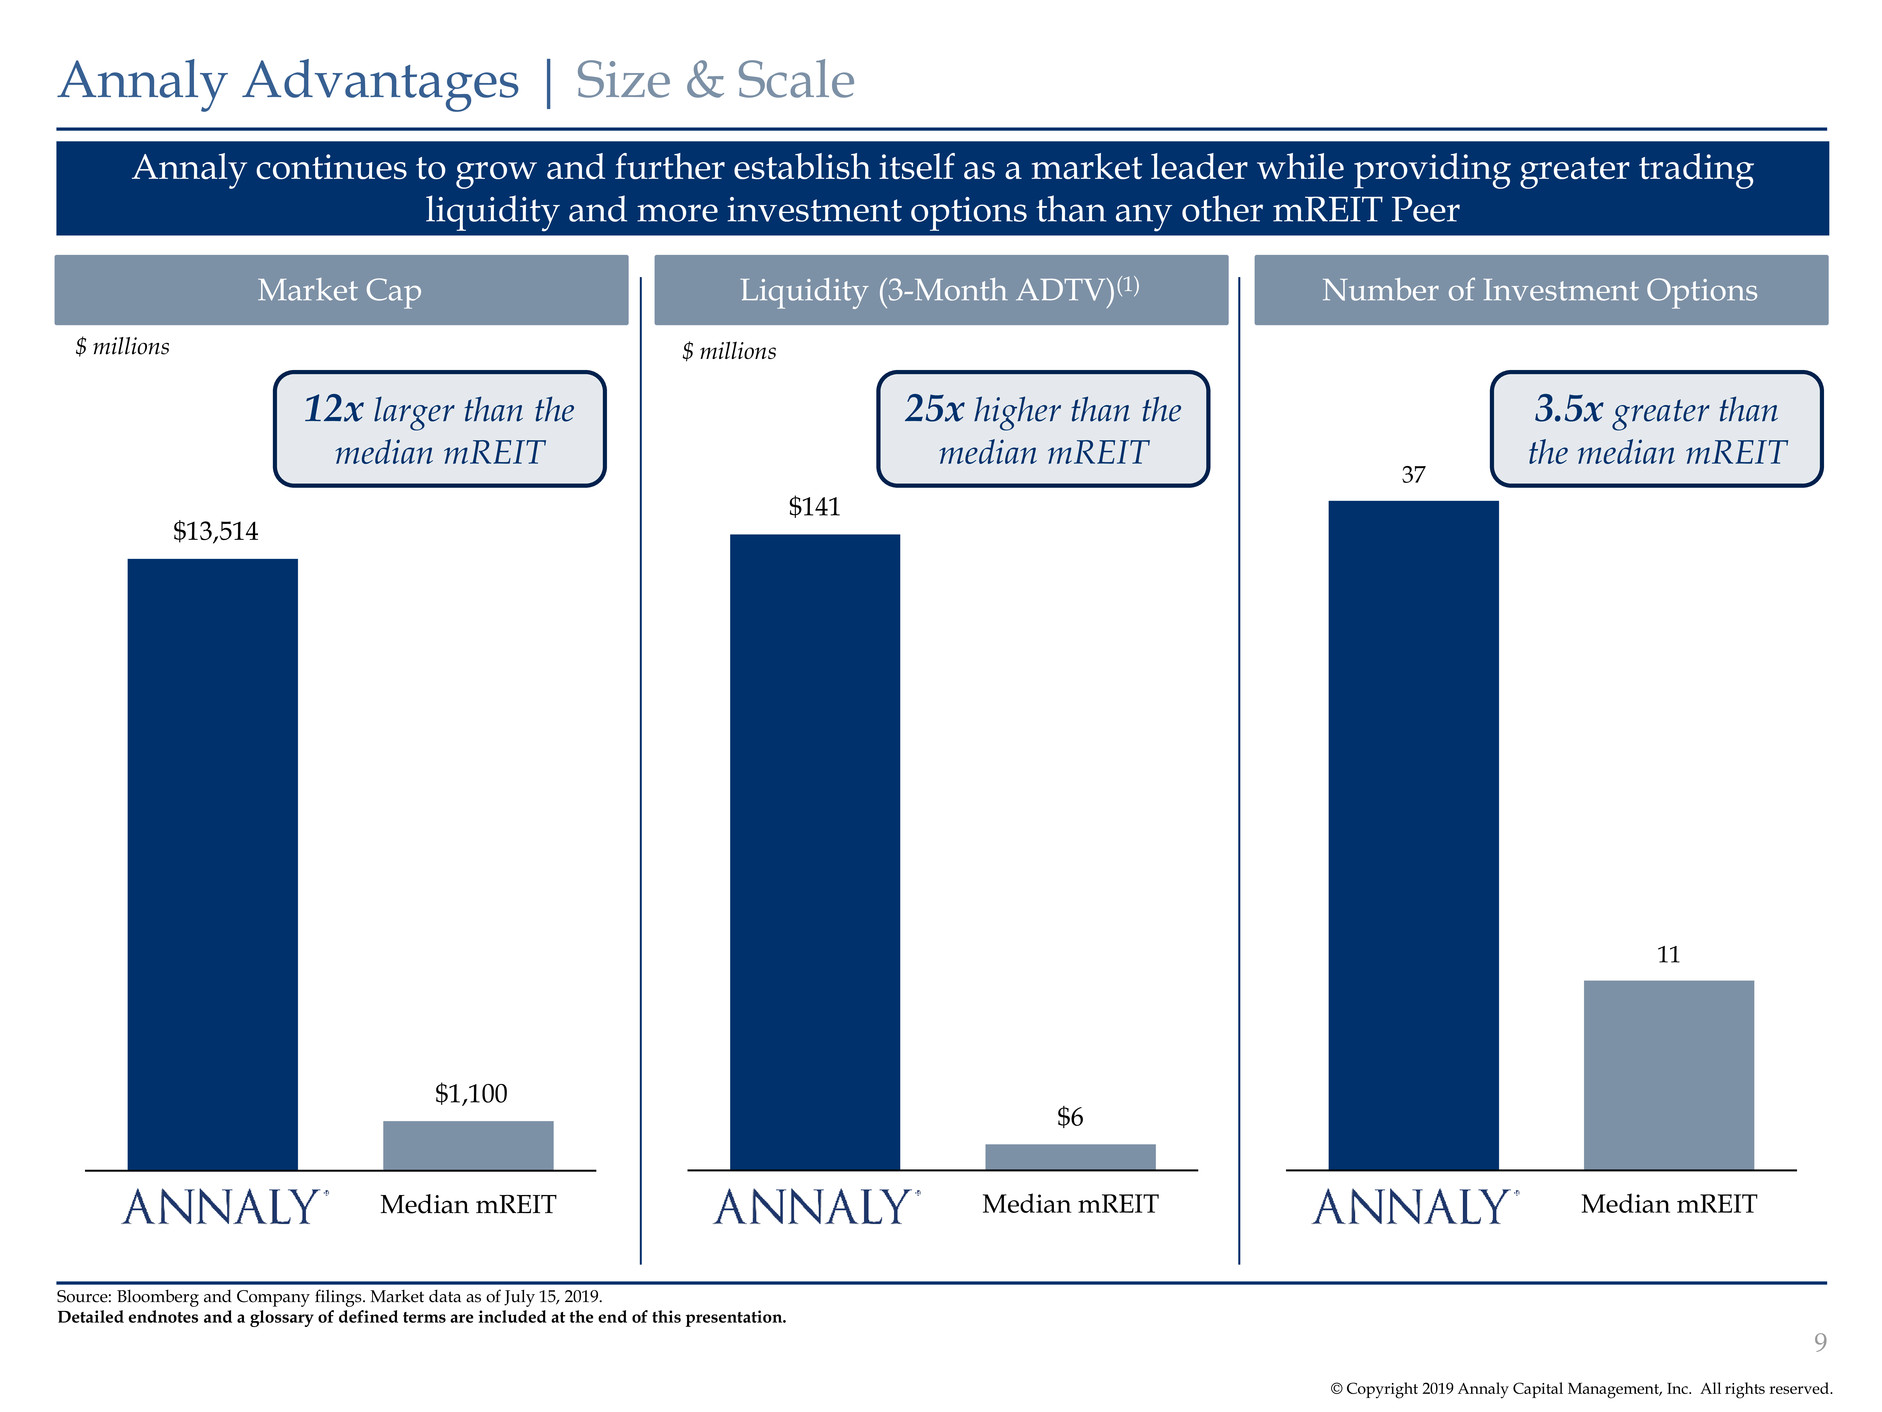
© Copyright 2019 Annaly Capital Management, Inc. All rights reserved. 37 11 Annaly Median mREIT Annaly continues to grow and further establish itself as a market leader while providing greater trading liquidity and more investment options than any other mREIT Peer Annaly Advantages | Size & Scale 9 Source: Bloomberg and Company filings. Market data as of July 15, 2019. Detailed endnotes and a glossary of defined terms are included at the end of this presentation. $13,514 $1,100 Annaly Median mREIT $141 $6 Annaly Median mREIT 12x larger than the median mREIT 25x higher than the median mREIT 3.5x greater than the median mREIT Market Cap Liquidity (3-Month ADTV)(1) Number of Investment Options $ millions $ millions

© Copyright 2019 Annaly Capital Management, Inc. All rights reserved. 2.0% 4.0% 6.6% 13.5% 28.1% 48.6% 80.4% 53.7% NLY mREIT Peers Equity REITs MLPs Select Financials Utilities Consumer Staples S&P 500 Yield Sectors(2): 35.4% Annaly continues to further scale its diversified platform while operating more efficiently than the Yield Sectors and mREIT Peers OpEx as % of Average Equity(1) Annaly Advantages | Operating Efficiency Helps Drive Performance 10 Source: Bloomberg and Company filings. Financial data as of March 31, 2019. Detailed endnotes and a glossary of defined terms are included at the end of this presentation. Efficiency: More efficient than the S&P 500, Yield Sectors and mREIT Peers by 27x, 18x and 2x, respectively
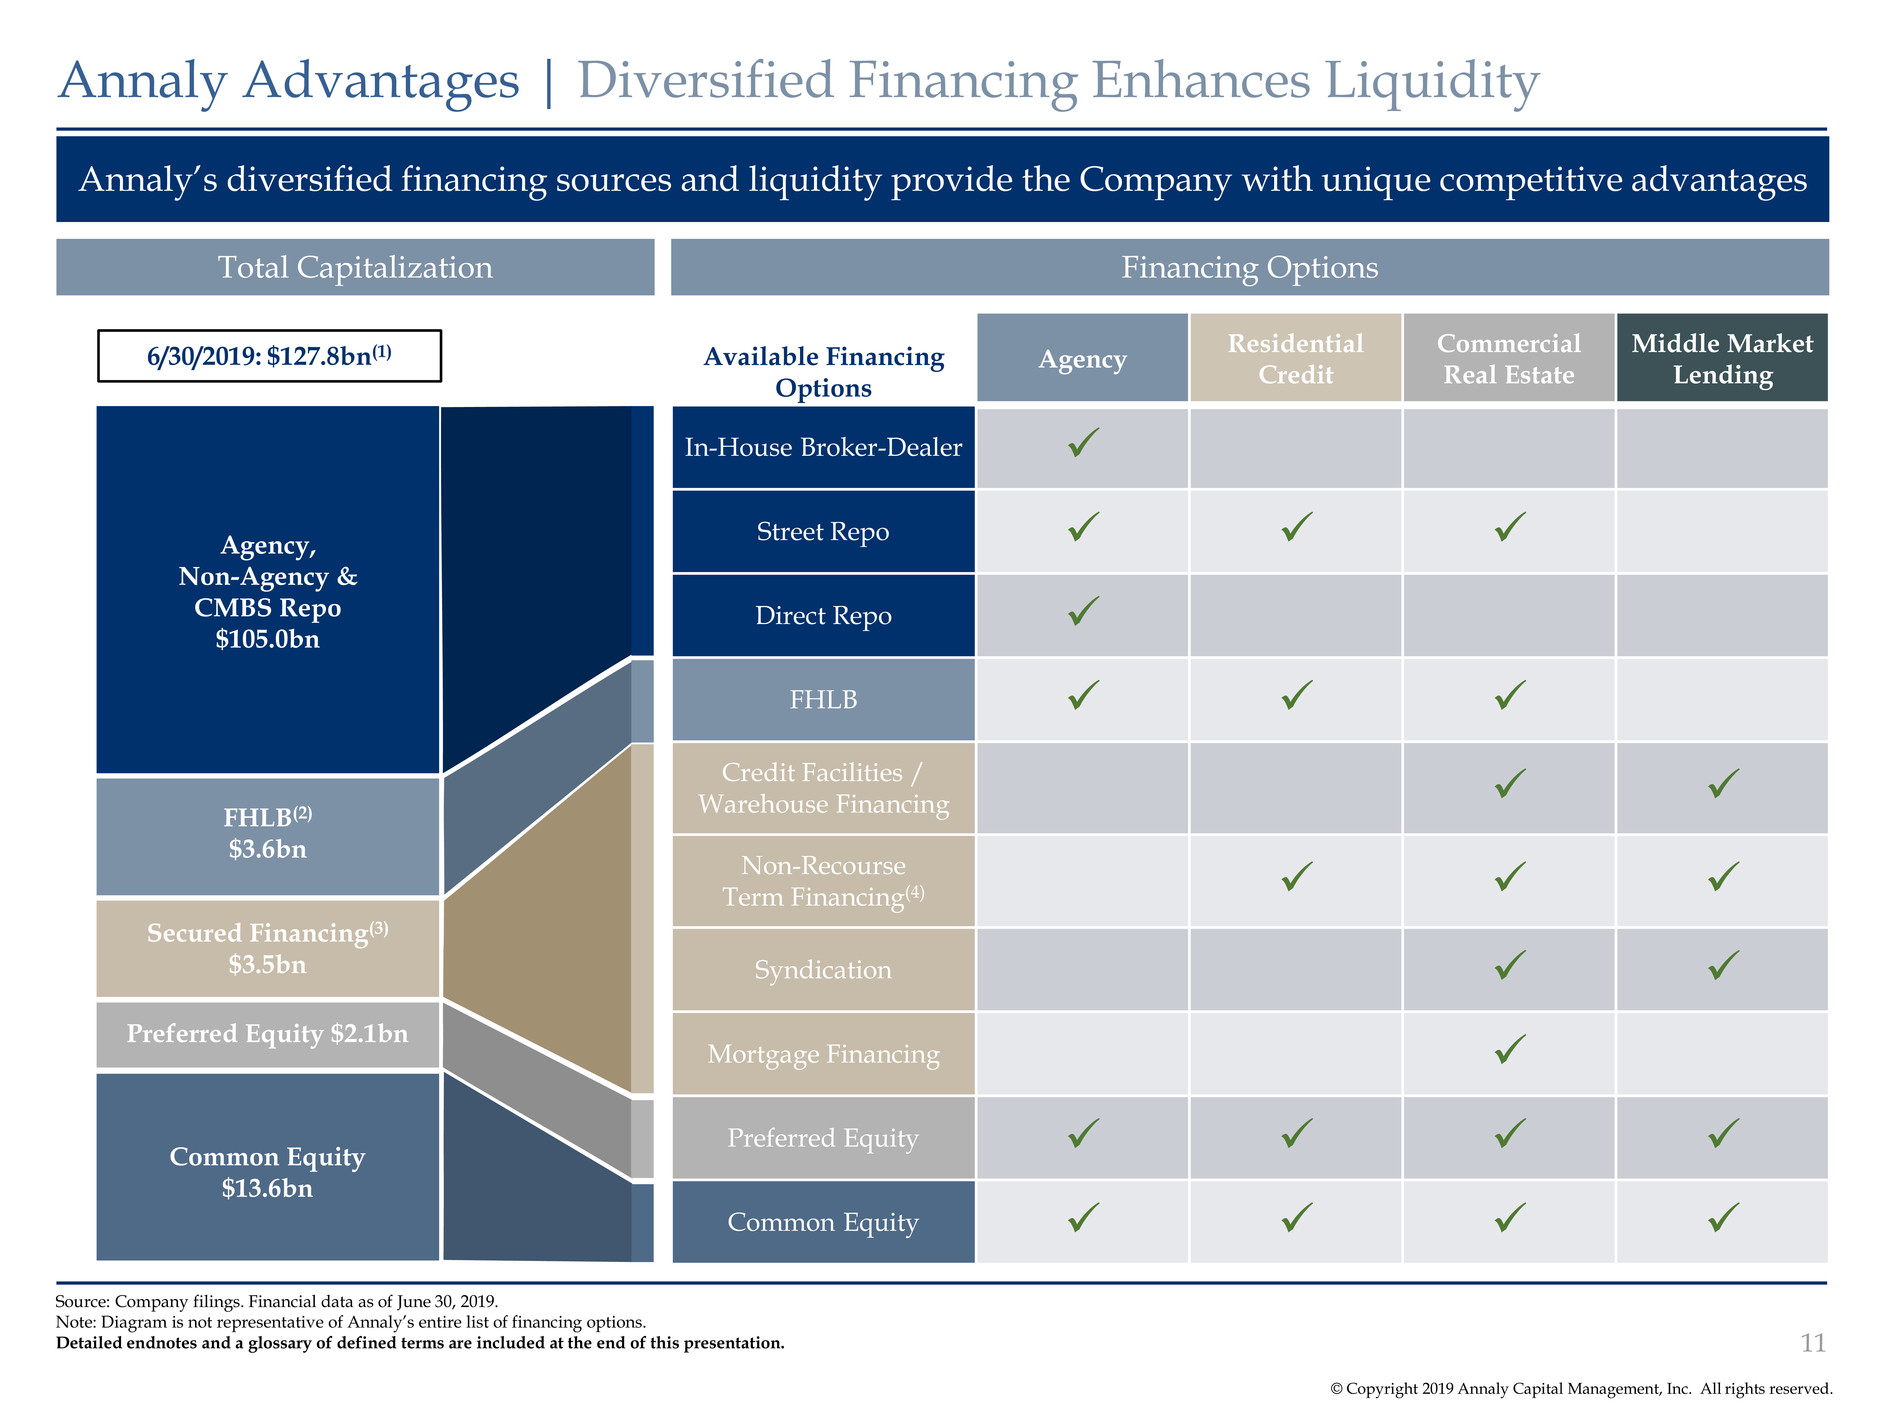
© Copyright 2019 Annaly Capital Management, Inc. All rights reserved. Annaly’s diversified financing sources and liquidity provide the Company with unique competitive advantages Annaly Advantages | Diversified Financing Enhances Liquidity 11 Source: Company filings. Financial data as of June 30, 2019. Note: Diagram is not representative of Annaly’s entire list of financing options. Detailed endnotes and a glossary of defined terms are included at the end of this presentation. Total Capitalization Financing Options 6/30/2019: $127.8bn(1) Available Financing Options Agency Residential Credit Commercial Real Estate Middle Market Lending In-House Broker-Dealer Street Repo Direct Repo FHLB Credit Facilities / Warehouse Financing Non-Recourse Term Financing(4) Syndication Mortgage Financing Preferred Equity Common Equity Common Equity $13.6bn Preferred Equity $2.1bn Secured Financing(3) $3.5bn FHLB(2) $3.6bn Agency, Non-Agency & CMBS Repo $105.0bn
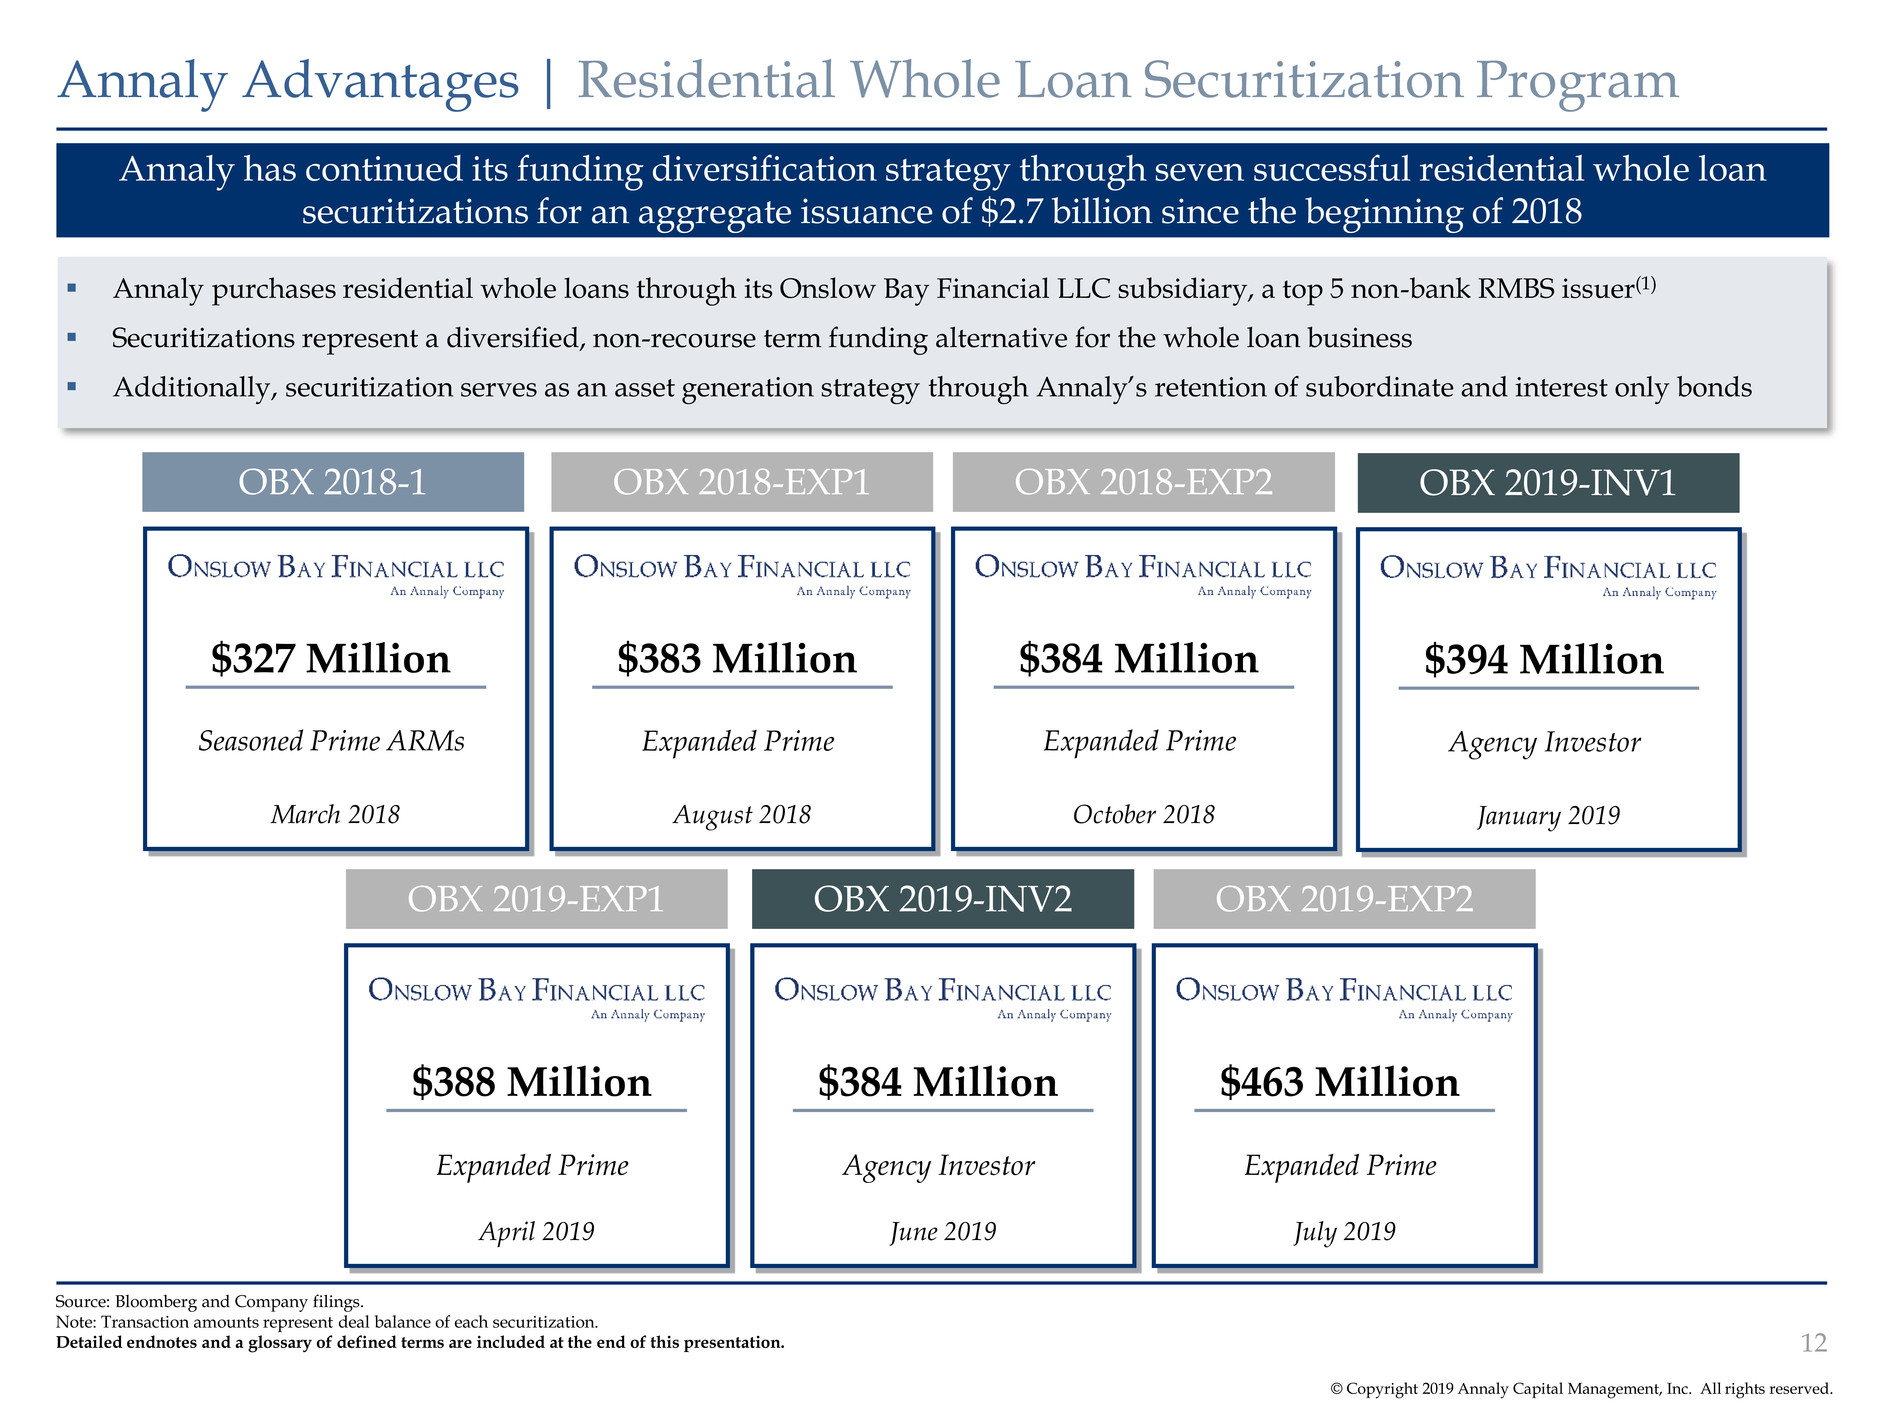
© Copyright 2019 Annaly Capital Management, Inc. All rights reserved. Annaly has continued its funding diversification strategy through seven successful residential whole loan securitizations for an aggregate issuance of $2.7 billion since the beginning of 2018 Annaly Advantages | Residential Whole Loan Securitization Program 12 Source: Bloomberg and Company filings. Note: Transaction amounts represent deal balance of each securitization. Detailed endnotes and a glossary of defined terms are included at the end of this presentation. Annaly purchases residential whole loans through its Onslow Bay Financial LLC subsidiary, a top 5 non-bank RMBS issuer(1) Securitizations represent a diversified, non-recourse term funding alternative for the whole loan business Additionally, securitization serves as an asset generation strategy through Annaly’s retention of subordinate and interest only bonds October 2018 $384 Million Expanded Prime OBX 2018-1 January 2019 $394 Million March 2018 $327 Million Seasoned Prime ARMs August 2018 $383 Million Expanded Prime OBX 2018-EXP1 OBX 2018-EXP2 OBX 2019-INV1 Agency Investor July 2019 $463 Million Expanded Prime April 2019 $388 Million Expanded Prime June 2019 $384 Million OBX 2019-EXP1 OBX 2019-INV2 OBX 2019-EXP2 Agency Investor
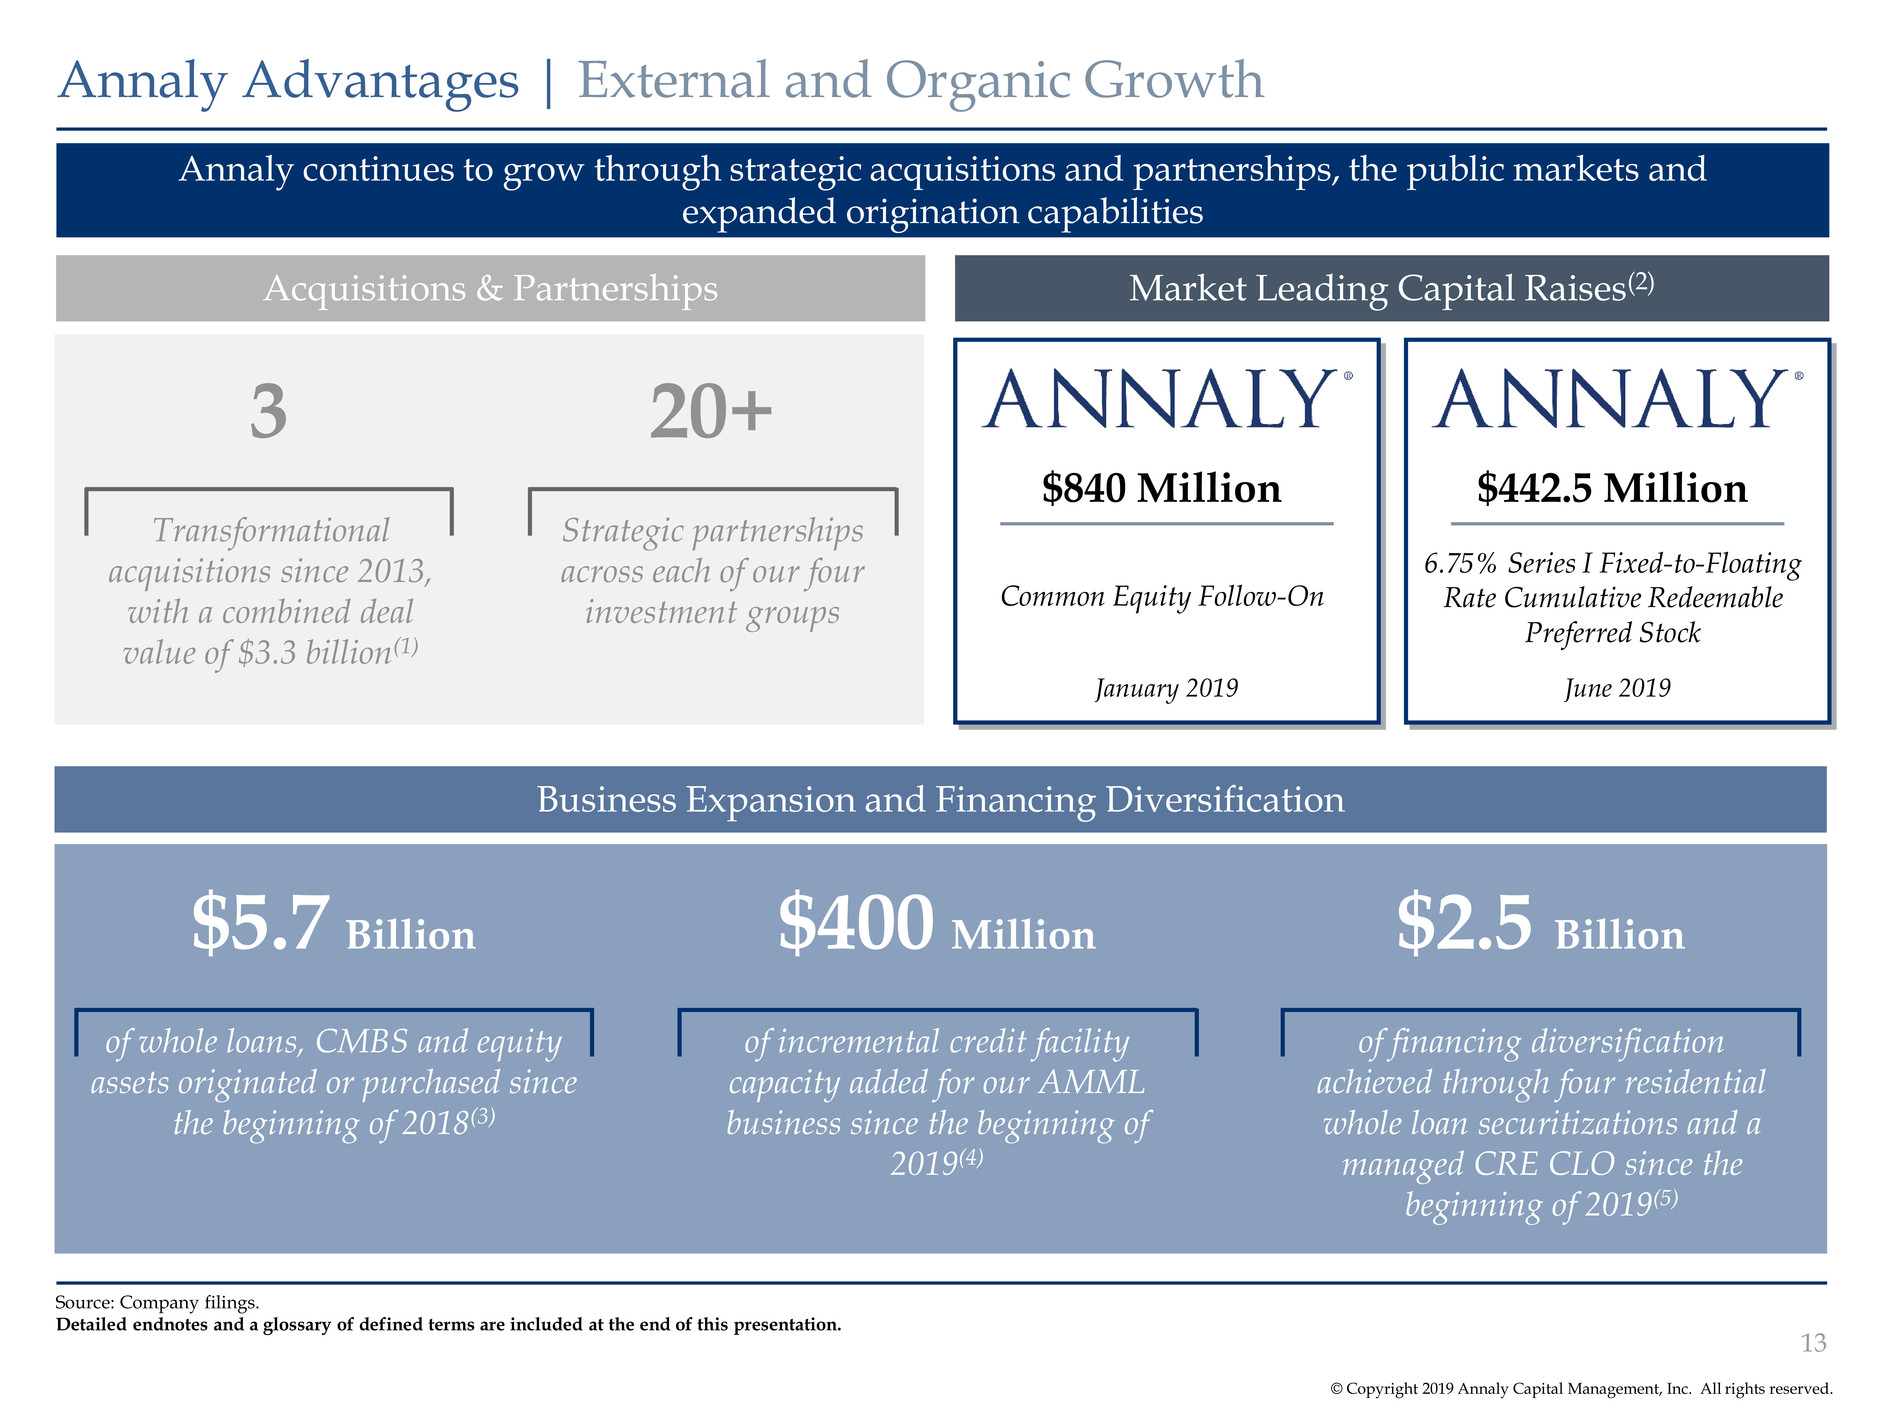
© Copyright 2019 Annaly Capital Management, Inc. All rights reserved. Annaly continues to grow through strategic acquisitions and partnerships, the public markets and expanded origination capabilities Annaly Advantages | External and Organic Growth 13 Source: Company filings. Detailed endnotes and a glossary of defined terms are included at the end of this presentation. Market Leading Capital Raises(2) January 2019 $840 Million Common Equity Follow-On Acquisitions & Partnerships June 2019 $442.5 Million 6.75% Series I Fixed-to-Floating Rate Cumulative Redeemable Preferred Stock Business Expansion and Financing Diversification of whole loans, CMBS and equity assets originated or purchased since the beginning of 2018(3) $5.7 Billion of incremental credit facility capacity added for our AMML business since the beginning of 2019(4) $400 Million of financing diversification achieved through four residential whole loan securitizations and a managed CRE CLO since the beginning of 2019(5) $2.5 Billion Transformational acquisitions since 2013, with a combined deal value of $3.3 billion(1) Strategic partnerships across each of our four investment groups 3 20+
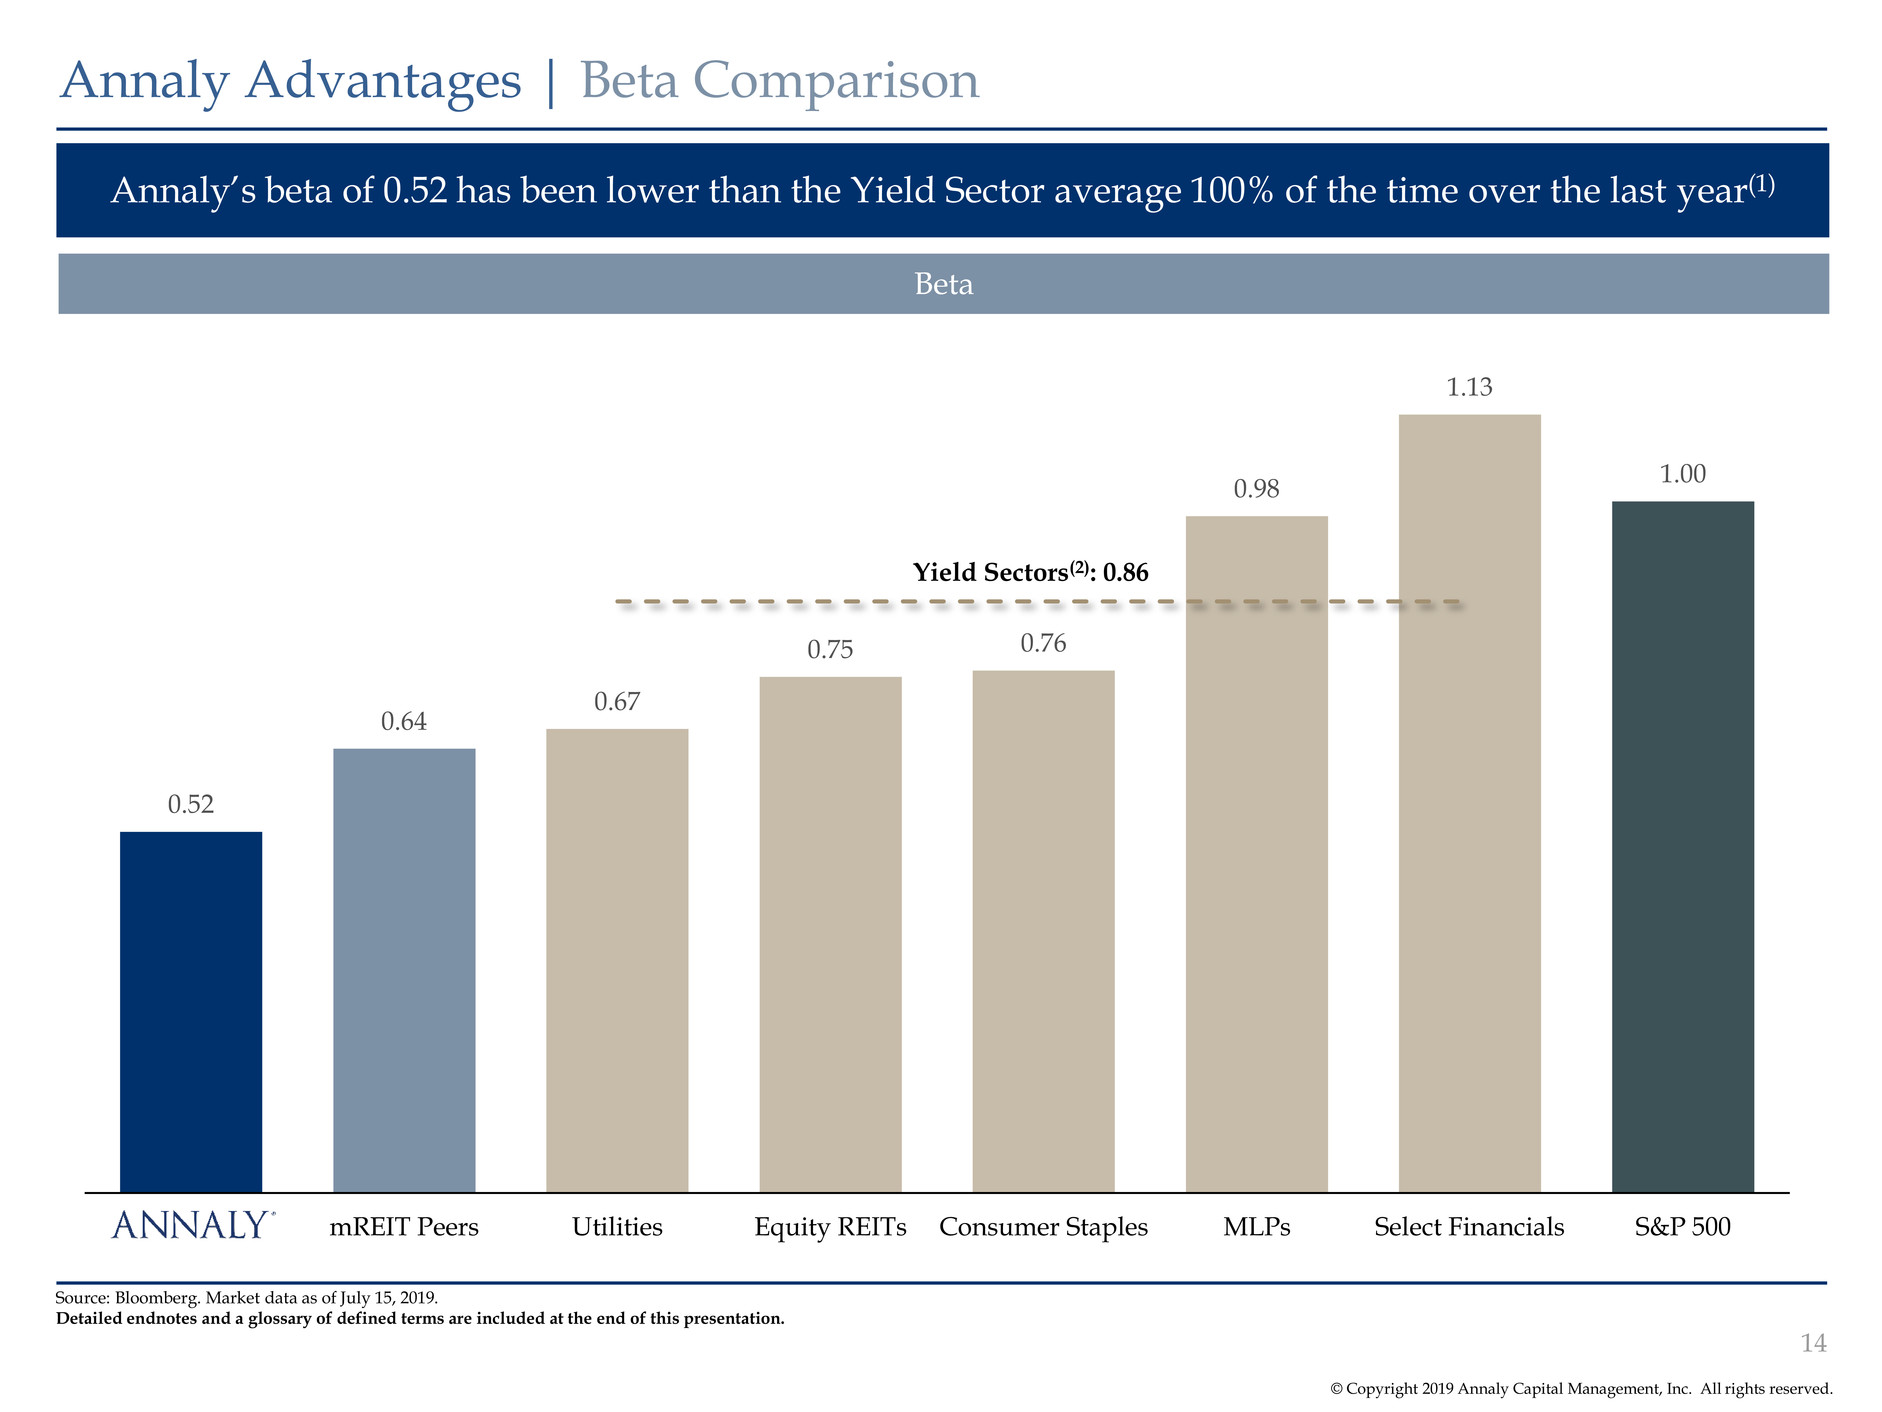
© Copyright 2019 Annaly Capital Management, Inc. All rights reserved. 0.52 0.64 0.67 0.75 0.76 0.98 1.13 1.00 mREIT Peers Utilities Equity REITs Consumer Staples MLPs Select Financials S&P 500 Yield Sectors(2): 0.86 Annaly’s beta of 0.52 has been lower than the Yield Sector average 100% of the time over the last year(1) Annaly Advantages | Beta Comparison 14 Source: Bloomberg. Market data as of July 15, 2019. Detailed endnotes and a glossary of defined terms are included at the end of this presentation. Beta

© Copyright 2019 Annaly Capital Management, Inc. All rights reserved. Annaly strives for best-in-class corporate responsibility and governance practices Annaly Advantages | Corporate Responsibility & Governance Note: Company statistics as of December 31, 2018, unless otherwise noted. Financial data as of June 30, 2019. Detailed endnotes and a glossary of defined terms are included at the end of this presentation. Corporate Governance Human Capital Ownership Culture 15 Responsible Investments 45% of Directors are women, which compares to 26% on average for the S&P 500(1) 82% of Directors are independent Balanced tenure - 45% of Directors have tenure of 5 years or less 85% overall employee favorability score in 2018 engagement survey(2), a 25% increase since 2015 51% of employees identify as women or racially diverse 67% of new hires in 2019 YTD identify as women or racially diverse(3) Nearly $300 million(5) in investments that support economic opportunity across communities, including affordable housing, education, health care and healthy food access 2 social impact JVs supporting community development and affordable housing 100% of employees subject to Annaly’s broad-based Employee Stock Ownership Guidelines for over one year have purchased stock(3) Since 2014, Annaly NEOs have purchased $25 million of common stock 95% of CEO’s voluntary $15 million stock purchase commitment has been executed and all shares have been purchased in the open market(4)
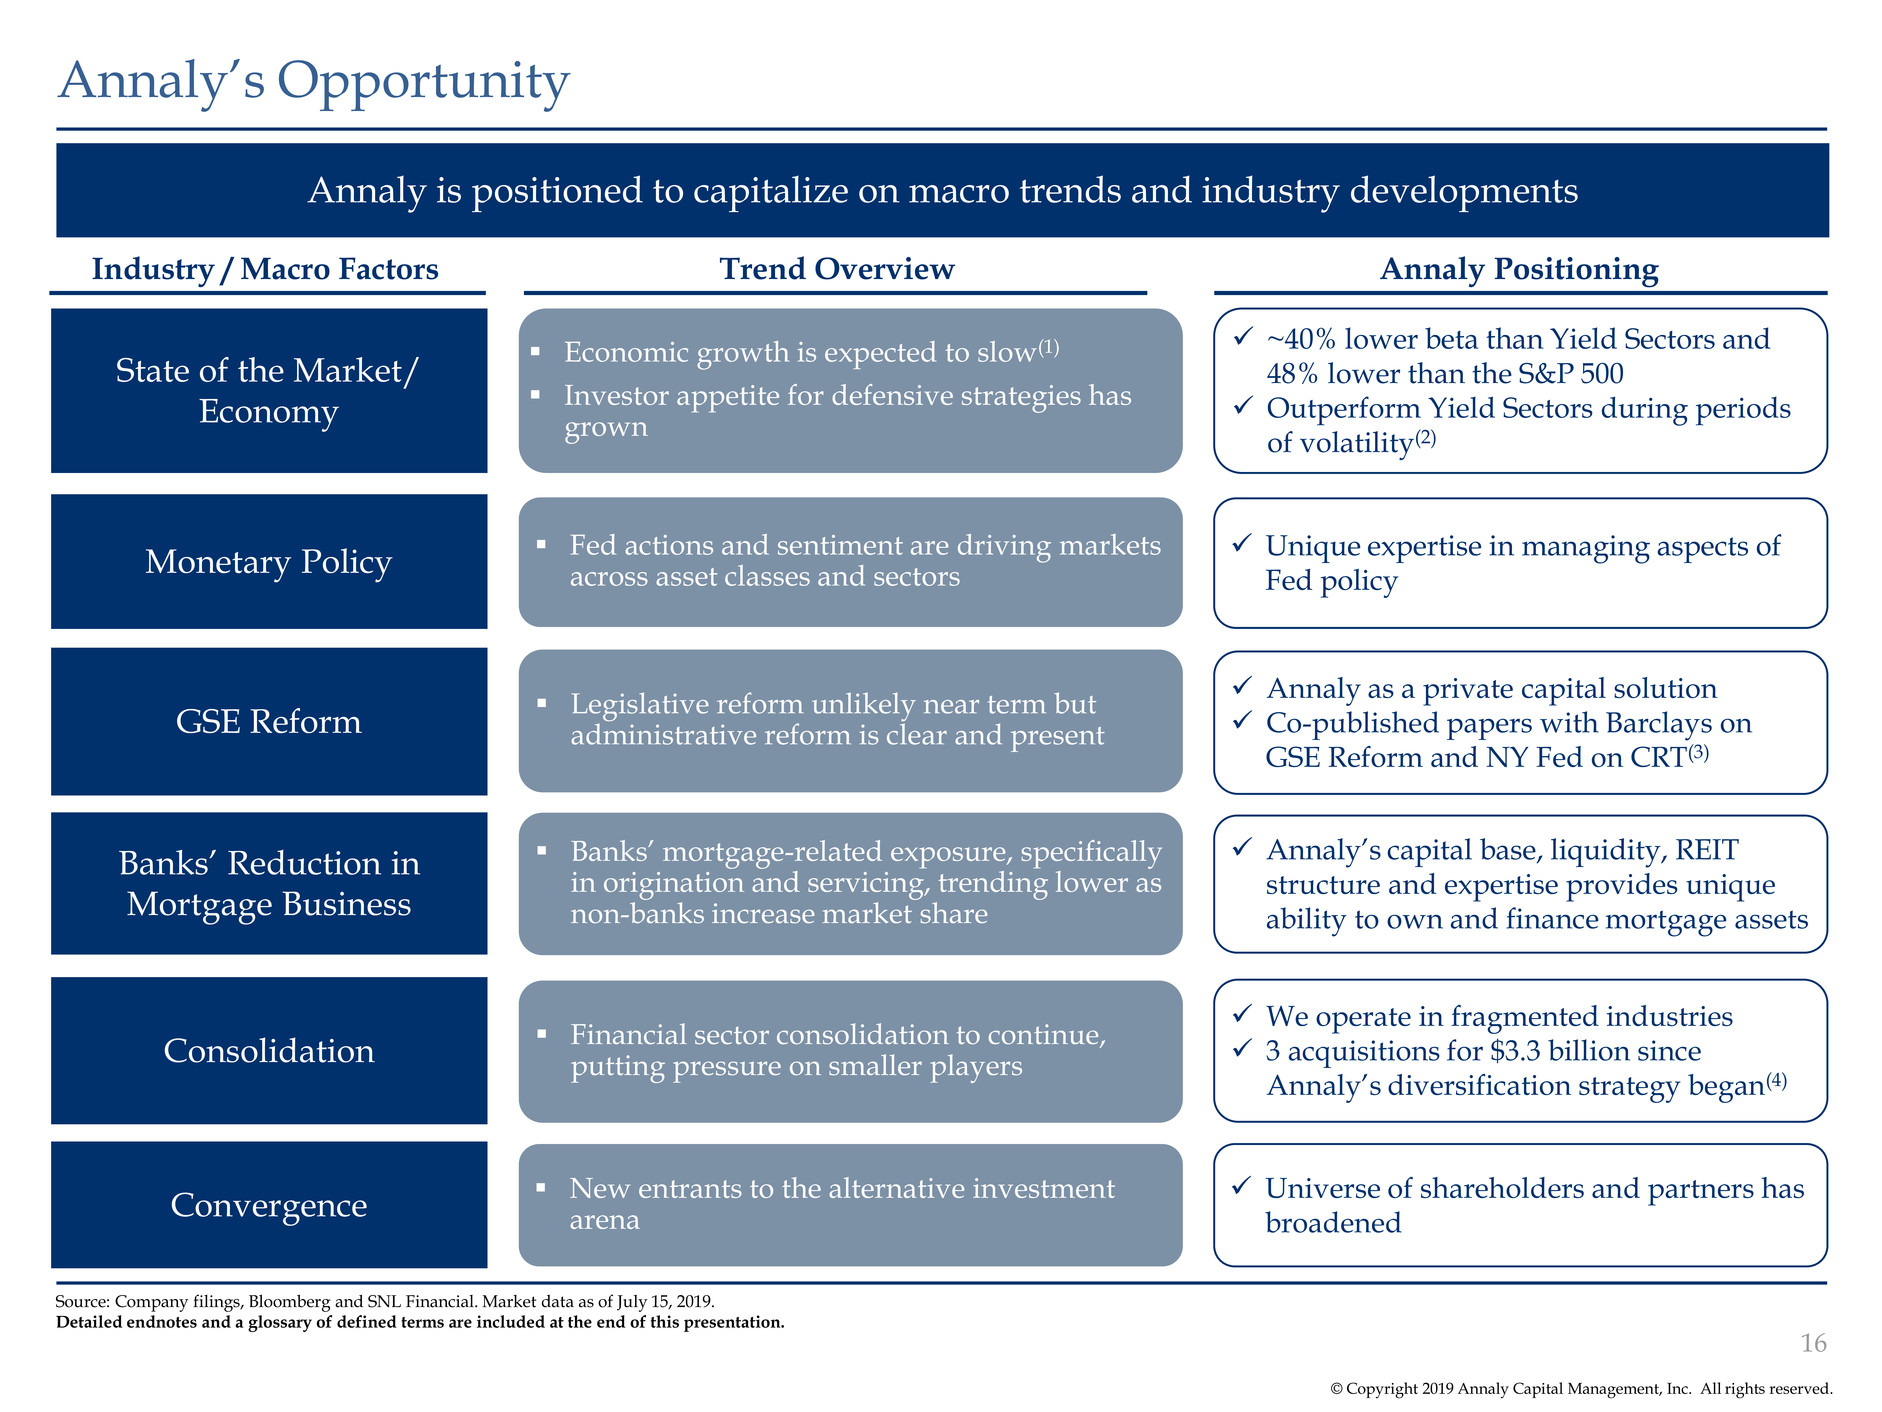
© Copyright 2019 Annaly Capital Management, Inc. All rights reserved. Annaly is positioned to capitalize on macro trends and industry developments Annaly’s Opportunity 16 Source: Company filings, Bloomberg and SNL Financial. Market data as of July 15, 2019. Detailed endnotes and a glossary of defined terms are included at the end of this presentation. Industry / Macro Factors Monetary Policy GSE Reform Convergence Economic growth is expected to slow(1) Investor appetite for defensive strategies has grown Fed actions and sentiment are driving markets across asset classes and sectors Legislative reform unlikely near term but administrative reform is clear and present Financial sector consolidation to continue, putting pressure on smaller players Trend Overview Annaly Positioning ~40% lower beta than Yield Sectors and 48% lower than the S&P 500 Outperform Yield Sectors during periods of volatility(2) Unique expertise in managing aspects of Fed policy Annaly as a private capital solution Co-published papers with Barclays on GSE Reform and NY Fed on CRT(3) We operate in fragmented industries 3 acquisitions for $3.3 billion since Annaly’s diversification strategy began(4) Universe of shareholders and partners has broadened Consolidation State of the Market/ Economy New entrants to the alternative investment arena Banks’ Reduction in Mortgage Business Banks’ mortgage-related exposure, specifically in origination and servicing, trending lower as non-banks increase market share Annaly’s capital base, liquidity, REIT structure and expertise provides unique ability to own and finance mortgage assets

Annaly's Positioning & Impact
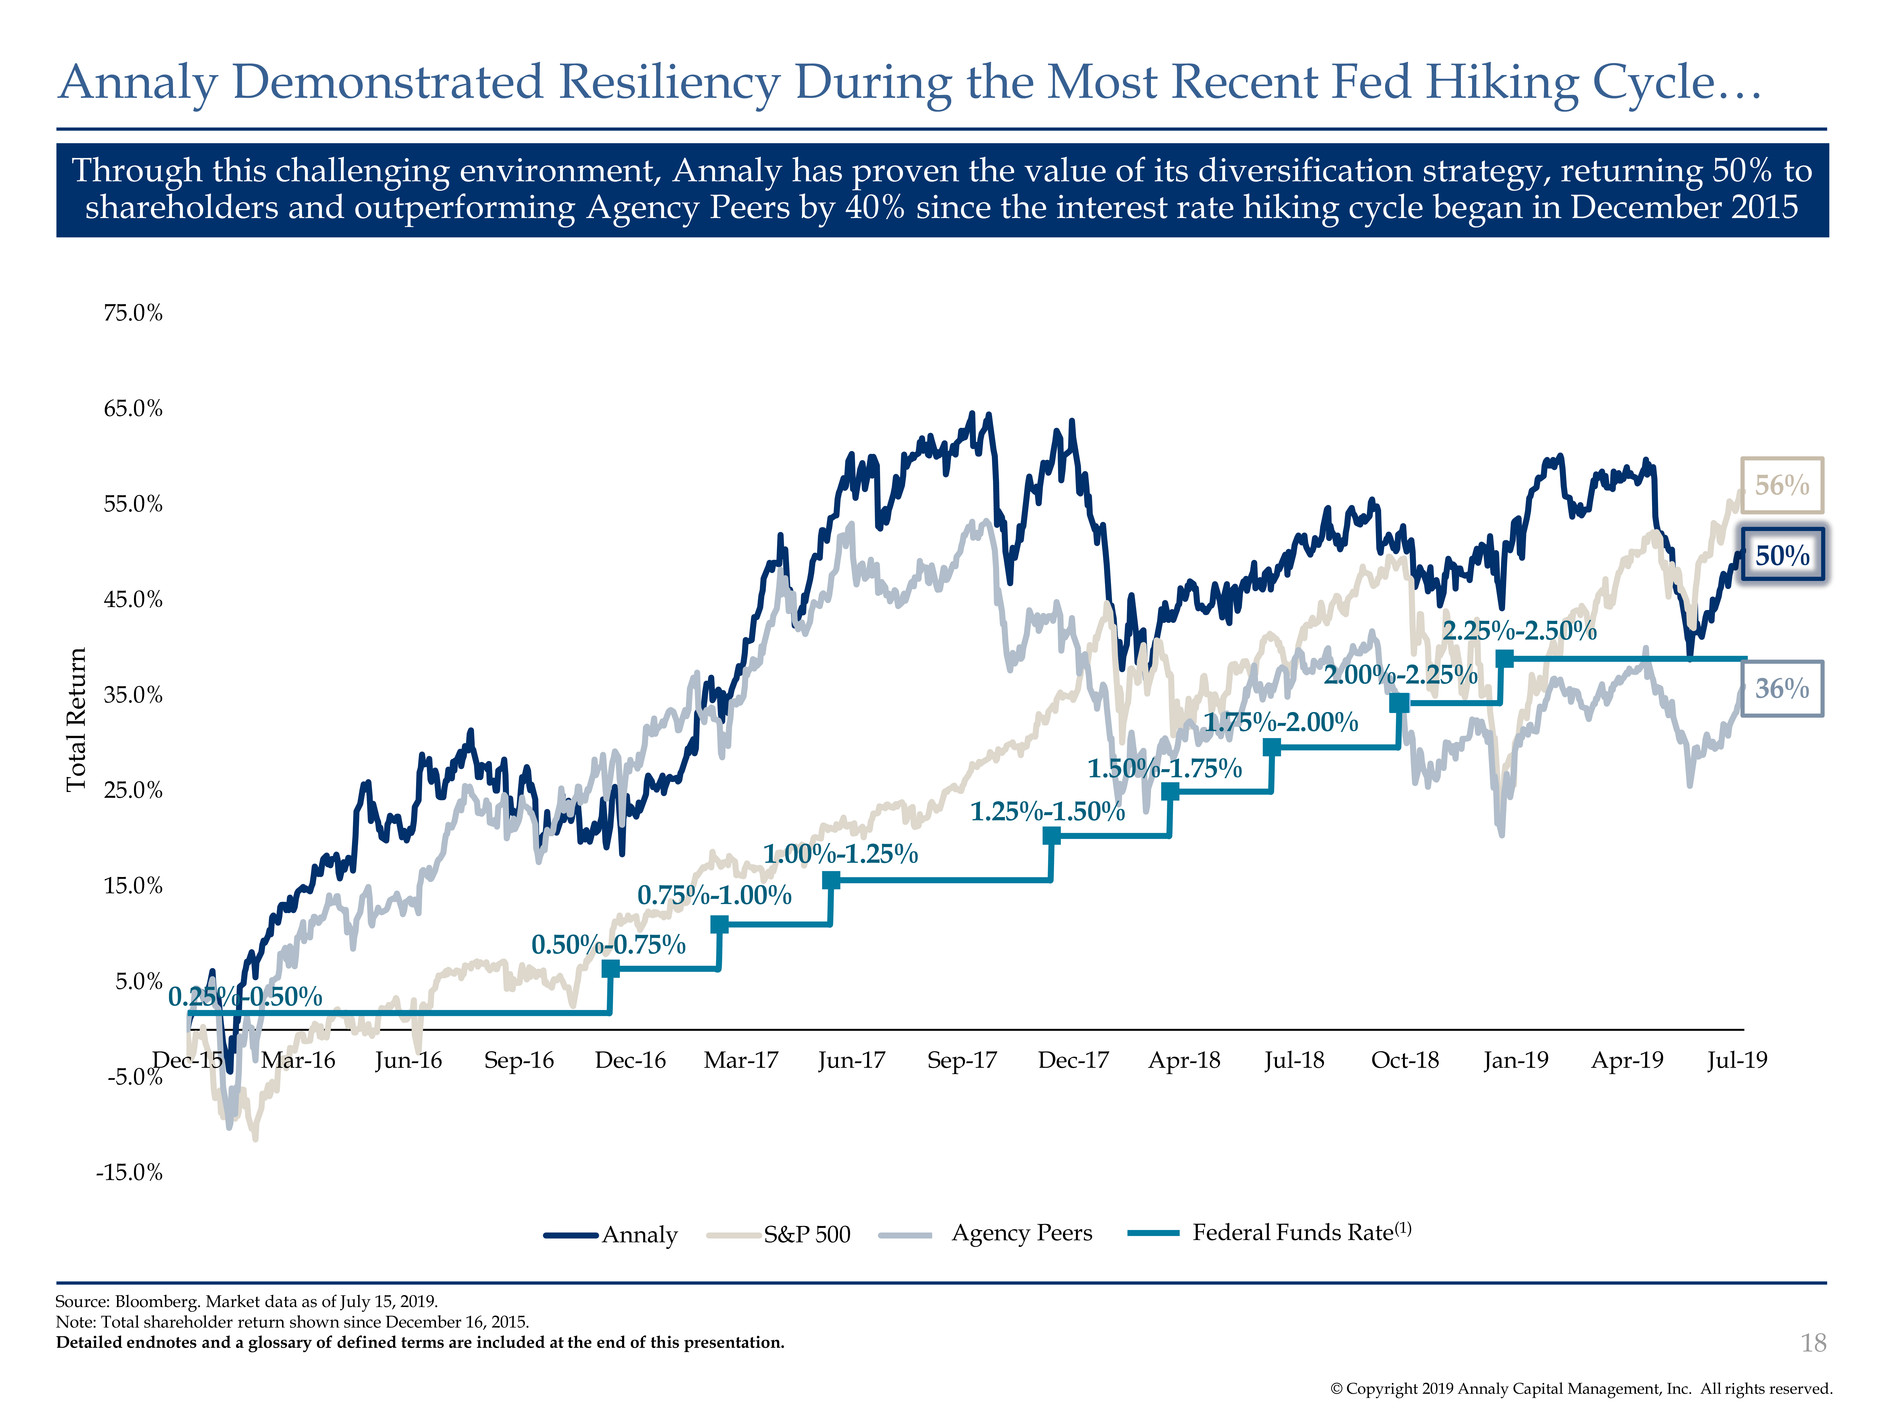
© Copyright 2019 Annaly Capital Management, Inc. All rights reserved. -15.0% -5.0% 5.0% 15.0% 25.0% 35.0% 45.0% 55.0% 65.0% 75.0% Dec-15 Mar-16 Jun-16 Sep-16 Dec-16 Mar-17 Jun-17 Sep-17 Dec-17 Apr-18 Jul-18 Oct-18 Jan-19 Apr-19 Jul-19 To ta l R etu rn Annaly S&P 500 Agency mREITs Through this challenging environment, Annaly has proven the value of its diversification strategy, returning 50% to shareholders and outperforming Agency Peers by 40% since the interest rate hiking cycle began in December 2015 Annaly Demonstrated Resiliency During the Most Recent Fed Hiking Cycle… 18 0.25%-0.50% 0.50%-0.75% 0.75%-1.00% 1.00%-1.25% 1.25%-1.50% 1.50%-1.75% 1.75%-2.00% 2.00%-2.25% 2.25%-2.50% Federal Funds Rate(1) 50% 36% 56% Source: Bloomberg. Market data as of July 15, 2019. Note: Total shareholder return shown since December 16, 2015. Detailed endnotes and a glossary of defined terms are included at the end of this presentation. Agency Peers
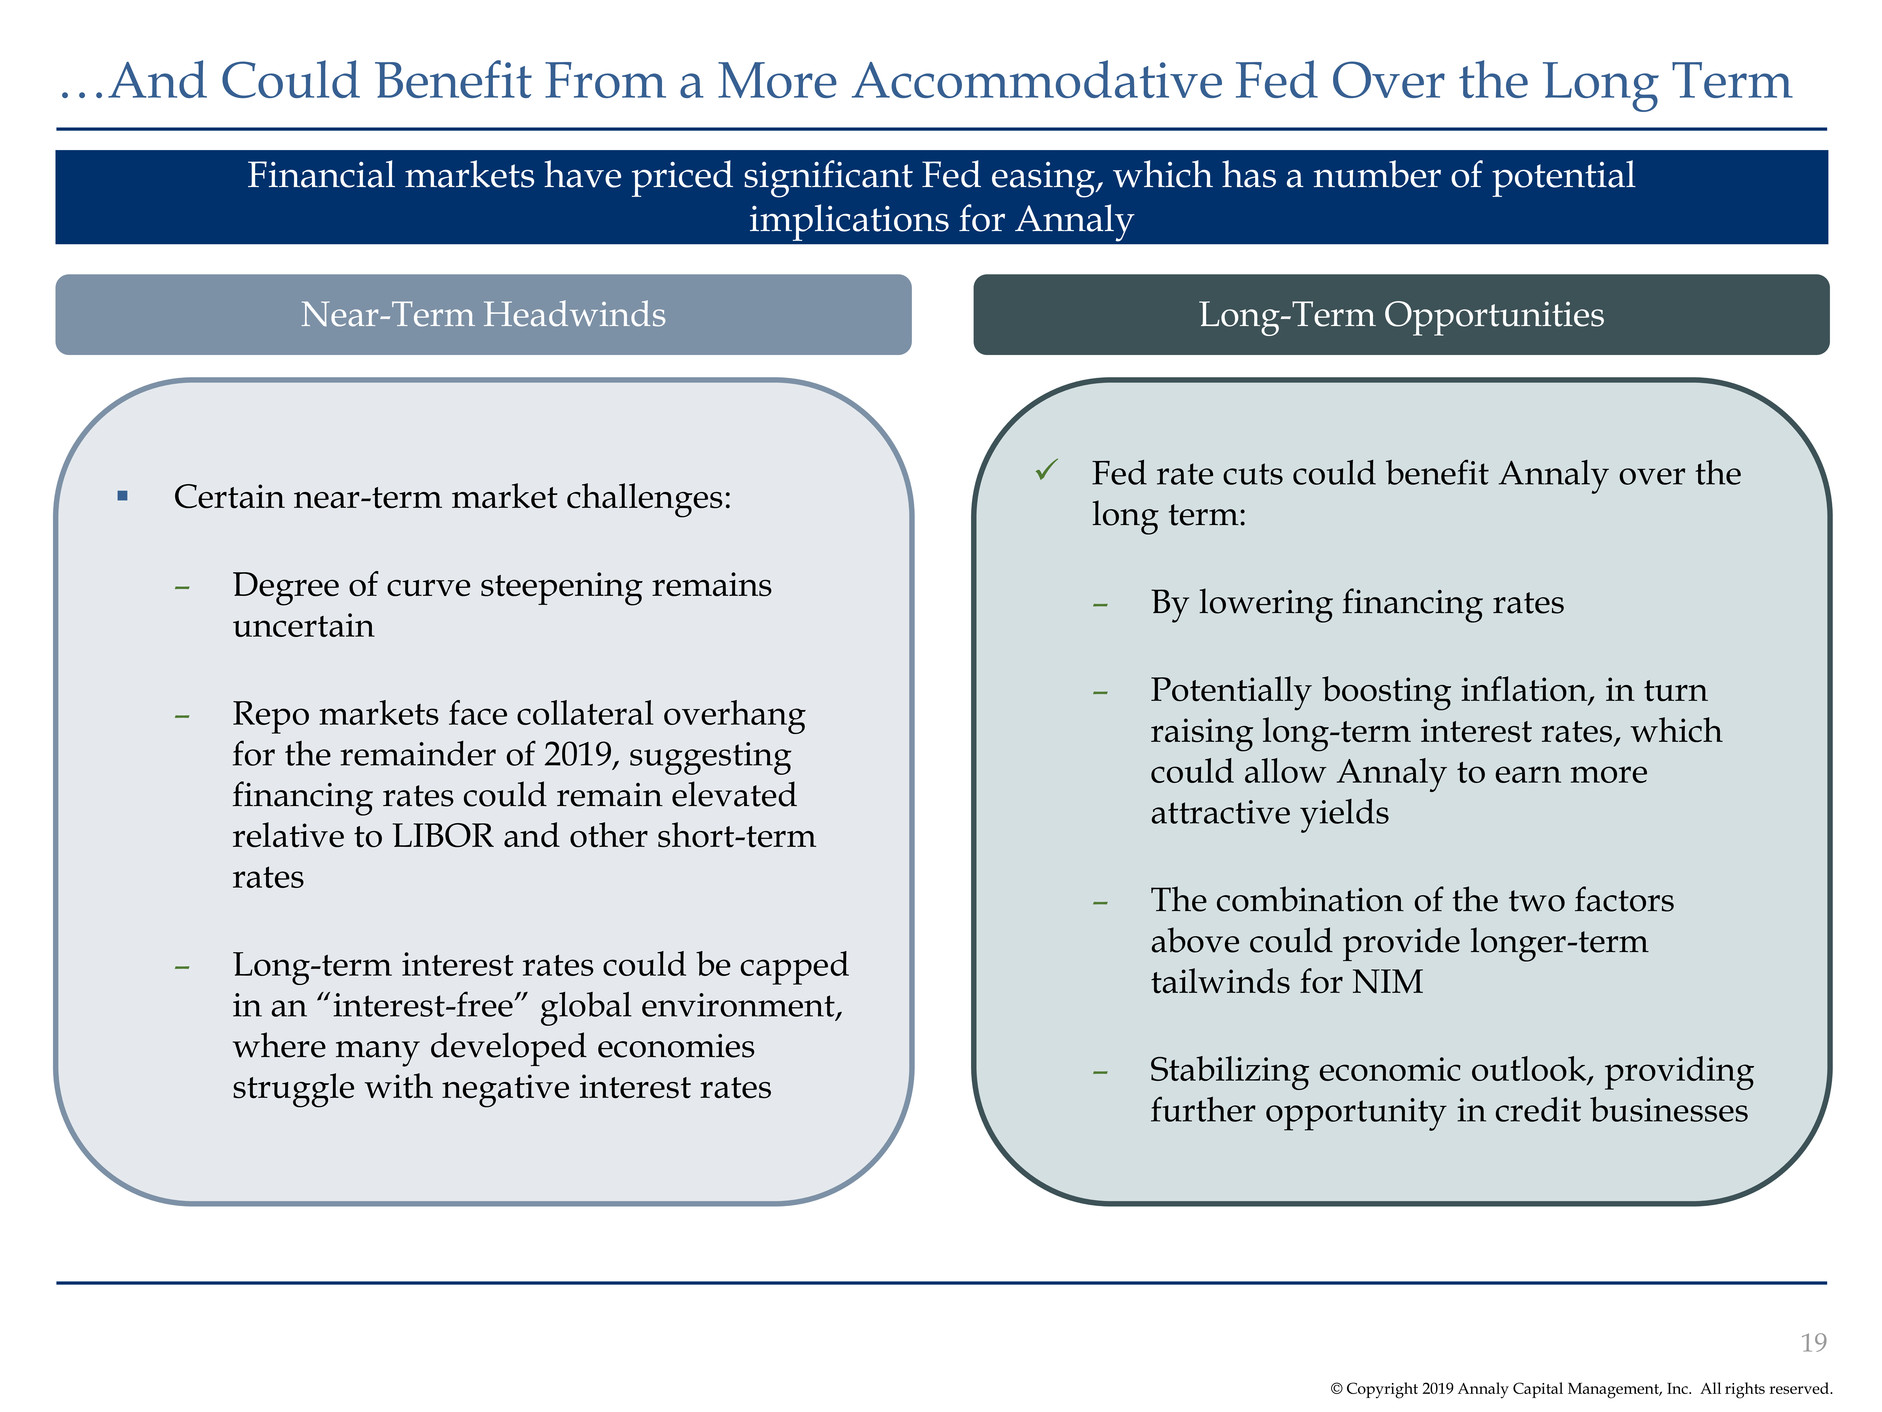
© Copyright 2019 Annaly Capital Management, Inc. All rights reserved. …And Could Benefit From a More Accommodative Fed Over the Long Term 19 Financial markets have priced significant Fed easing, which has a number of potential implications for Annaly Certain near-term market challenges: – Degree of curve steepening remains uncertain – Repo markets face collateral overhang for the remainder of 2019, suggesting financing rates could remain elevated relative to LIBOR and other short-term rates – Long-term interest rates could be capped in an “interest-free” global environment, where many developed economies struggle with negative interest rates Near-Term Headwinds Fed rate cuts could benefit Annaly over the long term: – By lowering financing rates – Potentially boosting inflation, in turn raising long-term interest rates, which could allow Annaly to earn more attractive yields – The combination of the two factors above could provide longer-term tailwinds for NIM – Stabilizing economic outlook, providing further opportunity in credit businesses Long-Term Opportunities
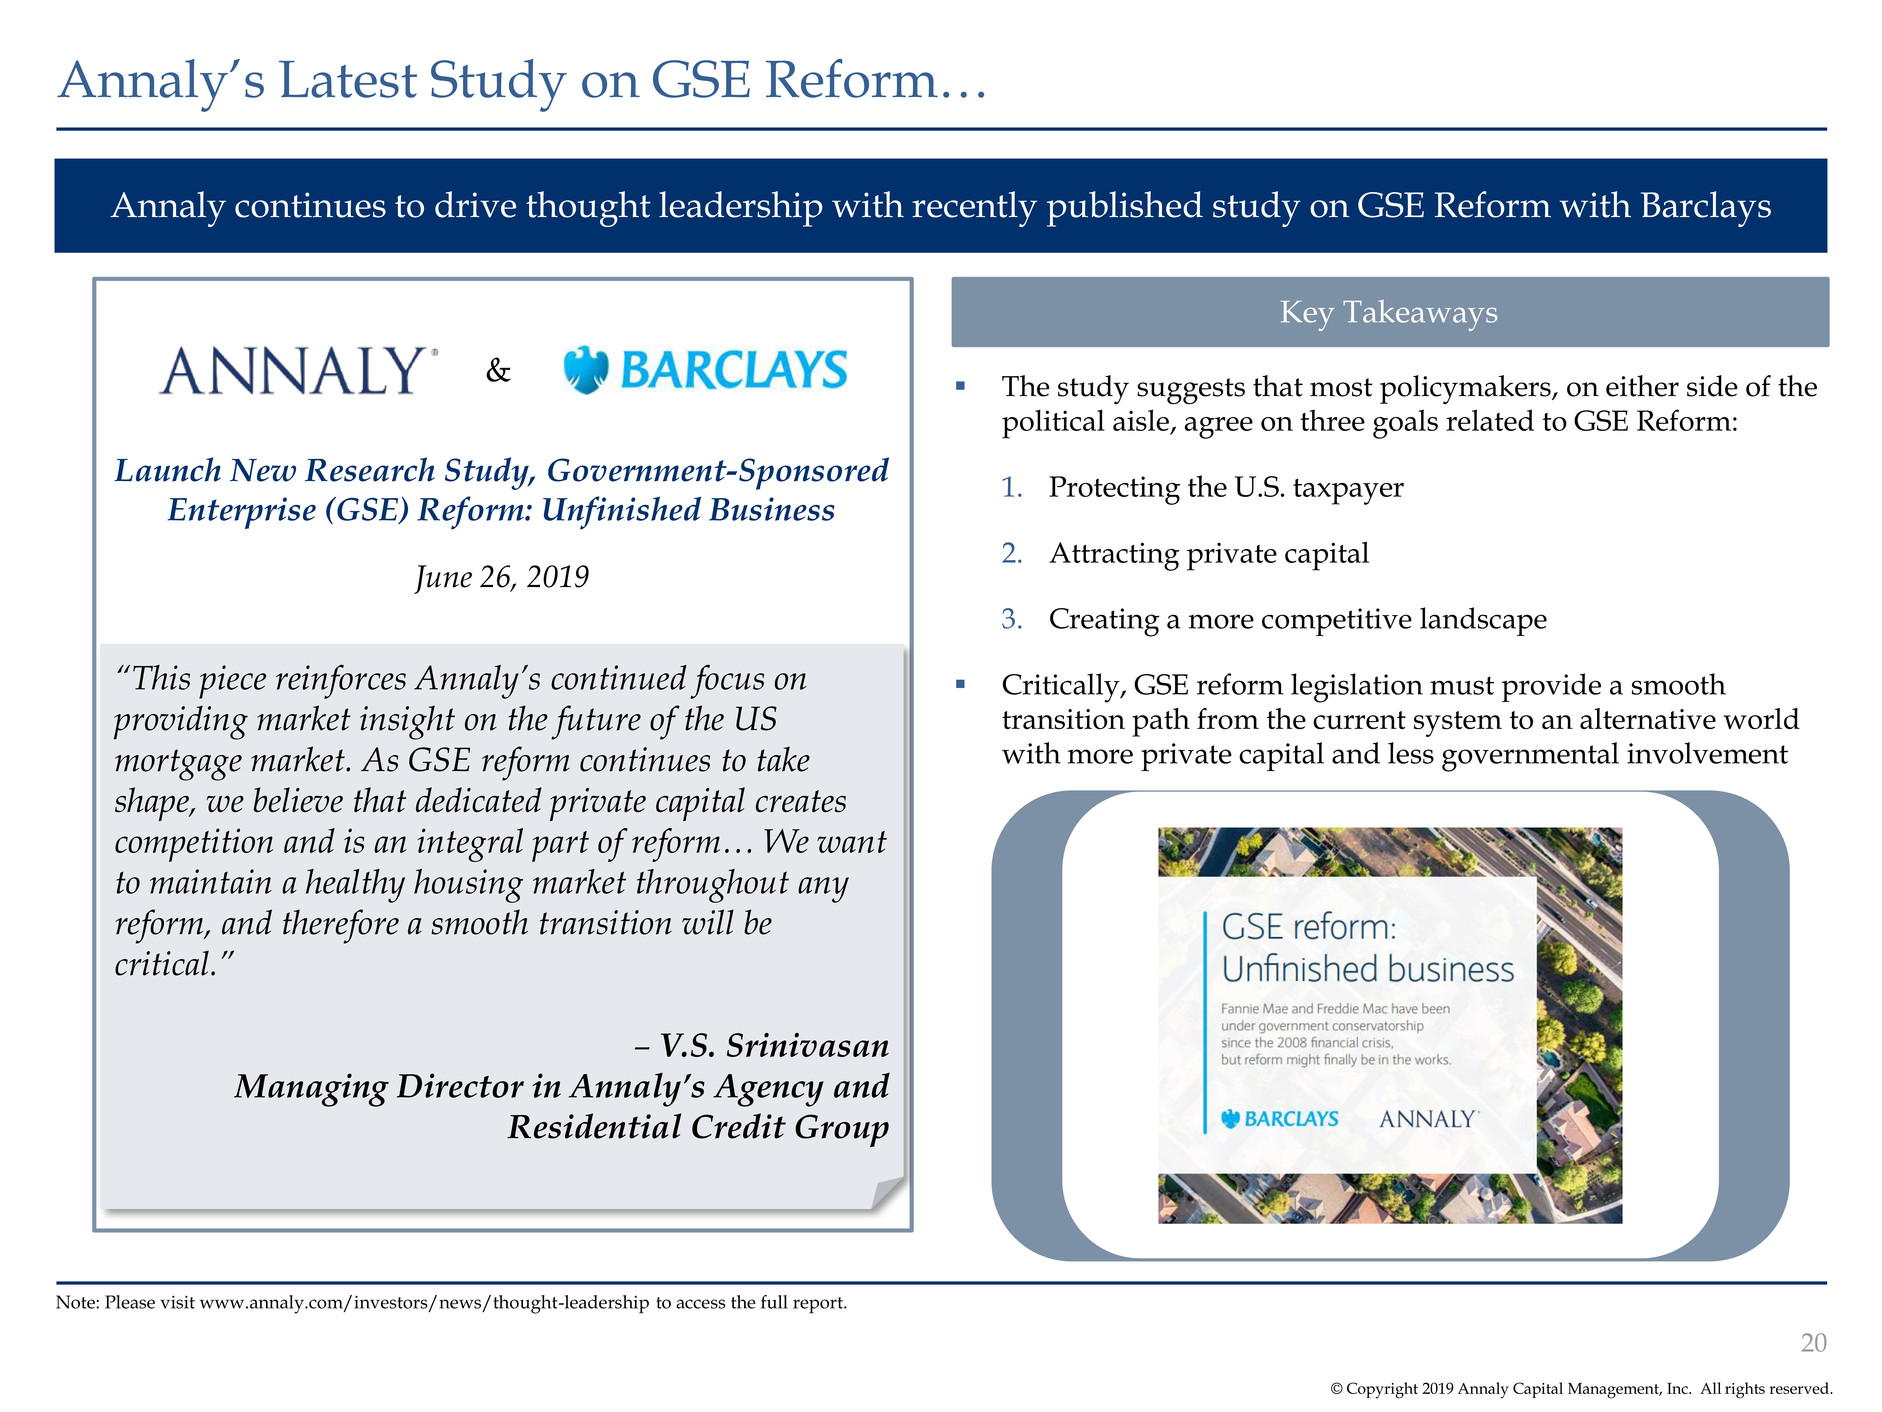
© Copyright 2019 Annaly Capital Management, Inc. All rights reserved. Note: Please visit www.annaly.com/investors/news/thought-leadership to access the full report. Annaly’s Latest Study on GSE Reform… 20 Annaly continues to drive thought leadership with recently published study on GSE Reform with Barclays Key Takeaways “This piece reinforces Annaly’s continued focus on providing market insight on the future of the US mortgage market. As GSE reform continues to take shape, we believe that dedicated private capital creates competition and is an integral part of reform… We want to maintain a healthy housing market throughout any reform, and therefore a smooth transition will be critical.” – V.S. Srinivasan Managing Director in Annaly’s Agency and Residential Credit Group Launch New Research Study, Government-Sponsored Enterprise (GSE) Reform: Unfinished Business June 26, 2019 & The study suggests that most policymakers, on either side of the political aisle, agree on three goals related to GSE Reform: 1. Protecting the U.S. taxpayer 2. Attracting private capital 3. Creating a more competitive landscape Critically, GSE reform legislation must provide a smooth transition path from the current system to an alternative world with more private capital and less governmental involvement

© Copyright 2019 Annaly Capital Management, Inc. All rights reserved. Increased GSE Credit Risk Sharing Shrinking GSE Footprint Ginnie Mae, $358bn, 33% GSEs $743bn, 67% Second Home, $31bn, 3% Investor Loans, $48bn, 4% Conventional Jumbo, $57bn, 5% Conventional QM Patch(1), $203bn, 18% Conventional Owner Occupied, $403bn, 37% 2018 Fixed Rate Origination: $1,100bn Annaly and other private sector participants have the necessary know-how to meaningfully support Congress and the U.S. Administration’s goal of GSE reform that expands the private market’s role in housing finance …Highlights the Importance of Private Capital in Housing Finance Source: CPRCDR, Annaly and Barclays Research. Note: Data reflects original loan balances of fixed rate securities originated in 2018. Detailed endnotes and a glossary of defined terms are included at the end of this presentation. 21 2018 Agency MBS Mortgage Originations To attract private capital in the mortgage markets, the GSEs could shrink their footprint in areas that are not part of their core mandate, such as second homes, investor loans and jumbo mortgages 1 2 Annaly Positioning & Track Record Opportunity Shrinking GSE footprint in non-core loans could provide Annaly with the opportunity to expand its investment in second home, investor loans and jumbo mortgages As the GSEs transfer risk to the private market, Annaly expects to continue to participate in the CRT market and invest in new structures Annaly has direct and indirect relationships with over 100 originators and was one of the first to purchase non-agency investor properties Annaly has securitized seven OBX deals since the beginning of 2018 in an effort to build a durable securitization platform Annaly has traded nearly $5 billion of CRT since the beginning of 2015 Annaly co-authored paper summarizing and evaluating the CRT market with a New York Federal Reserve economist(2) Annaly’s Opportunity & Positioning

Business Update
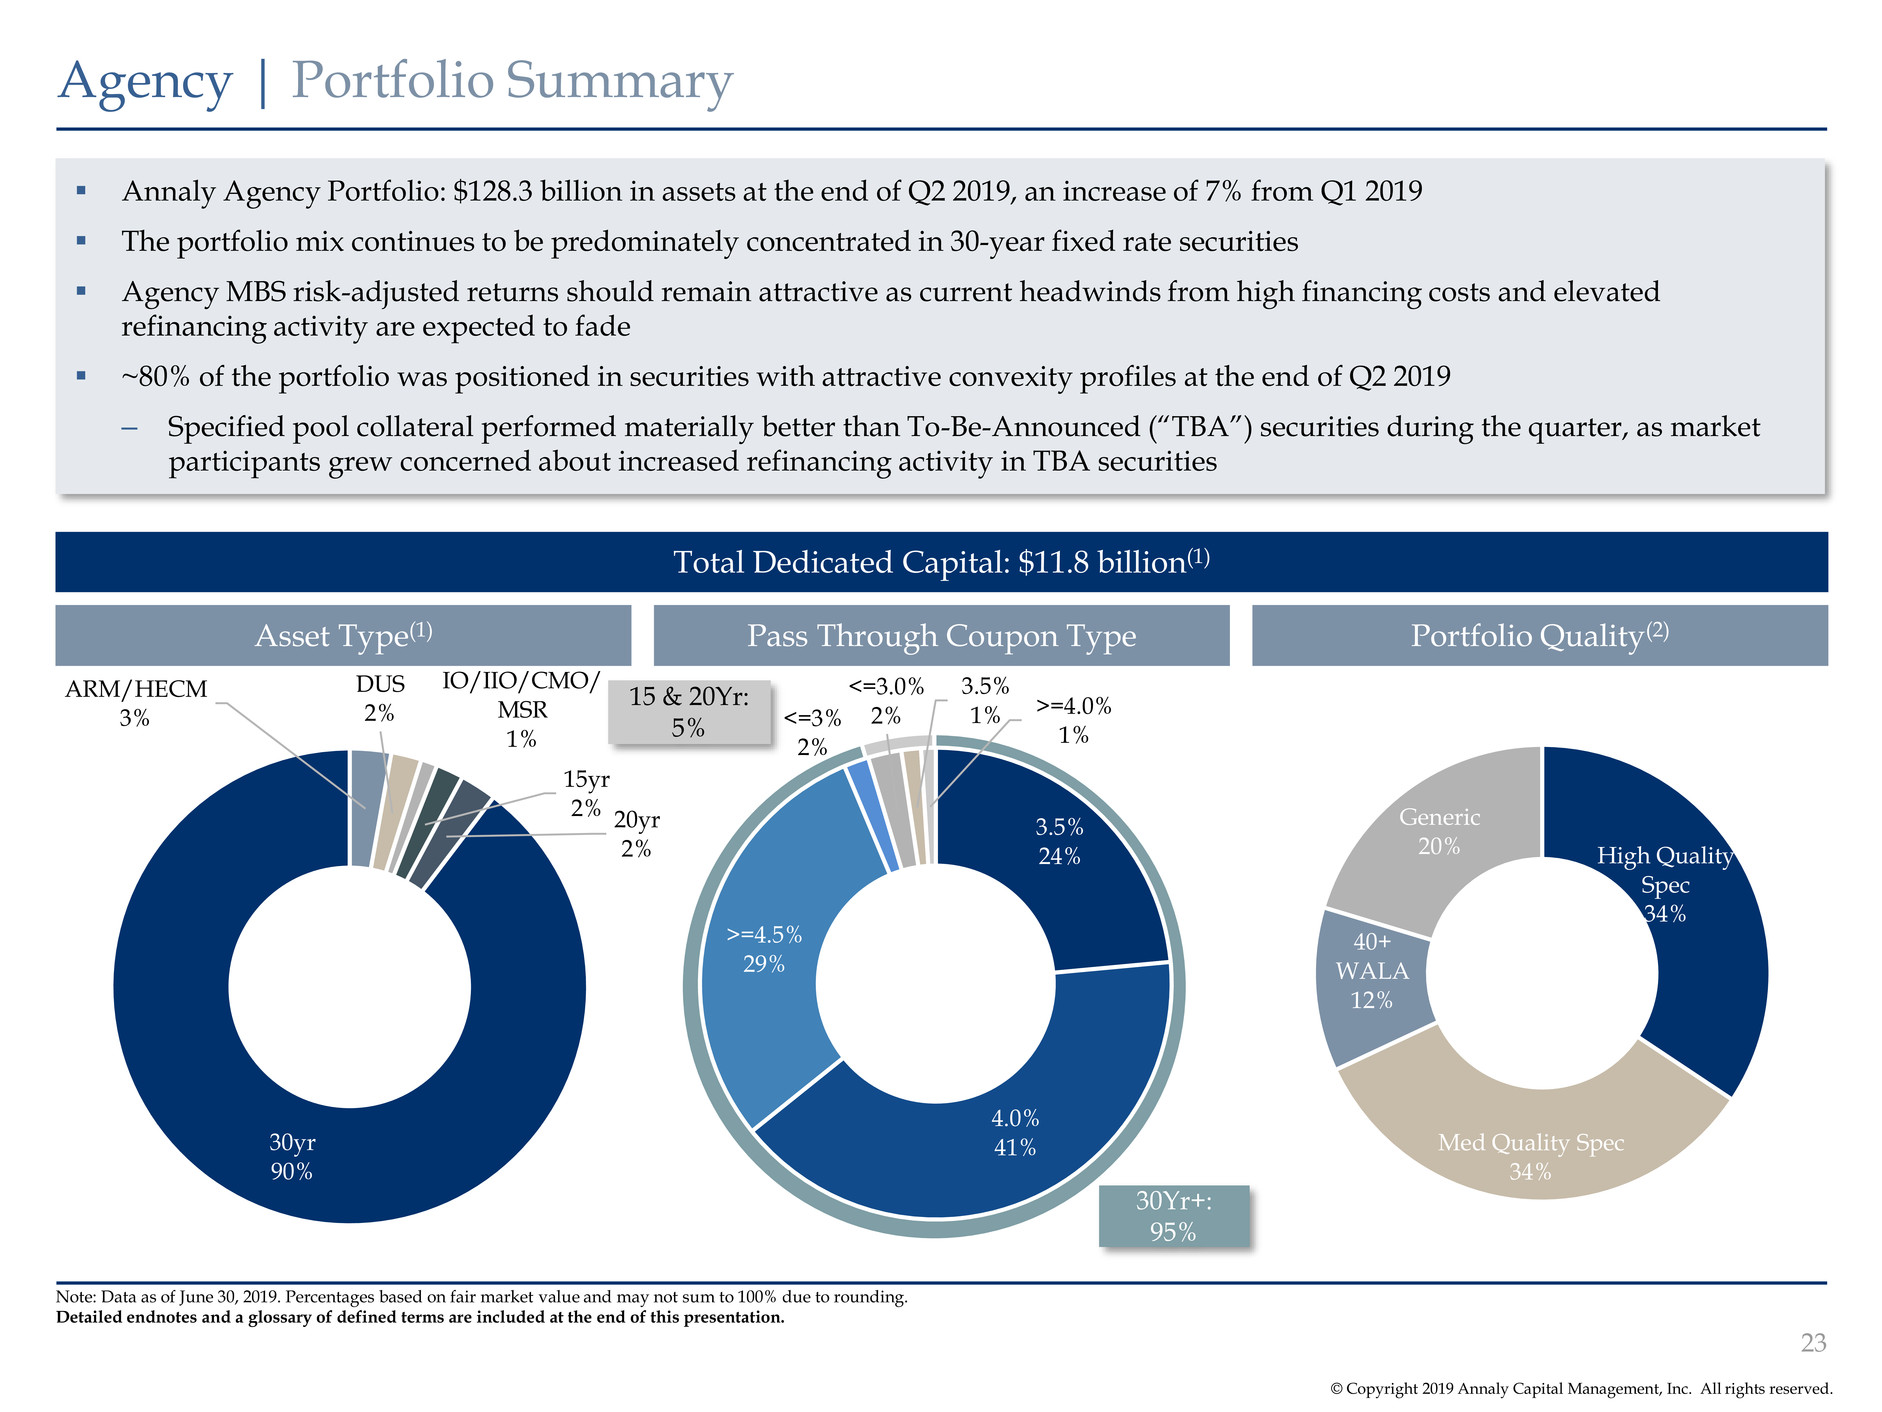
© Copyright 2019 Annaly Capital Management, Inc. All rights reserved. Agency | Portfolio Summary 23 Note: Data as of June 30, 2019. Percentages based on fair market value and may not sum to 100% due to rounding. Detailed endnotes and a glossary of defined terms are included at the end of this presentation. Annaly Agency Portfolio: $128.3 billion in assets at the end of Q2 2019, an increase of 7% from Q1 2019 The portfolio mix continues to be predominately concentrated in 30-year fixed rate securities Agency MBS risk-adjusted returns should remain attractive as current headwinds from high financing costs and elevated refinancing activity are expected to fade ~80% of the portfolio was positioned in securities with attractive convexity profiles at the end of Q2 2019 – Specified pool collateral performed materially better than To-Be-Announced (“TBA”) securities during the quarter, as market participants grew concerned about increased refinancing activity in TBA securities Total Dedicated Capital: $11.8 billion(1) Asset Type(1) Pass Through Coupon Type Portfolio Quality(2) 30Yr+: 95% High Quality Spec 34% Med Quality Spec 34% 40+ WALA 12% Generic 20% 15 & 20Yr: 5% ARM/HECM 3% DUS 2% IO/IIO/CMO/ MSR 1% 15yr 2% 20yr 2% 30yr 90% 3.5% 24% 4.0% 41% >=4.5% 29% <=3% 2% <=3.0% 2% 3.5% 1% >=4.0% 1%
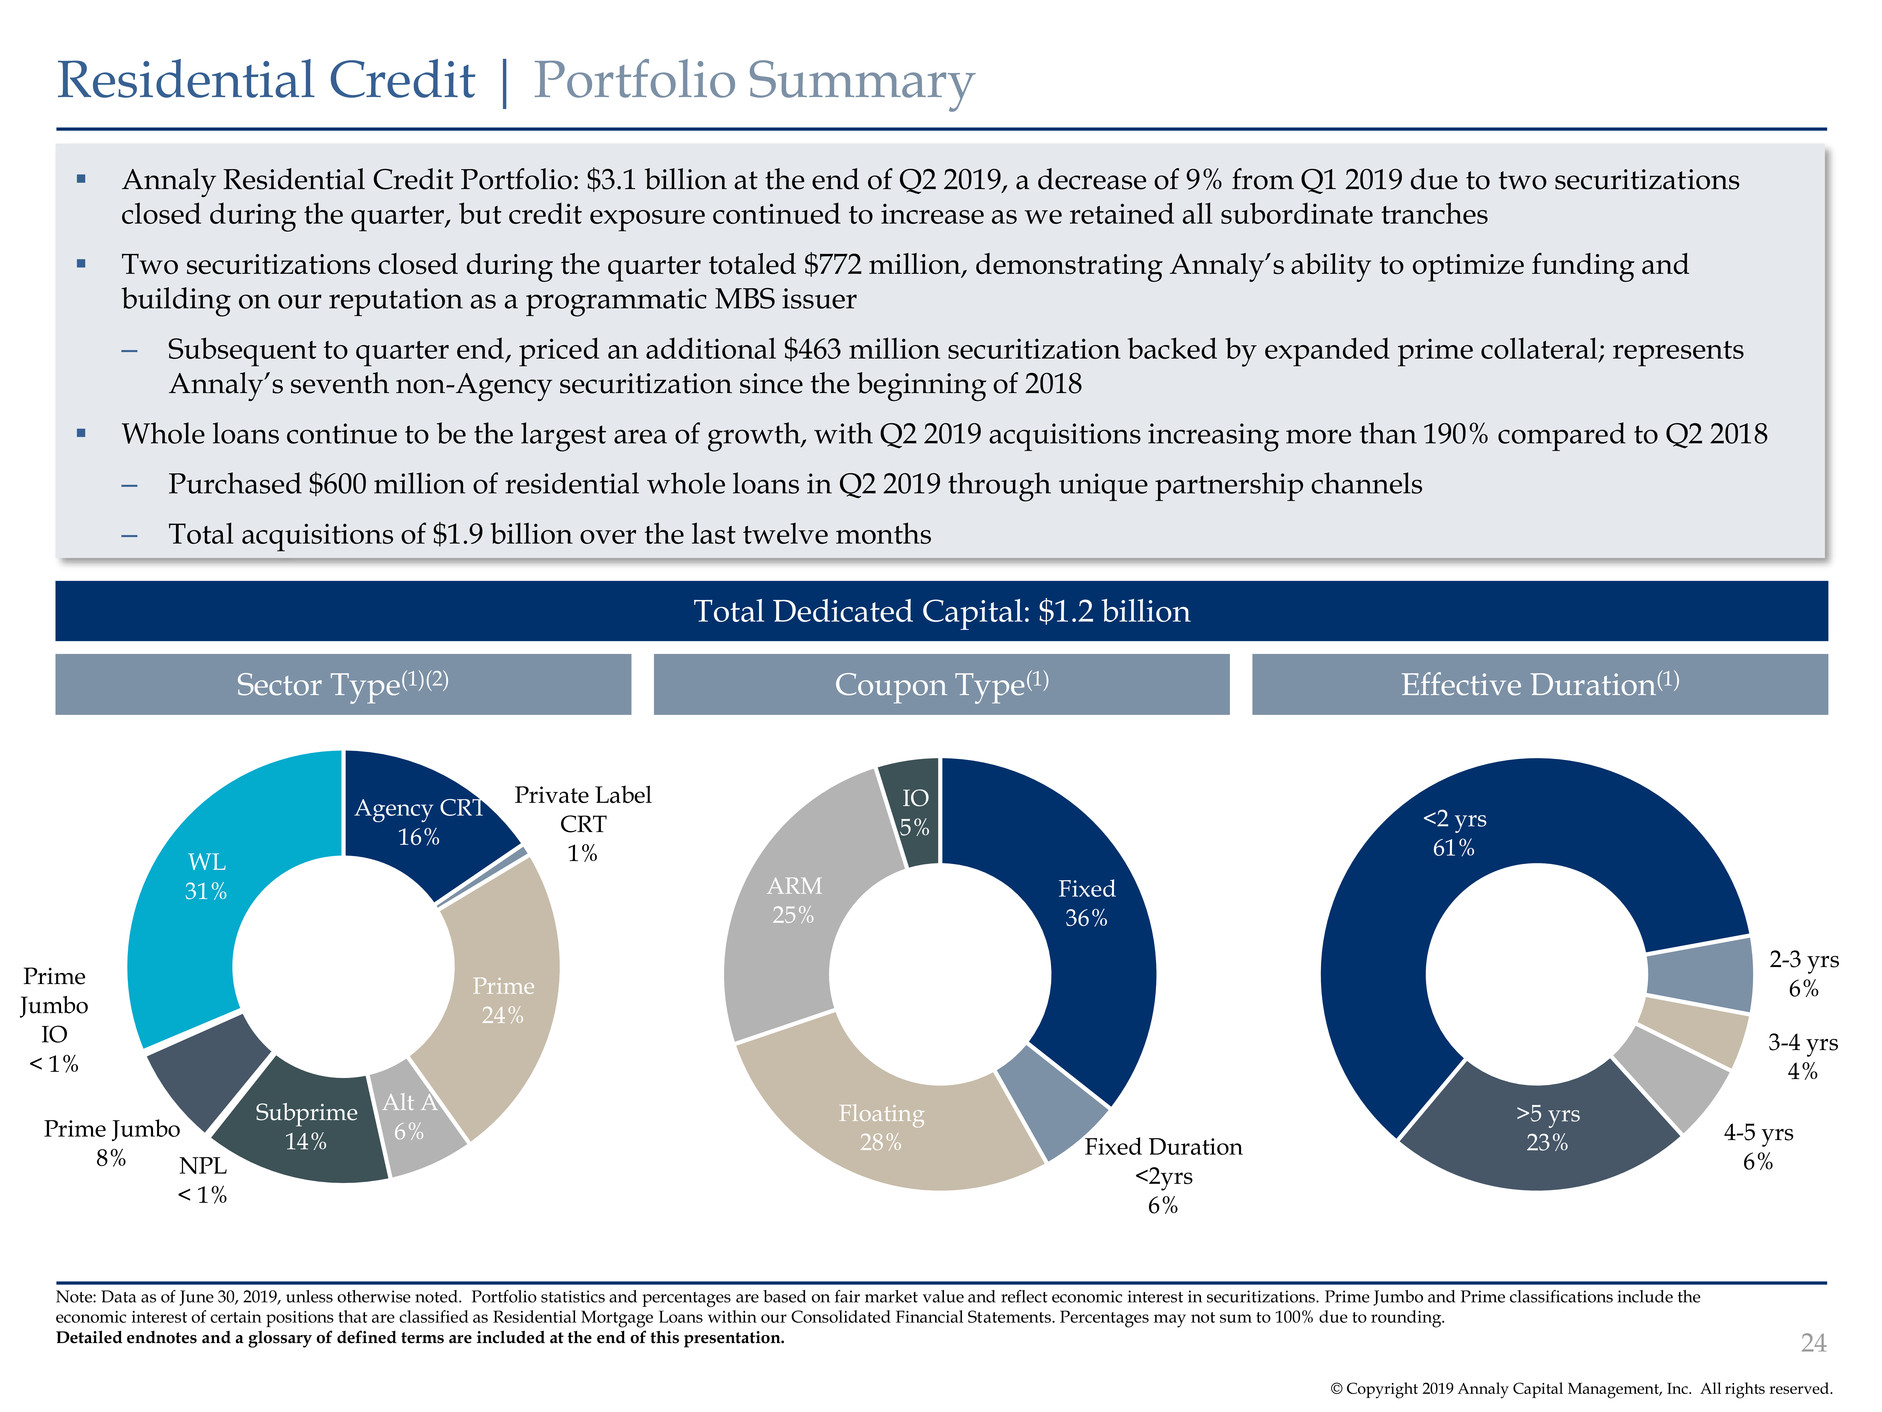
© Copyright 2019 Annaly Capital Management, Inc. All rights reserved. Residential Credit | Portfolio Summary 24 Note: Data as of June 30, 2019, unless otherwise noted. Portfolio statistics and percentages are based on fair market value and reflect economic interest in securitizations. Prime Jumbo and Prime classifications include the economic interest of certain positions that are classified as Residential Mortgage Loans within our Consolidated Financial Statements. Percentages may not sum to 100% due to rounding. Detailed endnotes and a glossary of defined terms are included at the end of this presentation. Annaly Residential Credit Portfolio: $3.1 billion at the end of Q2 2019, a decrease of 9% from Q1 2019 due to two securitizations closed during the quarter, but credit exposure continued to increase as we retained all subordinate tranches Two securitizations closed during the quarter totaled $772 million, demonstrating Annaly’s ability to optimize funding and building on our reputation as a programmatic MBS issuer – Subsequent to quarter end, priced an additional $463 million securitization backed by expanded prime collateral; represents Annaly’s seventh non-Agency securitization since the beginning of 2018 Whole loans continue to be the largest area of growth, with Q2 2019 acquisitions increasing more than 190% compared to Q2 2018 – Purchased $600 million of residential whole loans in Q2 2019 through unique partnership channels – Total acquisitions of $1.9 billion over the last twelve months Total Dedicated Capital: $1.2 billion Sector Type(1)(2) Coupon Type(1) Effective Duration(1) Agency CRT 16% Private Label CRT 1% Prime 24% Alt A 6% Subprime 14% NPL < 1% Prime Jumbo 8% Prime Jumbo IO < 1% WL 31% Fixed 36% Fixed Duration <2yrs 6% Floating 28% ARM 25% IO 5% <2 yrs 61% 2-3 yrs 6% 3-4 yrs 4% 4-5 yrs 6% >5 yrs 23%
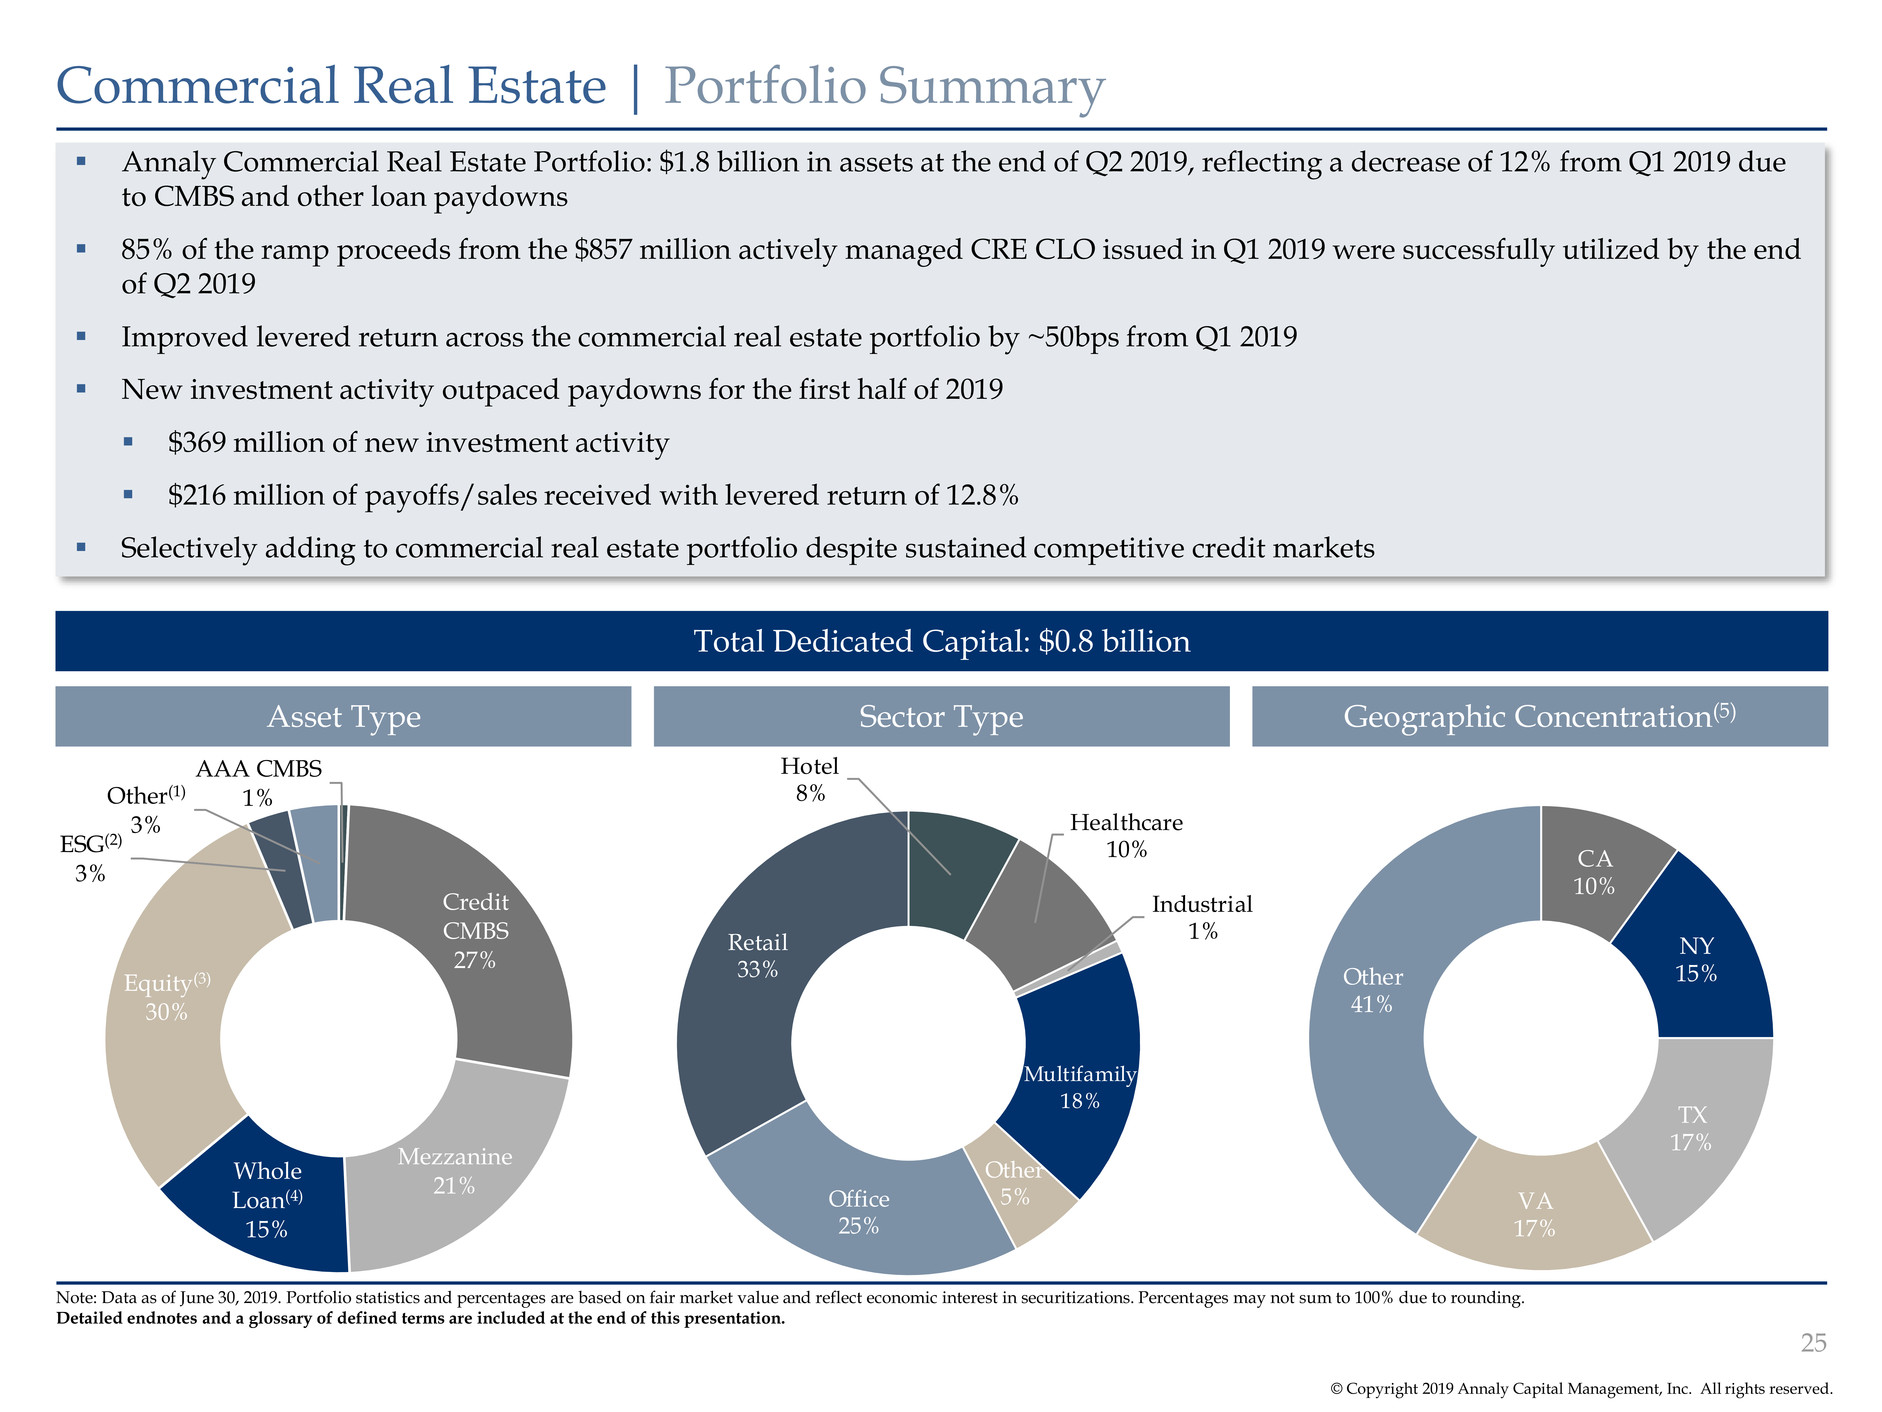
© Copyright 2019 Annaly Capital Management, Inc. All rights reserved. Commercial Real Estate | Portfolio Summary Annaly Commercial Real Estate Portfolio: $1.8 billion in assets at the end of Q2 2019, reflecting a decrease of 12% from Q1 2019 due to CMBS and other loan paydowns 85% of the ramp proceeds from the $857 million actively managed CRE CLO issued in Q1 2019 were successfully utilized by the end of Q2 2019 Improved levered return across the commercial real estate portfolio by ~50bps from Q1 2019 New investment activity outpaced paydowns for the first half of 2019 $369 million of new investment activity $216 million of payoffs/sales received with levered return of 12.8% Selectively adding to commercial real estate portfolio despite sustained competitive credit markets Total Dedicated Capital: $0.8 billion Asset Type Sector Type Geographic Concentration(5) Note: Data as of June 30, 2019. Portfolio statistics and percentages are based on fair market value and reflect economic interest in securitizations. Percentages may not sum to 100% due to rounding. Detailed endnotes and a glossary of defined terms are included at the end of this presentation. 25 CA 10% NY 15% TX 17% VA 17% Other 41% AAA CMBS 1% Credit CMBS 27% Mezzanine 21% Whole Loan(4) 15% Equity(3) 30% ESG(2) 3% Other(1) 3% Hotel 8% Healthcare 10% Industrial 1% Multifamily 18% Other 5%Office 25% Retail 33%
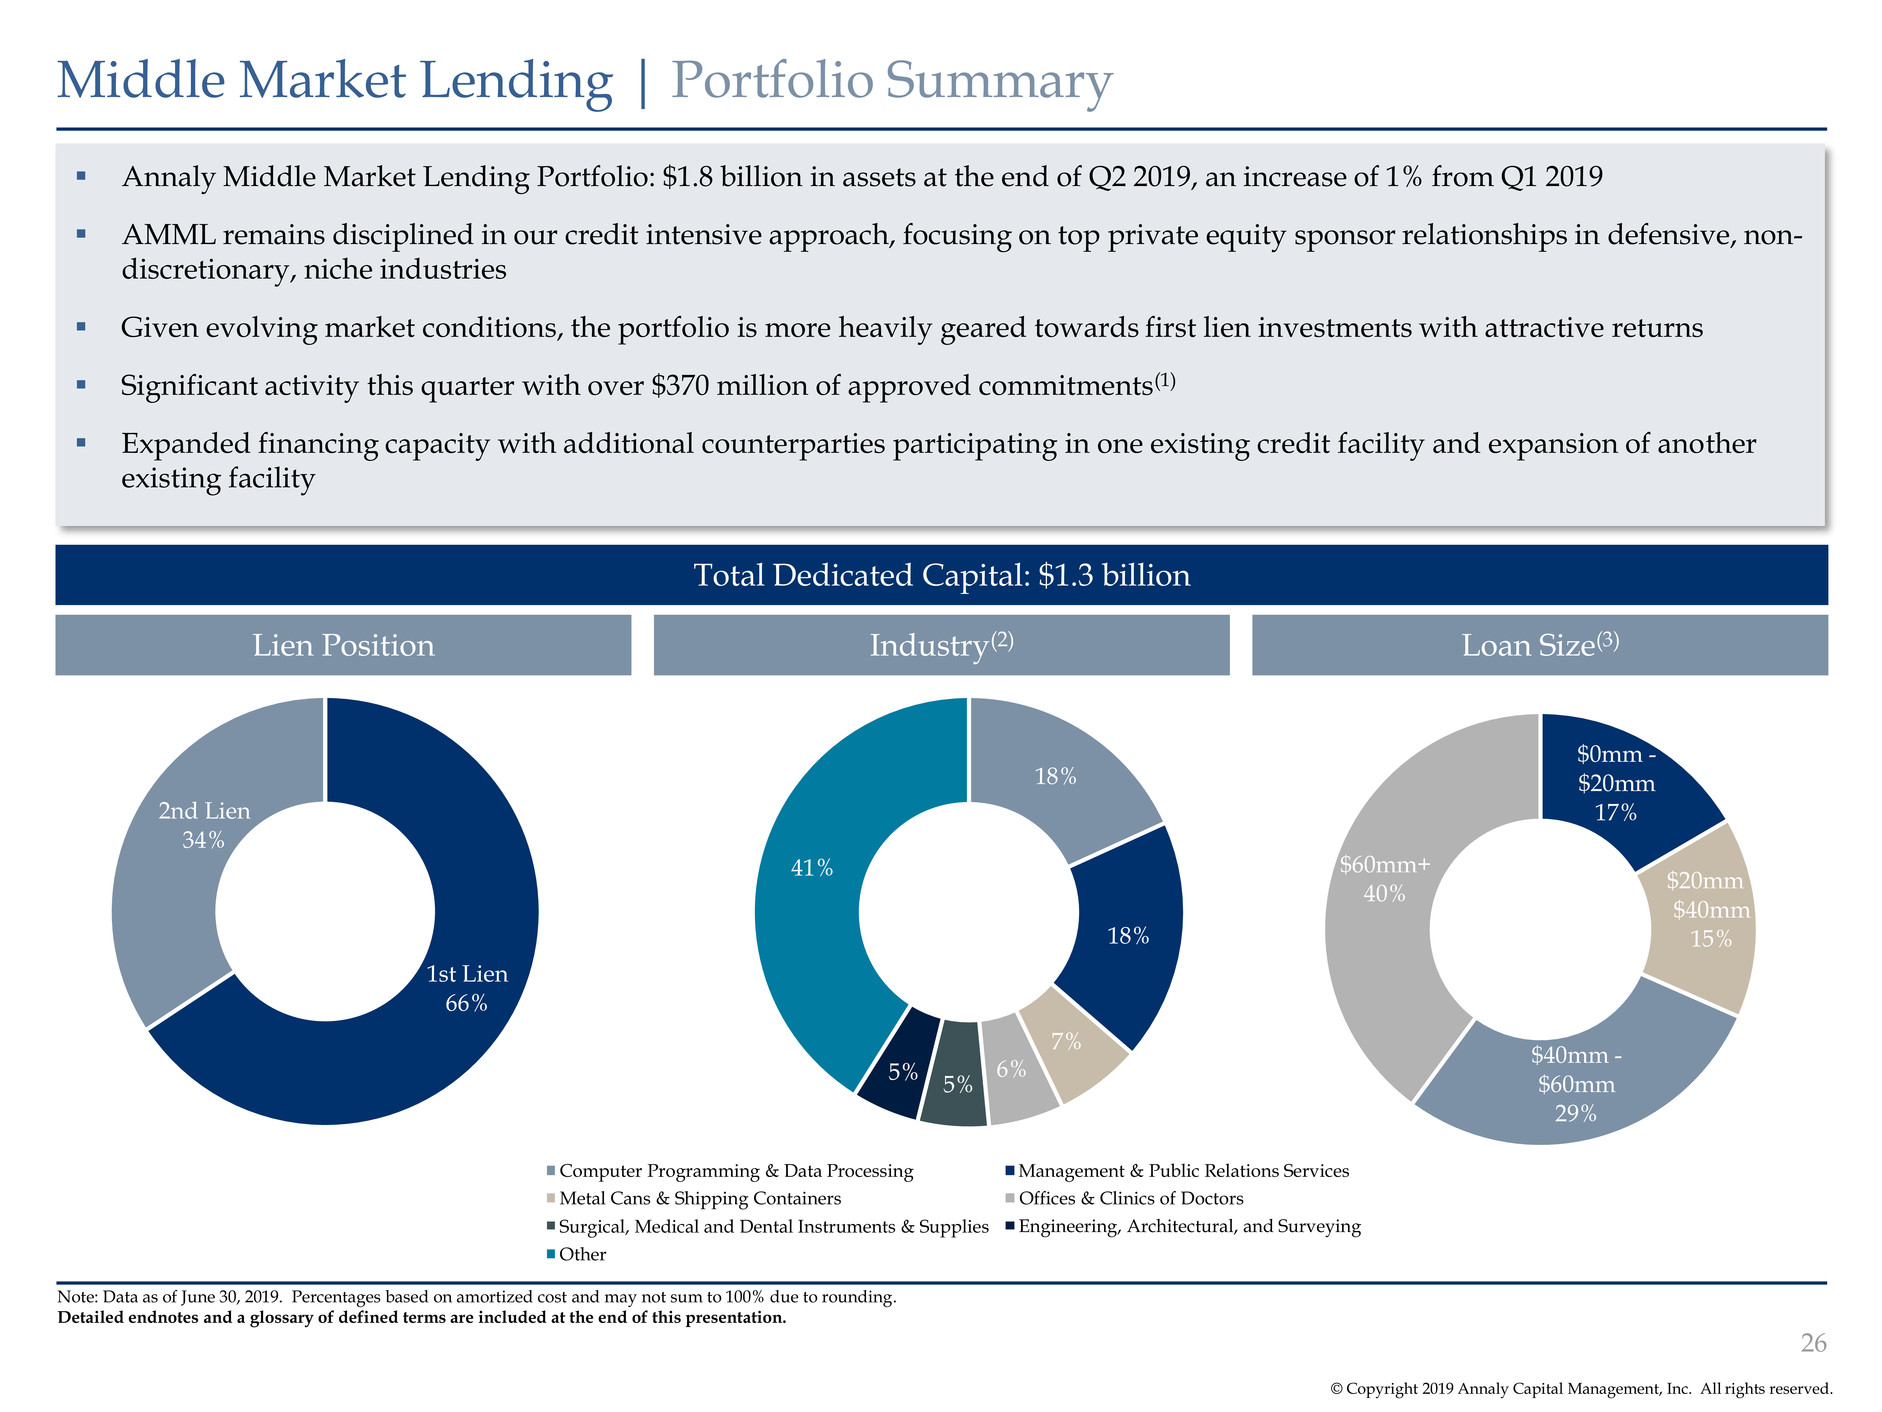
© Copyright 2019 Annaly Capital Management, Inc. All rights reserved. $0mm - $20mm 17% $20mm - $40mm 15% $40mm - $60mm 29% $60mm+ 40% Middle Market Lending | Portfolio Summary Note: Data as of June 30, 2019. Percentages based on amortized cost and may not sum to 100% due to rounding. Detailed endnotes and a glossary of defined terms are included at the end of this presentation. Annaly Middle Market Lending Portfolio: $1.8 billion in assets at the end of Q2 2019, an increase of 1% from Q1 2019 AMML remains disciplined in our credit intensive approach, focusing on top private equity sponsor relationships in defensive, non- discretionary, niche industries Given evolving market conditions, the portfolio is more heavily geared towards first lien investments with attractive returns Significant activity this quarter with over $370 million of approved commitments(1) Expanded financing capacity with additional counterparties participating in one existing credit facility and expansion of another existing facility Total Dedicated Capital: $1.3 billion Lien Position Industry(2) Loan Size(3) 26 1st Lien 66% 2nd Lien 34% 18% 18% 7% 6% 5% 5% 41% Computer Programming & Data Processing Management & Public Relations Services Metal Cans & Shipping Containers Engineering, Architectural, and Surveying Offices & Clinics of Doctors Surgical, Medical and Dental Instruments & Supplies Other
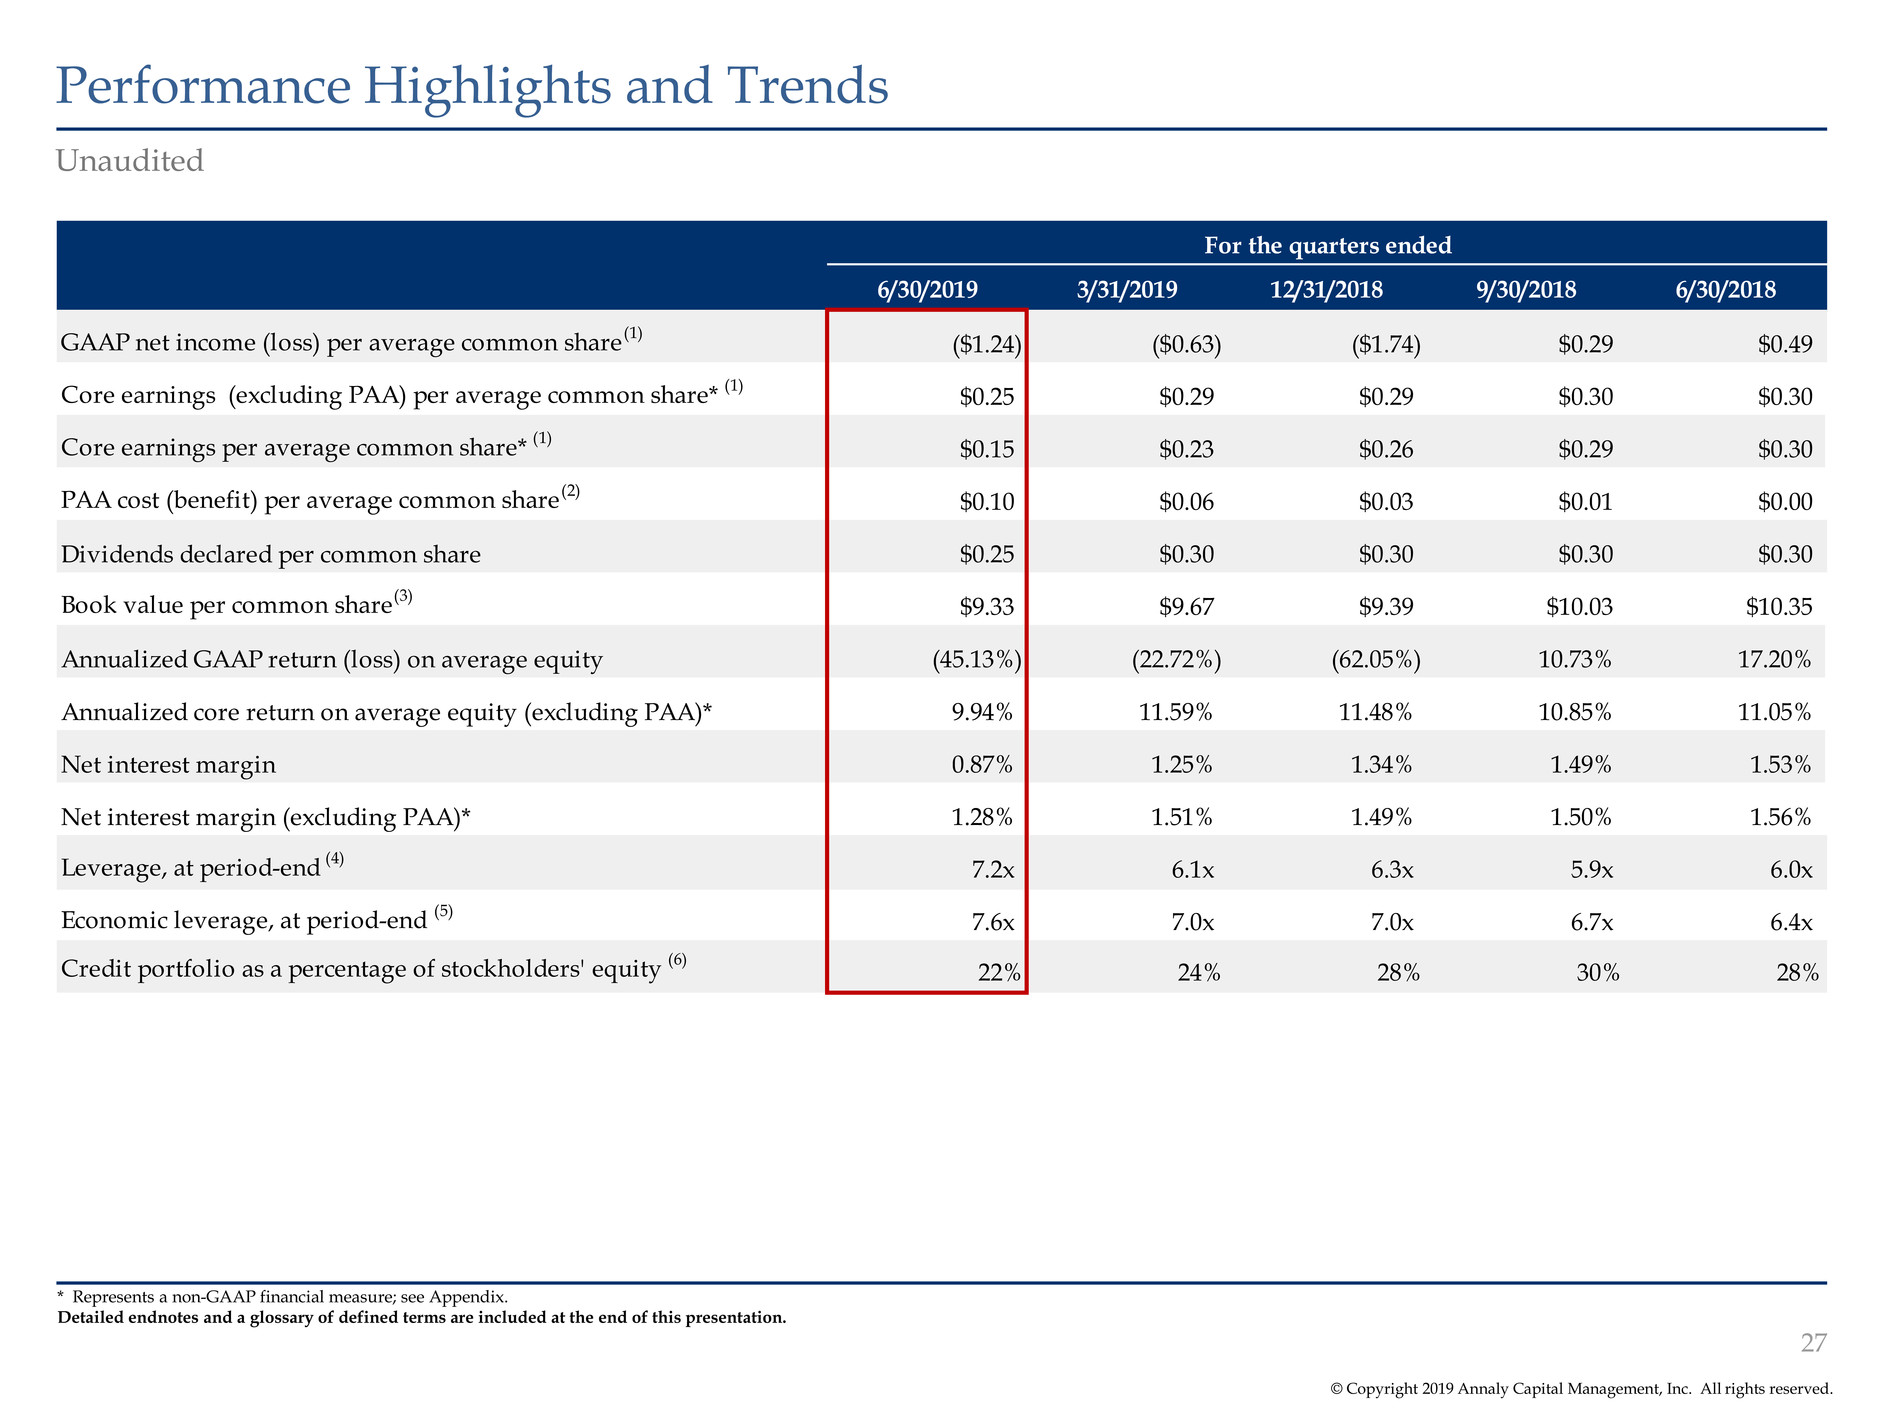
© Copyright 2019 Annaly Capital Management, Inc. All rights reserved. Performance Highlights and Trends 27 Unaudited * Represents a non-GAAP financial measure; see Appendix. Detailed endnotes and a glossary of defined terms are included at the end of this presentation. For the quarters ended 6/30/2019 3/31/2019 12/31/2018 9/30/2018 6/30/2018 GAAP net income (loss) per average common share (1) ($1.24) ($0.63) ($1.74) $0.29 $0.49 Core earnings (excluding PAA) per average common share* (1) $0.25 $0.29 $0.29 $0.30 $0.30 Core earnings per average common share* (1) $0.15 $0.23 $0.26 $0.29 $0.30 PAA cost (benefit) per average common share (2) $0.10 $0.06 $0.03 $0.01 $0.00 Dividends declared per common share $0.25 $0.30 $0.30 $0.30 $0.30 Book value per common share (3) $9.33 $9.67 $9.39 $10.03 $10.35 Annualized GAAP return (loss) on average equity (45.13%) (22.72%) (62.05%) 10.73% 17.20% Annualized core return on average equity (excluding PAA)* 9.94% 11.59% 11.48% 10.85% 11.05% Net interest margin 0.87% 1.25% 1.34% 1.49% 1.53% Net interest margin (excluding PAA)* 1.28% 1.51% 1.49% 1.50% 1.56% Leverage, at period-end (4) 7.2x 6.1x 6.3x 5.9x 6.0x Economic leverage, at period-end (5) 7.6x 7.0x 7.0x 6.7x 6.4x Credit portfolio as a percentage of stockholders' equity (6) 22% 24% 28% 30% 28%

© Copyright 2019 Annaly Capital Management, Inc. All rights reserved. Performance Highlights and Trends (cont’d) 28 Unaudited, dollars in thousands For the quarters ended 6/30/2019 3/31/2019 12/31/2018 9/30/2018 6/30/2018 Agency mortgage-backed securities $118,202,040 $103,093,526 $90,752,995 $89,290,128 $86,593,058 Credit risk transfer securities 491,969 607,945 552,097 688,521 563,796 Non-Agency mortgage-backed securities 1,097,752 1,116,569 1,161,938 1,173,467 1,006,785 Commercial mortgage-backed securities 135,108 175,231 156,758 186,495 315,050 Total securities $119,926,869 $104,993,271 $92,623,788 $91,338,611 $88,478,689 Residential mortgage loans $1,061,124 $1,311,720 $1,359,806 $1,217,139 $1,142,300 Commercial real estate debt and preferred equity 623,705 722,962 1,296,803 1,435,865 1,251,138 Corporate debt 1,792,837 1,758,082 1,887,182 1,528,874 1,256,276 Loans held for sale 68,802 86,560 42,184 42,325 42,458 Total loans, net $3,546,468 $3,879,324 $4,585,975 $4,224,203 $3,692,172 Mortgage servicing rights $425,328 $500,745 $557,813 $588,833 $599,014 Reside tial mortgage loans transferred or pledged to securitization vehicles $2,106,981 $1,425,668 $1,094,831 $765,876 $523,857 Commercial real estate debt investments transferred or pledged to securitization vehicles 2,104,601 2,939,632 2,738,369 3,521,945 2,542,413 Assets transferred or pledged to securitization vehicles $4,211,582 $4,365,300 $3,833,200 $4,287,821 $3,066,270 Real estate, net $733,196 $734,239 $739,473 $753,014 $477,887 Total residential and commercial investments $128,843,443 $114,472,879 $102,340,249 $101,192,482 $96,314,032
Appendix: Non-GAAP Reconciliations

© Copyright 2019 Annaly Capital Management, Inc. All rights reserved. Non-GAAP Reconciliations 30 Beginning with the quarter ended September 30, 2018, the Company updated its calculation of core earnings and related metrics to reflect changes to its portfolio composition and operations, including the acquisition of MTGE in September 2018. Compared to prior periods, the revised definition of core earnings includes coupon income (expense) on CMBX positions (reported in Net gains (losses) on other derivatives) and excludes depreciation and amortization expense on real estate and related intangibles (reported in Other income (loss)), non-core income (loss) allocated to equity method investments (reported in Other income (loss)) and the income tax effect of non-core income (loss) (reported in Income taxes). Prior period results have not been adjusted to conform to the revised calculation as the impact in each of those periods is not material. The Company calculates “core earnings”, a non-GAAP measure, as the sum of (a) economic net interest income, (b) TBA dollar roll income and CMBX coupon income, (c) realized amortization of MSRs, (d) other income (loss) (excluding depreciation and amortization expense on real estate and related intangibles, non-core income allocated to equity method investments and other non-core components of other income (loss)), (e) general and administrative expenses (excluding transaction expenses and non-recurring items) and (f) income taxes (excluding the income tax effect of non-core income (loss) items), and core earnings (excluding PAA), which is defined as core earnings excluding the premium amortization adjustment representing the cumulative impact on prior periods, but not the current period, of quarter-over-quarter changes in estimated long-term prepayment speeds related to the Company’s Agency mortgage-backed securities.

© Copyright 2019 Annaly Capital Management, Inc. All rights reserved. Non-GAAP Reconciliations (cont’d) 31 * Represents a non-GAAP financial measure. Detailed endnotes and a glossary of defined terms are included at the end of this presentation. Unaudited, dollars in thousands except per share amounts To supplement its consolidated financial statements, which are prepared and presented in accordance with GAAP, the Company provides non-GAAP financial measures. These measures should not be considered a substitute for, or superior to, financial measures computed in accordance with GAAP. These non-GAAP measures provide additional detail to enhance investor understanding of the Company’s period-over-period operating performance and business trends, as well as for assessing the Company’s performance versus that of industry peers. Reconciliations of these non-GAAP financial measures to their most directly comparable GAAP results are provided below and on the next page. For the quarters ended 6/30/2019 3/31/2019 12/31/2018 9/30/2018 6/30/2018 GAAP to Core Reconciliation GAAP net income (loss) ($1,776,413) ($849,251) ($2,254,872) $385,429 $595,887 Net income (loss) attributable to non-controlling interests (83) (101) 17 (149) (32) Net income (loss) attributable to Annaly ($1,776,330) ($849,150) ($2,254,889) $385,578 $595,919 Adjustments to exclude reported realized and unrealized (gains) losses: Realized (gains) losses on termination of interest rate swaps 167,491 588,256 - (575) - Unrealized (gains) losses on interest rate swaps 1,276,019 390,556 1,313,882 (417,203) (343,475) Net (gains) losses on disposal of investments 38,333 93,916 747,505 324,294 66,117 Net (gains) losses on other derivatives 506,411 115,159 484,872 (94,827) (34,189) Net unrealized (gains) losses on instruments measured at fair value through earnings 4,881 (47,629) 18,169 39,944 48,376 Loan loss provision - 5,703 3,496 - - Adjustments to exclude components of other (income) loss: Depreciation and amortization expense related to commercial real estate (1) 10,147 10,114 11,000 9,278 - Non-core (income) loss allocated to equity method investments (2) 11,327 9,496 (10,307) (2,358) - Non-core other (income) loss (3) - - - 44,525 - Adjustments to exclude components of general and administrative expenses and income taxes: Transaction expenses and non-recurring items (4) 3,046 9,982 3,816 60,081 - Income tax effect on non-core income (loss) items (3,507) 726 3,334 886 - Adjustments to add back components of realized and unrealized (gains) losses: TBA dollar roll income and CMBX coupon income (5) 33,229 38,134 69,572 56,570 62,491 MSR amortization (6) (19,657) (13,979) (18,753) (19,913) (19,942) Core earnings* 251,390 351,284 371,697 386,280 375,297 Less: Premium amortization adjustment (PAA) cost (benefit) 139,763 81,871 45,472 3,386 7,516 Core Earnings (excluding PAA)* $391,153 $433,155 $417,169 $389,666 $382,813 Dividends on preferred stock 32,422 32,494 32,494 31,675 31,377 Core Earnings attributable to common shareholders * $218,968 $318,790 $339,203 $354,605 $343,920 Core Earnings (excluding PAA) attributable to common shareholders * $358,731 $400,661 $384,675 $357,991 $351,436 AAP net income (loss) per average common share (7) ($1.24) ($0.63) ($1.74) $0.29 $0.49 Core earnings per average common share (7) * $0.15 $0.23 $0.26 $0.29 $0.30 Core earnings (excluding PAA) per average common share (7) * $0.25 $0.29 $0.29 $0.30 $0.30 Annualized GAAP return (loss) on average equity (45.13%) (22.72%) (62.05%) 10.73% 17.20% Annualized core return on average equity (excluding PAA)* 9.94% 11.59% 11.48% 10.85% 11.05%
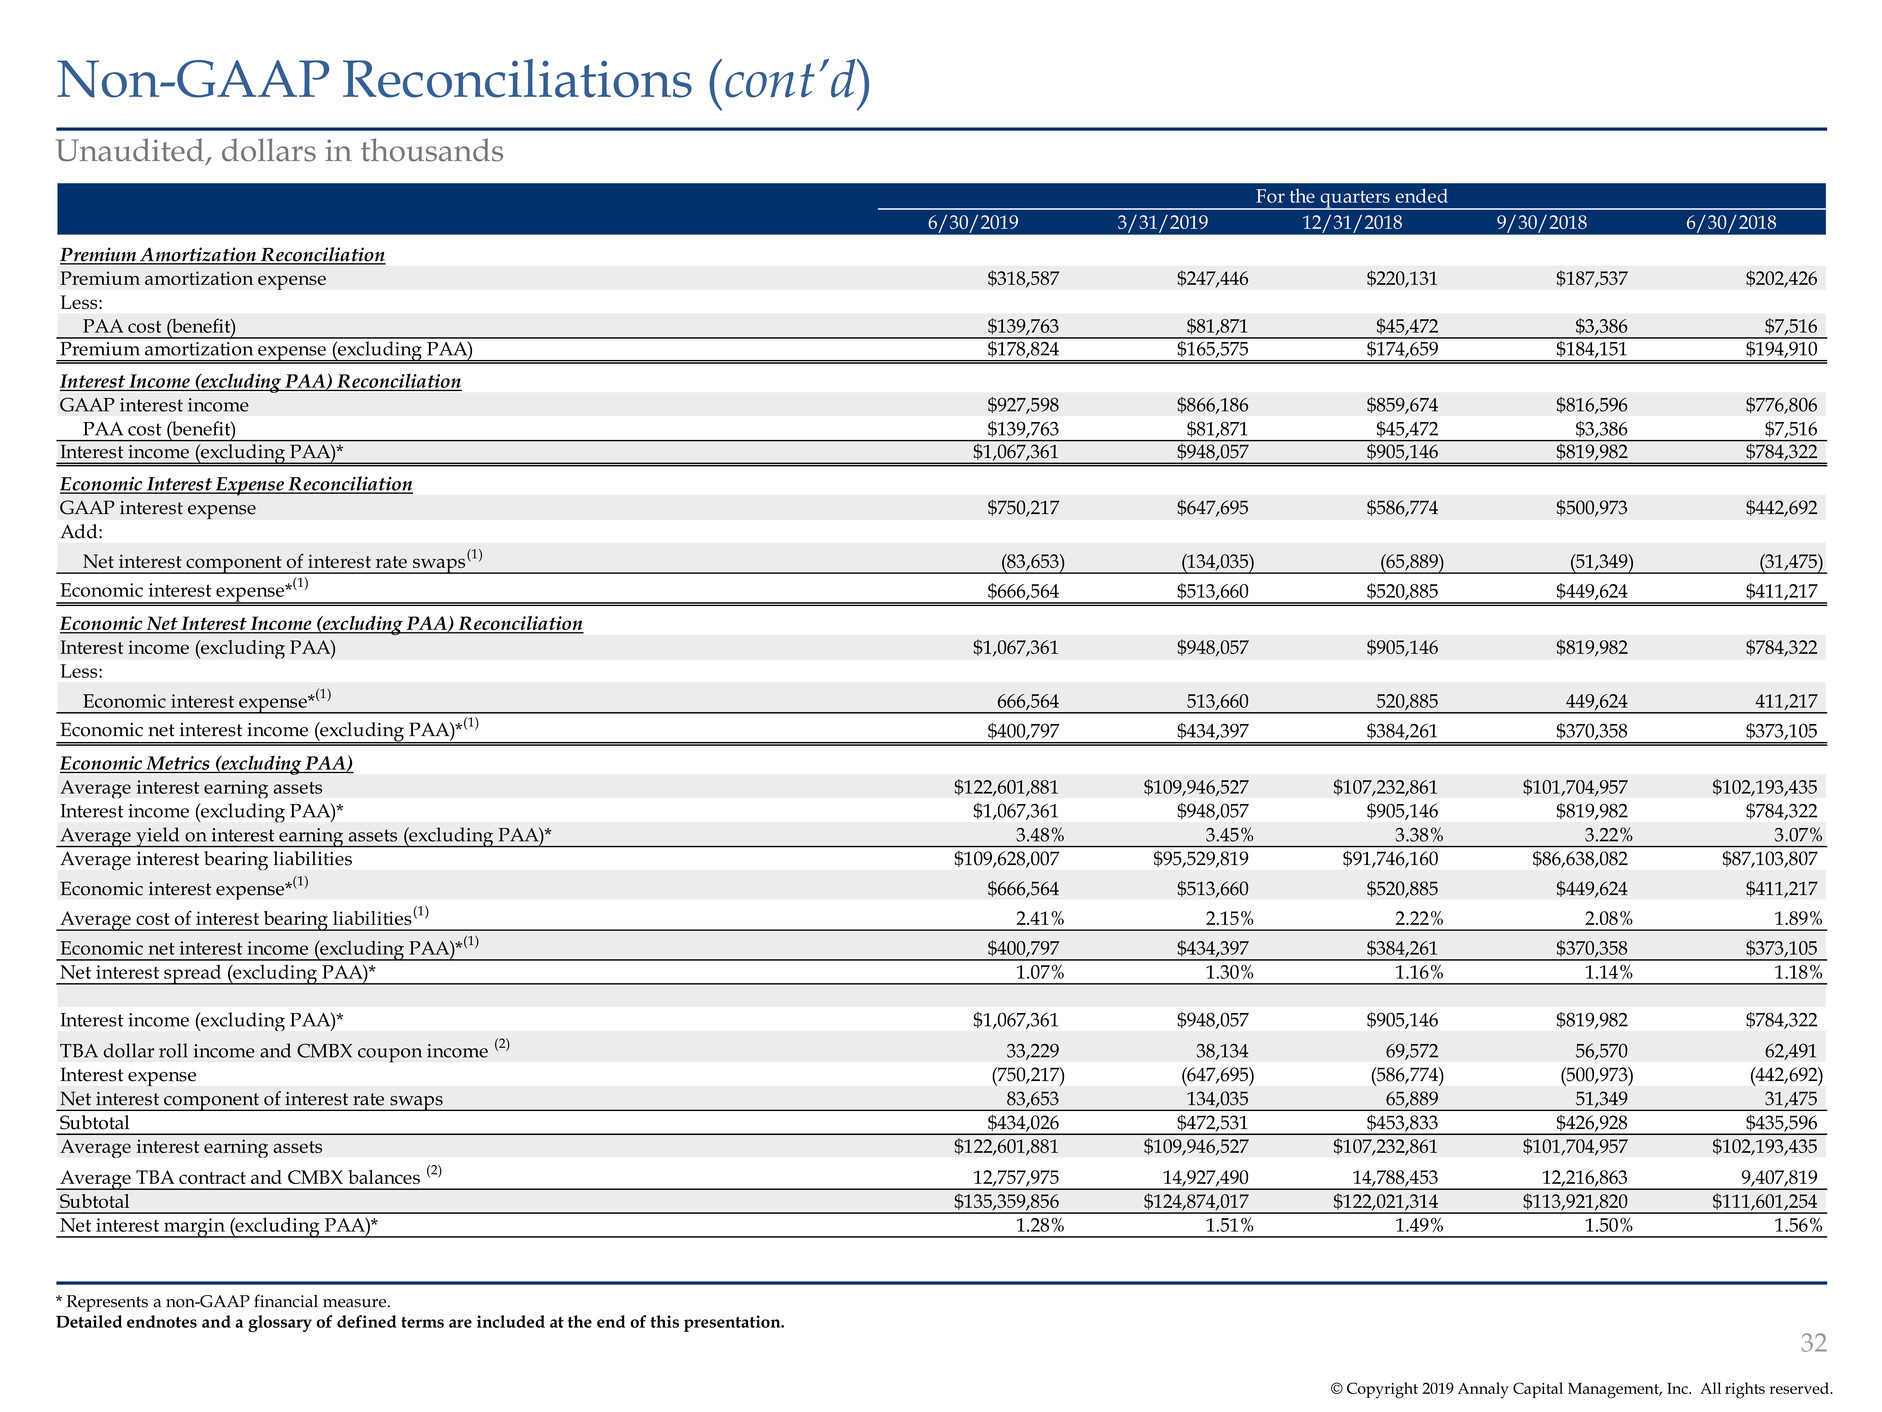
© Copyright 2019 Annaly Capital Management, Inc. All rights reserved. Non-GAAP Reconciliations (cont’d) 32 * Represents a non-GAAP financial measure. Detailed endnotes and a glossary of defined terms are included at the end of this presentation. Unaudited, dollars in thousands For the quarters ended 6/30/2019 3/31/2019 12/31/2018 9/30/2018 6/30/2018 Premium Amortization Reconciliation Premium amortization expense $318,587 $247,446 $220,131 $187,537 $202,426 Less: PAA cost (benefit) $139,763 $81,871 $45,472 $3,386 $7,516 Premium amortization expense (excluding PAA) $178,824 $165,575 $174,659 $184,151 $194,910 Interest Income (excluding PAA) Reconciliation GAAP interest income $927,598 $866,186 $859,674 $816,596 $776,806 PAA cost (benefit) $139,763 $81,871 $45,472 $3,386 $7,516 Interest income (excluding PAA)* $1,067,361 $948,057 $905,146 $819,982 $784,322 Economic Interest Expense Reconciliation GAAP interest expense $750,217 $647,695 $586,774 $500,973 $442,692 Add: Net interest component of interest rate swaps (1) (83,653) (134,035) (65,889) (51,349) (31,475) Economic interest expense* (1) $666,564 $513,660 $520,885 $449,624 $411,217 Economic Net Interest Income (excluding PAA) Reconciliation Interest income (excluding PAA) $1,067,361 $948,057 $905,146 $819,982 $784,322 Less: Economic interest expense* (1) 666,564 513,660 520,885 449,624 411,217 Economic net interest income (excluding PAA)* (1) $400,797 $434,397 $384,261 $370,358 $373,105 Economic Metrics (excluding PAA) Average interest earning assets $122,601,881 $109,946,527 $107,232,861 $101,704,957 $102,193,435 Interest income (excluding PAA)* $1,067,361 $948,057 $905,146 $819,982 $784,322 Average yield on interest earning assets (excluding PAA)* 3.48% 3.45% 3.38% 3.22% 3.07% Average interest bearing liabilities $109,628,007 $95,529,819 $91,746,160 $86,638,082 $87,103,807 Economic interest expense* (1) $666,564 $513,660 $520,885 $449,624 $411,217 Average cost of interest bearing liabilities (1) 2.41% 2.15% 2.22% 2.08% 1.89% Economic net interest income (excluding PAA)* (1) $400,797 $434,397 $384,261 $370,358 $373,105 Net interest spread (excluding PAA)* 1.07% 1.30% 1.16% 1.14% 1.18% Interest income (excluding PAA)* $1,067,361 $948,057 $905,146 $819,982 $784,322 TBA dollar roll income and CMBX coupon income (2) 33,229 38,134 69,572 56,570 62,491 Interest expense (750,217) (647,695) (586,774) (500,973) (442,692) Net interest component of interest rate swaps 83,653 134,035 65,889 51,349 31,475 Subtotal $434,026 $472,531 $453,833 $426,928 $435,596 Average interest earning assets $122,601,881 $109,946,527 $107,232,861 $101,704,957 $102,193,435 Average TBA contract and CMBX balances (2) 12,757,975 14,927,490 14,788,453 12,216,863 9,407,819 Subtotal $135,359,856 $124,874,017 $122,021,314 $113,921,820 $111,601,254 Net interest margin (excluding PAA)* 1.28% 1.51% 1.49% 1.50% 1.56%

© Copyright 2019 Annaly Capital Management, Inc. All rights reserved. Glossary 33 *Represents constituents as of July 15, 2019. 1. Consists of AGNC, ANH, ARR, CMO, EARN, and ORC. 2. Consists of ABR, ACRE, ARI, BXMT, GPMT, HCFT, KREF, LADR, LOAN, RC, SACH, STWD, TRTX and XAN. 3. Consists of AJX, CHMI, CIM, DX, IVR, MFA, MITT, NRZ, NYMT, PMT, RWT, TWO and WMC. ACREG: Refers to Annaly Commercial Real Estate Group Agency Peers: Represents companies comprising the Agency sector within the BBREMTG Index*(1) AMML: Refers to Annaly Middle Market Lending Group ARC: Refers to Annaly Residential Credit Group BBREMTG: Represents the Bloomberg Mortgage REIT Index* Beta: Represents Bloomberg’s ‘OverridableAdjusted Beta’ which estimates the degree to which a stock’s price will fluctuate based on a given movement in the representative market index, calculated from December 31, 2013 to July 15, 2019 with daily periodicity. S&P 500 is used as the relative index for the calculation Commercial Peers: Represents companies comprising the commercial sector within the BBREMTG Index*(2) Consumer Staples: Represents the S5CONS Index* CRE CLO: Refers to Commercial Real Estate Collateralized Loan Obligation CRT: Refers to credit risk transfer securities Equity REITs: Represents the RMZ Index* ESG: Refers to Environmental, Social and Governance FHLB: Refers to the Federal Home Loan Bank Ginnie Mae: Refers to the Government National Mortgage Association GSE: Refers to Government Sponsored Enterprise Hybrid Peers: Represents companies comprising the hybrid sector within the BBREMTG Index*(3) MLPs: Represents the Alerian MLP Index* mREITs or mREIT Peers: Represents the BBREMTG Index* NEOs: Refers to Named Executive Officers NIM: Refers to Net Interest Margin S&P 500: Represents the S&P 500 Index* Select Financials: Represents an average of companies in the S5FINL Index with dividend yields greater than 50 basis points higher than the S&P 500 dividend yield as of July 15, 2019 Unencumbered Assets: Represents Annaly’s excess liquidity and defined as assets that have not been pledged or securitized (generally including cash and cash equivalents, Agency MBS, CRT, Non-Agency MBS, residential mortgage loans, MSRs, reverse repurchase agreements, CRE debt and preferred equity, corporate debt, other unencumbered financial assets and capital stock) Utilities: Represents the Russell 3000 Utilities Index* Yield Sectors: Representative of Consumer Staples, Equity REITs, MLPs, Select Financials and Utilities
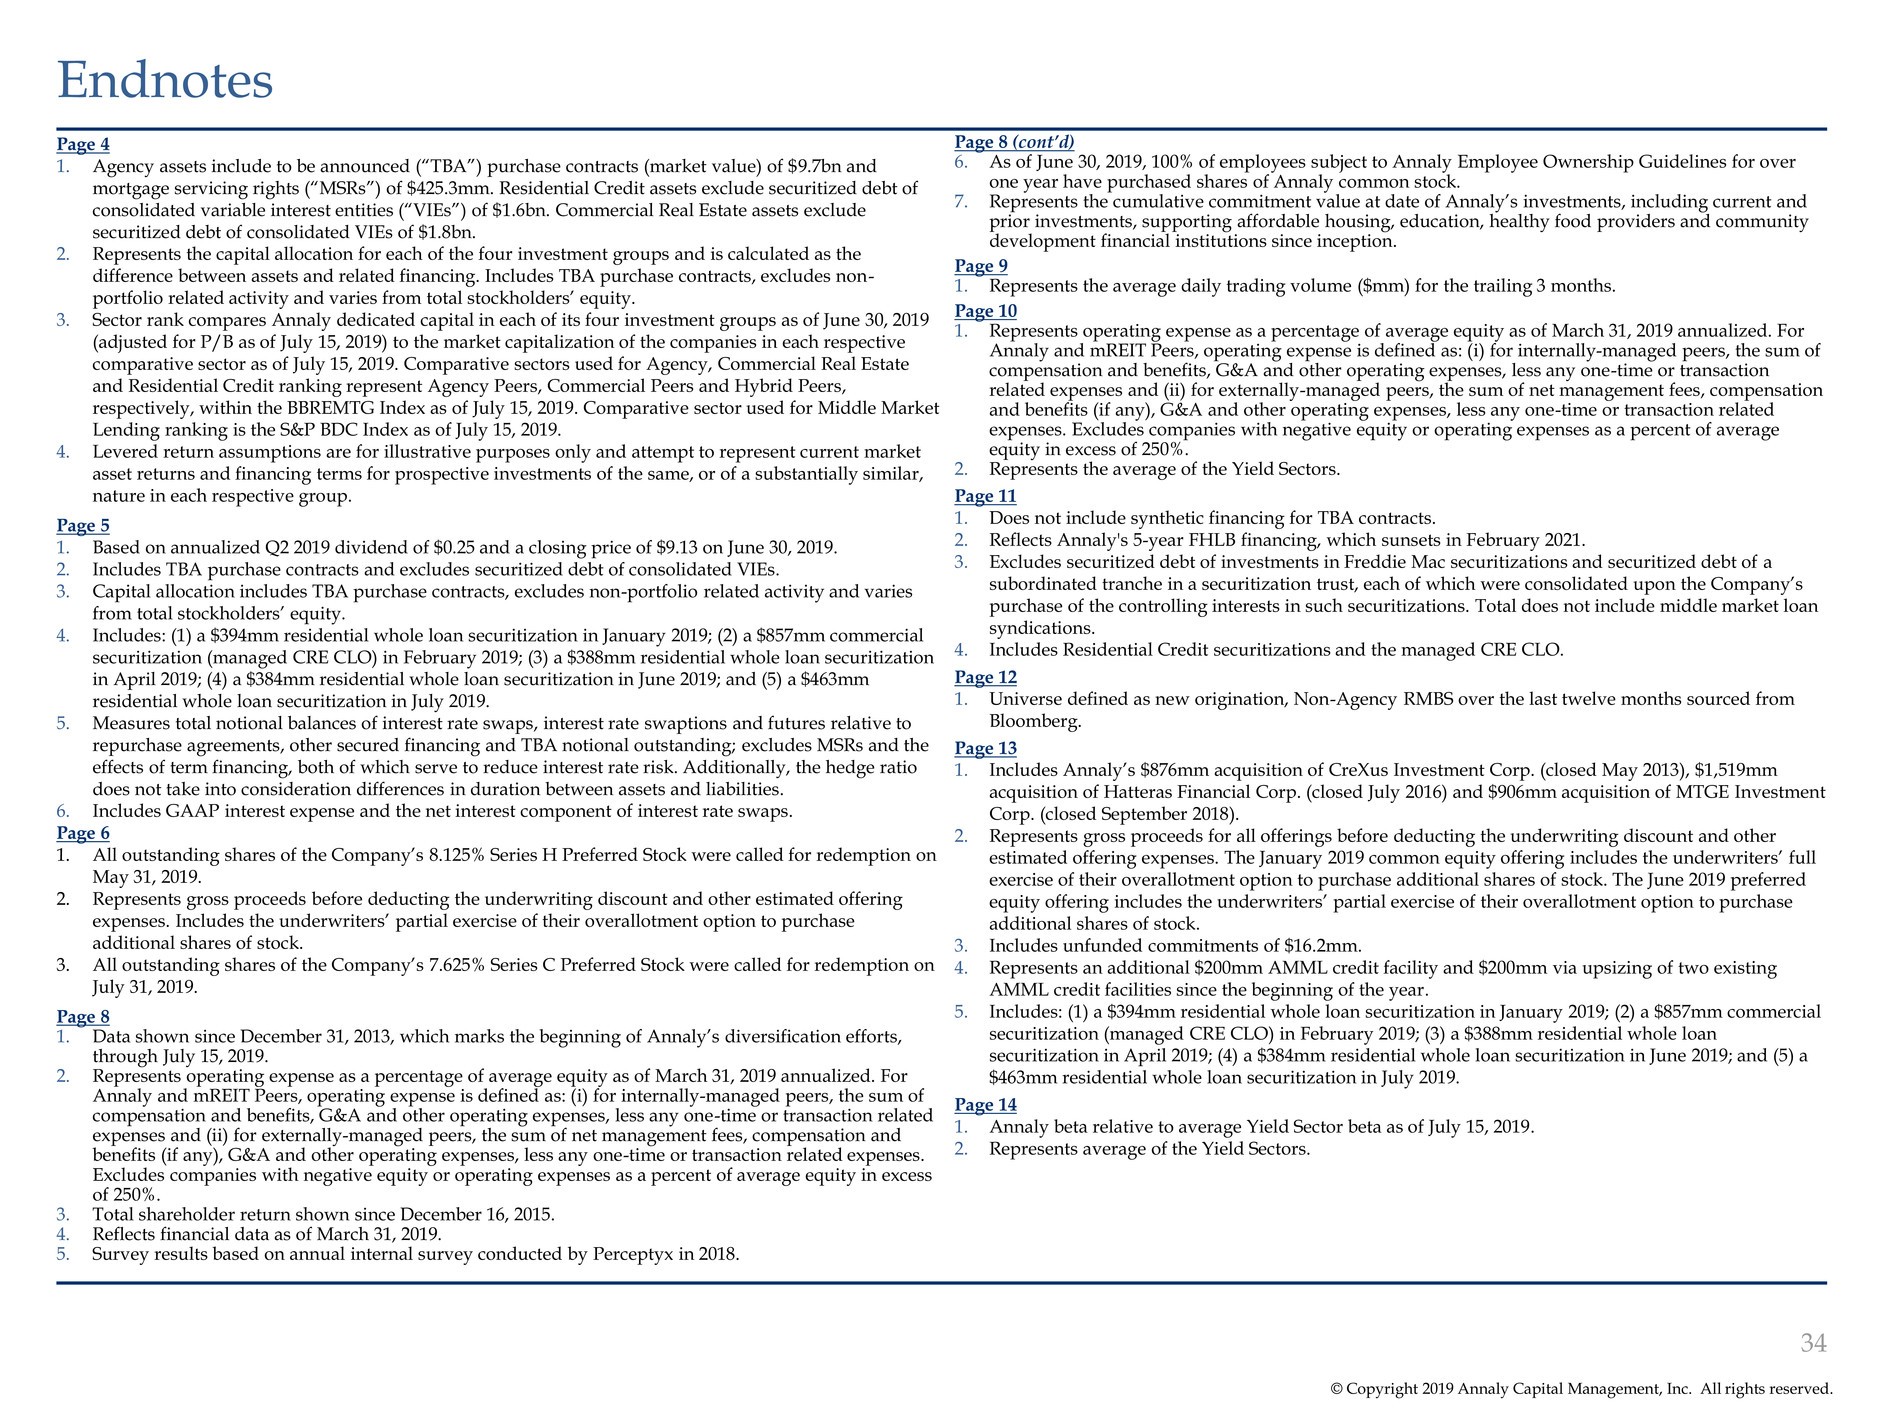
© Copyright 2019 Annaly Capital Management, Inc. All rights reserved. Endnotes 34 Page 4 1. Agency assets include to be announced (“TBA”) purchase contracts (market value) of $9.7bn and mortgage servicing rights (“MSRs”) of $425.3mm. Residential Credit assets exclude securitized debt of consolidated variable interest entities (“VIEs”) of $1.6bn. Commercial Real Estate assets exclude securitized debt of consolidated VIEs of $1.8bn. 2. Represents the capital allocation for each of the four investment groups and is calculated as the difference between assets and related financing. Includes TBA purchase contracts, excludes non- portfolio related activity and varies from total stockholders’ equity. 3. Sector rank compares Annaly dedicated capital in each of its four investment groups as of June 30, 2019 (adjusted for P/B as of July 15, 2019) to the market capitalization of the companies in each respective comparative sector as of July 15, 2019. Comparative sectors used for Agency, Commercial Real Estate and Residential Credit ranking represent Agency Peers, Commercial Peers and Hybrid Peers, respectively, within the BBREMTG Index as of July 15, 2019. Comparative sector used for Middle Market Lending ranking is the S&P BDC Index as of July 15, 2019. 4. Levered return assumptions are for illustrative purposes only and attempt to represent current market asset returns and financing terms for prospective investments of the same, or of a substantially similar, nature in each respective group. Page 5 1. Based on annualized Q2 2019 dividend of $0.25 and a closing price of $9.13 on June 30, 2019. 2. Includes TBA purchase contracts and excludes securitized debt of consolidated VIEs. 3. Capital allocation includes TBA purchase contracts, excludes non-portfolio related activity and varies from total stockholders’ equity. 4. Includes: (1) a $394mm residential whole loan securitization in January 2019; (2) a $857mm commercial securitization (managed CRE CLO) in February 2019; (3) a $388mm residential whole loan securitization in April 2019; (4) a $384mm residential whole loan securitization in June 2019; and (5) a $463mm residential whole loan securitization in July 2019. 5. Measures total notional balances of interest rate swaps, interest rate swaptions and futures relative to repurchase agreements, other secured financing and TBA notional outstanding; excludes MSRs and the effects of term financing, both of which serve to reduce interest rate risk. Additionally, the hedge ratio does not take into consideration differences in duration between assets and liabilities. 6. Includes GAAP interest expense and the net interest component of interest rate swaps. Page 6 1. All outstanding shares of the Company’s 8.125% Series H Preferred Stock were called for redemption on May 31, 2019. 2. Represents gross proceeds before deducting the underwriting discount and other estimated offering expenses. Includes the underwriters’ partial exercise of their overallotment option to purchase additional shares of stock. 3. All outstanding shares of the Company’s 7.625% Series C Preferred Stock were called for redemption on July 31, 2019. Page 8 1. Data shown since December 31, 2013, which marks the beginning of Annaly’s diversification efforts, through July 15, 2019. 2. Represents operating expense as a percentage of average equity as of March 31, 2019 annualized. For Annaly and mREIT Peers, operating expense is defined as: (i) for internally-managed peers, the sum of compensation and benefits, G&A and other operating expenses, less any one-time or transaction related expenses and (ii) for externally-managed peers, the sum of net management fees, compensation and benefits (if any), G&A and other operating expenses, less any one-time or transaction related expenses. Excludes companies with negative equity or operating expenses as a percent of average equity in excess of 250%. 3. Total shareholder return shown since December 16, 2015. 4. Reflects financial data as of March 31, 2019. 5. Survey results based on annual internal survey conducted by Perceptyx in 2018. Page 8 (cont’d) 6. As of June 30, 2019, 100% of employees subject to Annaly Employee Ownership Guidelines for over one year have purchased shares of Annaly common stock. 7. Represents the cumulative commitment value at date of Annaly’s investments, including current and prior investments, supporting affordable housing, education, healthy food providers and community development financial institutions since inception. Page 9 1. Represents the average daily trading volume ($mm) for the trailing 3 months. Page 10 1. Represents operating expense as a percentage of average equity as of March 31, 2019 annualized. For Annaly and mREIT Peers, operating expense is defined as: (i) for internally-managed peers, the sum of compensation and benefits, G&A and other operating expenses, less any one-time or transaction related expenses and (ii) for externally-managed peers, the sum of net management fees, compensation and benefits (if any), G&A and other operating expenses, less any one-time or transaction related expenses. Excludes companies with negative equity or operating expenses as a percent of average equity in excess of 250%. 2. Represents the average of the Yield Sectors. Page 11 1. Does not include synthetic financing for TBA contracts. 2. Reflects Annaly's 5-year FHLB financing, which sunsets in February 2021. 3. Excludes securitized debt of investments in Freddie Mac securitizations and securitized debt of a subordinated tranche in a securitization trust, each of which were consolidated upon the Company’s purchase of the controlling interests in such securitizations. Total does not include middle market loan syndications. 4. Includes Residential Credit securitizations and the managed CRE CLO. Page 12 1. Universe defined as new origination, Non-Agency RMBS over the last twelve months sourced from Bloomberg. Page 13 1. Includes Annaly’s $876mm acquisition of CreXus Investment Corp. (closed May 2013), $1,519mm acquisition of Hatteras Financial Corp. (closed July 2016) and $906mm acquisition of MTGE Investment Corp. (closed September 2018). 2. Represents gross proceeds for all offerings before deducting the underwriting discount and other estimated offering expenses. The January 2019 common equity offering includes the underwriters’ full exercise of their overallotment option to purchase additional shares of stock. The June 2019 preferred equity offering includes the underwriters’ partial exercise of their overallotment option to purchase additional shares of stock. 3. Includes unfunded commitments of $16.2mm. 4. Represents an additional $200mm AMML credit facility and $200mm via upsizing of two existing AMML credit facilities since the beginning of the year. 5. Includes: (1) a $394mm residential whole loan securitization in January 2019; (2) a $857mm commercial securitization (managed CRE CLO) in February 2019; (3) a $388mm residential whole loan securitization in April 2019; (4) a $384mm residential whole loan securitization in June 2019; and (5) a $463mm residential whole loan securitization in July 2019. Page 14 1. Annaly beta relative to average Yield Sector beta as of July 15, 2019. 2. Represents average of the Yield Sectors.
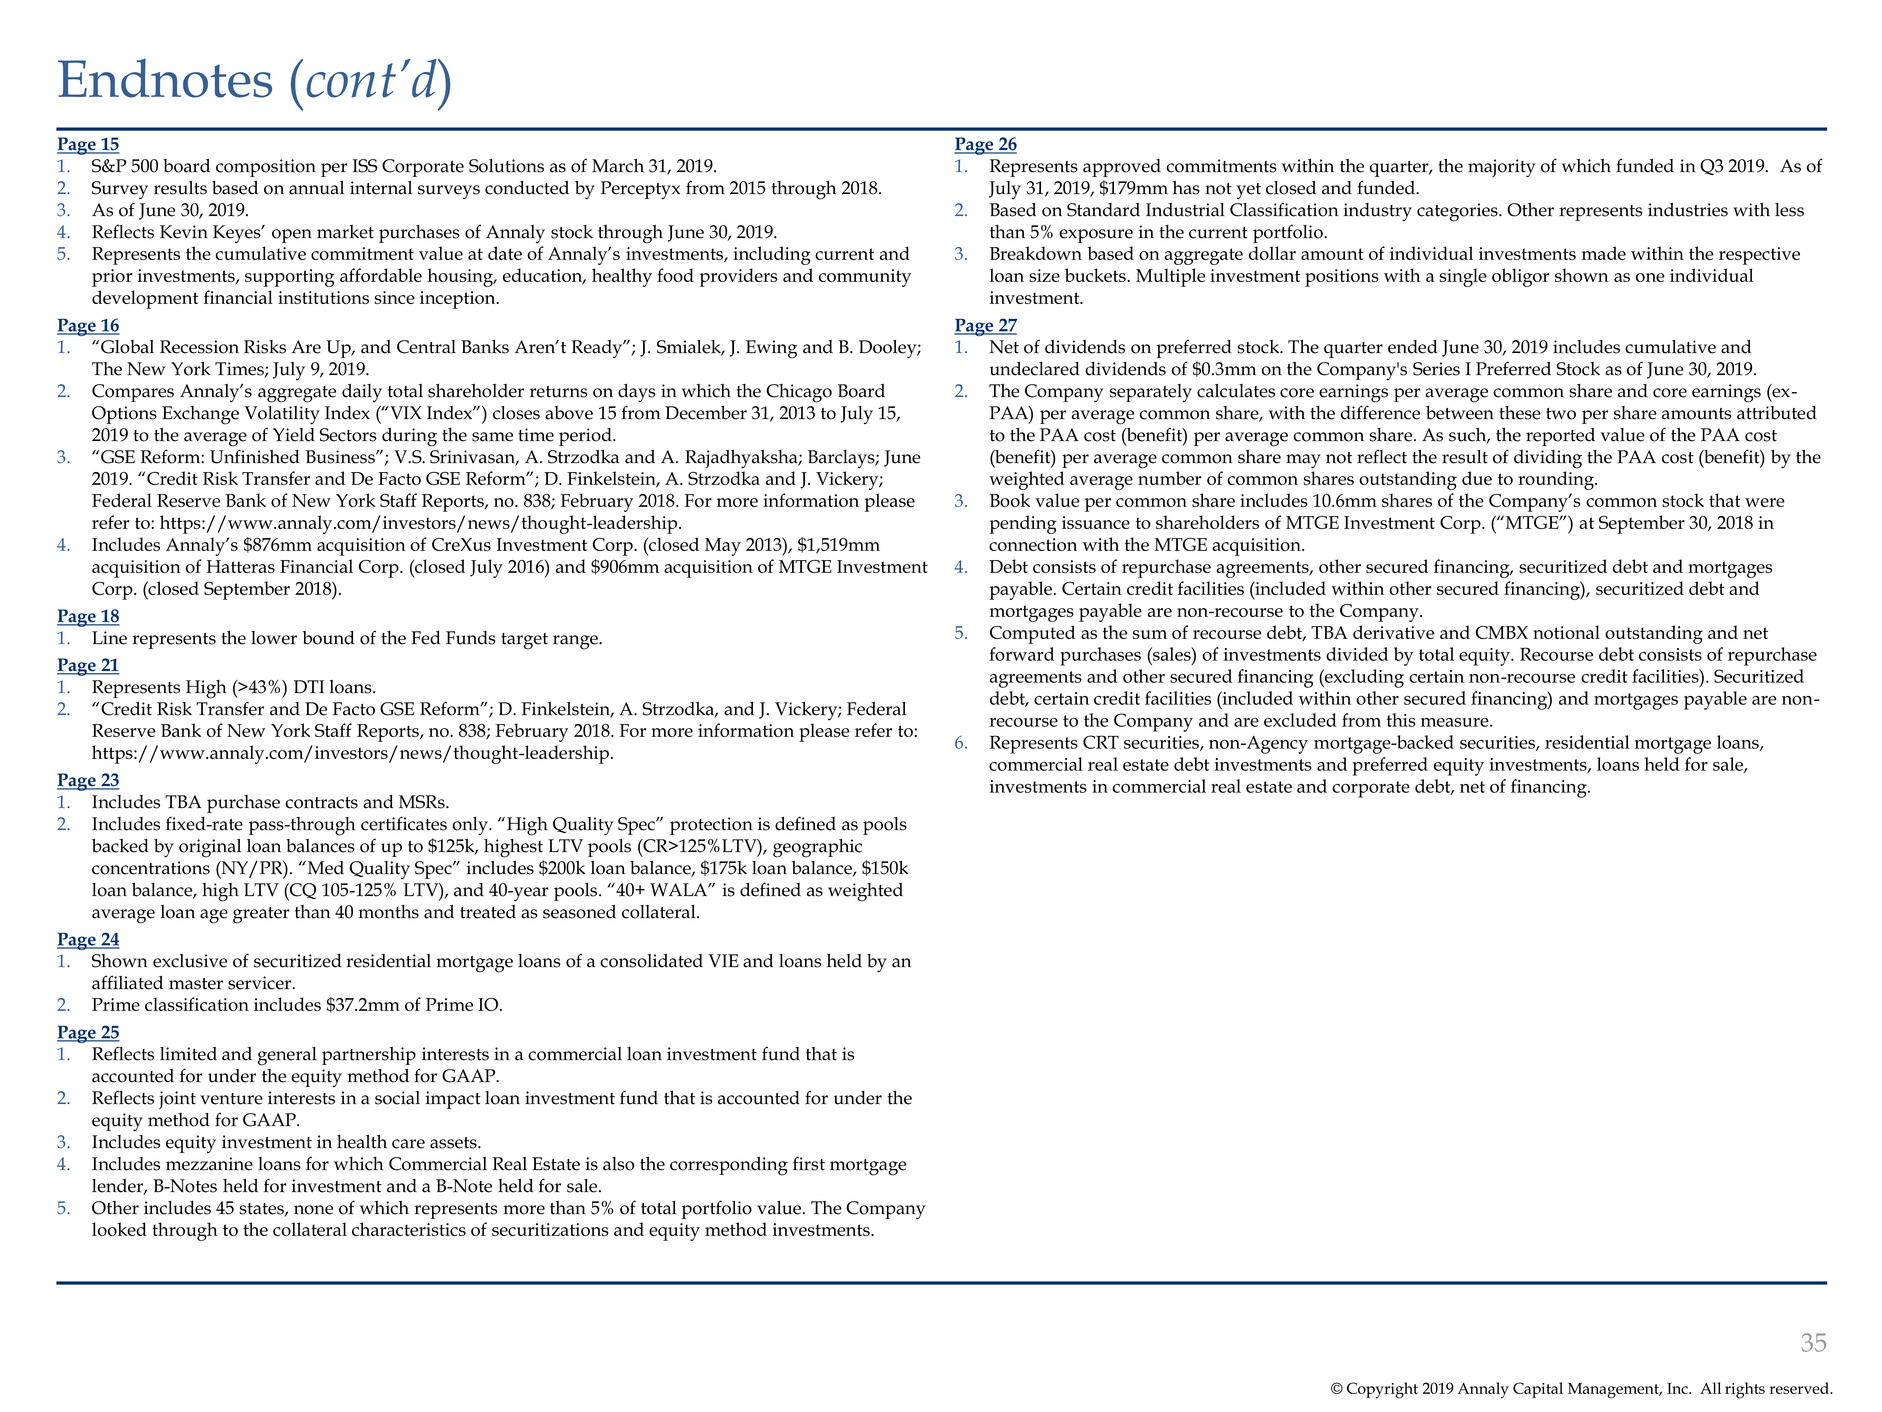
© Copyright 2019 Annaly Capital Management, Inc. All rights reserved. Endnotes (cont’d) 35 Page 15 1. S&P 500 board composition per ISS Corporate Solutions as of March 31, 2019. 2. Survey results based on annual internal surveys conducted by Perceptyx from 2015 through 2018. 3. As of June 30, 2019. 4. Reflects Kevin Keyes’ open market purchases of Annaly stock through June 30, 2019. 5. Represents the cumulative commitment value at date of Annaly’s investments, including current and prior investments, supporting affordable housing, education, healthy food providers and community development financial institutions since inception. Page 16 1. “Global Recession Risks Are Up, and Central Banks Aren’t Ready”; J. Smialek, J. Ewing and B. Dooley; The New York Times; July 9, 2019. 2. Compares Annaly’s aggregate daily total shareholder returns on days in which the Chicago Board Options Exchange Volatility Index (“VIX Index”) closes above 15 from December 31, 2013 to July 15, 2019 to the average of Yield Sectors during the same time period. 3. “GSE Reform: Unfinished Business”; V.S. Srinivasan, A. Strzodka and A. Rajadhyaksha; Barclays; June 2019. “Credit Risk Transfer and De Facto GSE Reform”; D. Finkelstein, A. Strzodka and J. Vickery; Federal Reserve Bank of New York Staff Reports, no. 838; February 2018. For more information please refer to: https://www.annaly.com/investors/news/thought-leadership. 4. Includes Annaly’s $876mm acquisition of CreXus Investment Corp. (closed May 2013), $1,519mm acquisition of Hatteras Financial Corp. (closed July 2016) and $906mm acquisition of MTGE Investment Corp. (closed September 2018). Page 18 1. Line represents the lower bound of the Fed Funds target range. Page 21 1. Represents High (>43%) DTI loans. 2. “Credit Risk Transfer and De Facto GSE Reform”; D. Finkelstein, A. Strzodka, and J. Vickery; Federal Reserve Bank of New York Staff Reports, no. 838; February 2018. For more information please refer to: https://www.annaly.com/investors/news/thought-leadership. Page 23 1. Includes TBA purchase contracts and MSRs. 2. Includes fixed-rate pass-through certificates only. “High Quality Spec” protection is defined as pools backed by original loan balances of up to $125k, highest LTV pools (CR>125%LTV), geographic concentrations (NY/PR). “Med Quality Spec” includes $200k loan balance, $175k loan balance, $150k loan balance, high LTV (CQ 105-125% LTV), and 40-year pools. “40+ WALA” is defined as weighted average loan age greater than 40 months and treated as seasoned collateral. Page 24 1. Shown exclusive of securitized residential mortgage loans of a consolidated VIE and loans held by an affiliated master servicer. 2. Prime classification includes $37.2mm of Prime IO. Page 25 1. Reflects limited and general partnership interests in a commercial loan investment fund that is accounted for under the equity method for GAAP. 2. Reflects joint venture interests in a social impact loan investment fund that is accounted for under the equity method for GAAP. 3. Includes equity investment in health care assets. 4. Includes mezzanine loans for which Commercial Real Estate is also the corresponding first mortgage lender, B-Notes held for investment and a B-Note held for sale. 5. Other includes 45 states, none of which represents more than 5% of total portfolio value. The Company looked through to the collateral characteristics of securitizations and equity method investments. Page 26 1. Represents approved commitments within the quarter, the majority of which funded in Q3 2019. As of July 31, 2019, $179mm has not yet closed and funded. 2. Based on Standard Industrial Classification industry categories. Other represents industries with less than 5% exposure in the current portfolio. 3. Breakdown based on aggregate dollar amount of individual investments made within the respective loan size buckets. Multiple investment positions with a single obligor shown as one individual investment. Page 27 1. Net of dividends on preferred stock. The quarter ended June 30, 2019 includes cumulative and undeclared dividends of $0.3mm on the Company's Series I Preferred Stock as of June 30, 2019. 2. The Company separately calculates core earnings per average common share and core earnings (ex- PAA) per average common share, with the difference between these two per share amounts attributed to the PAA cost (benefit) per average common share. As such, the reported value of the PAA cost (benefit) per average common share may not reflect the result of dividing the PAA cost (benefit) by the weighted average number of common shares outstanding due to rounding. 3. Book value per common share includes 10.6mm shares of the Company’s common stock that were pending issuance to shareholders of MTGE Investment Corp. (“MTGE”) at September 30, 2018 in connection with the MTGE acquisition. 4. Debt consists of repurchase agreements, other secured financing, securitized debt and mortgages payable. Certain credit facilities (included within other secured financing), securitized debt and mortgages payable are non-recourse to the Company. 5. Computed as the sum of recourse debt, TBA derivative and CMBX notional outstanding and net forward purchases (sales) of investments divided by total equity. Recourse debt consists of repurchase agreements and other secured financing (excluding certain non-recourse credit facilities). Securitized debt, certain credit facilities (included within other secured financing) and mortgages payable are non- recourse to the Company and are excluded from this measure. 6. Represents CRT securities, non-Agency mortgage-backed securities, residential mortgage loans, commercial real estate debt investments and preferred equity investments, loans held for sale, investments in commercial real estate and corporate debt, net of financing.

© Copyright 2019 Annaly Capital Management, Inc. All rights reserved. Endnotes (cont’d) 36 Non-GAAP Reconciliations Page 31 1. Includes depreciation and amortization expense related to equity method investments. 2. Beginning with the quarter ended September 30, 2018, the Company excludes non-core (income) loss allocated to equity method investments, which represents the unrealized (gains) losses allocated to equity interests in a portfolio of MSR, which is a component of Other income (loss). The quarter ended December 31, 2018 also includes a realized gain on sale within an unconsolidated joint venture, which is a component of Other income (loss). 3. The quarter ended September 30, 2018 reflects the amount of consideration paid for the acquisition of MTGE in excess of the fair value of net assets acquired. This amount is primarily attributable to a decline in portfolio valuation between the pricing and closing dates of the transaction and is consistent with changes in market values observed for similar instruments over the same period. 4. Represents costs incurred in connection with two securitizations of residential whole loans for the quarter ended June 30, 2019. Represents costs incurred in connection with a securitization of commercial loans and a securitization of residential whole loans for the quarter ended March 31, 2019. Represents costs incurred in connection with the MTGE transaction and costs incurred in connection with a securitization of residential whole loans for the quarters ended September 30, 2018 and December 31, 2018. Represents costs incurred in connection with a securitization of residential whole loans for the quarter ended June 30, 2019. 5. TBA dollar roll income and CMBX coupon income each represent a component of net gains (losses) on other derivatives. CMBX coupon income totaled $0.8mm, $1.1mm, $1.2mm and $1.2mm for the quarters ended June 30, 2019, March 31, 2019, December 31, 2018 and September 30, 2018, respectively. There were no adjustments for CMBX coupon income prior to September 30, 2018. 6. MSR amortization represents the portion of changes in fair value that is attributable to the realization of estimated cash flows on the Company’s MSR portfolio and is reported as a component of Net unrealized gains (losses) on instruments measured at fair value. 7. Net of dividends on preferred stock. The quarter ended June 30, 2019 includes cumulative and undeclared dividends of $0.3mm on the Company's Series I Preferred Stock as of June 30, 2019. Page 32 1. Average cost of interest bearing liabilities represents annualized economic interest expense divided by average interest bearing liabilities. Average interest bearing liabilities reflects the average amortized cost during the period. Economic interest expense is comprised of GAAP interest expense and the net interest component of interest rate swaps. 2. CMBX coupon income and average CMBX balances have only been applied to the quarters ended June 30, 2019, March 31, 2019, December 31, 2018 and September 30, 2018. The impact to net interest margin (ex-PAA) in prior periods was immaterial.


