
Fourth Quarter 2019 Investor Presentation February 12, 2020
© Copyright 2020 Annaly Capital Management, Inc. All rights reserved. Important Notices This presentation is issued by Annaly Capital Management, Inc. ("Annaly"), a publicly traded company that has elected to be taxed as a real estate investment trust for federal income tax purposes and is being furnished in connection with Annaly’s Fourth Quarter 2019 quarterly report. This presentation is provided for investors in Annaly for informational purposes only and is not an offer to sell, or a solicitation of an offer to buy, any security or instrument. Annaly is not a registered investment adviser. Annaly is managed by Annaly Management Company LLC ("AMCO"), a registered investment adviser. This presentation is not a communication by AMCO and is not designed to maintain any existing AMCO client or investor or solicit new AMCO clients or investors. Forward-Looking Statements This presentation, other written or oral communications, and our public documents to which we refer contain or incorporate by reference certain forward-looking statements which are based on various assumptions (some of which are beyond our control) and may be identified by reference to a future period or periods or by the use of forward-looking terminology, such as “may,” “will,” “believe,” “expect,” “anticipate,” “continue,” or similar terms or variations on those terms or the negative of those terms. Such statements include those relating to our future performance, macro outlook, the interest rate and credit environments, tax reform and future opportunities. Actual results could differ materially from those set forth in forward-looking statements due to a variety of factors, including, but not limited to, changes in interest rates; changes in the yield curve; changes in prepayment rates; the availability of mortgage-backed securities (“MBS”) and other securities for purchase; the availability of financing and, if available, the terms of any financing; changes in the market value of our assets; changes in business conditions and the general economy; our ability to grow our commercial real estate business; our ability to grow our residential credit business; our ability to grow our middle market lending business; credit risks related to our investments in credit risk transfer securities, residential mortgage-backed securities and related residential mortgage credit assets, commercial real estate assets and corporate debt; risks related to investments in mortgage servicing rights; our ability to consummate any contemplated investment opportunities; changes in government regulations or policy affecting our business; our ability to maintain our qualification as a REIT for U.S. federal income tax purposes; our ability to maintain our exemption from registration under the Investment Company Act of 1940, as amended; and risks and uncertainties associated with the Internalization, including but not limited to the occurrence of any event, change or other circumstances that could give rise to the termination of the Internalization Agreement; the outcome of any legal proceedings that may be instituted against the parties to the Internalization Agreement; the inability to complete the Internalization due to the failure to satisfy closing conditions or otherwise; risks that the Internalization disrupts our current plans and operations; the impact, if any, of the announcement or pendency of the Internalization on our relationships with third parties; and the amount of the costs, fees, expenses charges related to the Internalization; and the risk that the expected benefits, including long-term cost savings, of the Internalization are not achieved. For a discussion of the risks and uncertainties which could cause actual results to differ from those contained in the forward-looking statements, see “Risk Factors” in our most recent Annual Report on Form 10-K and any subsequent Quarterly Reports on Form 10-Q. We do not undertake, and specifically disclaim any obligation, to publicly release the result of any revisions which may be made to any forward-looking statements to reflect the occurrence of anticipated or unanticipated events or circumstances after the date of such statements, except as required by law. We routinely post important information for investors on our website, www.annaly.com. We intend to use this webpage as a means of disclosing material information, for complying with our disclosure obligations under Regulation FD and to post and update investor presentations and similar materials on a regular basis. Annaly encourages investors, analysts, the media and others interested in Annaly to monitor the Investors section of our website, in addition to following our press releases, SEC filings, public conference calls, presentations, webcasts and other information we post from time to time on our website. To sign-up for email-notifications, please visit the “Email Alerts” section of our website, www.annaly.com, under the “Investors” section and enter the required information to enable notifications. The information contained on, or that may be accessed through, our webpage is not incorporated by reference into, and is not a part of, this document. Past performance is no guarantee of future results. There is no guarantee that any investment strategy referenced herein will work under all market conditions. Prior to making any investment decision, you should evaluate your ability to invest for the long-term, especially during periods of downturns in the market. You alone assume the responsibility of evaluating the merits and risks associated with any potential investment or investment strategy referenced herein. To the extent that this material contains reference to any past specific investment recommendations or strategies which were or would have been profitable to any person, it should not be assumed that recommendations made in the future will be profitable or will equal the performance of such past investment recommendations or strategies. The information contained herein is not intended to provide, and should not be relied upon for accounting, legal or tax advice or investment recommendations for Annaly or any of its affiliates. Regardless of source, information is believed to be reliable for purposes used herein, but Annaly makes no representation or warranty as to the accuracy or completeness thereof and does not take any responsibility for information obtained from sources outside of Annaly. Certain information contained in the presentation discusses general market activity, industry or sector trends, or other broad-based economic, market or political conditions and should not be construed as research or investment advice. Non-GAAP Financial Measures This presentation includes certain non-GAAP financial measures, including core earnings metrics, which are presented both inclusive and exclusive of the premium amortization adjustment (“PAA”). We believe the non-GAAP financial measures are useful for management, investors, analysts, and other interested parties in evaluating our performance but should not be viewed in isolation and are not a substitute for financial measures computed in accordance with U.S. generally accepted accounting principles (“GAAP”). In addition, we may calculate non-GAAP metrics, which include core earnings, and the PAA, differently than our peers making comparative analysis difficult. Please see the section entitled “Non-GAAP Reconciliations” in the attached Appendix for a reconciliation to the most directly comparable GAAP financial measures. 2

© Copyright 2020 Annaly Capital Management, Inc. All rights reserved. The diversification, scale and liquidity of Annaly’s complementary investment businesses provide a broad range of opportunities in today’s markets Annaly is a Leading Diversified Capital Manager Source: Company filings. Financial data as of December 31, 2019. Market data as of January 31, 2020. Detailed endnotes and a glossary of defined terms are included at the end of this presentation. $129 billion Total Assets(1) Evolved & Evolving 38 Distinct Investment Options & Counting ESG Focus Robust Corporate Responsibility & Governance $15+ billion Permanent Capital(2) 4 Investment Strategies Agency, Residential Credit, Commercial Real Estate & Middle Market Lending 180+ Talented Professionals $3 billion Combined Deal Value of Transformational Acquisitions(4) 91% Total Shareholder Return Since Diversification(3) 3

© Copyright 2020 Annaly Capital Management, Inc. All rights reserved. $0.82 | $0.26 Fourth Quarter 2019 Financial Highlights Source: Company filings. Financial data as of December 31, 2019, unless otherwise noted. * Represents a non-GAAP financial measure; see Appendix. Detailed endnotes and a glossary of defined terms are included at the end of this presentation. $0.25 / 10.6% $9.66 7.6% / 14.1% $840mm of resi whole loan securitizations since the beginning of Q4(4) $7.9bn of unencumbered assets $128.7bn $15.8bn $85bn Hedge portfolio includes $74bn of swaps, $5bn of payer swaptions and $6bn of futures contracts Earnings & Book Value Investment Portfolio Financing, Liquidity & Hedging Earnings (Loss) per Share Dividend per Share / Yield(1) Net Interest Margin (ex. PAA)* Book Value per Share Economic Return – Q4 / FY Core (ex. PAA)*GAAP Financing & Liquidity Total Portfolio(2) Total Stockholders’ Equity Total Hedge Portfolio Net Interest Margin Capital Allocation(3) Average Cost of Funds(6)Economic Leverage Hedge Ratio(5) Average Yield on Interest Earning Assets (ex. PAA)* 1.10% 1.41% Q3 2019 Q4 2019 0.75% 1.67% Q3 2019 Q4 2019 Agency 74% AMML 9% ARC 10% ACREG 7% Credit 26% 3.26% 3.25% Q3 2019 Q4 2019 7.7x 7.2x Q3 2019 Q4 2019 73% 75% Q3 2019 Q4 2019 2.28% 2.01% Q3 2019 Q4 2019 4
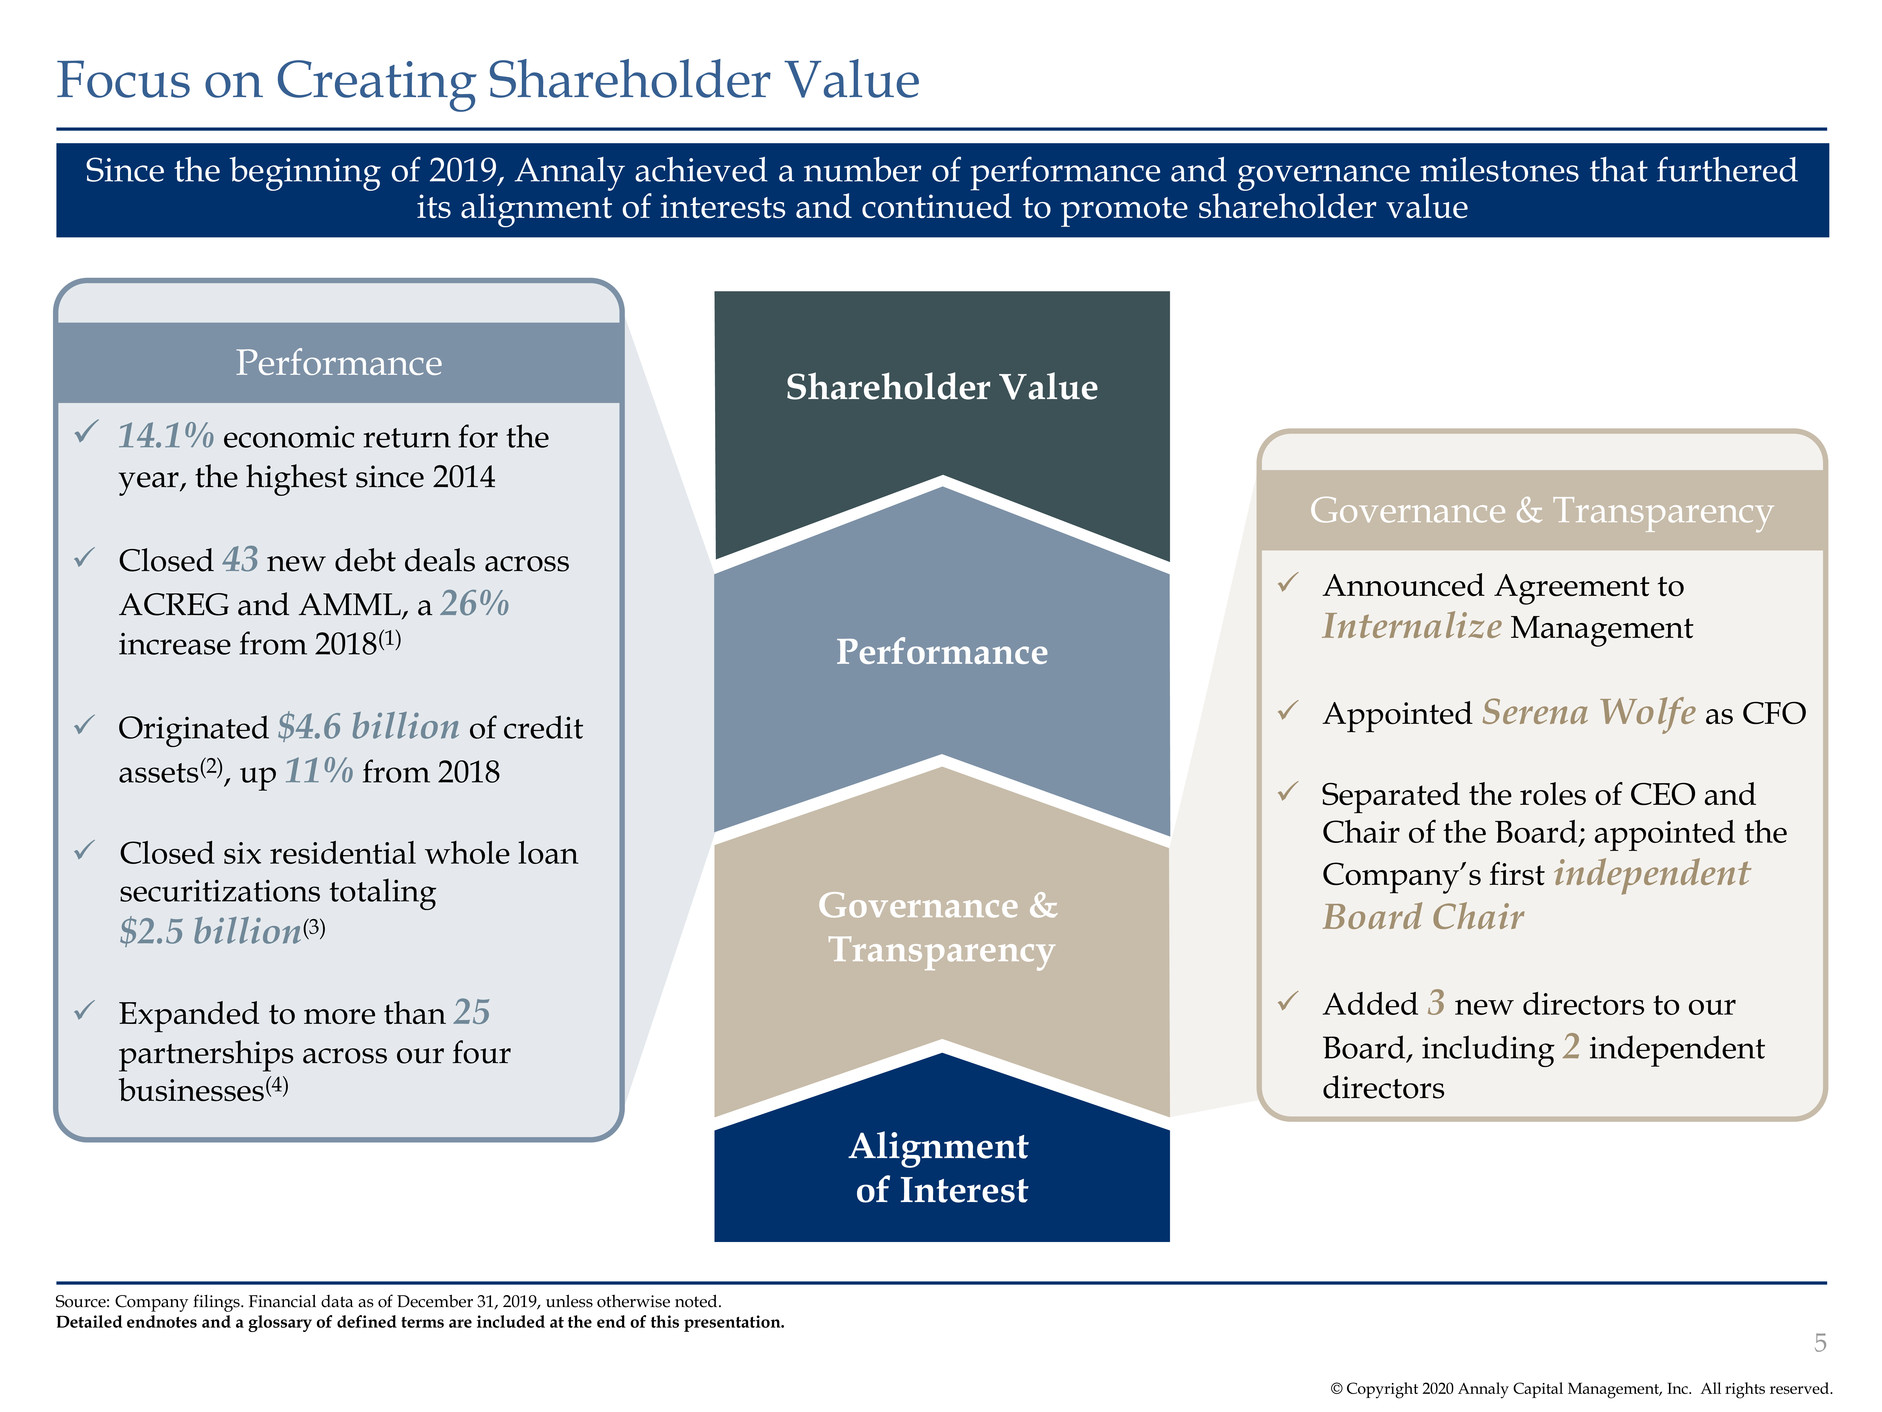
© Copyright 2020 Annaly Capital Management, Inc. All rights reserved. Focus on Creating Shareholder Value Governance & Transparency ✓ Announced Agreement to Internalize Management ✓ Appointed Serena Wolfe as CFO ✓ Separated the roles of CEO and Chair of the Board; appointed the Company’s first independent Board Chair ✓ Added 3 new directors to our Board, including 2 independent directors Performance ✓ 14.1% economic return for the year, the highest since 2014 ✓ Closed 43 new debt deals across ACREG and AMML, a 26% increase from 2018(1) ✓ Originated $4.6 billion of credit assets(2), up 11% from 2018 ✓ Closed six residential whole loan securitizations totaling $2.5 billion(3) ✓ Expanded to more than 25 partnerships across our four businesses(4) Since the beginning of 2019, Annaly achieved a number of performance and governance milestones that furthered its alignment of interests and continued to promote shareholder value Source: Company filings. Financial data as of December 31, 2019, unless otherwise noted. Detailed endnotes and a glossary of defined terms are included at the end of this presentation. 5 Shareholder Value Performance Governance & Transparency Alignment of Interest
Recent Developments: Internalization Transaction

© Copyright 2020 Annaly Capital Management, Inc. All rights reserved. Internalization underscores Annaly’s commitment to further align interests of shareholders and continues efforts around enhancing governance practices Overview of Internalization Transaction Source: Company filings. Note: For more information on the internalization transaction, please refer to the press release and Form 8-K filed on February 12, 2020. “The decision to internalize underscores our commitment to further align the interests of management and shareholders and demonstrates our continued efforts toward enhanced governance practices. The Board, together with management, believes this transaction best positions Annaly for long-term success and continued growth of the investment platform.” - Thomas Hamilton, Chair of the Board Overview • Definitive agreement to acquire its external manager, Annaly Management Company LLC (the “Manager”), and transition to an internally-managed REIT • The internalization was unanimously approved by the independent directors of Annaly’s full Board following the unanimous recommendation from an independent Special Committee of the Board • All parties were represented by separate and independent legal and financial advisors Timing • Anticipated closing in Q2 2020 subject to customary closing conditions Shareholder- Friendly Structure • Annaly agreed to acquire the equity interests of the Manager for a nominal cash purchase price of $1.00 to effectuate the transaction • Manager will waive acceleration fee in connection with internalization Continuity & Alignment of Team • Upon closing, all employees of the Manager will become employees of Annaly, and Annaly will assume responsibilities for all employee compensation and benefits • Certain Company senior executives have entered into employment agreements with Annaly (effective at closing) • New compensation arrangements with certain executive officers to include equity component to further align incentives with shareholders 7

© Copyright 2020 Annaly Capital Management, Inc. All rights reserved. Internalization Best Positions Annaly for Long-Term Success Note: For more information on the internalization transaction, please refer to the press release and Form 8-K filed on February 12, 2020. ✓ Stronger alignment of incentives between management and shareholders ✓ Eliminates any potential conflicts of interest inherent in an external management structure ✓ Equity compensation for senior executives further aligns employees with shareholders ✓ Furthers Annaly’s commitment to robust governance practices ✓ Annaly shareholders benefit from increased transparency and disclosure ✓ The internalization is expected to create cost savings from economies of scale ✓ Provides an opportunity for incremental cost control and operating flexibility, leading to potential long-term earnings accretion ✓ Opens up strategic opportunities to consider more operationally-intensive businesses ✓ Potentially expands and diversifies Annaly’s investor base ✓ Potentially enhances REIT valuation Alignment of Interests Governance & Transparency Strategic and Operational Flexibility Continuity of Management Investors ✓ Executed transitional employment agreements with certain Company senior executives (effective at closing) ✓ All employees of the Manager will become employees of Annaly 8
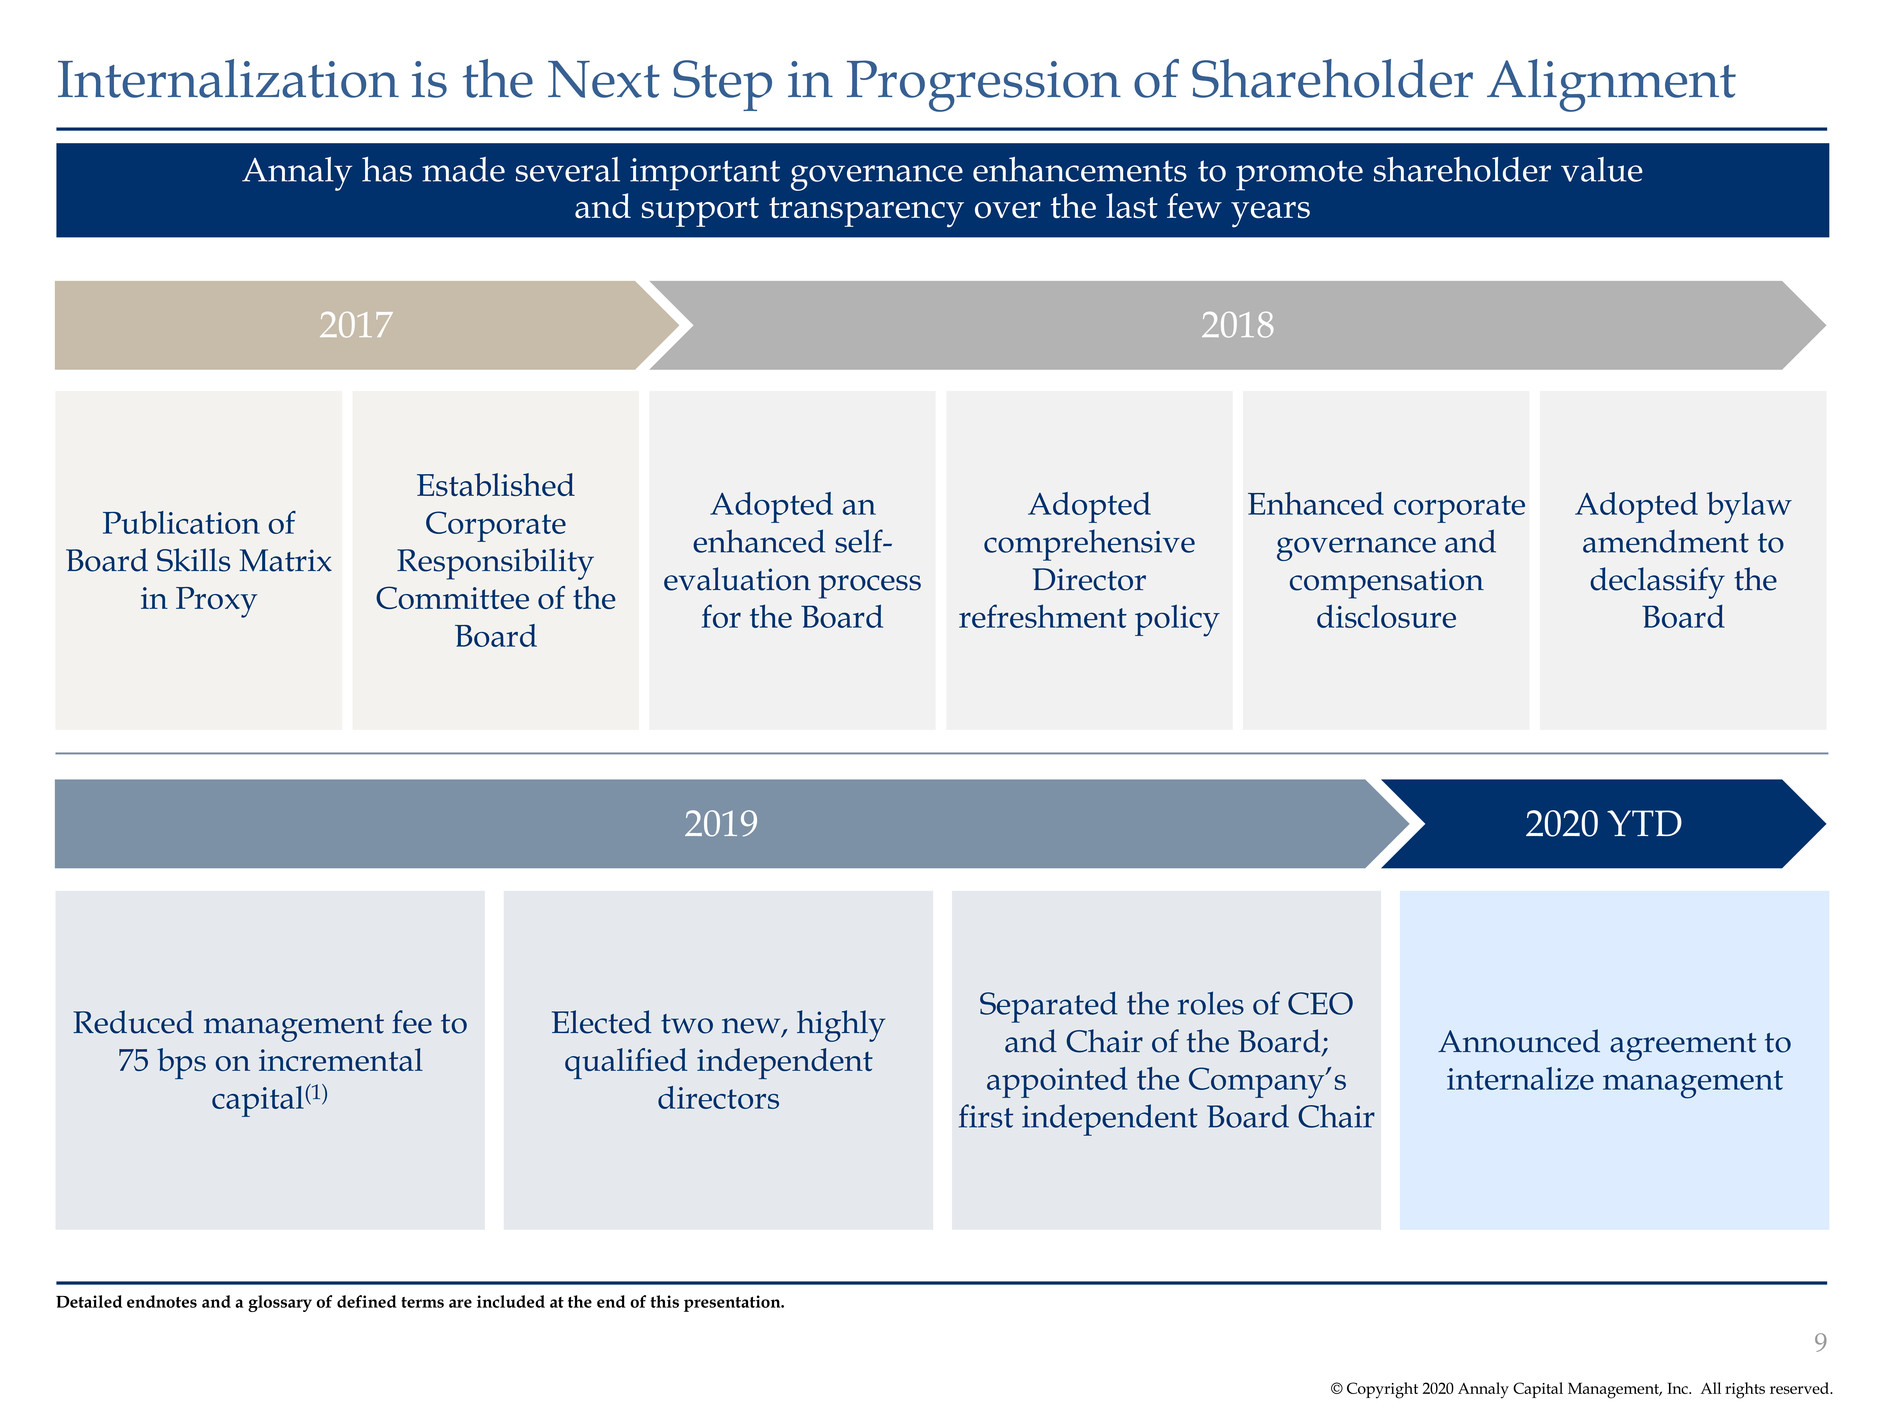
© Copyright 2020 Annaly Capital Management, Inc. All rights reserved. Annaly has made several important governance enhancements to promote shareholder value and support transparency over the last few years Internalization is the Next Step in Progression of Shareholder Alignment 9 2017 2018 Publication of Board Skills Matrix in Proxy Established Corporate Responsibility Committee of the Board Adopted an enhanced self- evaluation process for the Board Adopted comprehensive Director refreshment policy Enhanced corporate governance and compensation disclosure Adopted bylaw amendment to declassify the Board Reduced management fee to 75 bps on incremental capital(1) Elected two new, highly qualified independent directors Separated the roles of CEO and Chair of the Board; appointed the Company’s first independent Board Chair Announced agreement to internalize management 2019 2020 YTD Detailed endnotes and a glossary of defined terms are included at the end of this presentation.

© Copyright 2020 Annaly Capital Management, Inc. All rights reserved. Internalization Expected to Enhance Annaly’s Cost Structure Over Long Term Source: Company filings. Financial data as of December 31, 2019 unless otherwise noted. Detailed endnotes and a glossary of defined terms are included at the end of this presentation. ▪ Annaly’s operating expense is already lower than peers: – 2.6x more efficient than externally managed mREITs – 1.7x more efficient than internally managed mREITs ▪ Upon internalizing, Annaly expects to achieve a long-term range of 1.60% to 1.75% for OpEx as a percentage of equity assuming constant equity base(1) ▪ Annaly’s diversified investment strategy should further benefit from economies of scale as the business raises capital to support accretive growth initiatives Internalization is expected to drive additional long-term savings Operating Expense (“OpEx”) as % of Equity (2) Annaly’s Long-Term Target(1): 1.60%-1.75% 10 4.79% 3.04% – 1.60% - 1.75% 1.84% External mREIT Avg. (Q3'19 Annualized) Internal mREIT Avg. (Q3'19 Annualized) Annaly (2019 Actual) Annaly (Long-Term Target) (2) (1)

Market Environment & Annaly Positioning

© Copyright 2020 Annaly Capital Management, Inc. All rights reserved. The macro outlook remains constructive at the onset of 2020 2020 Macro Outlook Source: Preqin. Data as of January 2020. Detailed endnotes and a glossary of defined terms are included at the end of this presentation. Outlook What Does it Mean for Annaly? ▪ IMF recently confirmed outlook of low but stable global growth(1) ▪ U.S. economy remains resilient amid strong labor market and healthy consumer balance sheets; recession risks have moderated ▪ Housing sector continues to be relatively favorable, suggesting that demand for mortgages will remain robust ▪ Continued economic expansion is supportive of underlying fundamentals of Annaly’s credit businesses ▪ Strong consumer balance sheets and improved housing demand suggest that mortgage origination will remain robust, underlining the investment growth potential in Annaly’s residential credit business ▪ Following the 2019 insurance cuts, the Federal Reserve has signaled an extended pause, anchoring the front-end of the yield curve ▪ Fed alleviated repo market stresses and signaled continued support for front-end markets ▪ Pandemic fears around the coronavirus are likely to have a transitionary impact on U.S. rates markets, suggesting that current concerns around a renewed refinancing wave should recede in coming weeks ▪ Ample liquidity should continue to keep funding markets well supported, which should also support asset valuations ▪ Technical backdrop continues to be relatively strong, with demand driven by $2.6 trillion of dry powder on the sidelines expected to be deployed across private credit(2) ▪ Elevated valuations continue to suggest cautious approach to expanding credit businesses ▪ Residential credit benefits from better fundamentals, making it an asset class that is expected to see continued growth in 2020 ▪ Agency MBS remains at attractive valuations despite strong performance in Q4 Rates Risk Assets Growth 12

Business Update
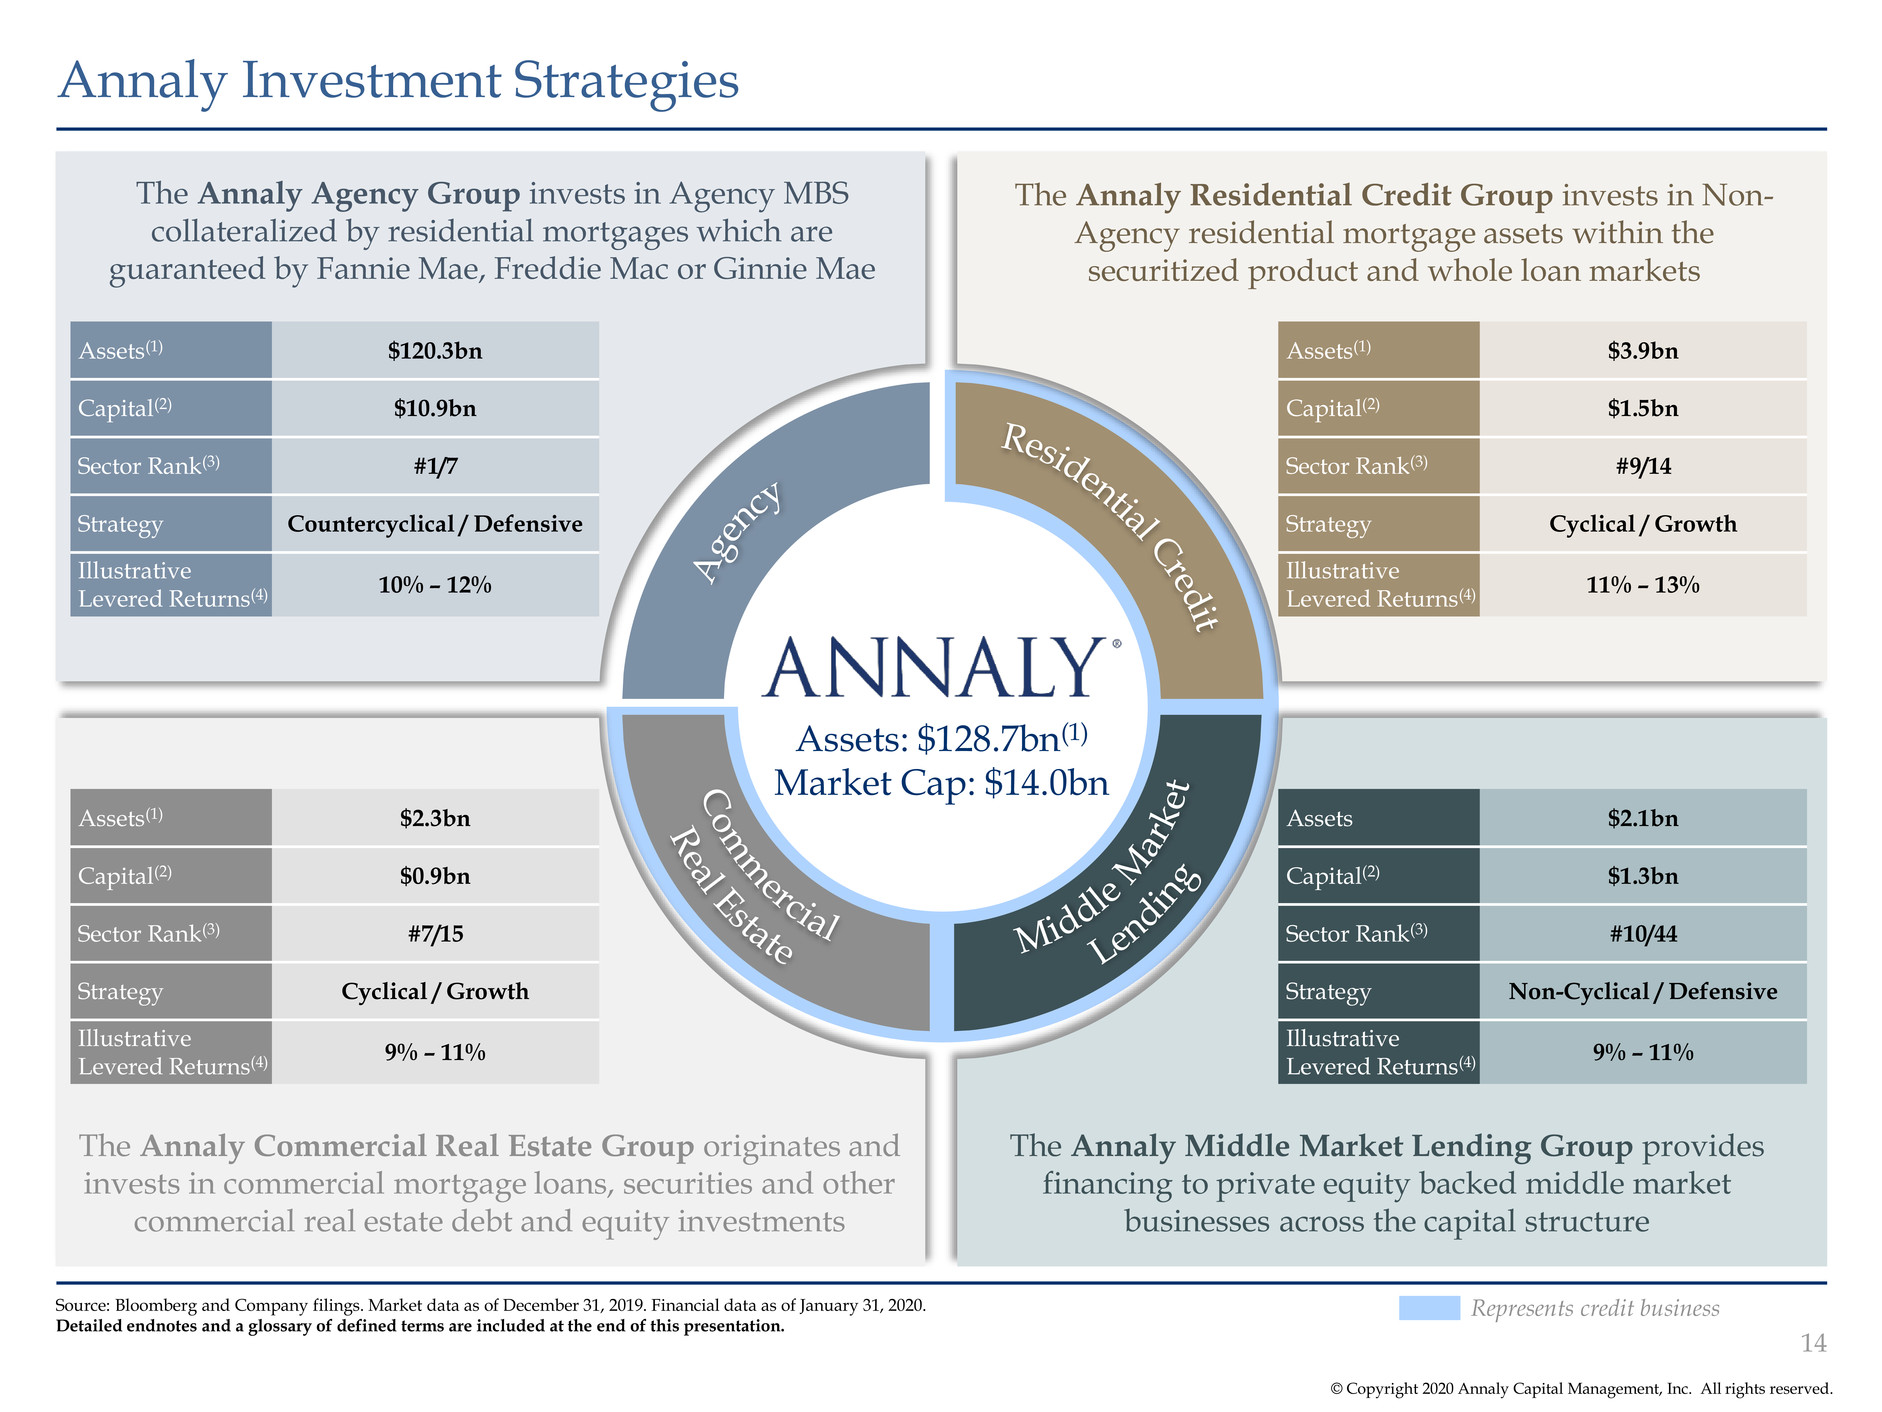
© Copyright 2020 Annaly Capital Management, Inc. All rights reserved. Annaly Investment Strategies Source: Bloomberg and Company filings. Market data as of December 31, 2019. Financial data as of January 31, 2020. Detailed endnotes and a glossary of defined terms are included at the end of this presentation. Represents credit business The Annaly Middle Market Lending Group provides financing to private equity backed middle market businesses across the capital structure The Annaly Commercial Real Estate Group originates and invests in commercial mortgage loans, securities and other commercial real estate debt and equity investments The Annaly Residential Credit Group invests in Non- Agency residential mortgage assets within the securitized product and whole loan markets The Annaly Agency Group invests in Agency MBS collateralized by residential mortgages which are guaranteed by Fannie Mae, Freddie Mac or Ginnie Mae Assets(1) $120.3bn Capital(2) $10.9bn Sector Rank(3) #1/7 Strategy Countercyclical / Defensive Illustrative Levered Returns(4) 10% – 12% Assets(1) $3.9bn Capital(2) $1.5bn Sector Rank(3) #9/14 Strategy Cyclical / Growth Illustrative Levered Returns(4) 11% – 13% Assets(1) $2.3bn Capital(2) $0.9bn Sector Rank(3) #7/15 Strategy Cyclical / Growth Illustrative Levered Returns(4) 9% – 11% Assets $2.1bn Capital(2) $1.3bn Sector Rank(3) #10/44 Strategy Non-Cyclical / Defensive Illustrative Levered Returns(4) 9% – 11% Assets: $128.7bn(1) Market Cap: $14.0bn 14

© Copyright 2020 Annaly Capital Management, Inc. All rights reserved. Strategic Approach Market Trends The Agency portfolio has diversified both assets and hedges over time in order to better support earnings and book value Agency | Business Update ▪ Annaly’s Agency Portfolio is made up of high quality and relatively liquid securities, including specified pools, TBA, ARMs and derivatives ▪ Portfolio benefits from in-house proprietary analytics that identify emerging prepayment trends and aid in accurately estimating cash flows ▪ Diversified portfolio construct enhances total return profile while duration and convexity risks are hedged to protect book value across various interest rate and spread environments ▪ Annaly’s Agency team has access to traditional wholesale repo, proprietary broker-dealer repo, FHLB membership(1) and direct repo ▪ We remain constructive on Agency MBS spreads given our expectation of a rangebound interest rate environment as flight to quality flows associated with global pandemic fears subside ▪ Prepayments have slowed over the near term given slower seasonal factors. The recent decline in interest rates has led to increased concerns about another spike in prepayments, which we deem as temporary ▪ Overnight funding markets are expected to be stable going forward amid the added liquidity from the Federal Reserve, in turn supporting demand for and financing of a variety of assets, including Agency MBS Source: Company filings. Financial data as of December 31, 2019. Note: Portfolio data as of quarter end for each respective period. Detailed endnotes and a glossary of defined terms are included at the end of this presentation. Agency Portfolio Detail Assets Funding(3)Hedges(2) 0% 25% 50% 75% 100% 2017 2018 2019 Pools TBA Specified Pools and TBA Holdings, % 15 0% 25% 50% 75% 100% 2017 2018 2019 Swaps Swaptions Futures Agency Hedging Composition, % 0% 25% 50% 75% 100% 2017 2018 2019 Within 30 30-120 days Over 120 Agency Funding Composition, %

© Copyright 2020 Annaly Capital Management, Inc. All rights reserved. ARM/HECM 1% DUS 2% IO/IIO/CMO/MSR 1% 15yr 2% 20yr 2% 30yr 92% Agency | Portfolio Summary Note: Data as of December 31, 2019. Percentages based on fair market value and may not sum to 100% due to rounding. Detailed endnotes, additional important disclosures and a glossary of defined terms are included at the end of this presentation. ▪ Annaly Agency Portfolio: $120.3 billion in assets at the end of Q4 2019, a moderate decrease from Q3 2019 ▪ The portfolio mix continues to be predominately concentrated in 30-year fixed rate securities ▪ ~81% of the portfolio was positioned in securities with relatively attractive convexity profiles at the end of Q4 2019 – Specified pool collateral performed much better than TBA securities during the quarter, given limited supply of specified pools and the deterioration of the TBA quality ▪ The Agency portfolio incrementally rotated out of higher coupons and into lower coupons over the quarter and reduced ARM exposure to 1% of the overall portfolio Total Dedicated Capital: $10.9 billion(1) Asset Type(1) Pass Through Coupon Type(2) Portfolio Quality(3) 30Yr+: 96% 15 & 20Yr: 4% High Quality Spec 35% Med Quality Spec 34% 40+ WALA 12% Generic 19% 16 3.5% 26% 4.0% 32% >=4.5% 24% <=3% 14% <=3.0% 2% 3.5% 1% >=4.0% 1%
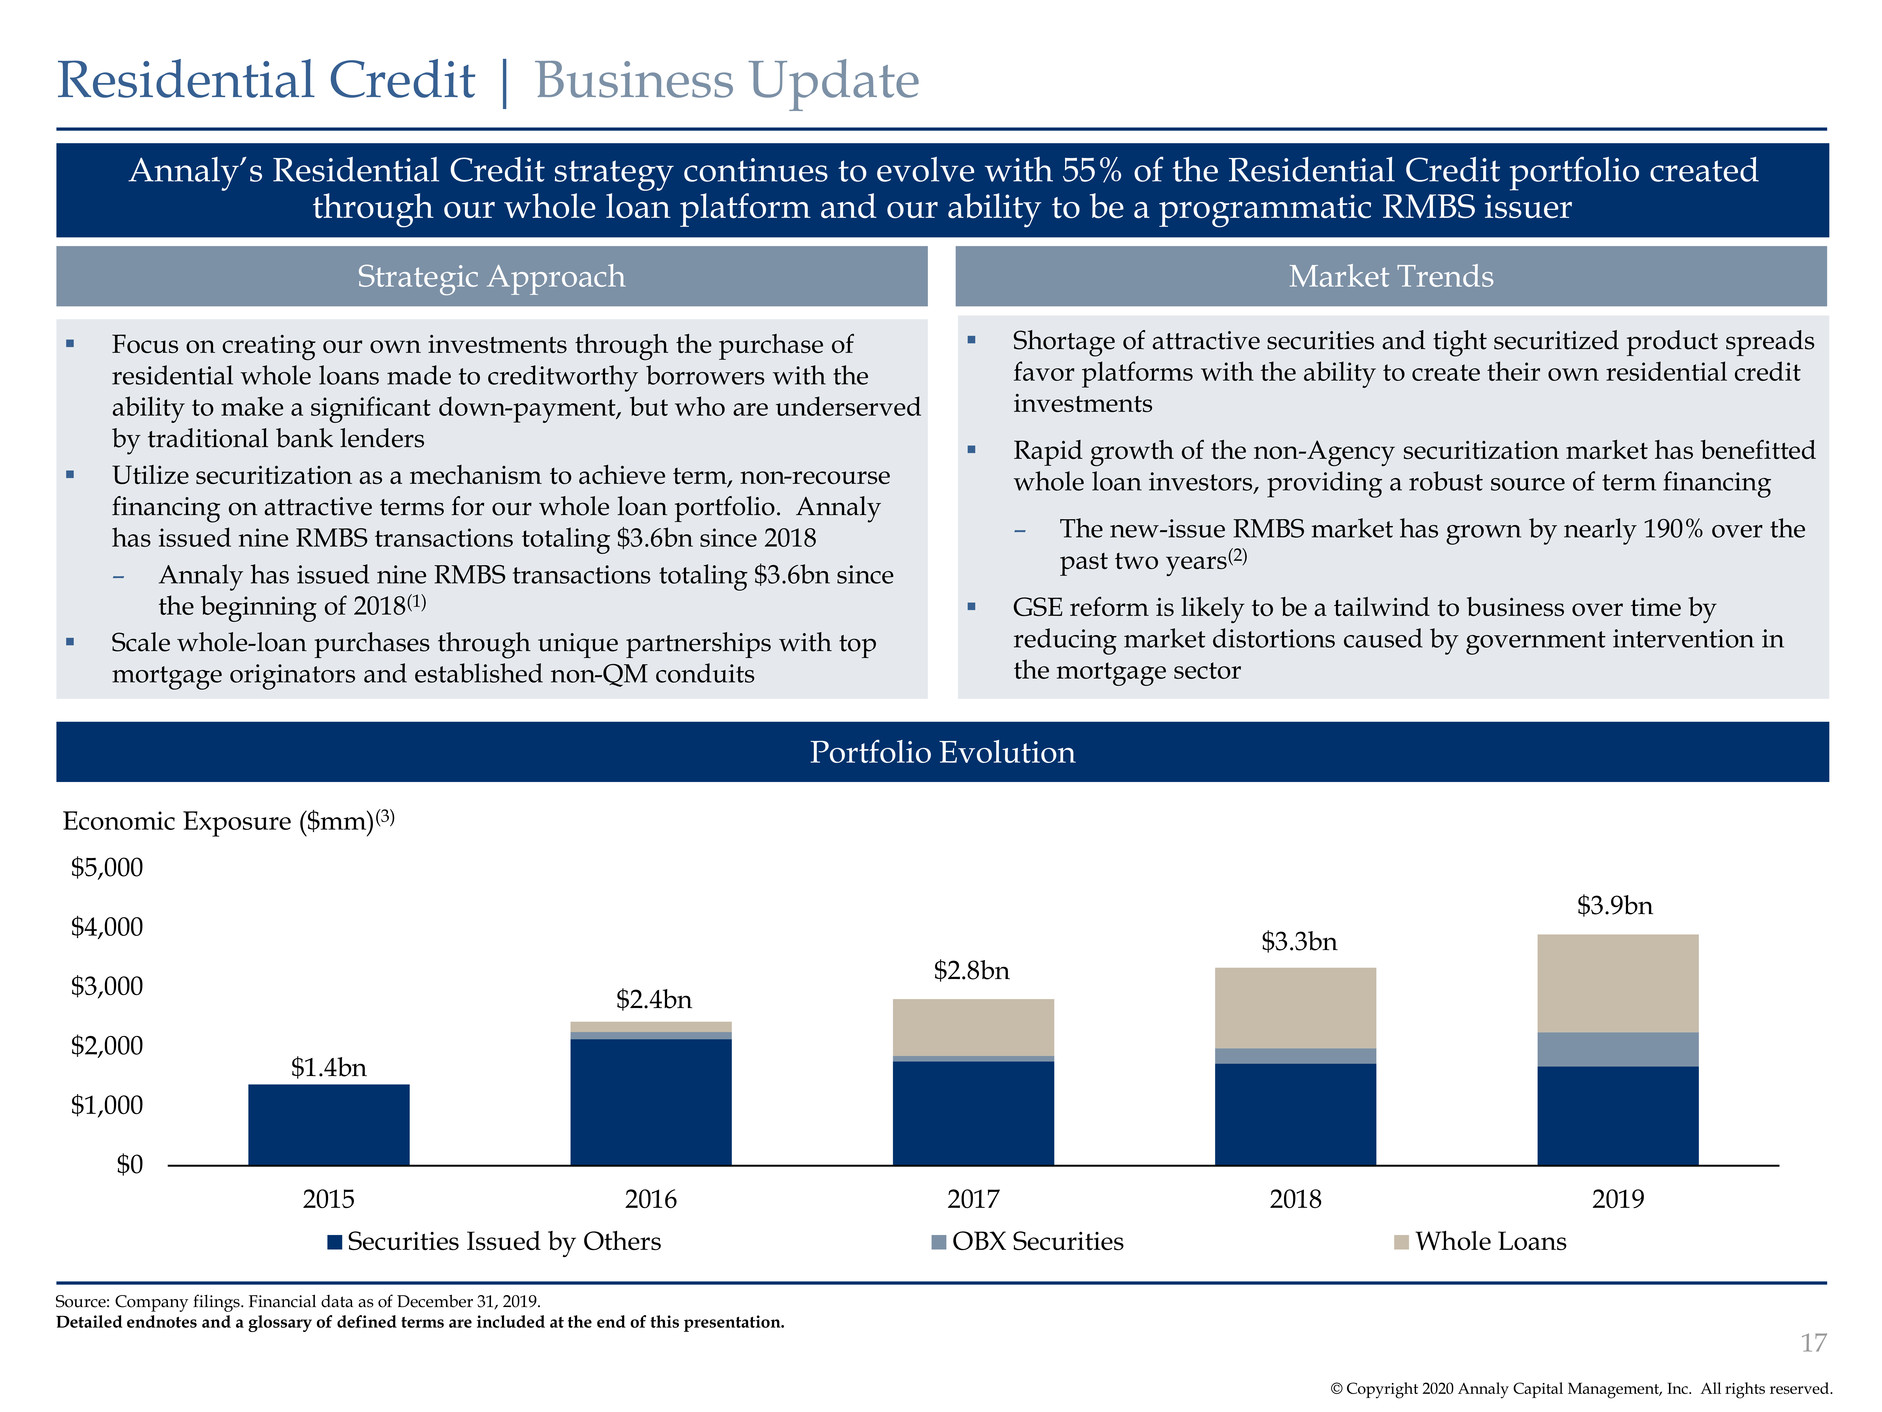
© Copyright 2020 Annaly Capital Management, Inc. All rights reserved. Strategic Approach Annaly’s Residential Credit strategy continues to evolve with 55% of the Residential Credit portfolio created through our whole loan platform and our ability to be a programmatic RMBS issuer Residential Credit | Business Update ▪ Focus on creating our own investments through the purchase of residential whole loans made to creditworthy borrowers with the ability to make a significant down-payment, but who are underserved by traditional bank lenders ▪ Utilize securitization as a mechanism to achieve term, non-recourse financing on attractive terms for our whole loan portfolio. Annaly has issued nine RMBS transactions totaling $3.6bn since 2018 – Annaly has issued nine RMBS transactions totaling $3.6bn since the beginning of 2018(1) ▪ Scale whole-loan purchases through unique partnerships with top mortgage originators and established non-QM conduits Source: Company filings. Financial data as of December 31, 2019. Detailed endnotes and a glossary of defined terms are included at the end of this presentation. Portfolio Evolution Market Trends ▪ Shortage of attractive securities and tight securitized product spreads favor platforms with the ability to create their own residential credit investments ▪ Rapid growth of the non-Agency securitization market has benefitted whole loan investors, providing a robust source of term financing – The new-issue RMBS market has grown by nearly 190% over the past two years(2) ▪ GSE reform is likely to be a tailwind to business over time by reducing market distortions caused by government intervention in the mortgage sector $1.4bn $3.9bn $0 $1,000 $2,000 $3,000 $4,000 $5,000 2015 2016 2017 2018 2019 Economic Exposure ($mm)(3) Securities Issued by Others OBX Securities Whole Loans $2.4bn $2.8bn $3.3bn 17
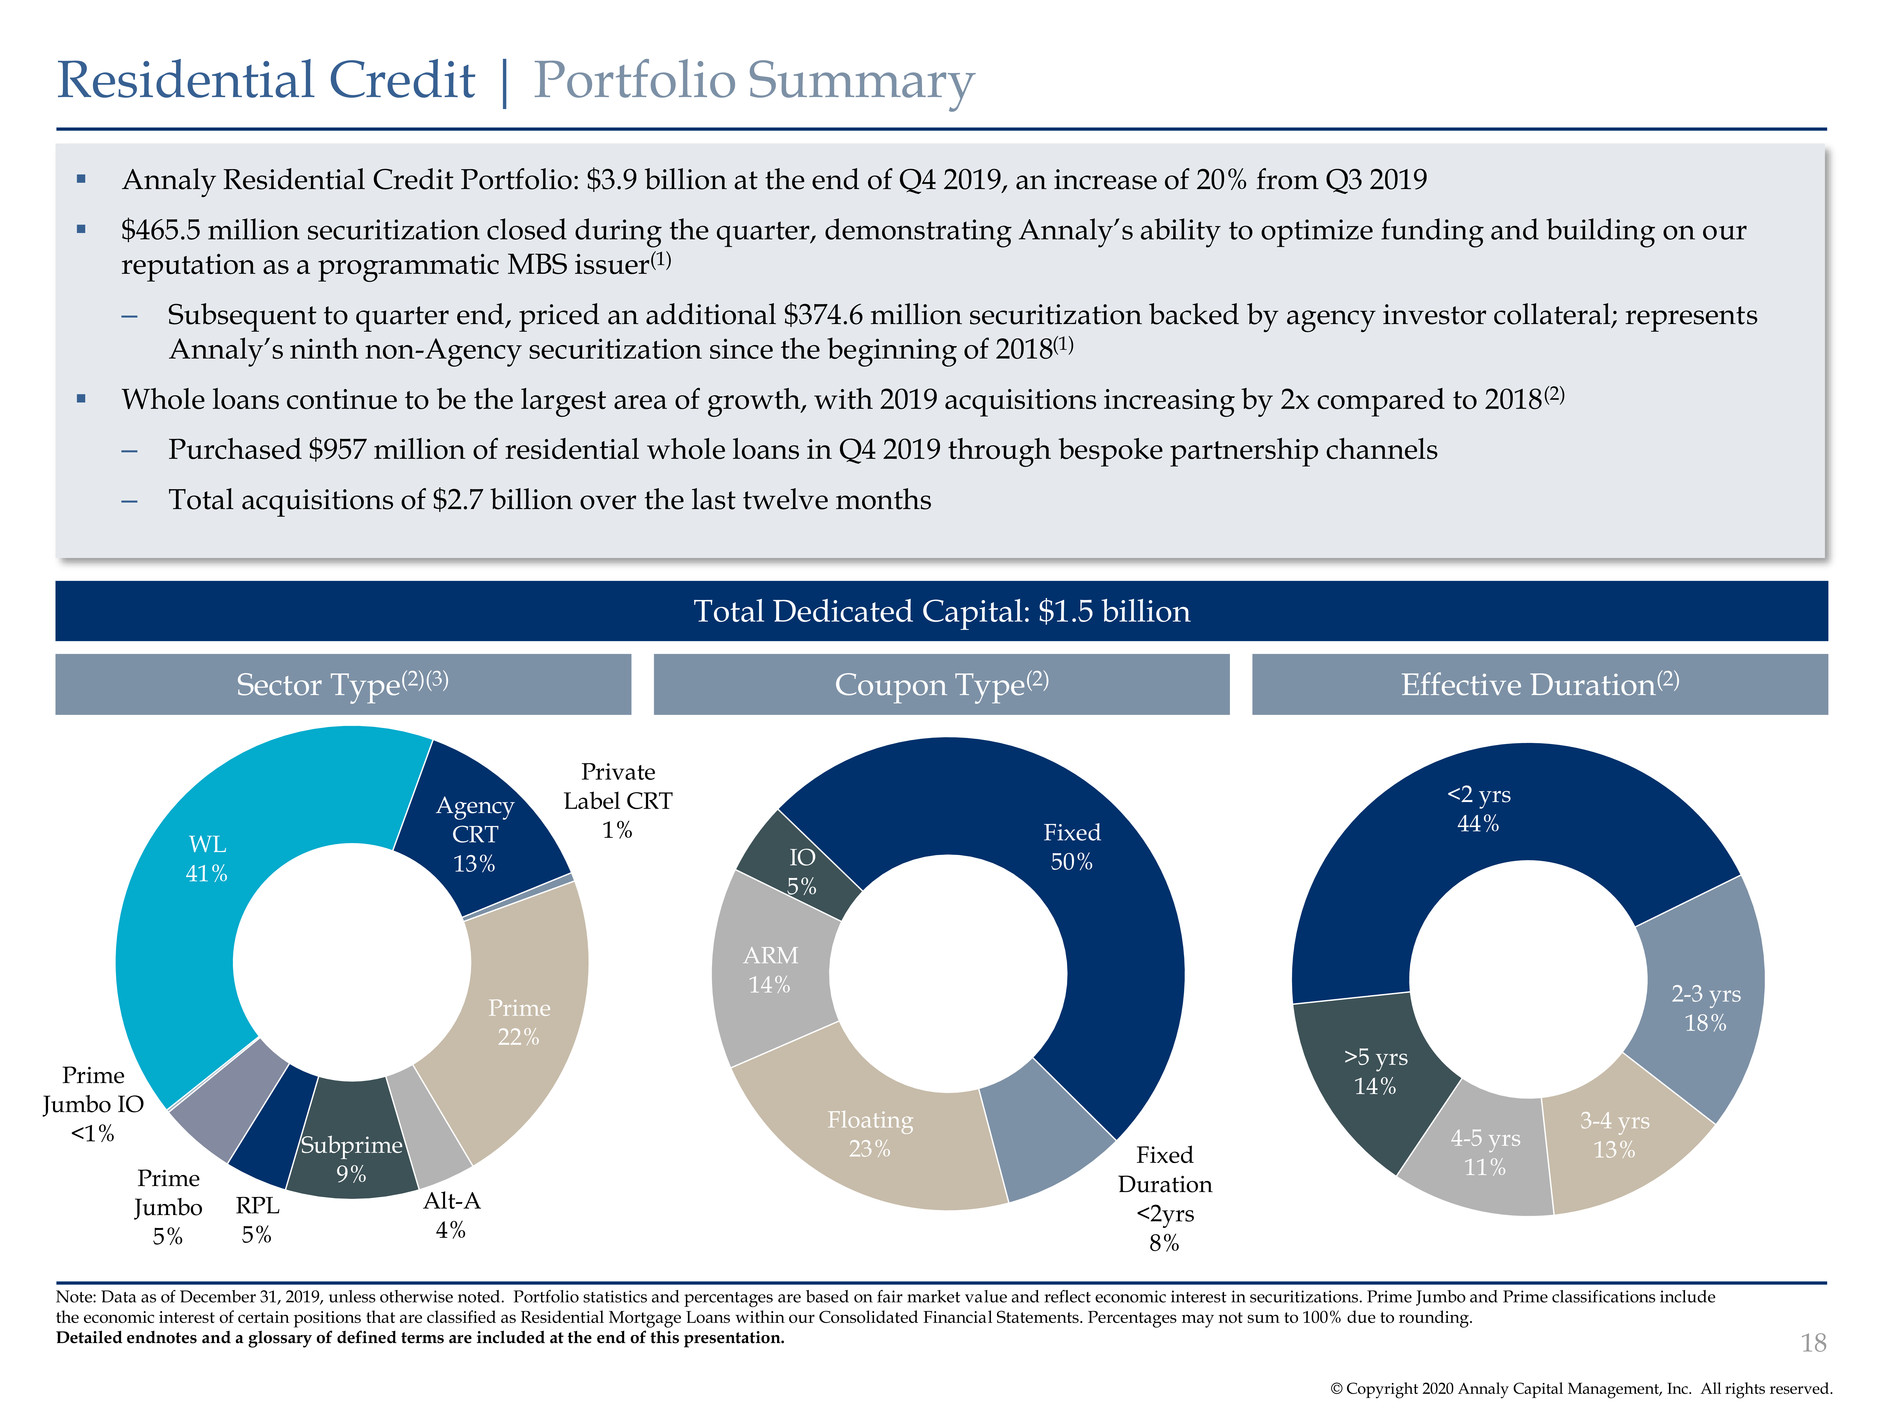
© Copyright 2020 Annaly Capital Management, Inc. All rights reserved. Residential Credit | Portfolio Summary Note: Data as of December 31, 2019, unless otherwise noted. Portfolio statistics and percentages are based on fair market value and reflect economic interest in securitizations. Prime Jumbo and Prime classifications include the economic interest of certain positions that are classified as Residential Mortgage Loans within our Consolidated Financial Statements. Percentages may not sum to 100% due to rounding. Detailed endnotes and a glossary of defined terms are included at the end of this presentation. ▪ Annaly Residential Credit Portfolio: $3.9 billion at the end of Q4 2019, an increase of 20% from Q3 2019 ▪ $465.5 million securitization closed during the quarter, demonstrating Annaly’s ability to optimize funding and building on our reputation as a programmatic MBS issuer(1) – Subsequent to quarter end, priced an additional $374.6 million securitization backed by agency investor collateral; represents Annaly’s ninth non-Agency securitization since the beginning of 2018(1) ▪ Whole loans continue to be the largest area of growth, with 2019 acquisitions increasing by 2x compared to 2018(2) – Purchased $957 million of residential whole loans in Q4 2019 through bespoke partnership channels – Total acquisitions of $2.7 billion over the last twelve months Total Dedicated Capital: $1.5 billion Sector Type(2)(3) Coupon Type(2) Effective Duration(2) Agency CRT 13% Private Label CRT 1% Prime 22% Alt-A 4% Subprime 9% RPL 5% Prime Jumbo 5% Prime Jumbo IO <1% WL 41% Fixed 50% Fixed Duration <2yrs 8% Floating 23% ARM 14% IO 5% <2 yrs 44% 2-3 yrs 18% 3-4 yrs 13% 4-5 yrs 11% >5 yrs 14% 18
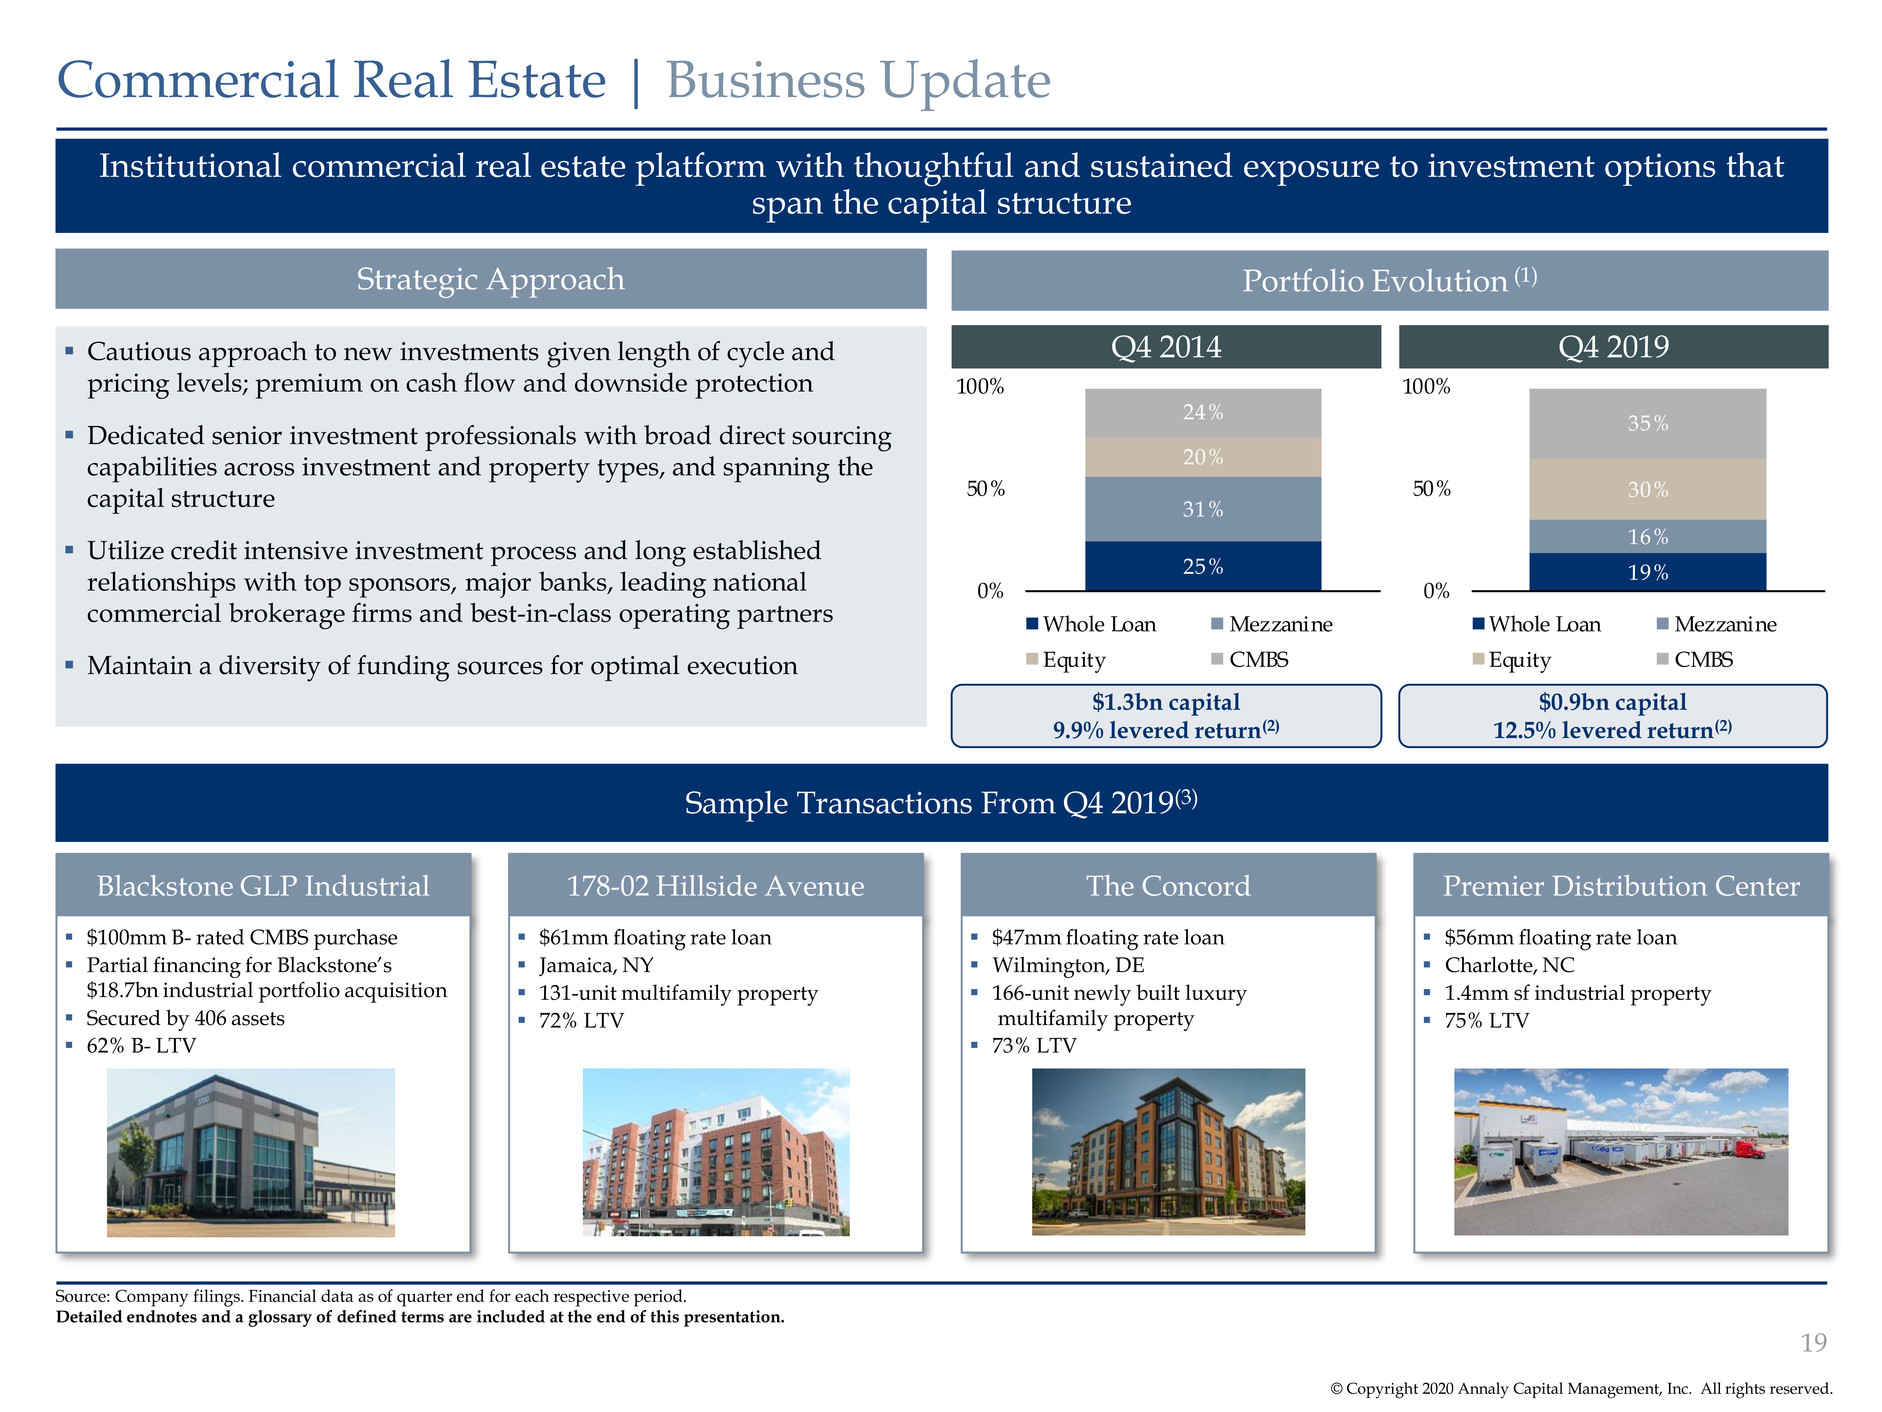
© Copyright 2020 Annaly Capital Management, Inc. All rights reserved. Commercial Real Estate | Business Update Source: Company filings. Financial data as of quarter end for each respective period. Detailed endnotes and a glossary of defined terms are included at the end of this presentation. Sample Transactions From Q4 2019(3) Blackstone GLP Industrial ▪ $100mm B- rated CMBS purchase ▪ Partial financing for Blackstone’s $18.7bn industrial portfolio acquisition ▪ Secured by 406 assets ▪ 62% B- LTV 178-02 Hillside Avenue ▪ $61mm floating rate loan ▪ Jamaica, NY ▪ 131-unit multifamily property ▪ 72% LTV The Concord ▪ $47mm floating rate loan ▪ Wilmington, DE ▪ 166-unit newly built luxury multifamily property ▪ 73% LTV Premier Distribution Center ▪ $56mm floating rate loan ▪ Charlotte, NC ▪ 1.4mm sf industrial property ▪ 75% LTV Strategic Approach Portfolio Evolution (1) ▪ Cautious approach to new investments given length of cycle and pricing levels; premium on cash flow and downside protection ▪ Dedicated senior investment professionals with broad direct sourcing capabilities across investment and property types, and spanning the capital structure ▪ Utilize credit intensive investment process and long established relationships with top sponsors, major banks, leading national commercial brokerage firms and best-in-class operating partners ▪ Maintain a diversity of funding sources for optimal execution Institutional commercial real estate platform with thoughtful and sustained exposure to investment options that span the capital structure Q4 2014 $1.3bn capital 9.9% levered return(2) $0.9bn capital 12.5% levered return(2) Q4 2019 25% 31% 20% 24% 0% 50% 100% Whole Loan Mezzanine Equity CMBS 19% 16% 30% 35% 0% 50% 100% Whole Loan Mezzanine Equity CMBS 19

© Copyright 2020 Annaly Capital Management, Inc. All rights reserved. Commercial Real Estate | Portfolio Summary ▪ Annaly Commercial Real Estate Portfolio: $2.3 billion in assets at the end of Q4 2019, reflecting an increase of 31% from Q3 2019 and a slight decrease of 5%(1) from Q4 2018 ▪ New investment activity outpaced paydowns during 2019 ▪ $1.2 billion of new investment activity ▪ $431 million of payoffs/sales(2) ▪ Selectively adding to commercial real estate portfolio despite sustained competition in the credit markets Total Dedicated Capital: $0.9 billion Asset Type Sector Type Geographic Concentration(6) Note: Data as of December 31, 2019. Portfolio statistics and percentages are based on fair market value and reflect economic interest in securitizations. Percentages may not sum to 100% due to rounding. Detailed endnotes and a glossary of defined terms are included at the end of this presentation. NY 15% TX 14% CA 13% VA 11% Other 47% Hotel 6% Healthcare 9% Industrial 4% Multifamily 16% Other 12% Office 22% Retail 31% AAA CMBS 1% Credit CMBS 35% Mezzanine 10% Whole Loan(5) 19% Equity 27% ESG(4) 3% Other(3) 5% 20
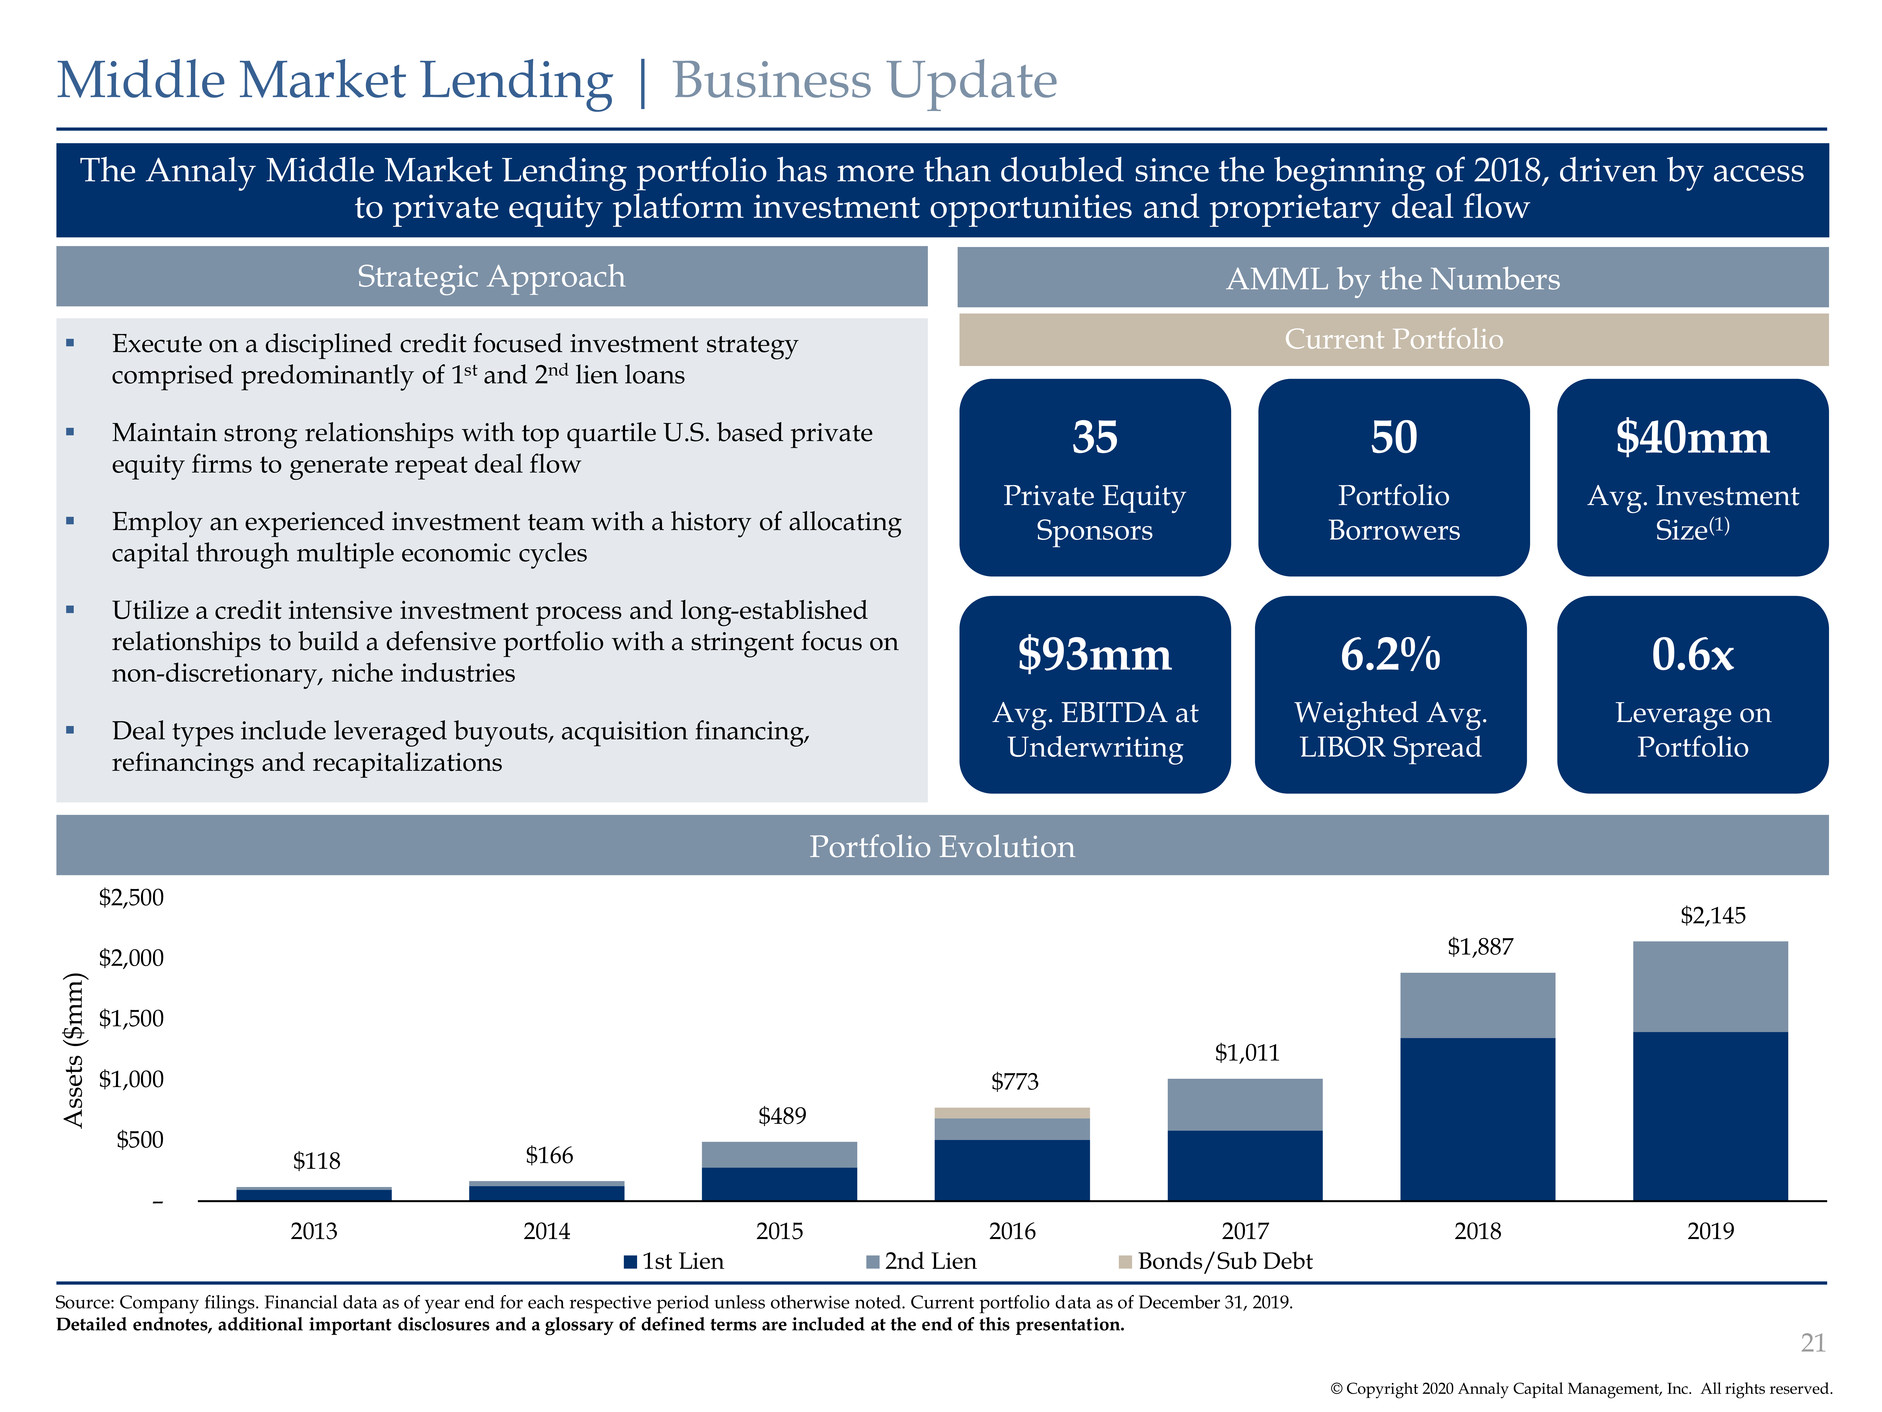
© Copyright 2020 Annaly Capital Management, Inc. All rights reserved. Strategic Approach The Annaly Middle Market Lending portfolio has more than doubled since the beginning of 2018, driven by access to private equity platform investment opportunities and proprietary deal flow Middle Market Lending | Business Update ▪ Execute on a disciplined credit focused investment strategy comprised predominantly of 1st and 2nd lien loans ▪ Maintain strong relationships with top quartile U.S. based private equity firms to generate repeat deal flow ▪ Employ an experienced investment team with a history of allocating capital through multiple economic cycles ▪ Utilize a credit intensive investment process and long-established relationships to build a defensive portfolio with a stringent focus on non-discretionary, niche industries ▪ Deal types include leveraged buyouts, acquisition financing, refinancings and recapitalizations Source: Company filings. Financial data as of year end for each respective period unless otherwise noted. Current portfolio data as of December 31, 2019. Detailed endnotes, additional important disclosures and a glossary of defined terms are included at the end of this presentation. Portfolio Evolution $118 $166 $489 $773 $1,011 $1,887 $2,145 – $500 $1,000 $1,500 $2,000 $2,500 2013 2014 2015 2016 2017 2018 2019 A ss ets ( $ m m ) 1st Lien 2nd Lien Bonds/Sub Debt AMML by the Numbers Current Portfolio 35 Private Equity Sponsors $40mm Avg. Investment Size(1) 50 Portfolio Borrowers $93mm Avg. EBITDA at Underwriting 0.6x Leverage on Portfolio 6.2% Weighted Avg. LIBOR Spread 21
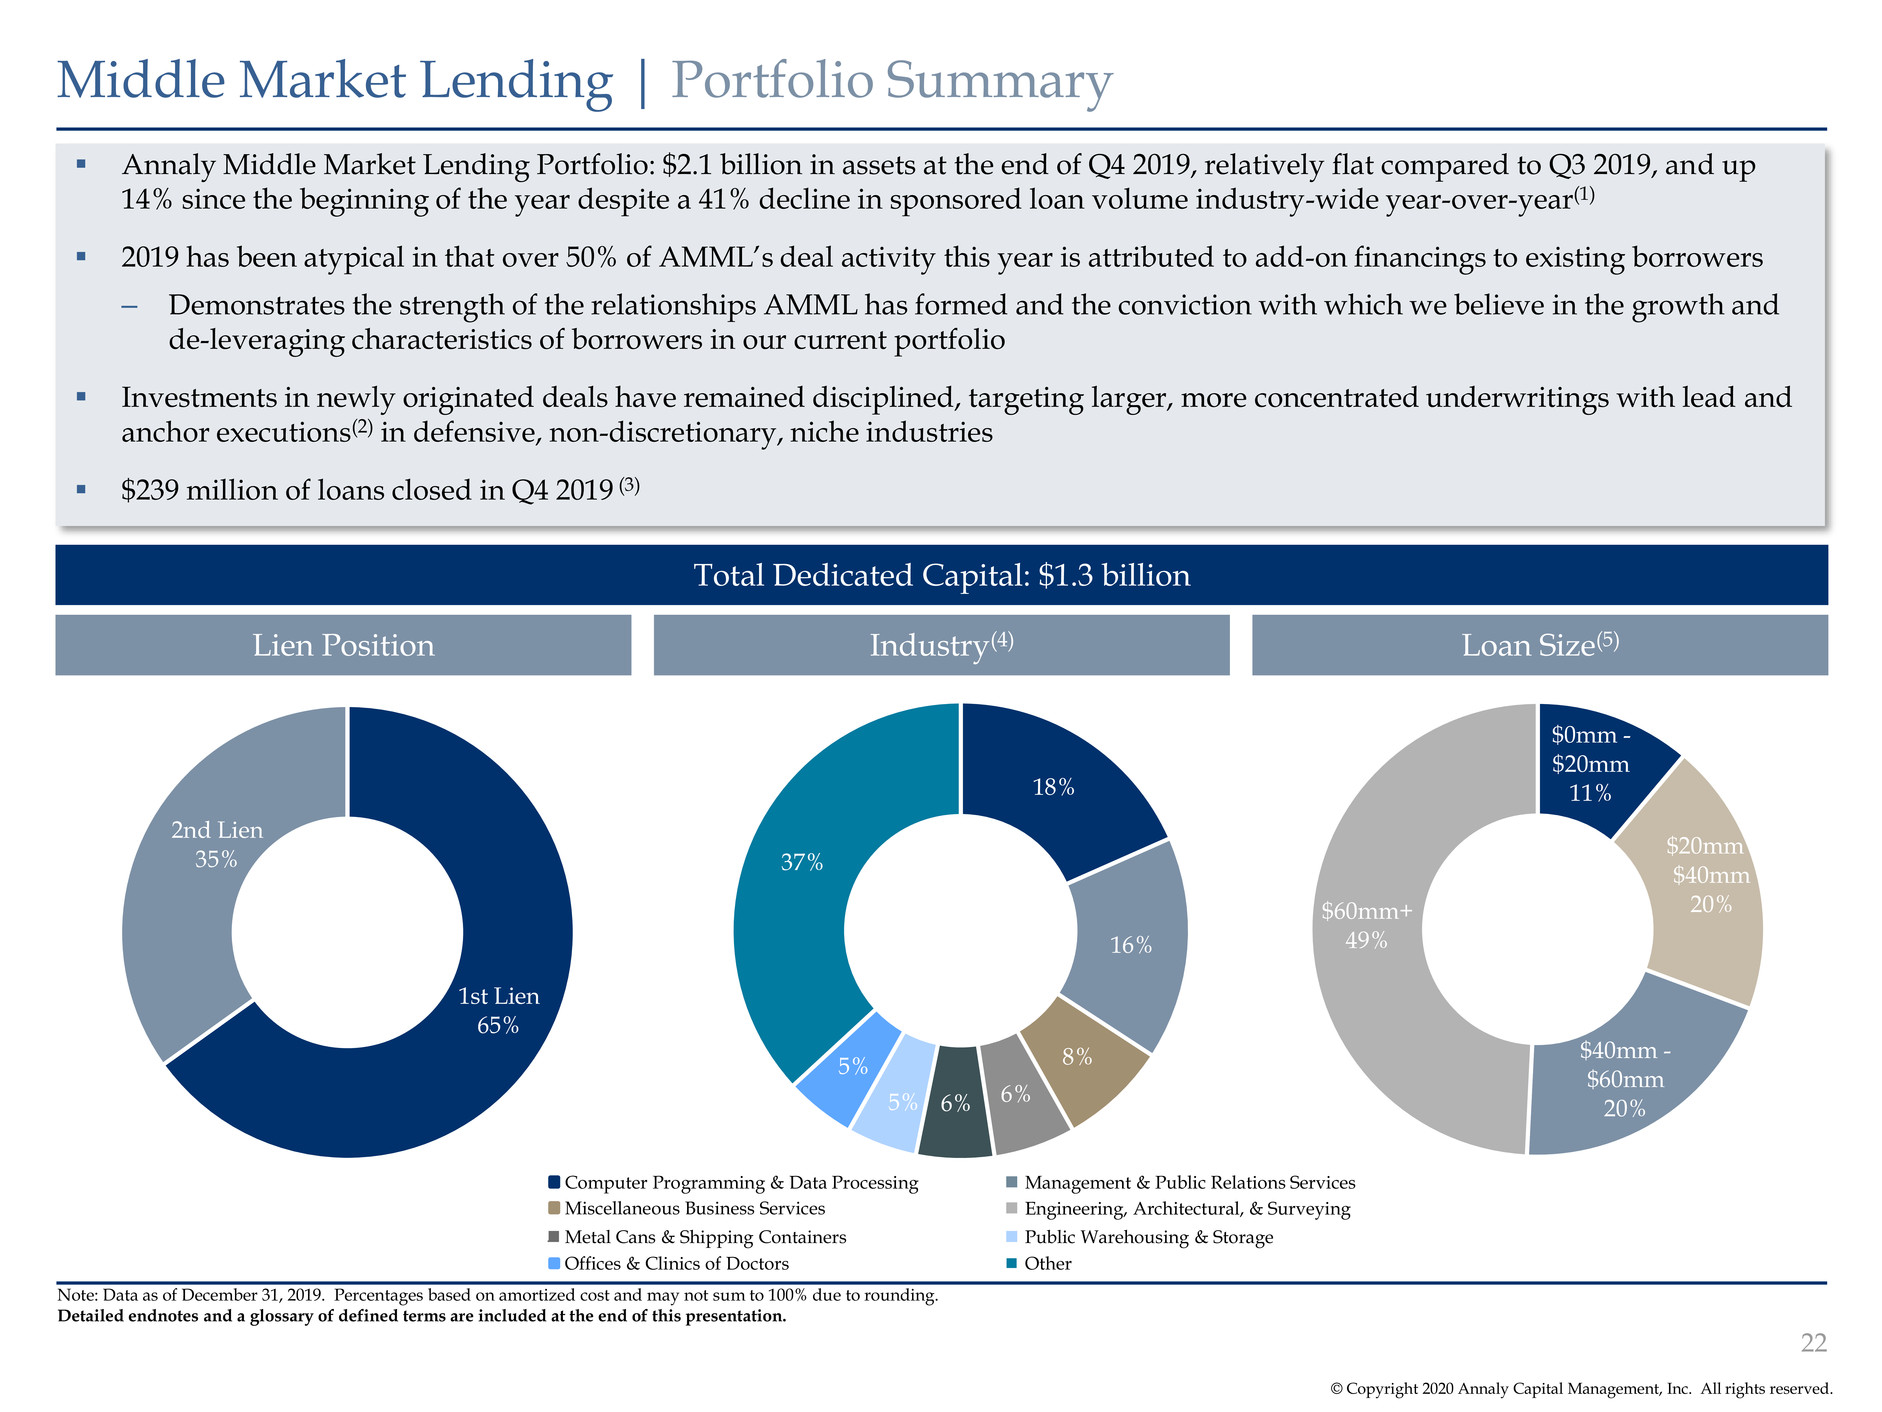
© Copyright 2020 Annaly Capital Management, Inc. All rights reserved. 18% 16% 8% 6%6%5% 5% 37% Middle Market Lending | Portfolio Summary Note: Data as of December 31, 2019. Percentages based on amortized cost and may not sum to 100% due to rounding. Detailed endnotes and a glossary of defined terms are included at the end of this presentation. ▪ Annaly Middle Market Lending Portfolio: $2.1 billion in assets at the end of Q4 2019, relatively flat compared to Q3 2019, and up 14% since the beginning of the year despite a 41% decline in sponsored loan volume industry-wide year-over-year(1) ▪ 2019 has been atypical in that over 50% of AMML’s deal activity this year is attributed to add-on financings to existing borrowers – Demonstrates the strength of the relationships AMML has formed and the conviction with which we believe in the growth and de-leveraging characteristics of borrowers in our current portfolio ▪ Investments in newly originated deals have remained disciplined, targeting larger, more concentrated underwritings with lead and anchor executions(2) in defensive, non-discretionary, niche industries ▪ $239 million of loans closed in Q4 2019 (3) Total Dedicated Capital: $1.3 billion Lien Position Industry(4) Loan Size(5) Computer Programming & Data Processing Management & Public Relations Services Miscellaneous Business Services Public Warehousing & Storage Offices & Clinics of Doctors Other 1st Lien 65% 2nd Lien 35% Metal Cans & Shipping Containers Engineering, Architectural, & Surveying $0mm - $20mm 11% $20mm - $40mm 20% $40mm - $60mm 20% $60mm+ 49% 22

Performance Highlights and Trends
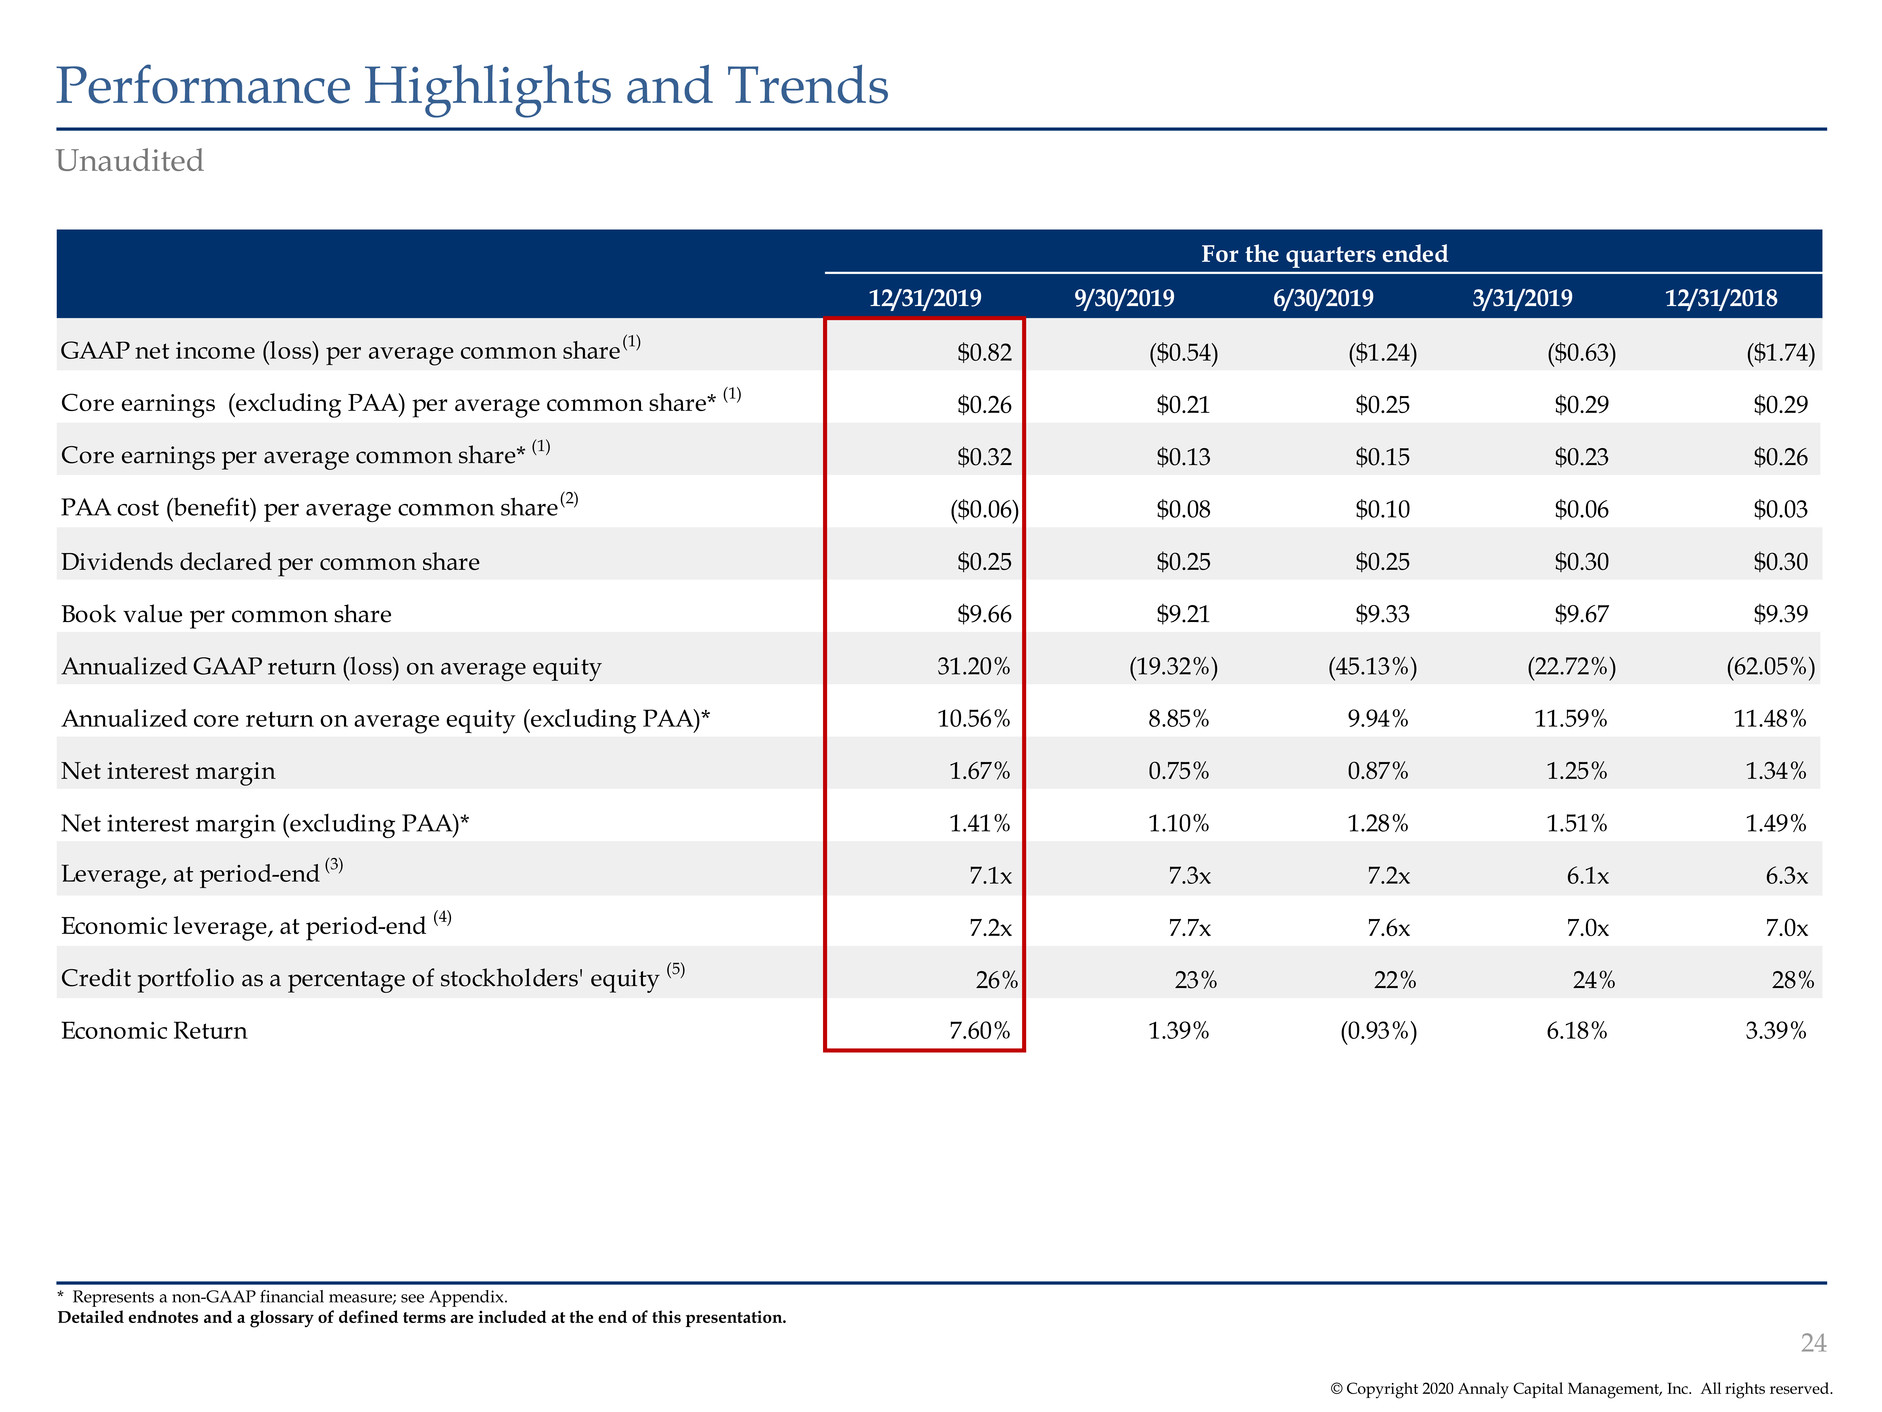
© Copyright 2020 Annaly Capital Management, Inc. All rights reserved. Performance Highlights and Trends Unaudited * Represents a non-GAAP financial measure; see Appendix. Detailed endnotes and a glossary of defined terms are included at the end of this presentation. 24 For the quarters ended 12/31/2019 9/30/2019 6/30/2019 3/31/2019 12/31/2018 GAAP net income (loss) per average common share (1) $0.82 ($0.54) ($1.24) ($0.63) ($1.74) Core earnings (excluding PAA) per average common share* (1) $0.26 $0.21 $0.25 $0.29 $0.29 Core earnings per average common share* (1) $0.32 $0.13 $0.15 $0.23 $0.26 PAA cost (benefit) per average common share (2) ($0.06) $0.08 $0.10 $0.06 $0.03 Dividends declared per common share $0.25 $0.25 $0.25 $0.30 $0.30 Book value per common share $9.66 $9.21 $9.33 $9.67 $9.39 Annualized GAAP return (loss) on average equity 31.20% (19.32%) (45.13%) (22.72%) (62.05%) Annualized core return on average equity (excluding PAA)* 10.56% 8.85% 9.94% 11.59% 11.48% Net interest margin 1.67% 0.75% 0.87% 1.25% 1.34% Net interest margin (excluding PAA)* 1.41% 1.10% 1.28% 1.51% 1.49% Leverage, at period-end (3) 7.1x 7.3x 7.2x 6.1x 6.3x Economic leverage, at period-end (4) 7.2x 7.7x 7.6x 7.0x 7.0x Credit portfolio as a percentage of stockholders' equity (5) 26% 23% 22% 24% 28% Economic Return 7.60% 1.39% (0.93%) 6.18% 3.39%

© Copyright 2020 Annaly Capital Management, Inc. All rights reserved. Performance Highlights and Trends (cont’d) Unaudited, dollars in thousands For the quarters ended 12/31/2019 9/30/2019 6/30/2019 3/31/2019 12/31/2018 Agency mortgage-backed securities $112,893,367 $114,462,524 $118,202,040 $103,093,526 $90,752,995 Credit risk transfer securities 531,322 474,765 491,969 607,945 552,097 Non-Agency mortgage-backed securities 1,135,868 1,015,921 1,097,752 1,116,569 1,161,938 Commercial mortgage-backed securities 273,023 140,851 135,108 175,231 156,758 Total securities $114,833,580 $116,094,061 $119,926,869 $104,993,271 $92,623,788 Residential mortgage loans $1,647,787 $1,219,402 $1,061,124 $1,311,720 $1,359,806 Commercial real estate debt and preferred equity 669,713 611,429 623,705 722,962 1,296,803 Corporate debt 2,144,850 2,115,783 1,792,837 1,758,082 1,887,182 Loans held for sale - - 68,802 86,560 42,184 Total loans, net $4,462,350 $3,946,614 $3,546,468 $3,879,324 $4,585,975 Mortgage servicing rights $378,078 $386,051 $425,328 $500,745 $557,813 Agency mortgage-backed securities transferred or pledged to securitization vehicles $1,122,588 - - - - Residential mortgage loans transferred or pledged to securitization vehicles 2,598,374 2,376,731 2,106,981 1,425,668 1,094,831 Commercial real estate debt investments transferred or pledged to securitization vehicles 2,345,120 2,311,413 2,104,601 2,939,632 2,738,369 C mmercial real estate debt and preferred equity transferred or pledged to securitization vehicles 936,378 - - - - Assets transferred or pledged to securitization vehicles $7,002,460 $4,688,144 $4,211,582 $4,365,300 $3,833,200 Real estate, net $725,638 $725,508 $733,196 $734,239 $739,473 Total residential and commercial investments $127,402,106 $125,840,378 $128,843,443 $114,472,879 $102,340,249 25
Appendix: Non-GAAP Reconciliations
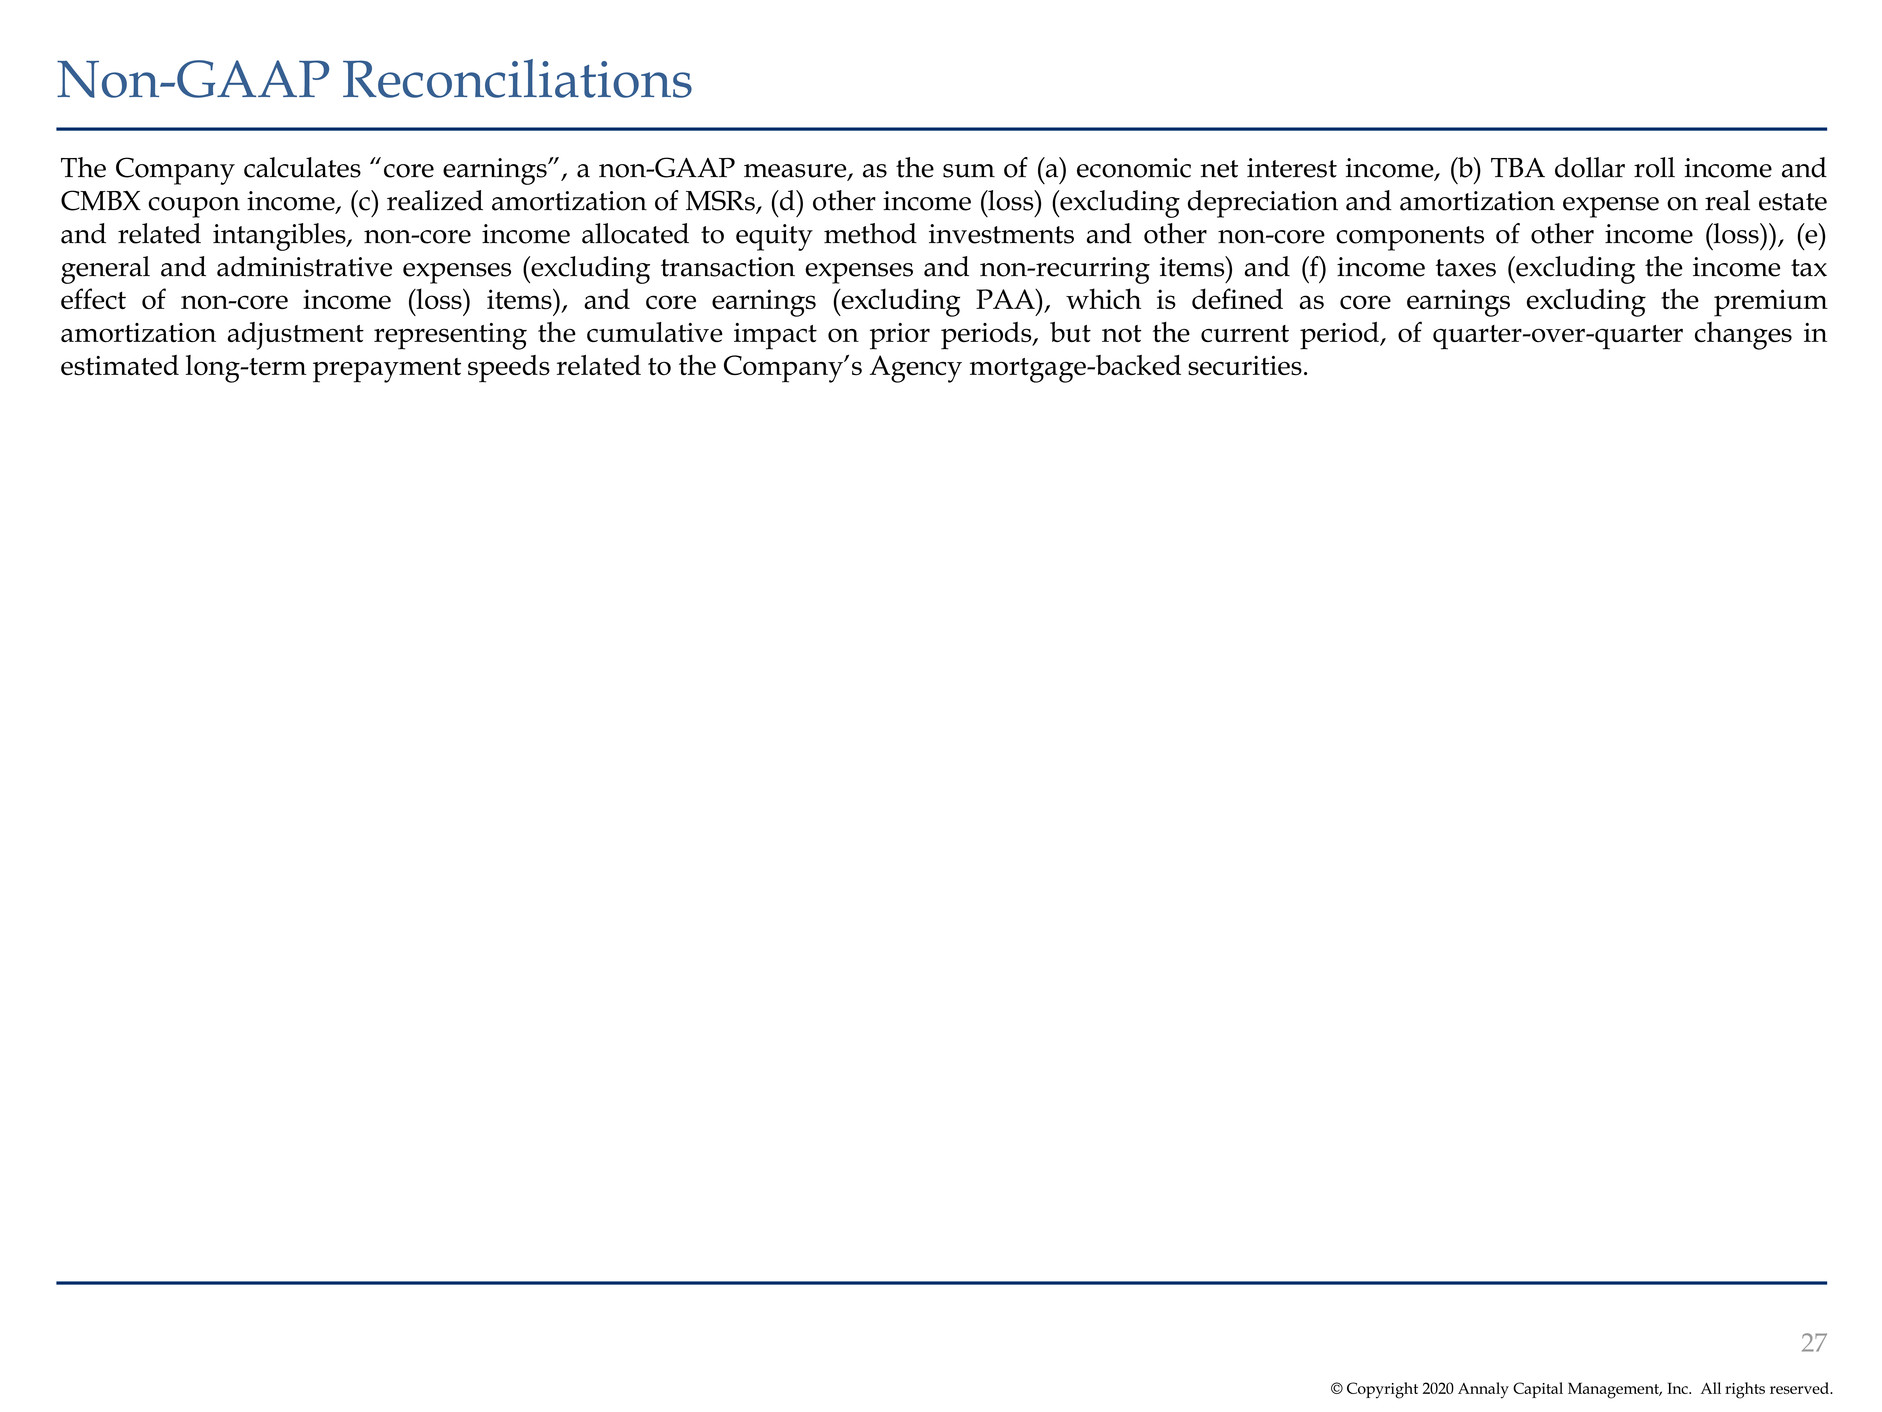
© Copyright 2020 Annaly Capital Management, Inc. All rights reserved. Non-GAAP Reconciliations The Company calculates “core earnings”, a non-GAAP measure, as the sum of (a) economic net interest income, (b) TBA dollar roll income and CMBX coupon income, (c) realized amortization of MSRs, (d) other income (loss) (excluding depreciation and amortization expense on real estate and related intangibles, non-core income allocated to equity method investments and other non-core components of other income (loss)), (e) general and administrative expenses (excluding transaction expenses and non-recurring items) and (f) income taxes (excluding the income tax effect of non-core income (loss) items), and core earnings (excluding PAA), which is defined as core earnings excluding the premium amortization adjustment representing the cumulative impact on prior periods, but not the current period, of quarter-over-quarter changes in estimated long-term prepayment speeds related to the Company’s Agency mortgage-backed securities. 27
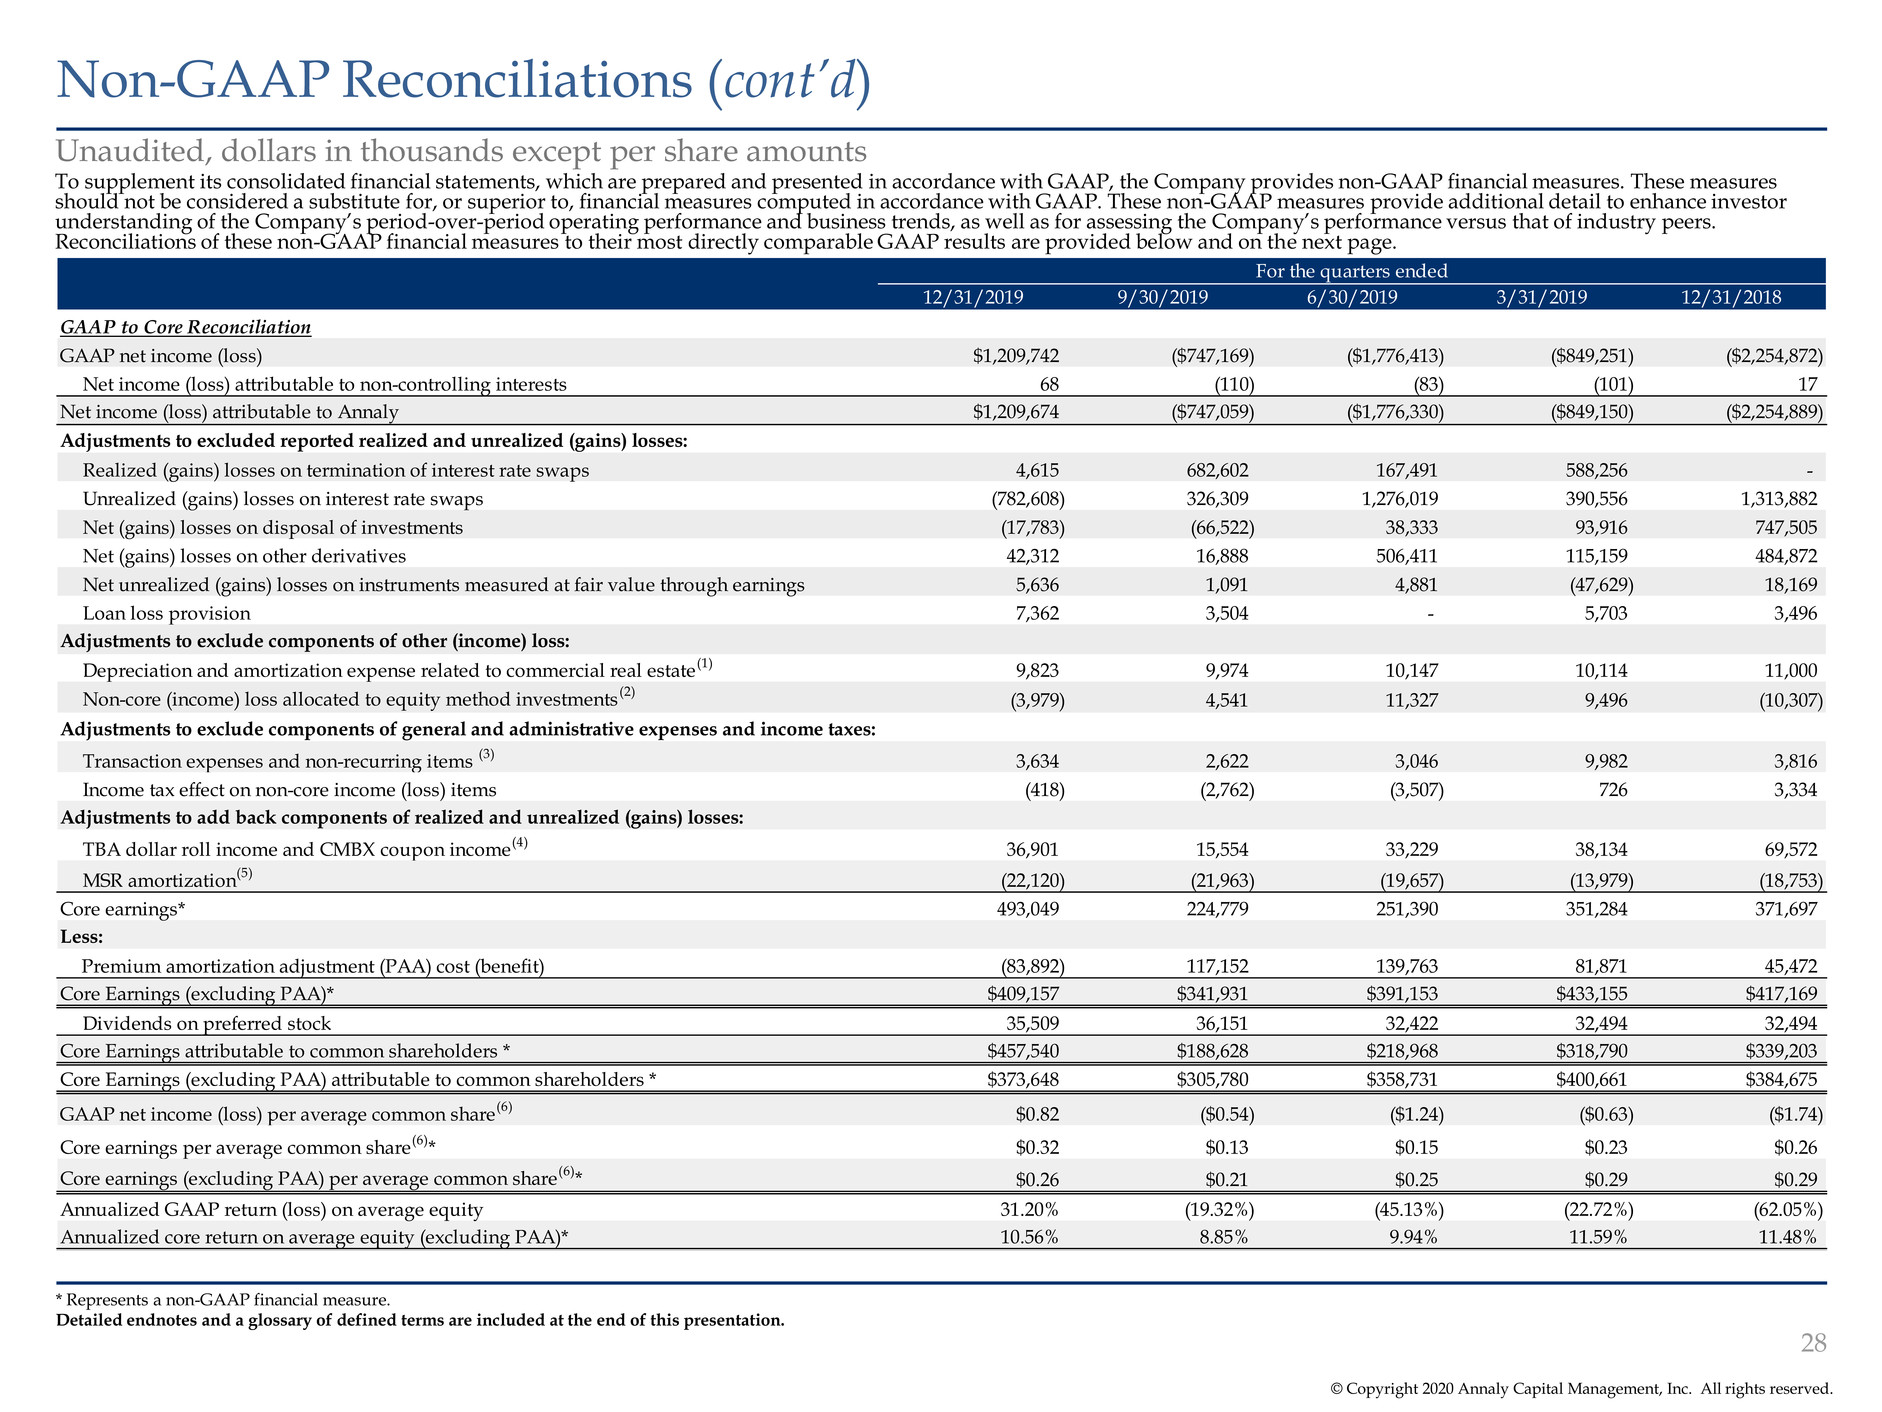
© Copyright 2020 Annaly Capital Management, Inc. All rights reserved. Non-GAAP Reconciliations (cont’d) * Represents a non-GAAP financial measure. Detailed endnotes and a glossary of defined terms are included at the end of this presentation. Unaudited, dollars in thousands except per share amounts To supplement its consolidated financial statements, which are prepared and presented in accordance with GAAP, the Company provides non-GAAP financial measures. These measures should not be considered a substitute for, or superior to, financial measures computed in accordance with GAAP. These non-GAAP measures provide additional detail to enhance investor understanding of the Company’s period-over-period operating performance and business trends, as well as for assessing the Company’s performance versus that of industry peers. Reconciliations of these non-GAAP financial measures to their most directly comparable GAAP results are provided below and on the next page. For the quarters ended 12/31/2019 9/30/2019 6/30/2019 3/31/2019 12/31/2018 GAAP to Core Reconciliation GAAP net income (loss) $1,209,742 ($747,169) ($1,776,413) ($849,251) ($2,254,872) Net income (loss) attributable to non-controlling interests 68 (110) (83) (101) 17 Net income (loss) attributable to Annaly $1,209,674 ($747,059) ($1,776,330) ($849,150) ($2,254,889) Adjustments to excluded reported realized and unrealized (gains) losses: Realized (gains) losses on termination of interest rate swaps 4,615 682,602 167,491 588,256 - Unrealized (gains) losses on interest rate swaps (782,608) 326,309 1,276,019 390,556 1,313,882 Net (gains) losses on disposal of investments (17,783) (66,522) 38,333 93,916 747,505 Net (gains) losses on other derivatives 42,312 16,888 506,411 115,159 484,872 Net unrealized (gains) losses on instruments measured at fair value through earnings 5,636 1,091 4,881 (47,629) 18,169 Loan loss provision 7,362 3,504 - 5,703 3,496 Adjustments to exclude components of other (income) loss: Depreciation and amortization expense related to commercial real estate (1) 9,823 9,974 10,147 10,114 11,000 Non-core (income) loss allocated to equity method investments (2) (3,979) 4,541 11,327 9,496 (10,307) Adjustments to exclude components of general and administrative expenses and income taxes: Transaction expenses and non-recurring items (3) 3,634 2,622 3,046 9,982 3,816 Income tax effect on non-core income (loss) items (418) (2,762) (3,507) 726 3,334 Adjustments to add back components of realized and unrealized (gains) losses: TBA dollar roll income and CMBX coupon income (4) 36,901 15,554 33,229 38,134 69,572 MSR amortization (5) (22,120) (21,963) (19,657) (13,979) (18,753) Core earnings* 493,049 224,779 251,390 351,284 371,697 Less: Premium amortization adjustment (PAA) cost (benefit) (83,892) 117,152 139,763 81,871 45,472 Core Earnings (excluding PAA)* $409,157 $341,931 $391,153 $433,155 $417,169 Dividends on preferred stock 35,509 36,151 32,422 32,494 32,494 Core Earnings attributable to common shareholders * $457,540 $188,628 $218,968 $318,790 $339,203 Core Earnings (excluding PAA) attributable to common shareholders * $373,648 $305,780 $358,731 $400,661 $384,675 AAP net income (loss) per average common share (6) $0.82 ($0.54) ($1.24) ($0.63) ($1.74) Core earnings per average common share (6) * $0.32 $0.13 $0.15 $0.23 $0.26 Core earnings (excluding PAA) per average common share (6) * $0.26 $0.21 $0.25 $0.29 $0.29 Annualized GAAP return (loss) on average equity 31.20% (19.32%) (45.13%) (22.72%) (62.05%) Annualized core return on average equity (excluding PAA)* 10.56% 8.85% 9.94% 11.59% 11.48% 28

© Copyright 2020 Annaly Capital Management, Inc. All rights reserved. Non-GAAP Reconciliations (cont’d) * Represents a non-GAAP financial measure. Detailed endnotes and a glossary of defined terms are included at the end of this presentation. Unaudited, dollars in thousands For the quarters ended 12/31/2019 9/30/2019 6/30/2019 3/31/2019 12/31/2018 Premium Amortization Reconciliation Premium amortization expense $171,447 $376,306 $318,587 $247,446 $220,131 Less: PAA cost (benefit) (83,892) 117,152 139,763 81,871 45,472 Premium amortization expense (excluding PAA) $255,339 $259,154 $178,824 $165,575 $174,659 Interest Income (excluding PAA) Reconciliation GAAP interest income $1,074,214 $919,299 $927,598 $866,186 $859,674 PAA cost (benefit) (83,892) 117,152 139,763 81,871 45,472 Interest income (excluding PAA)* $990,322 $1,036,451 $1,067,361 $948,057 $905,146 Economic Interest Expense Reconciliation GAAP interest expense $620,058 $766,905 $750,217 $647,695 $586,774 Add: Net interest component of interest rate swaps (1) (45,221) (88,466) (83,653) (134,035) (65,889) Economic interest expense* (1) $574,837 $678,439 $666,564 $513,660 $520,885 Economic Net Interest Income (excluding PAA) Reconciliation Interest income (excluding PAA) $990,322 $1,036,451 $1,067,361 $948,057 $905,146 Less: Economic interest expense* (1) 574,837 678,439 666,564 513,660 520,885 Economic net interest income (excluding PAA)* (1) $415,485 $358,012 $400,797 $434,397 $384,261 Economic Metrics (excluding PAA) Average interest earning assets $121,801,951 $127,207,668 $122,601,881 $109,946,527 $107,232,861 Interest income (excluding PAA)* $990,322 $1,036,451 $1,067,361 $948,057 $905,146 Average yield on interest earning assets (excluding PAA)* 3.25% 3.26% 3.48% 3.45% 3.38% Average interest bearing liabilities $111,873,379 $116,391,094 $109,628,007 $95,529,819 $91,746,160 Economic interest expense* (1) 574,837 678,439 666,564 513,660 520,885 Average cost of interest bearing liabilities (1) 2.01% 2.28% 2.41% 2.15% 2.22% Economic net interest income (excluding PAA)* (1) $415,485 $358,012 $400,797 $434,397 $384,261 Net interest spread (excluding PAA)* 1.24% 0.98% 1.07% 1.30% 1.16% Interest income (excluding PAA)* $990,322 $1,036,451 $1,067,361 $948,057 $905,146 TBA dollar roll income and CMBX coupon income 36,901 15,554 33,229 38,134 69,572 Interest expense (620,058) (766,905) (750,217) (647,695) (586,774) Net interest component of interest rate swaps 45,221 88,466 83,653 134,035 65,889 Subtotal $452,386 $373,566 $434,026 $472,531 $453,833 Average interest earning assets $121,801,951 $127,207,668 $122,601,881 $109,946,527 $107,232,861 Average TBA contract and CMBX balances 6,878,502 9,248,502 12,757,975 14,927,490 14,788,453 Subtotal $128,680,453 $136,456,170 $135,359,856 $124,874,017 $122,021,314 Net interest margin (excluding PAA)* 1.41% 1.10% 1.28% 1.51% 1.49% 29

Glossary and Endnotes

© Copyright 2020 Annaly Capital Management, Inc. All rights reserved. Glossary *Represents constituents as of January 31, 2020. 1. Consists of AGNC, ANH, ARR, CMO, EARN and ORC. 2. Consists of ABR, ACRE, ARI, BXMT, GPMT, HCFT, KREF, LADR, LOAN, RC, SACH, STWD, TRTX and XAN. 3. Consists of AJX, CHMI, CIM, DX, IVR, MFA, MITT, NRZ, NYMT, PMT, RWT, TWO and WMC. ACREG: Refers to Annaly Commercial Real Estate Group Agency Peers: Represents companies comprising the Agency sector within the BBREMTG Index*(1) AMML: Refers to Annaly Middle Market Lending Group ARC: Refers to Annaly Residential Credit Group BBREMTG: Represents the Bloomberg Mortgage REIT Index*, including Annaly Commercial Peers: Represents companies comprising the commercial sector within the BBREMTG Index*(2) CRE CLO: Refers to Commercial Real Estate Collateralized Loan Obligation CRT: Refers to Credit Risk Transfer Securities ESG: Refers to Environmental, Social and Governance FHLB: Refers to the Federal Home Loan Bank Ginnie Mae: Refers to the Government National Mortgage Association GSE: Refers to Government Sponsored Enterprise Hybrid Peers: Represents companies comprising the hybrid sector within the BBREMTG Index*(3) IMF: Refers to the International Monetary Fund mREITs or mREIT Peers: Represents constituents of the BBREMTG Index*, excluding Annaly NIM: Refers to Net Interest Margin Non-QM: Refers to a Non-Qualified Mortgage OBX Securities: Refers to Onslow Bay Securities TBA Securities: To-Be-Announced securities Unencumbered Assets: Represents Annaly’s excess liquidity and defined as assets that have not been pledged or securitized (generally including cash and cash equivalents, Agency MBS, CRT, Non-Agency MBS, residential mortgage loans, MSRs, reverse repurchase agreements, CRE debt and preferred equity, corporate debt, other unencumbered financial assets and capital stock) 31

© Copyright 2020 Annaly Capital Management, Inc. All rights reserved. Endnotes Page 3 1. Assets represent Annaly’s portfolio of investments on its balance sheet, including TBA purchase contracts (market value) of $6.9bn, mortgage servicing rights (“MSRs”) of $378.1mm, and excluding securitized debt of consolidated variable interest entities (“VIEs”) of $5.6bn. 2. Permanent capital represents Annaly’s total stockholders’ equity as of December 31, 2019. 3. Total shareholder return shown since December 31, 2013, which marks the beginning of Annaly’s diversification efforts, through January 31, 2020. Since its IPO in 1997, Annaly’s total shareholder return is 912%. 4. Acquisitions include Annaly’s $876mm acquisition of CreXus Investment Corp. (closed May 2013), $1,519mm acquisition of Hatteras Financial Corp. (closed July 2016) and $906mm acquisition of MTGE Investment Corp. (closed September 2018). Page 4 1. Dividend yield is based on annualized Q4 2019 dividend of $0.25 and a closing price of $9.42 on December 31, 2019. 2. Total portfolio represents Annaly’s portfolio of investments on its balance sheet, including TBA purchase contracts and excluding securitized debt of consolidated VIEs. 3. Capital allocation for each of the four investment strategies is calculated as the difference between each investment strategies’ assets and related financing. This calculation includes TBA purchase contracts and excludes non-portfolio related activity and will vary from total stockholders’ equity. 4. Residential whole loan securitizations since the beginning of the fourth quarter include: (1) a $465mm residential whole loan securitization in October 2019, and (2) a $375mm residential whole loan securitization in January 2020. 5. Hedge ratio measures total notional balances of interest rate swaps, interest rate swaptions (excluding receiver swaptions) and futures relative to repurchase agreements, other secured financing and cost basis of TBA derivatives outstanding; excludes MSRs and the effects of term financing, both of which serve to reduce interest rate risk. Additionally, the hedge ratio does not take into consideration differences in duration between assets and liabilities. 6. Average cost of funds includes GAAP interest expense and the net interest component of interest rate swaps. Page 5 1. Inclusive of add-ons to existing financings as well as committed Delayed Draw Term Loans ("DDTL") and Revolvers. 2. Credit assets represents whole loan, CMBS and equity assets originated or purchased across ARC, ACREG, and AMML and include unfunded commitments of $117.6mm comprised of ACREG and AMML loans. There can be no assurance whether these deals will close or when they will close. 3. Residential whole loan securitizations in 2019 include: (1) a $394mm residential whole loan securitization in January 2019; (2) a $388mm residential whole loan securitization in April 2019; (3) a $384mm residential whole loan securitization in June 2019; (4) a $463mm residential whole loan securitization in July 2019; (5) a $465mm residential whole loan securitization in October 2019; and (6) a $375mm residential whole loan securitization in January 2020. 4. Inclusive of partnerships and/or joint ventures with mortgage loan originators and aggregators, sovereign wealth funds and community development financial institutions. Page 9 1. Incremental capital represents the Company’s stockholders’ equity (as defined in the Management Agreement, “Stockholders’ Equity”) in excess of $17.28bn (which reflects total Stockholders' Equity calculated in accordance with the Management Agreement as of February 28, 2019). Page 10 1. Represents Management's estimates of long-term operating expense projections for the internalization based on historical experience and other factors, including expectations of future operational events and obligations, that are believed to be reasonable. The Company expects to benefit from these cost savings starting in 2021, as the Company will incur 2020 compensation obligations to employees that we expect will be counterbalanced by the elimination of the remaining 2020 management fee obligations. The Company’s actual operating expenses and timeframe for achieving any operating expense savings may differ materially from management’s projections and may not be achieved. Management’s projections are based on a number of factors and uncertainties and actual results may vary based on changes to our expected general and administrative expenses (including expenses related to executive compensation), changes to the Company’s equity base, changes to the Company’s business composition and strategy, and other circumstances which may be out of management’s control. 2. Represents operating expense as a percentage of average equity as of September 30, 2019 annualized. Operating expense is defined as: (i) for internally-managed peers, the sum of compensation and benefits, G&A and other operating expenses, less any one-time or transaction related expenses and (ii) for externally-managed peers, the sum of net management fees, compensation and benefits (if any), G&A and other operating expenses, less any one-time or transaction related expenses. Page 12 1. Based on data from “Tentative Stabilization, Sluggish Recovery?”, Gita Gopinath, IMFBlog, January 2020. 2. Preqin data as of January 2020. Represents total dry powder available. Page 14 1. Assets represent Annaly’s portfolio of investments on its balance sheet. Agency assets include TBA purchase contracts (market value) of $6.9bn and MSRs of $378.1mm and exclude securitized debt of consolidated VIEs of $1.0bn. Residential Credit assets exclude securitized debt of consolidated VIEs of $2.0bn. Commercial Real Estate assets exclude securitized debt of consolidated VIEs of $2.6bn. 2. Capital represents the capital allocation for each of the four investment strategies and is calculated as the difference between each investment strategies’ assets and related financing. This calculation includes TBA purchase contracts and excludes non-portfolio related activity and will vary from total stockholders’ equity. 3. Sector rank compares Annaly dedicated capital in each of its four investment strategies as of December 31, 2019 (adjusted for P/B as of January 31, 2020) to the market capitalization of the companies in each respective comparative sector as of January 31, 2020. The companies in each comparative sectors are selected as follows: for Agency, Commercial Real Estate and Residential Credit sector ranking represent Agency Peers, Commercial Peers and Hybrid Peers, respectively, within the BBREMTG Index as of January 31, 2020 and for Middle Market Lending sector ranking is the S&P BDC Index as of January 31, 2020. 4. Levered return assumptions are for illustrative purposes only and attempt to represent current market asset returns and financing terms as of January 31, 2020 for prospective investments of the same, or of a substantially similar, nature in each respective group. Page 15 1. Reflects Annaly's 5 year FHLB financing, which sunsets in February 2021. 2. Represents Agency's hedging profile and does not reflect Annaly's full hedging activity. 3. Represents Agency’s funding profile and does not reflect Annaly's full funding activity. Page 16 1. Includes TBA purchase contracts and MSRs. 2. Includes TBA purchase contracts and fixed-rate pass-through certificates 3. Includes fixed-rate pass-through certificates only. “High Quality Spec” protection is defined as pools backed by original loan balances of up to $125k, highest LTV pools (CR>125% LTV), geographic concentrations (NY/PR). “Med Quality Spec” includes $200k loan balance, $175k loan balance, $150k loan balance, high LTV (CQ 105-125% LTV), and 40-year pools. “40+ WALA” is defined as weighted average loan age greater than 40 months and treated as seasoned collateral. 32
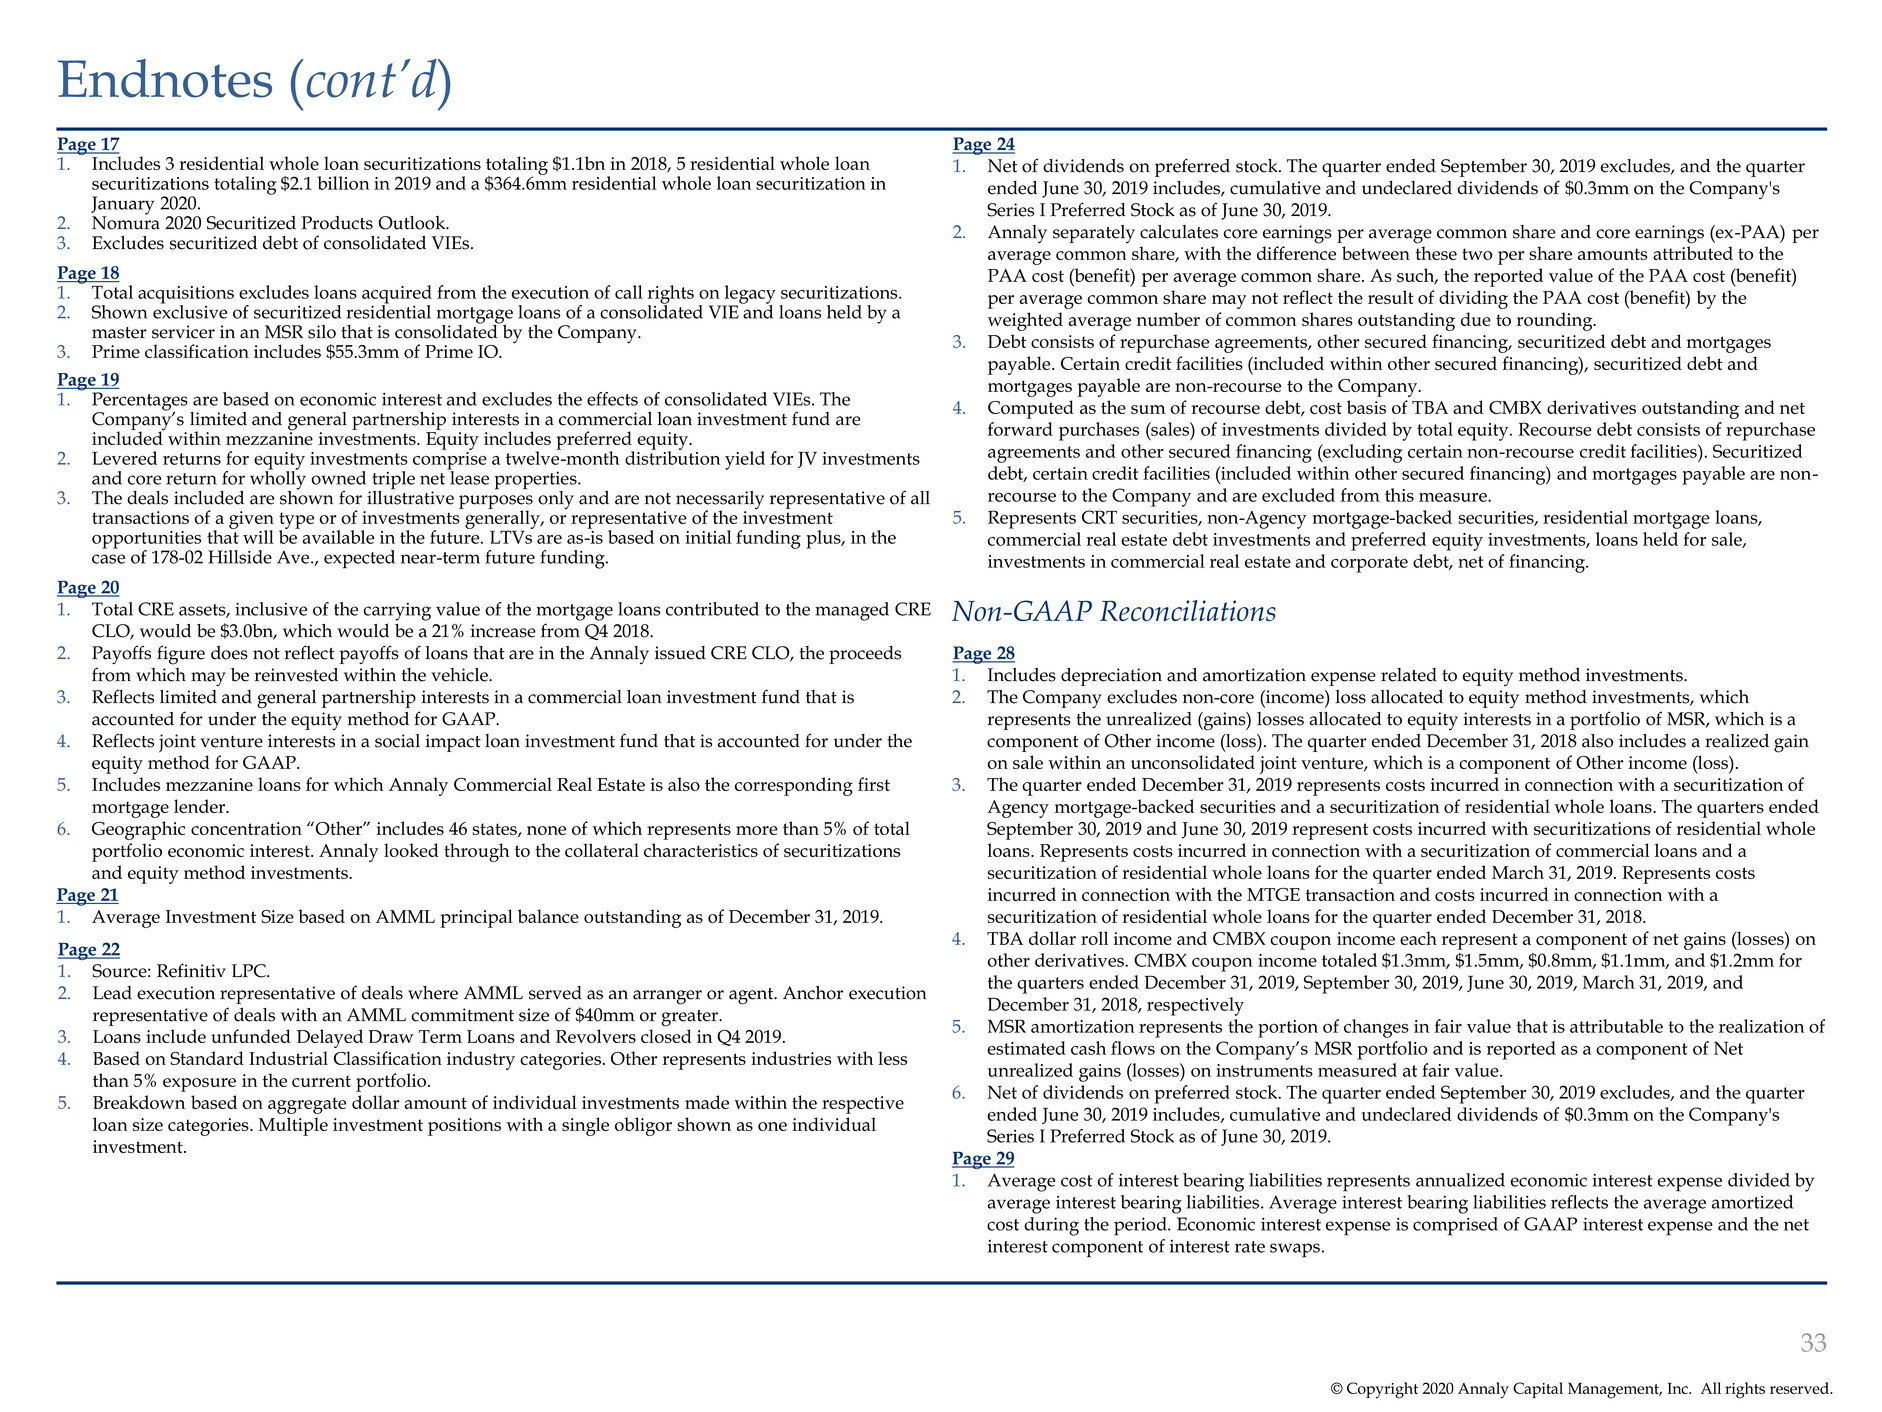
© Copyright 2020 Annaly Capital Management, Inc. All rights reserved. Endnotes (cont’d) Page 17 1. Includes 3 residential whole loan securitizations totaling $1.1bn in 2018, 5 residential whole loan securitizations totaling $2.1 billion in 2019 and a $364.6mm residential whole loan securitization in January 2020. 2. Nomura 2020 Securitized Products Outlook. 3. Excludes securitized debt of consolidated VIEs. Page 18 1. Total acquisitions excludes loans acquired from the execution of call rights on legacy securitizations. 2. Shown exclusive of securitized residential mortgage loans of a consolidated VIE and loans held by a master servicer in an MSR silo that is consolidated by the Company. 3. Prime classification includes $55.3mm of Prime IO. Page 19 1. Percentages are based on economic interest and excludes the effects of consolidated VIEs. The Company’s limited and general partnership interests in a commercial loan investment fund are included within mezzanine investments. Equity includes preferred equity. 2. Levered returns for equity investments comprise a twelve-month distribution yield for JV investments and core return for wholly owned triple net lease properties. 3. The deals included are shown for illustrative purposes only and are not necessarily representative of all transactions of a given type or of investments generally, or representative of the investment opportunities that will be available in the future. LTVs are as-is based on initial funding plus, in the case of 178-02 Hillside Ave., expected near-term future funding. Page 20 1. Total CRE assets, inclusive of the carrying value of the mortgage loans contributed to the managed CRE CLO, would be $3.0bn, which would be a 21% increase from Q4 2018. 2. Payoffs figure does not reflect payoffs of loans that are in the Annaly issued CRE CLO, the proceeds from which may be reinvested within the vehicle. 3. Reflects limited and general partnership interests in a commercial loan investment fund that is accounted for under the equity method for GAAP. 4. Reflects joint venture interests in a social impact loan investment fund that is accounted for under the equity method for GAAP. 5. Includes mezzanine loans for which Annaly Commercial Real Estate is also the corresponding first mortgage lender. 6. Geographic concentration “Other” includes 46 states, none of which represents more than 5% of total portfolio economic interest. Annaly looked through to the collateral characteristics of securitizations and equity method investments. Page 21 1. Average Investment Size based on AMML principal balance outstanding as of December 31, 2019. Page 22 1. Source: Refinitiv LPC. 2. Lead execution representative of deals where AMML served as an arranger or agent. Anchor execution representative of deals with an AMML commitment size of $40mm or greater. 3. Loans include unfunded Delayed Draw Term Loans and Revolvers closed in Q4 2019. 4. Based on Standard Industrial Classification industry categories. Other represents industries with less than 5% exposure in the current portfolio. 5. Breakdown based on aggregate dollar amount of individual investments made within the respective loan size categories. Multiple investment positions with a single obligor shown as one individual investment. Page 24 1. Net of dividends on preferred stock. The quarter ended September 30, 2019 excludes, and the quarter ended June 30, 2019 includes, cumulative and undeclared dividends of $0.3mm on the Company's Series I Preferred Stock as of June 30, 2019. 2. Annaly separately calculates core earnings per average common share and core earnings (ex-PAA) per average common share, with the difference between these two per share amounts attributed to the PAA cost (benefit) per average common share. As such, the reported value of the PAA cost (benefit) per average common share may not reflect the result of dividing the PAA cost (benefit) by the weighted average number of common shares outstanding due to rounding. 3. Debt consists of repurchase agreements, other secured financing, securitized debt and mortgages payable. Certain credit facilities (included within other secured financing), securitized debt and mortgages payable are non-recourse to the Company. 4. Computed as the sum of recourse debt, cost basis of TBA and CMBX derivatives outstanding and net forward purchases (sales) of investments divided by total equity. Recourse debt consists of repurchase agreements and other secured financing (excluding certain non-recourse credit facilities). Securitized debt, certain credit facilities (included within other secured financing) and mortgages payable are non- recourse to the Company and are excluded from this measure. 5. Represents CRT securities, non-Agency mortgage-backed securities, residential mortgage loans, commercial real estate debt investments and preferred equity investments, loans held for sale, investments in commercial real estate and corporate debt, net of financing. Non-GAAP Reconciliations Page 28 1. Includes depreciation and amortization expense related to equity method investments. 2. The Company excludes non-core (income) loss allocated to equity method investments, which represents the unrealized (gains) losses allocated to equity interests in a portfolio of MSR, which is a component of Other income (loss). The quarter ended December 31, 2018 also includes a realized gain on sale within an unconsolidated joint venture, which is a component of Other income (loss). 3. The quarter ended December 31, 2019 represents costs incurred in connection with a securitization of Agency mortgage-backed securities and a securitization of residential whole loans. The quarters ended September 30, 2019 and June 30, 2019 represent costs incurred with securitizations of residential whole loans. Represents costs incurred in connection with a securitization of commercial loans and a securitization of residential whole loans for the quarter ended March 31, 2019. Represents costs incurred in connection with the MTGE transaction and costs incurred in connection with a securitization of residential whole loans for the quarter ended December 31, 2018. 4. TBA dollar roll income and CMBX coupon income each represent a component of net gains (losses) on other derivatives. CMBX coupon income totaled $1.3mm, $1.5mm, $0.8mm, $1.1mm, and $1.2mm for the quarters ended December 31, 2019, September 30, 2019, June 30, 2019, March 31, 2019, and December 31, 2018, respectively 5. MSR amortization represents the portion of changes in fair value that is attributable to the realization of estimated cash flows on the Company’s MSR portfolio and is reported as a component of Net unrealized gains (losses) on instruments measured at fair value. 6. Net of dividends on preferred stock. The quarter ended September 30, 2019 excludes, and the quarter ended June 30, 2019 includes, cumulative and undeclared dividends of $0.3mm on the Company's Series I Preferred Stock as of June 30, 2019. Page 29 1. Average cost of interest bearing liabilities represents annualized economic interest expense divided by average interest bearing liabilities. Average interest bearing liabilities reflects the average amortized cost during the period. Economic interest expense is comprised of GAAP interest expense and the net interest component of interest rate swaps. 33


