
1 Q1 2023 April 26, 2023 Earnings Presentation Scott Anderson, Interim CEO Arun Rajan, Chief Operating Officer Mike Zechmeister, Chief Financial Officer Chuck Ives, Director of Investor Relations
Safe Harbor Statement Except for the historical information contained herein, the matters set forth in this presentation and the accompanying earnings release are forward-looking statements that represent our expectations, beliefs, intentions or strategies concerning future events. These forward-looking statements are subject to certain risks and uncertainties that could cause actual results to differ materially from our historical experience or our present expectations, including, but not limited to such factors such as changes in economic conditions, including uncertain consumer demand; changes in market demand and pressures on the pricing for our services; fuel price increases or decreases, or fuel shortages; competition and growth rates within the global logistics industry; freight levels and increasing costs and availability of truck capacity or alternative means of transporting freight; risks associated with significant disruptions in the transportation industry; changes in relationships with existing contracted truck, rail, ocean, and air carriers; changes in our customer base due to possible consolidation among our customers; risks with reliance on technology to operate our business; cyber-security related risks; risks associated with operations outside of the United States; our ability to successfully integrate the operations of acquired companies with our historic operations; risks related to our search for a permanent CEO and retention of key management personnel; climate change related risks; risks associated with our indebtedness, interest rates related risks; risks associated with litigation, including contingent auto liability and insurance coverage; risks associated with the potential impact of changes in government regulations; risks associated with the changes to income tax regulations; risks associated with the produce industry, including food safety and contamination issues; the impact of war on the economy; changes to our capital structure; changes due to catastrophic events including pandemics such as COVID-19; and other risks and uncertainties detailed in our Annual and Quarterly Reports. Any forward-looking statement speaks only as of the date on which such statement is made, and we undertake no obligation to update such statement to reflect events or circumstances arising after such date. 2©2023 C.H. Robinson Worldwide, Inc. All Rights Reserved.
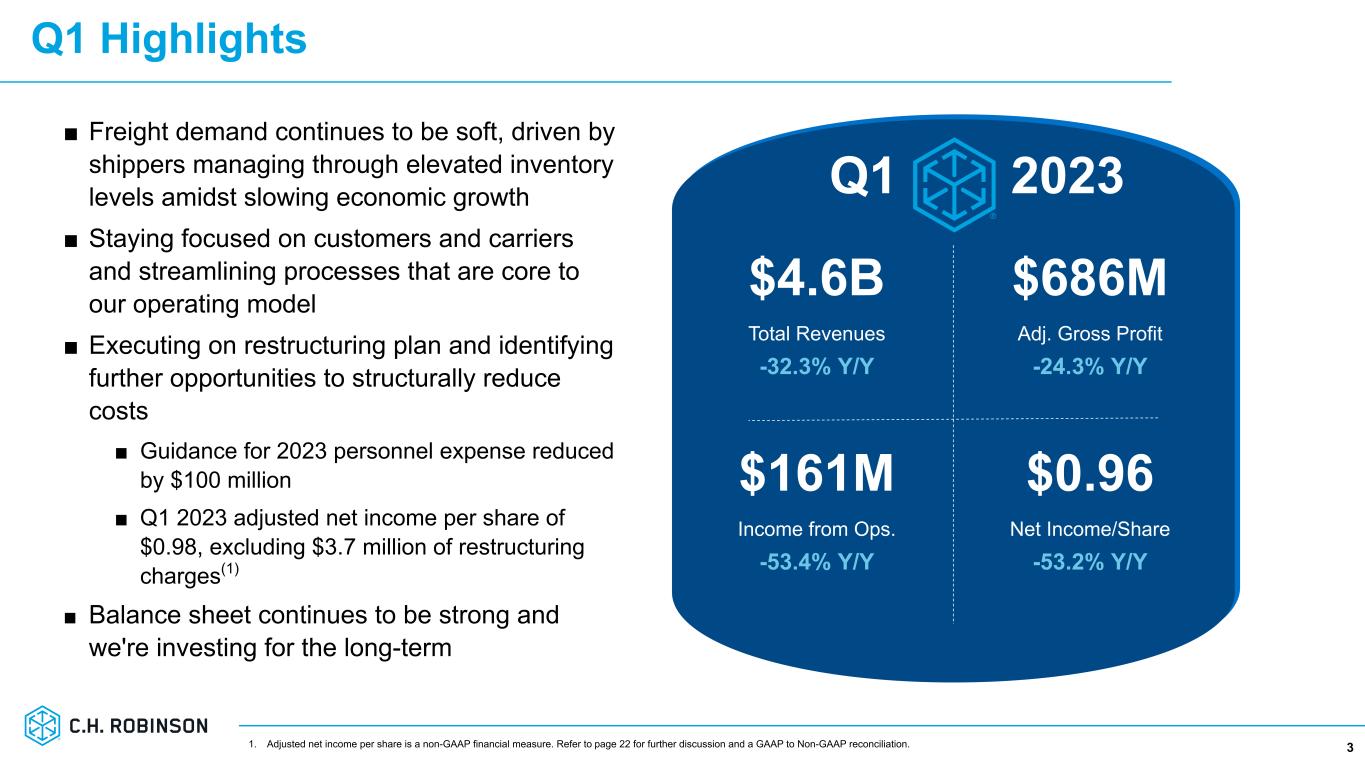
Q1 Highlights 3 ■ Freight demand continues to be soft, driven by shippers managing through elevated inventory levels amidst slowing economic growth ■ Staying focused on customers and carriers and streamlining processes that are core to our operating model ■ Executing on restructuring plan and identifying further opportunities to structurally reduce costs ■ Guidance for 2023 personnel expense reduced by $100 million ■ Q1 2023 adjusted net income per share of $0.98, excluding $3.7 million of restructuring charges(1) ■ Balance sheet continues to be strong and we're investing for the long-term $4.6B Total Revenues -32.3% Y/Y $686M Adj. Gross Profit -24.3% Y/Y $161M Income from Ops. -53.4% Y/Y $0.96 Net Income/Share -53.2% Y/Y Q1 2023 1. Adjusted net income per share is a non-GAAP financial measure. Refer to page 22 for further discussion and a GAAP to Non-GAAP reconciliation.
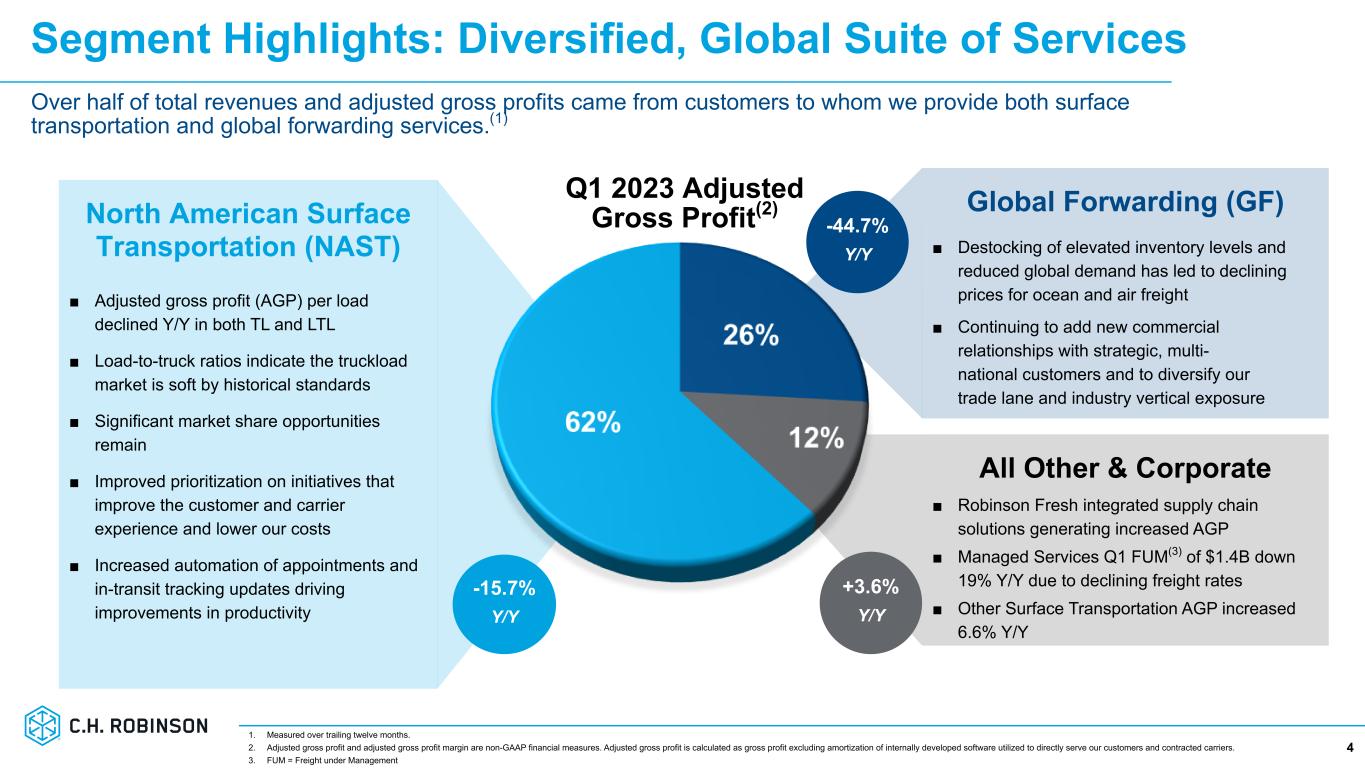
All Other & Corporate ■ Robinson Fresh integrated supply chain solutions generating increased AGP ■ Managed Services Q1 FUM(3) of $1.4B down 19% Y/Y due to declining freight rates ■ Other Surface Transportation AGP increased 6.6% Y/Y Global Forwarding (GF) ■ Destocking of elevated inventory levels and reduced global demand has led to declining prices for ocean and air freight ■ Continuing to add new commercial relationships with strategic, multi- national customers and to diversify our trade lane and industry vertical exposure North American Surface Transportation (NAST) ■ Adjusted gross profit (AGP) per load declined Y/Y in both TL and LTL ■ Load-to-truck ratios indicate the truckload market is soft by historical standards ■ Significant market share opportunities remain ■ Improved prioritization on initiatives that improve the customer and carrier experience and lower our costs ■ Increased automation of appointments and in-transit tracking updates driving improvements in productivity Segment Highlights: Diversified, Global Suite of Services 4 Q1 2023 Adjusted Gross Profit(2) -15.7% Y/Y +3.6% Y/Y -44.7% Y/Y 1. Measured over trailing twelve months. 2. Adjusted gross profit and adjusted gross profit margin are non-GAAP financial measures. Adjusted gross profit is calculated as gross profit excluding amortization of internally developed software utilized to directly serve our customers and contracted carriers. 3. FUM = Freight under Management Over half of total revenues and adjusted gross profits came from customers to whom we provide both surface transportation and global forwarding services.(1)
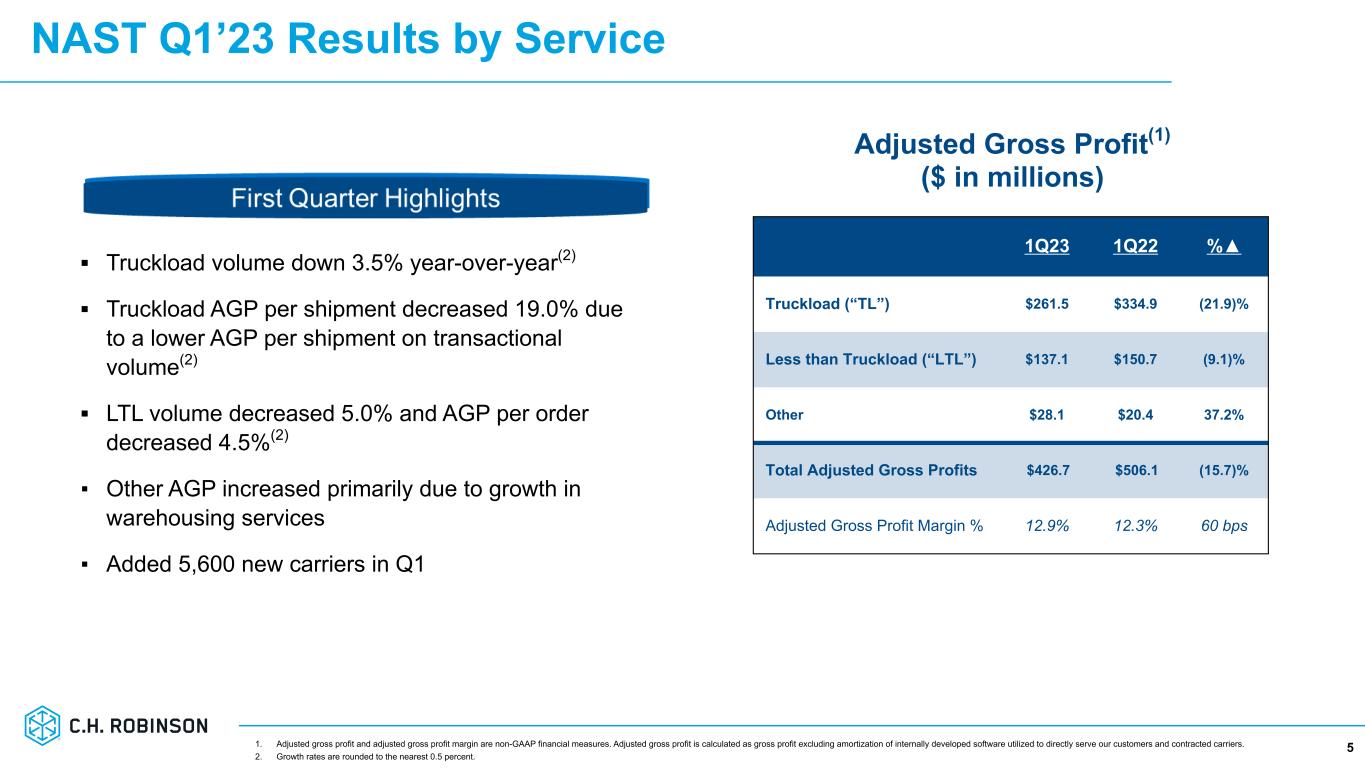
NAST Q1’23 Results by Service 5 ▪ Truckload volume down 3.5% year-over-year(2) ▪ Truckload AGP per shipment decreased 19.0% due to a lower AGP per shipment on transactional volume(2) ▪ LTL volume decreased 5.0% and AGP per order decreased 4.5%(2) ▪ Other AGP increased primarily due to growth in warehousing services ▪ Added 5,600 new carriers in Q1 1Q23 1Q22 %▲ Truckload (“TL”) $261.5 $334.9 (21.9)% Less than Truckload (“LTL”) $137.1 $150.7 (9.1)% Other $28.1 $20.4 37.2% Total Adjusted Gross Profits $426.7 $506.1 (15.7)% Adjusted Gross Profit Margin % 12.9% 12.3% 60 bps Adjusted Gross Profit(1) ($ in millions) 1. Adjusted gross profit and adjusted gross profit margin are non-GAAP financial measures. Adjusted gross profit is calculated as gross profit excluding amortization of internally developed software utilized to directly serve our customers and contracted carriers. 2. Growth rates are rounded to the nearest 0.5 percent.
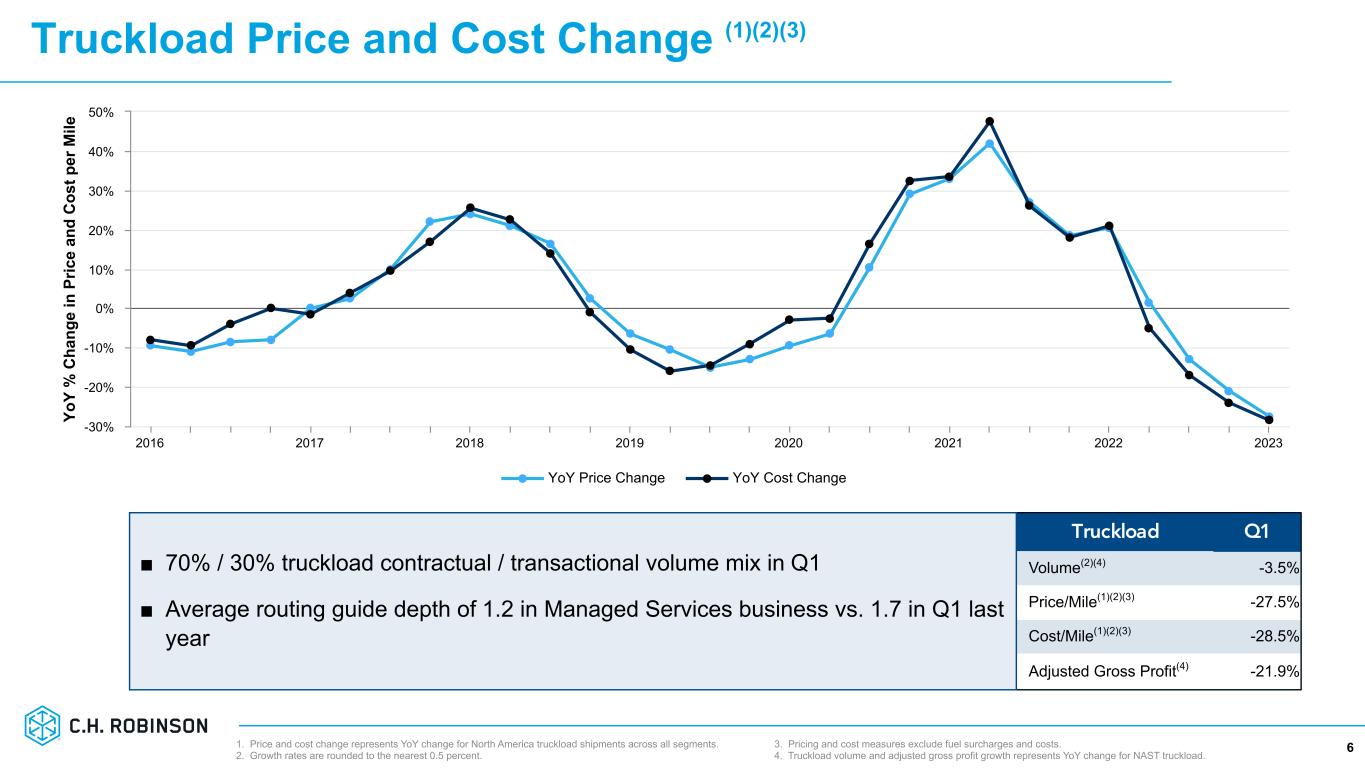
Truckload Price and Cost Change (1)(2)(3) 6 Truckload Q1 Volume(2)(4) -3.5 % Price/Mile(1)(2)(3) -27.5 % Cost/Mile(1)(2)(3) -28.5 % Adjusted Gross Profit(4) -21.9 % 1. Price and cost change represents YoY change for North America truckload shipments across all segments. 2. Growth rates are rounded to the nearest 0.5 percent. ■ 70% / 30% truckload contractual / transactional volume mix in Q1 ■ Average routing guide depth of 1.2 in Managed Services business vs. 1.7 in Q1 last year 3. Pricing and cost measures exclude fuel surcharges and costs. 4. Truckload volume and adjusted gross profit growth represents YoY change for NAST truckload. Yo Y % C ha ng e in P ric e an d C os t p er M ile YoY Price Change YoY Cost Change 2016 2017 2018 2019 2020 2021 2022 2023 -30% -20% -10% 0% 10% 20% 30% 40% 50%
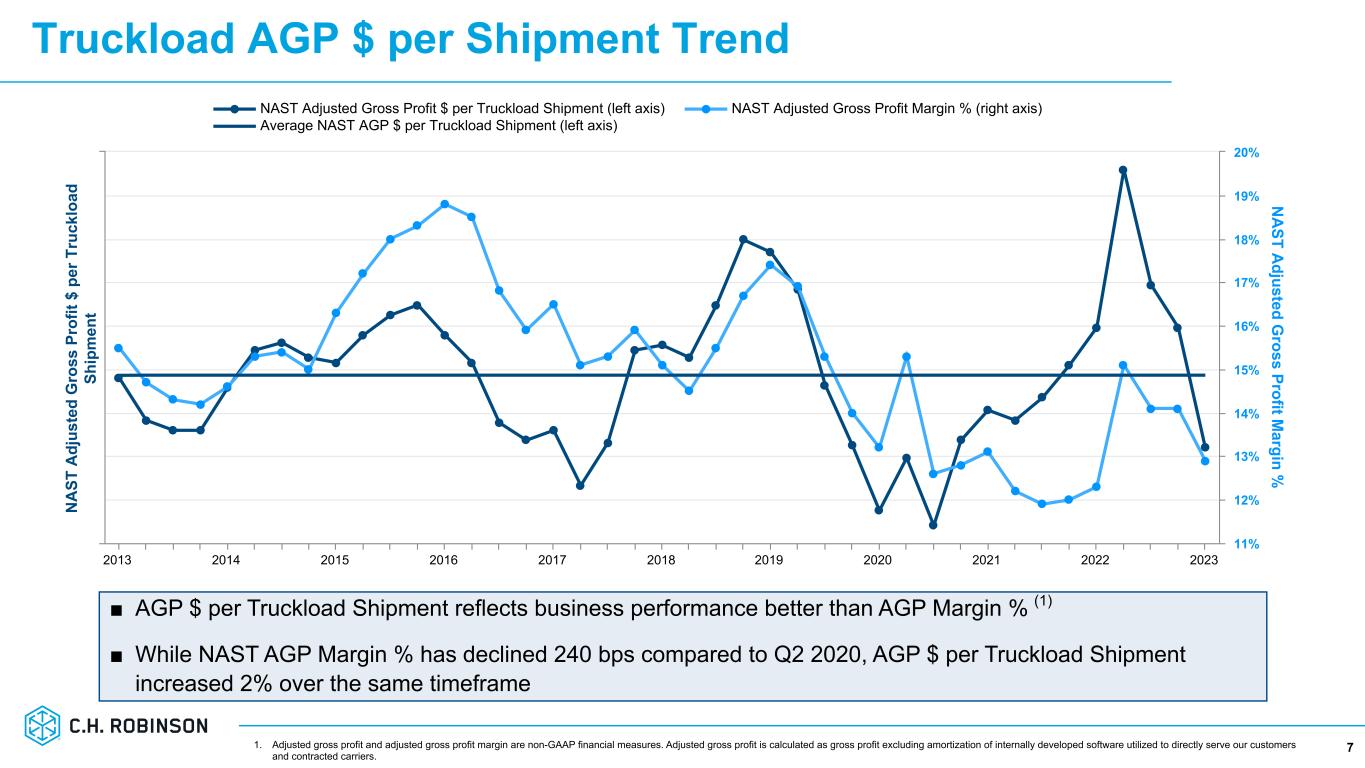
Truckload AGP $ per Shipment Trend 7 ■ AGP $ per Truckload Shipment reflects business performance better than AGP Margin % (1) ■ While NAST AGP Margin % has declined 240 bps compared to Q2 2020, AGP $ per Truckload Shipment increased 2% over the same timeframe N A ST A dj us te d G ro ss P ro fit $ p er T ru ck lo ad Sh ip m en t N A ST A djusted G ross Profit M argin % NAST Adjusted Gross Profit $ per Truckload Shipment (left axis) NAST Adjusted Gross Profit Margin % (right axis) Average NAST AGP $ per Truckload Shipment (left axis) 2013 2014 2015 2016 2017 2018 2019 2020 2021 2022 2023 11% 12% 13% 14% 15% 16% 17% 18% 19% 20% 1. Adjusted gross profit and adjusted gross profit margin are non-GAAP financial measures. Adjusted gross profit is calculated as gross profit excluding amortization of internally developed software utilized to directly serve our customers and contracted carriers.
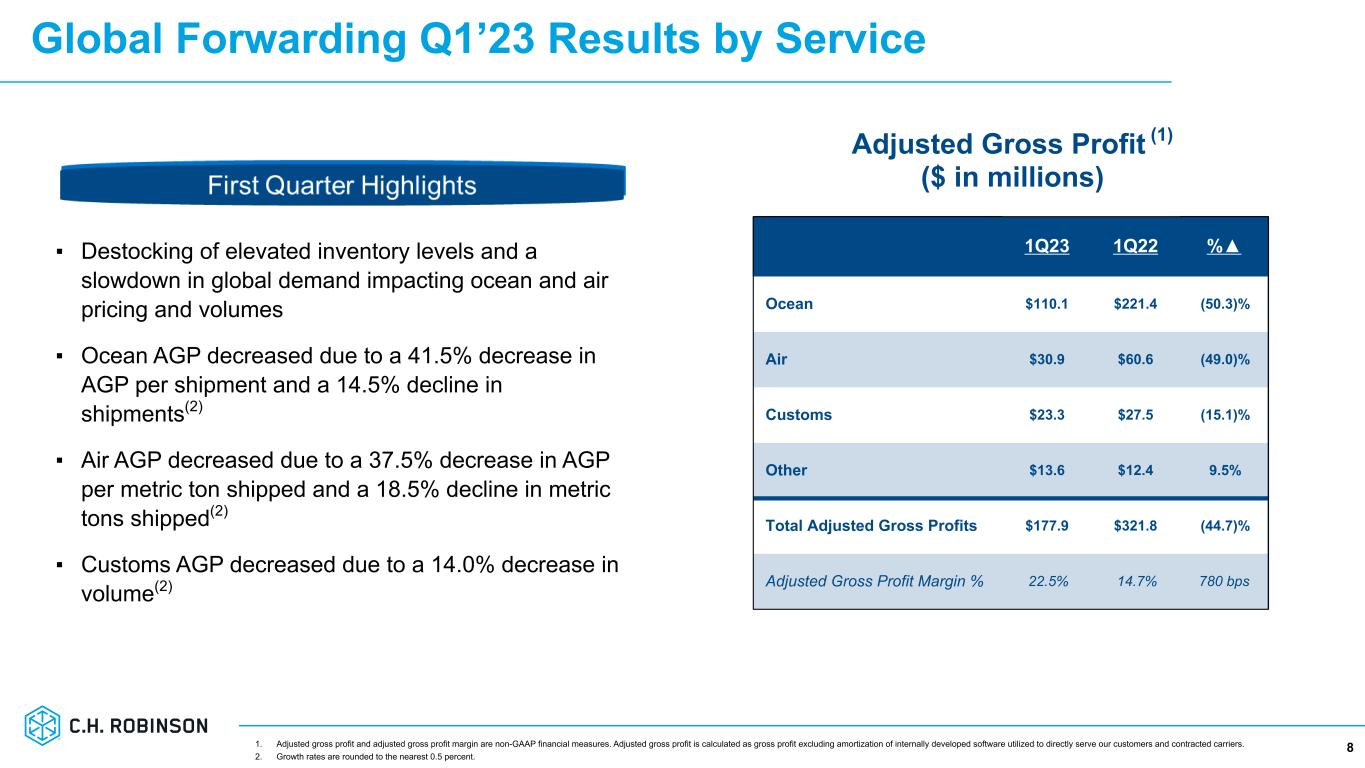
Global Forwarding Q1’23 Results by Service 8 1Q23 1Q22 %▲ Ocean $110.1 $221.4 (50.3)% Air $30.9 $60.6 (49.0)% Customs $23.3 $27.5 (15.1)% Other $13.6 $12.4 9.5% Total Adjusted Gross Profits $177.9 $321.8 (44.7)% Adjusted Gross Profit Margin % 22.5% 14.7% 780 bps Adjusted Gross Profit (1) ($ in millions) ▪ Destocking of elevated inventory levels and a slowdown in global demand impacting ocean and air pricing and volumes ▪ Ocean AGP decreased due to a 41.5% decrease in AGP per shipment and a 14.5% decline in shipments(2) ▪ Air AGP decreased due to a 37.5% decrease in AGP per metric ton shipped and a 18.5% decline in metric tons shipped(2) ▪ Customs AGP decreased due to a 14.0% decrease in volume(2) 1. Adjusted gross profit and adjusted gross profit margin are non-GAAP financial measures. Adjusted gross profit is calculated as gross profit excluding amortization of internally developed software utilized to directly serve our customers and contracted carriers. 2. Growth rates are rounded to the nearest 0.5 percent.
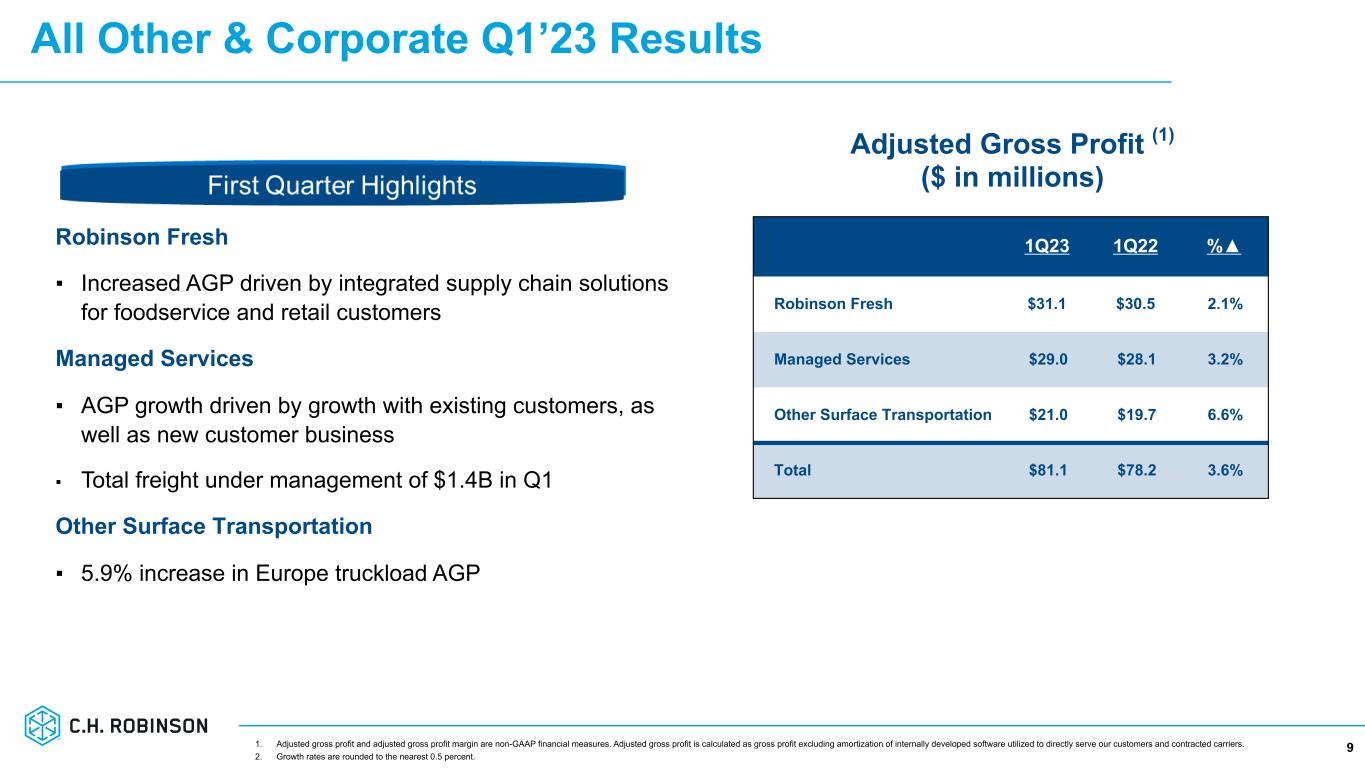
All Other & Corporate Q1’23 Results 9 Robinson Fresh ▪ Increased AGP driven by integrated supply chain solutions for foodservice and retail customers Managed Services ▪ AGP growth driven by growth with existing customers, as well as new customer business ▪ Total freight under management of $1.4B in Q1 Other Surface Transportation ▪ 5.9% increase in Europe truckload AGP 1Q23 1Q22 %▲ Robinson Fresh $31.1 $30.5 2.1% Managed Services $29.0 $28.1 3.2% Other Surface Transportation $21.0 $19.7 6.6% Total $81.1 $78.2 3.6% Adjusted Gross Profit (1) ($ in millions) 1. Adjusted gross profit and adjusted gross profit margin are non-GAAP financial measures. Adjusted gross profit is calculated as gross profit excluding amortization of internally developed software utilized to directly serve our customers and contracted carriers. 2. Growth rates are rounded to the nearest 0.5 percent.
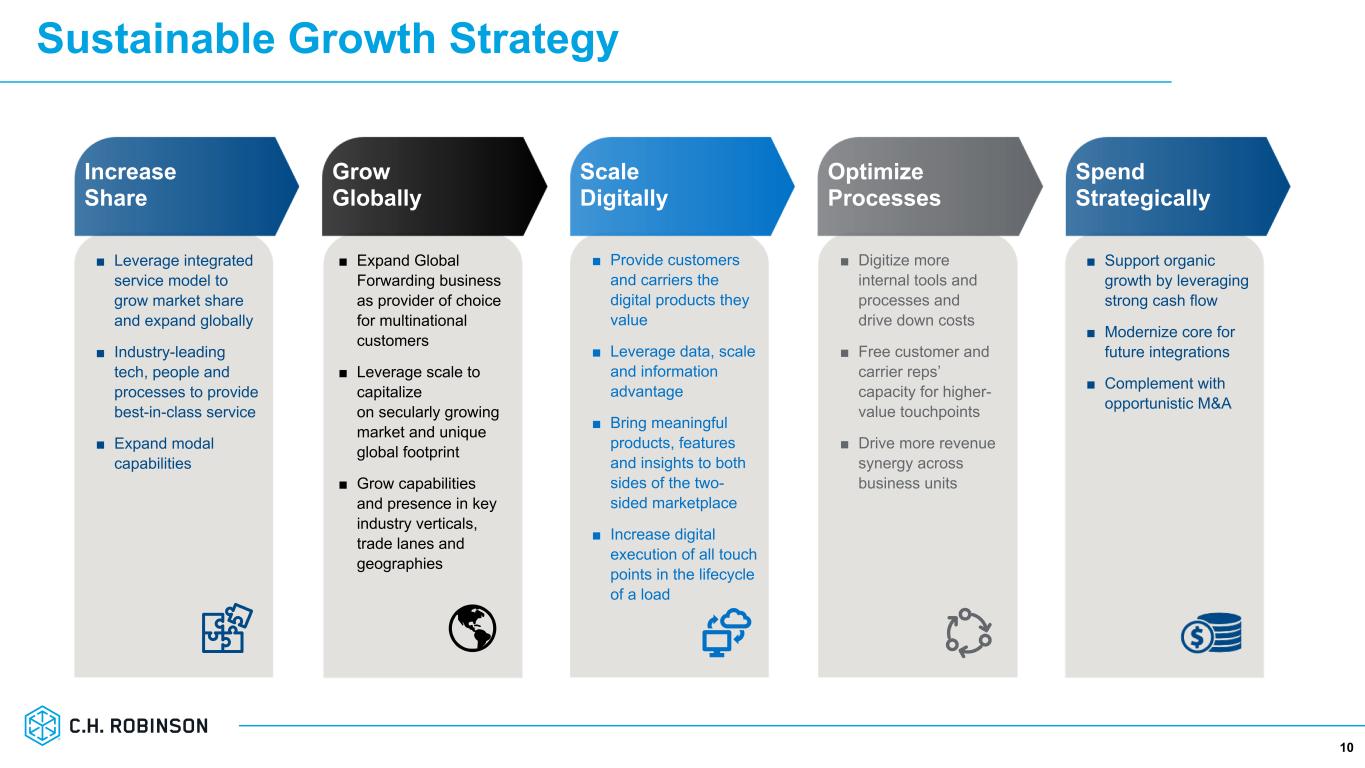
Sustainable Growth Strategy 10 Optimize Processes Spend Strategically Grow Globally Scale Digitally Increase Share ■ Leverage integrated service model to grow market share and expand globally ■ Industry-leading tech, people and processes to provide best-in-class service ■ Expand modal capabilities ■ Expand Global Forwarding business as provider of choice for multinational customers ■ Leverage scale to capitalize on secularly growing market and unique global footprint ■ Grow capabilities and presence in key industry verticals, trade lanes and geographies ■ Digitize more internal tools and processes and drive down costs ■ Free customer and carrier reps’ capacity for higher- value touchpoints ■ Drive more revenue synergy across business units ■ Provide customers and carriers the digital products they value ■ Leverage data, scale and information advantage ■ Bring meaningful products, features and insights to both sides of the two- sided marketplace ■ Increase digital execution of all touch points in the lifecycle of a load ■ Support organic growth by leveraging strong cash flow ■ Modernize core for future integrations ■ Complement with opportunistic M&A
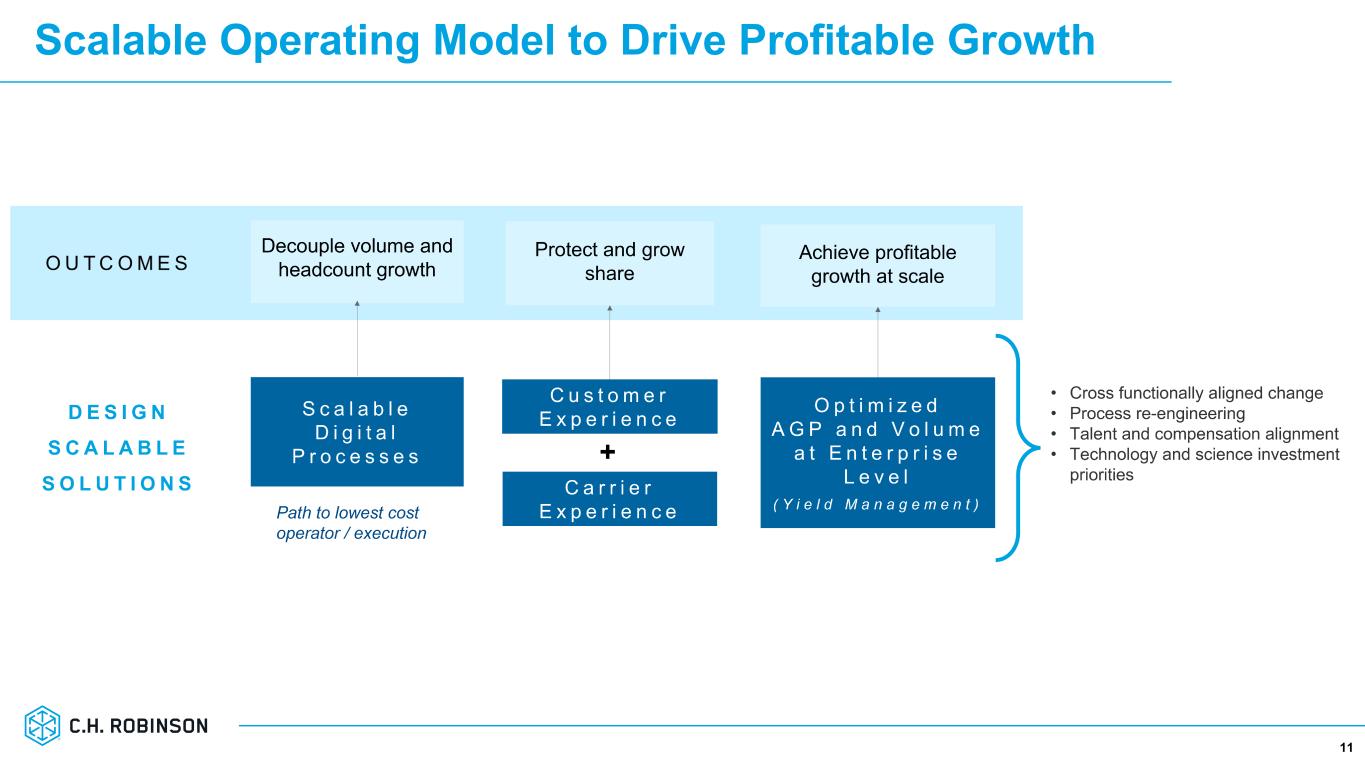
Scalable Operating Model to Drive Profitable Growth 11 11
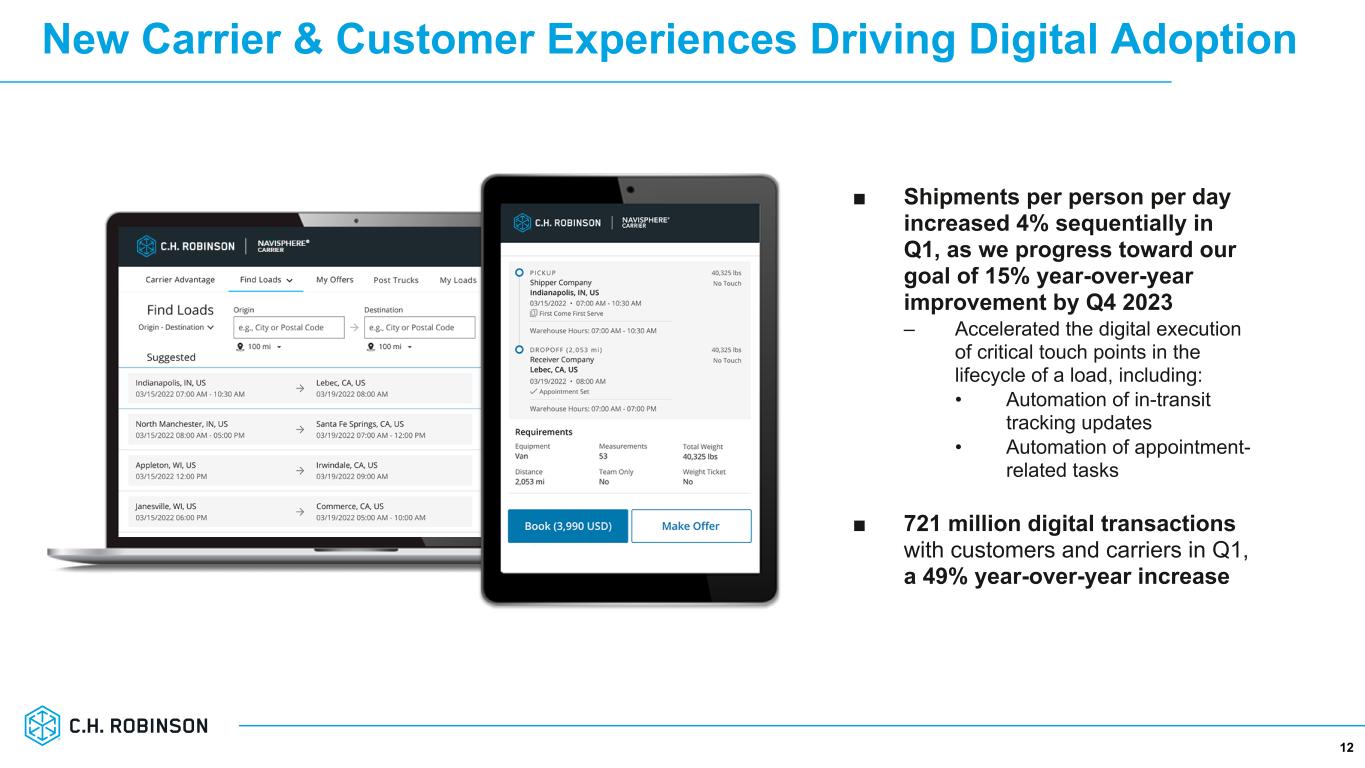
New Carrier & Customer Experiences Driving Digital Adoption 12 ■ Shipments per person per day increased 4% sequentially in Q1, as we progress toward our goal of 15% year-over-year improvement by Q4 2023 – Accelerated the digital execution of critical touch points in the lifecycle of a load, including: • Automation of in-transit tracking updates • Automation of appointment- related tasks ■ 721 million digital transactions with customers and carriers in Q1, a 49% year-over-year increase 12
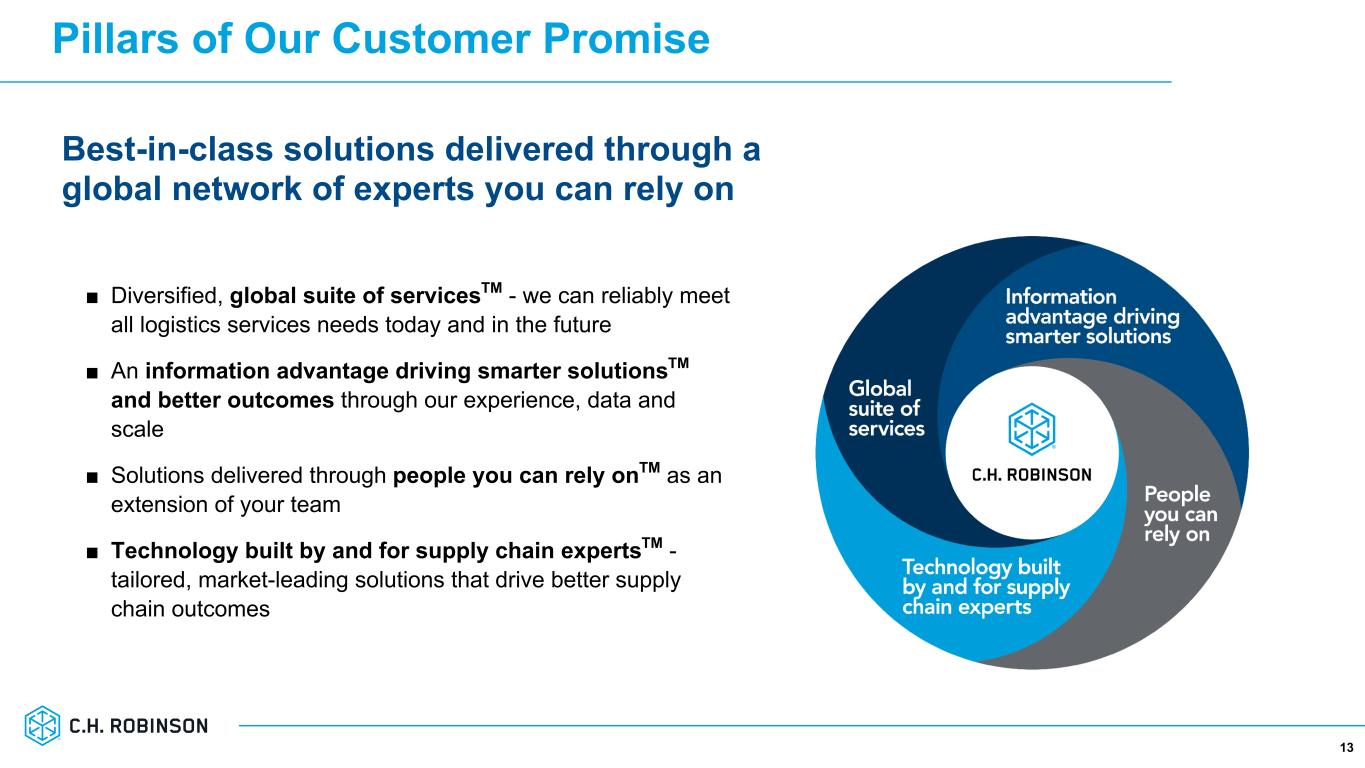
Pillars of Our Customer Promise ■ Diversified, global suite of servicesTM - we can reliably meet all logistics services needs today and in the future ■ An information advantage driving smarter solutionsTM and better outcomes through our experience, data and scale ■ Solutions delivered through people you can rely onTM as an extension of your team ■ Technology built by and for supply chain expertsTM - tailored, market-leading solutions that drive better supply chain outcomes 13 Best-in-class solutions delivered through a global network of experts you can rely on
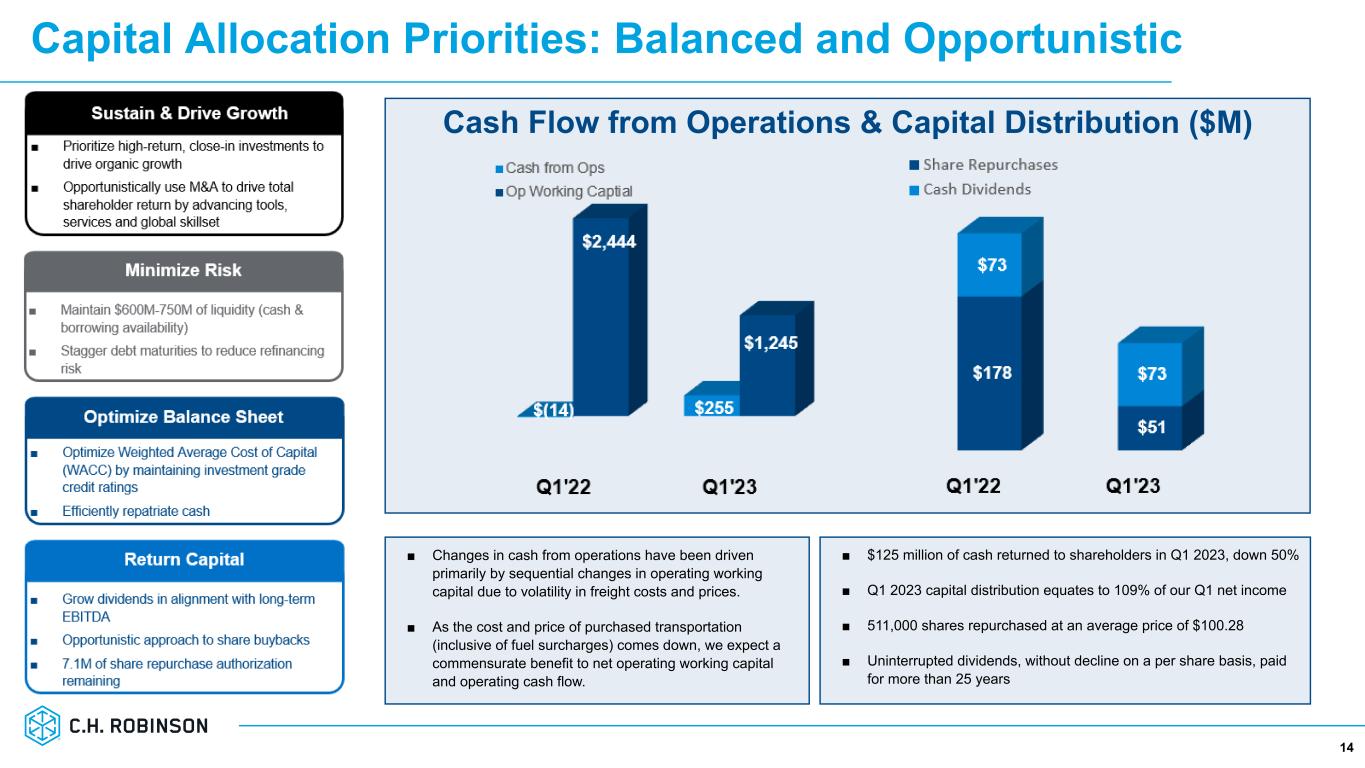
Capital Allocation Priorities: Balanced and Opportunistic 14 Cash Flow from Operations & Capital Distribution ($M) ■ $125 million of cash returned to shareholders in Q1 2023, down 50% ■ Q1 2023 capital distribution equates to 109% of our Q1 net income ■ 511,000 shares repurchased at an average price of $100.28 ■ Uninterrupted dividends, without decline on a per share basis, paid for more than 25 years ■ Changes in cash from operations have been driven primarily by sequential changes in operating working capital due to volatility in freight costs and prices. ■ As the cost and price of purchased transportation (inclusive of fuel surcharges) comes down, we expect a commensurate benefit to net operating working capital and operating cash flow.

15 Appendix
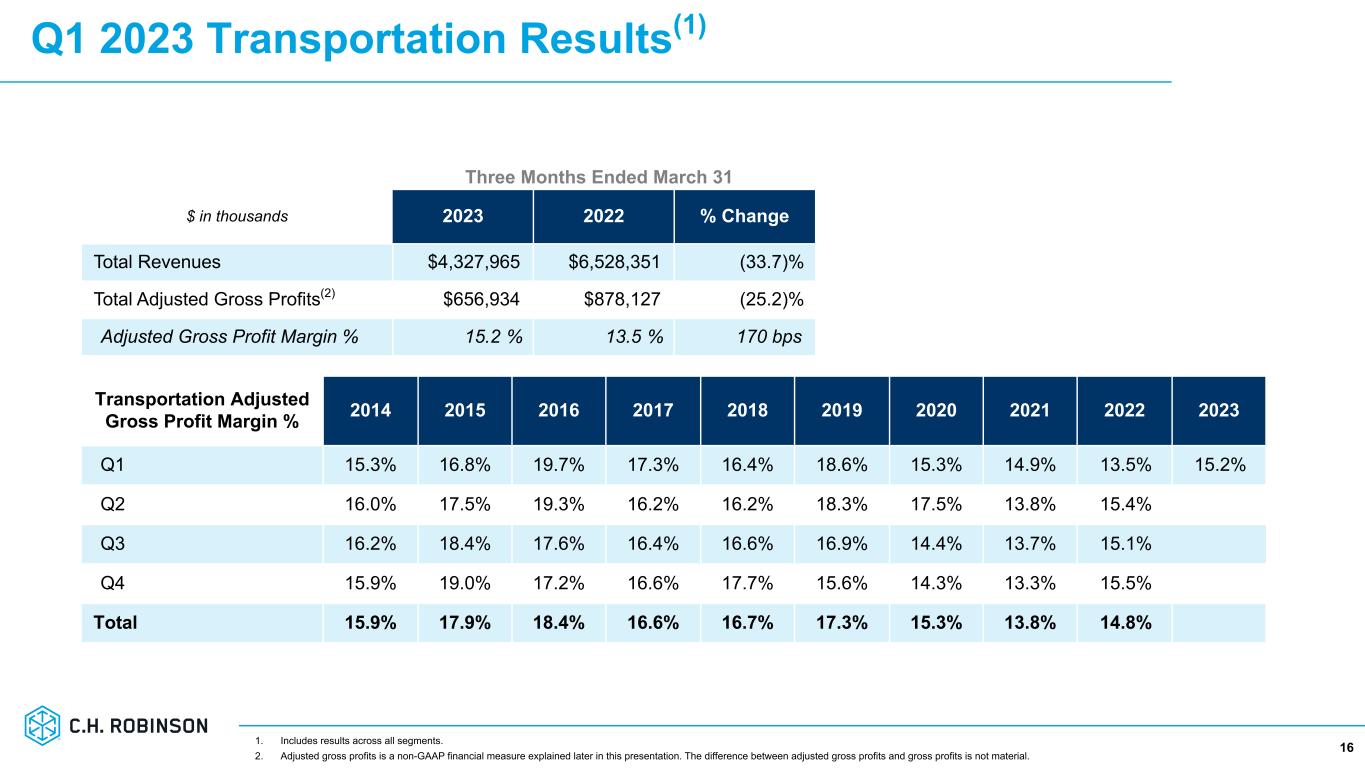
Q1 2023 Transportation Results(1) 16 Three Months Ended March 31 $ in thousands 2023 2022 % Change Total Revenues $4,327,965 $6,528,351 (33.7) % Total Adjusted Gross Profits(2) $656,934 $878,127 (25.2) % Adjusted Gross Profit Margin % 15.2 % 13.5 % 170 bps Transportation Adjusted Gross Profit Margin % 2014 2015 2016 2017 2018 2019 2020 2021 2022 2023 Q1 15.3% 16.8% 19.7% 17.3% 16.4% 18.6% 15.3% 14.9% 13.5% 15.2% Q2 16.0% 17.5% 19.3% 16.2% 16.2% 18.3% 17.5% 13.8% 15.4% Q3 16.2% 18.4% 17.6% 16.4% 16.6% 16.9% 14.4% 13.7% 15.1% Q4 15.9% 19.0% 17.2% 16.6% 17.7% 15.6% 14.3% 13.3% 15.5% Total 15.9% 17.9% 18.4% 16.6% 16.7% 17.3% 15.3% 13.8% 14.8% 1. Includes results across all segments. 2. Adjusted gross profits is a non-GAAP financial measure explained later in this presentation. The difference between adjusted gross profits and gross profits is not material.
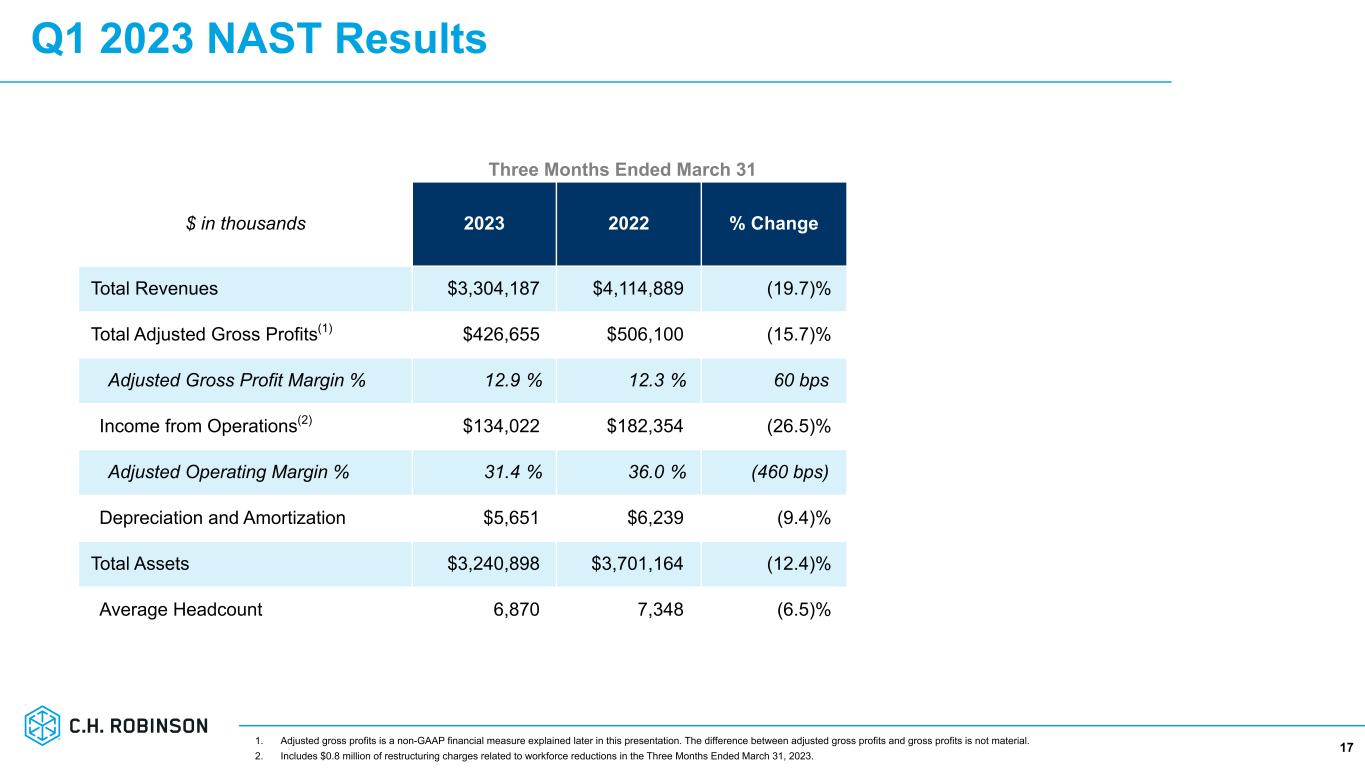
Q1 2023 NAST Results 171. Adjusted gross profits is a non-GAAP financial measure explained later in this presentation. The difference between adjusted gross profits and gross profits is not material. 2. Includes $0.8 million of restructuring charges related to workforce reductions in the Three Months Ended March 31, 2023. Three Months Ended March 31 $ in thousands 2023 2022 % Change Total Revenues $3,304,187 $4,114,889 (19.7) % Total Adjusted Gross Profits(1) $426,655 $506,100 (15.7) % Adjusted Gross Profit Margin % 12.9 % 12.3 % 60 bps Income from Operations(2) $134,022 $182,354 (26.5) % Adjusted Operating Margin % 31.4 % 36.0 % (460 bps) Depreciation and Amortization $5,651 $6,239 (9.4) % Total Assets $3,240,898 $3,701,164 (12.4) % Average Headcount 6,870 7,348 (6.5) %
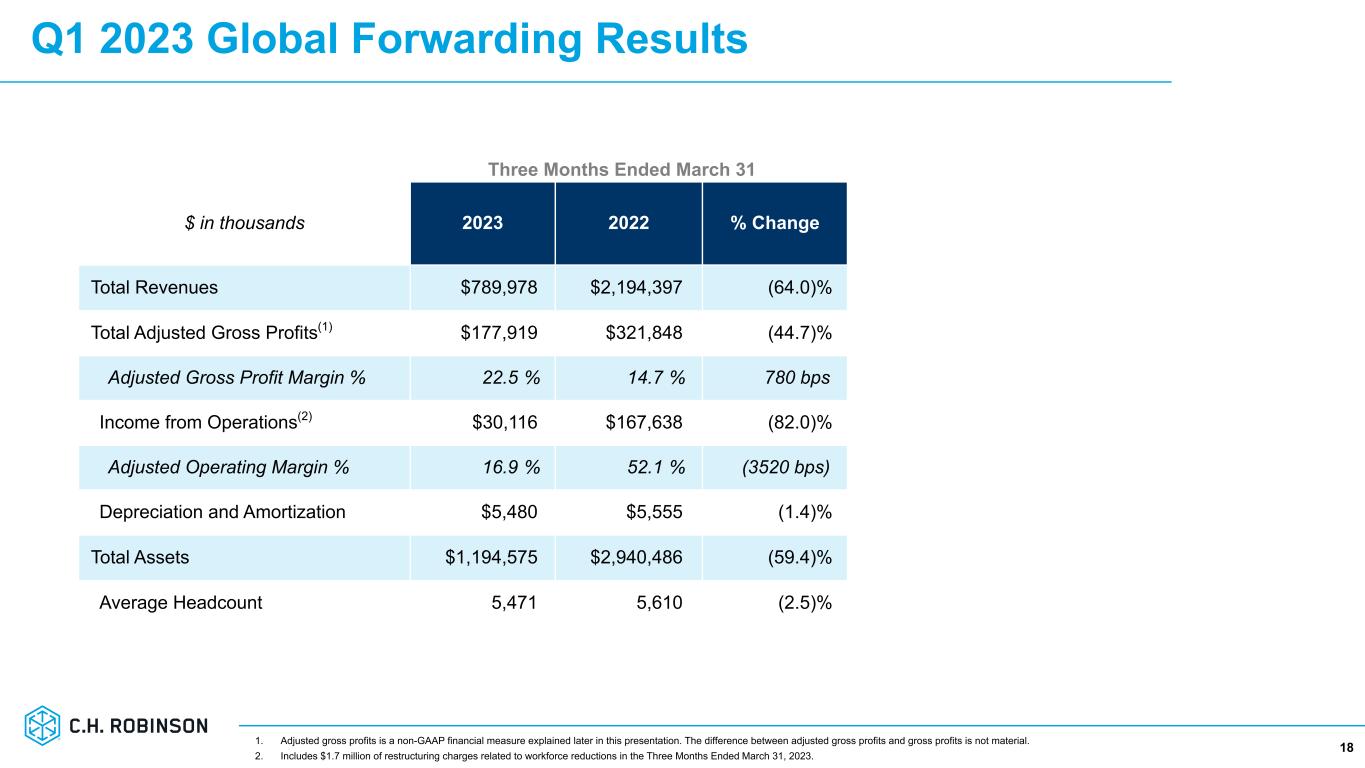
Q1 2023 Global Forwarding Results 181. Adjusted gross profits is a non-GAAP financial measure explained later in this presentation. The difference between adjusted gross profits and gross profits is not material. 2. Includes $1.7 million of restructuring charges related to workforce reductions in the Three Months Ended March 31, 2023. Three Months Ended March 31 $ in thousands 2023 2022 % Change Total Revenues $789,978 $2,194,397 (64.0) % Total Adjusted Gross Profits(1) $177,919 $321,848 (44.7) % Adjusted Gross Profit Margin % 22.5 % 14.7 % 780 bps Income from Operations(2) $30,116 $167,638 (82.0) % Adjusted Operating Margin % 16.9 % 52.1 % (3520 bps) Depreciation and Amortization $5,480 $5,555 (1.4) % Total Assets $1,194,575 $2,940,486 (59.4) % Average Headcount 5,471 5,610 (2.5) %
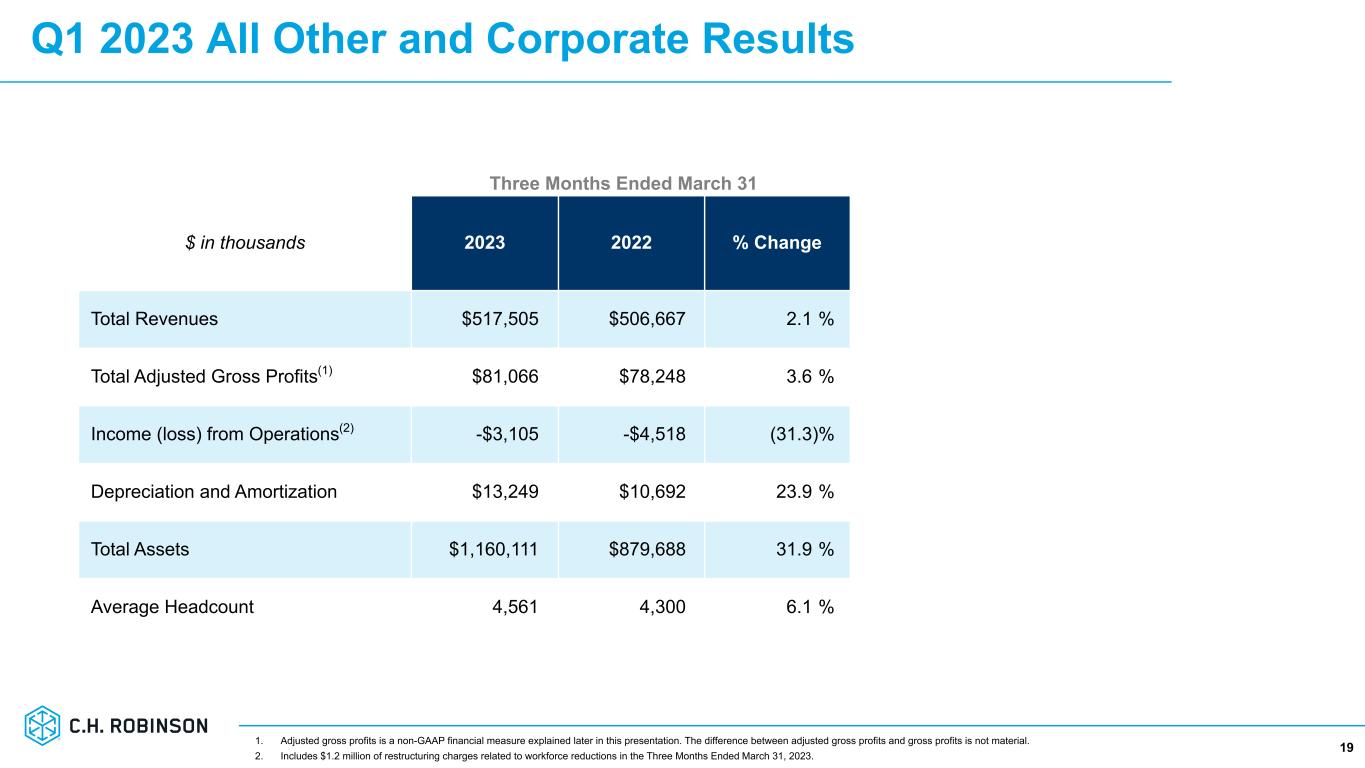
Q1 2023 All Other and Corporate Results 191. Adjusted gross profits is a non-GAAP financial measure explained later in this presentation. The difference between adjusted gross profits and gross profits is not material. 2. Includes $1.2 million of restructuring charges related to workforce reductions in the Three Months Ended March 31, 2023. Three Months Ended March 31 $ in thousands 2023 2022 % Change Total Revenues $517,505 $506,667 2.1 % Total Adjusted Gross Profits(1) $81,066 $78,248 3.6 % Income (loss) from Operations(2) -$3,105 -$4,518 (31.3) % Depreciation and Amortization $13,249 $10,692 23.9 % Total Assets $1,160,111 $879,688 31.9 % Average Headcount 4,561 4,300 6.1 %
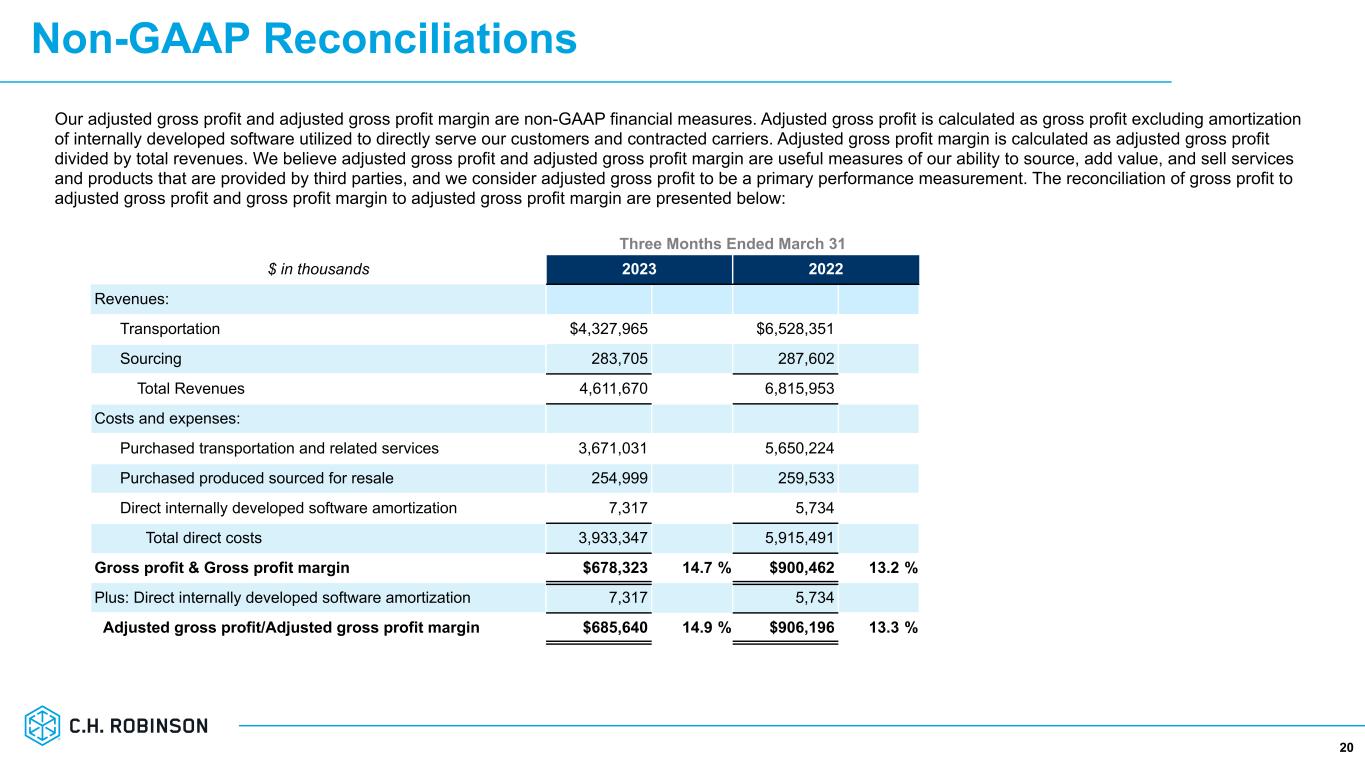
20 Our adjusted gross profit and adjusted gross profit margin are non-GAAP financial measures. Adjusted gross profit is calculated as gross profit excluding amortization of internally developed software utilized to directly serve our customers and contracted carriers. Adjusted gross profit margin is calculated as adjusted gross profit divided by total revenues. We believe adjusted gross profit and adjusted gross profit margin are useful measures of our ability to source, add value, and sell services and products that are provided by third parties, and we consider adjusted gross profit to be a primary performance measurement. The reconciliation of gross profit to adjusted gross profit and gross profit margin to adjusted gross profit margin are presented below: Three Months Ended March 31 $ in thousands 2023 2022 Revenues: Transportation $4,327,965 $6,528,351 Sourcing 283,705 287,602 Total Revenues 4,611,670 6,815,953 Costs and expenses: Purchased transportation and related services 3,671,031 5,650,224 Purchased produced sourced for resale 254,999 259,533 Direct internally developed software amortization 7,317 5,734 Total direct costs 3,933,347 5,915,491 Gross profit & Gross profit margin $678,323 14.7 % $900,462 13.2 % Plus: Direct internally developed software amortization 7,317 5,734 Adjusted gross profit/Adjusted gross profit margin $685,640 14.9 % $906,196 13.3 % Non-GAAP Reconciliations
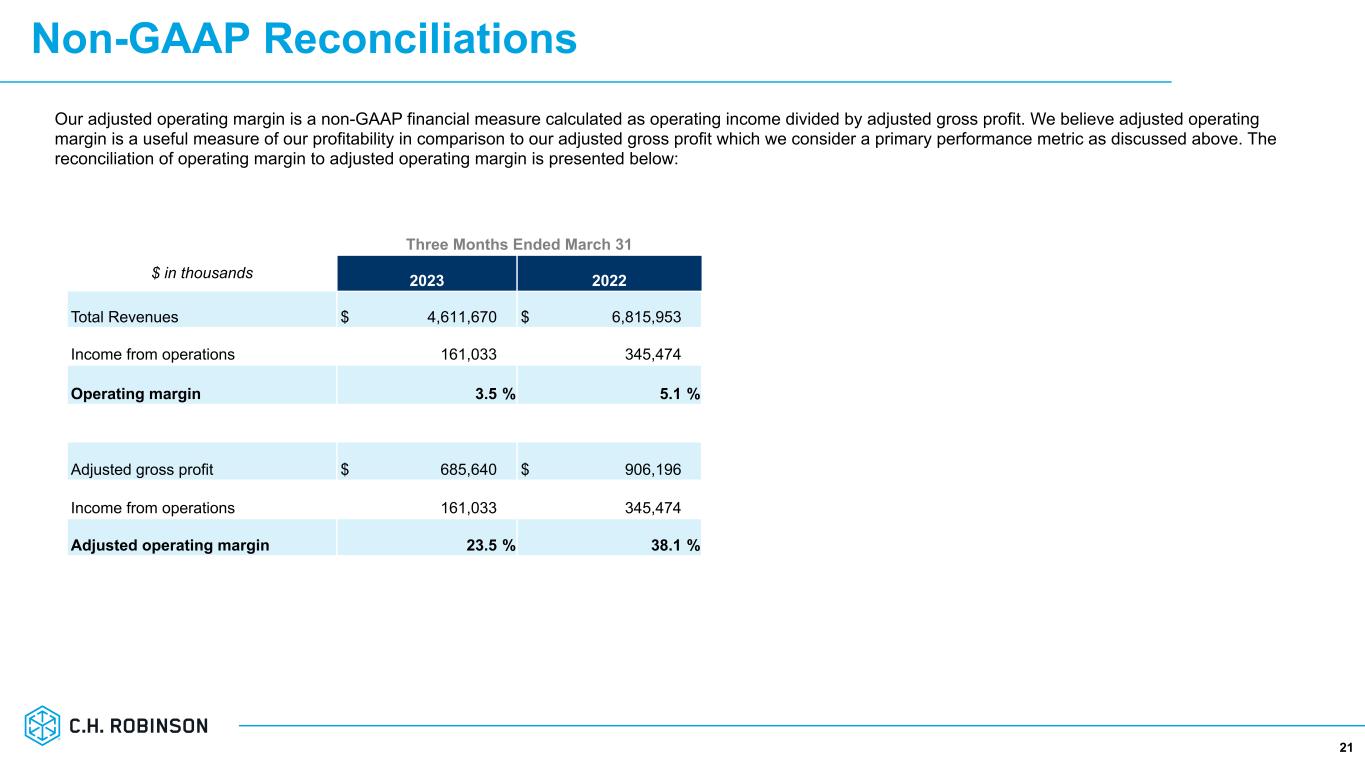
Non-GAAP Reconciliations 21 Our adjusted operating margin is a non-GAAP financial measure calculated as operating income divided by adjusted gross profit. We believe adjusted operating margin is a useful measure of our profitability in comparison to our adjusted gross profit which we consider a primary performance metric as discussed above. The reconciliation of operating margin to adjusted operating margin is presented below: Three Months Ended March 31 $ in thousands 2023 2022 Total Revenues $ 4,611,670 $ 6,815,953 Income from operations 161,033 345,474 Operating margin 3.5 % 5.1 % Adjusted gross profit $ 685,640 $ 906,196 Income from operations 161,033 345,474 Adjusted operating margin 23.5 % 38.1 %

Non-GAAP Reconciliations 22 Our adjusted income (loss) from operations and adjusted net income per share (diluted) are non-GAAP financial measures. Adjusted income (loss) from operations and adjusted net income per share (diluted) is calculated as income (loss) from operations and net income per share (diluted) excluding the impact of restructuring and related costs. We believe that these measures provide useful information to investors and include them within our internal reporting to our chief operating decision maker. Accordingly, the discussion of our results of operations includes discussion on the changes in our adjusted income (loss) from operations and adjusted net income per share (diluted). The reconciliation of income (loss) from operations and net income per share (diluted) to adjusted income (loss) from operations and adjusted net income per share (diluted) is presented below (in thousands except per share data): Three Months Ended March 31, 2023 NAST Global Forwarding All Other and Corporate Consolidated Income (loss) from operations $ 134,022 $ 30,116 $ (3,105) $ 161,033 Severance 610 1,513 1,015 3,138 Other personnel expenses 219 25 216 460 Other selling, general, and administrative — 124 — 124 Total restructuring and related costs(1) 829 1,662 1,231 3,722 Adjusted income (loss) from operations $ 134,851 $ 31,778 $ (1,874) $ 164,755 Net income per share (diluted) $ 0.96 Restructuring and associated costs(1) 0.02 Adjusted net income per share (diluted) $ 0.98 1. In Q1 2023, we incurred restructuring expenses of $3.6 million related to workforce reductions and $0.1 million of other charges.

23 Thank you INVESTOR RELATIONS: Chuck Ives 952-683-2508 chuck.ives@chrobinson.com


