2024 INVESTOR DAY January 29, 2025 Q4 2024 Earnings Presentation

Safe Harbor Statement Except for the historical information contained herein, the matters set forth in this presentation are forward-looking statements that represent our expectations, beliefs, intentions or strategies concerning future events. These forward-looking statements are subject to certain risks and uncertainties that could cause actual results to differ materially from our historical experience or our present expectations, including, but not limited to, factors such as changes in economic conditions, including uncertain consumer demand; changes in market demand and pressures on the pricing for our services; fuel price increases or decreases, or fuel shortages; competition and growth rates within the global logistics industry that could adversely impact our profitability and achieving our long-term growth targets; freight levels and increasing costs and availability of truck capacity or alternative means of transporting freight; risks associated with seasonal changes or significant disruptions in the transportation industry; risks associated with identifying and completing suitable acquisitions; our dependence on and changes in relationships with existing contracted truck, rail, ocean, and air carriers; risks associated with the loss of significant customers; risks associated with reliance on technology to operate our business; cyber-security related risks; our ability to staff and retain employees; risks associated with operations outside of the U.S.; our ability to successfully integrate the operations of acquired companies with our historic operations or efficiently managing divestitures; climate change related risks; risks associated with our indebtedness; risks associated with interest rates; risks associated with litigation, including contingent auto liability and insurance coverage; risks associated with the potential impact of changes in government regulations including environmental-related regulations; risks associated with the changes to income tax regulations; risks associated with the produce industry, including food safety and contamination issues; the impact of changes in political and governmental conditions; changes to our capital structure; changes due to catastrophic events; risks associated with the usage of artificial intelligence technologies; risks associated with cybersecurity events; and other risks and uncertainties detailed in our Annual and Quarterly Reports. Any forward-looking statement speaks only as of the date on which such statement is made, and we undertake no obligation to update such statement to reflect events or circumstances arising after such date. 2©2025 C.H. Robinson Worldwide, Inc. All Rights Reserved.
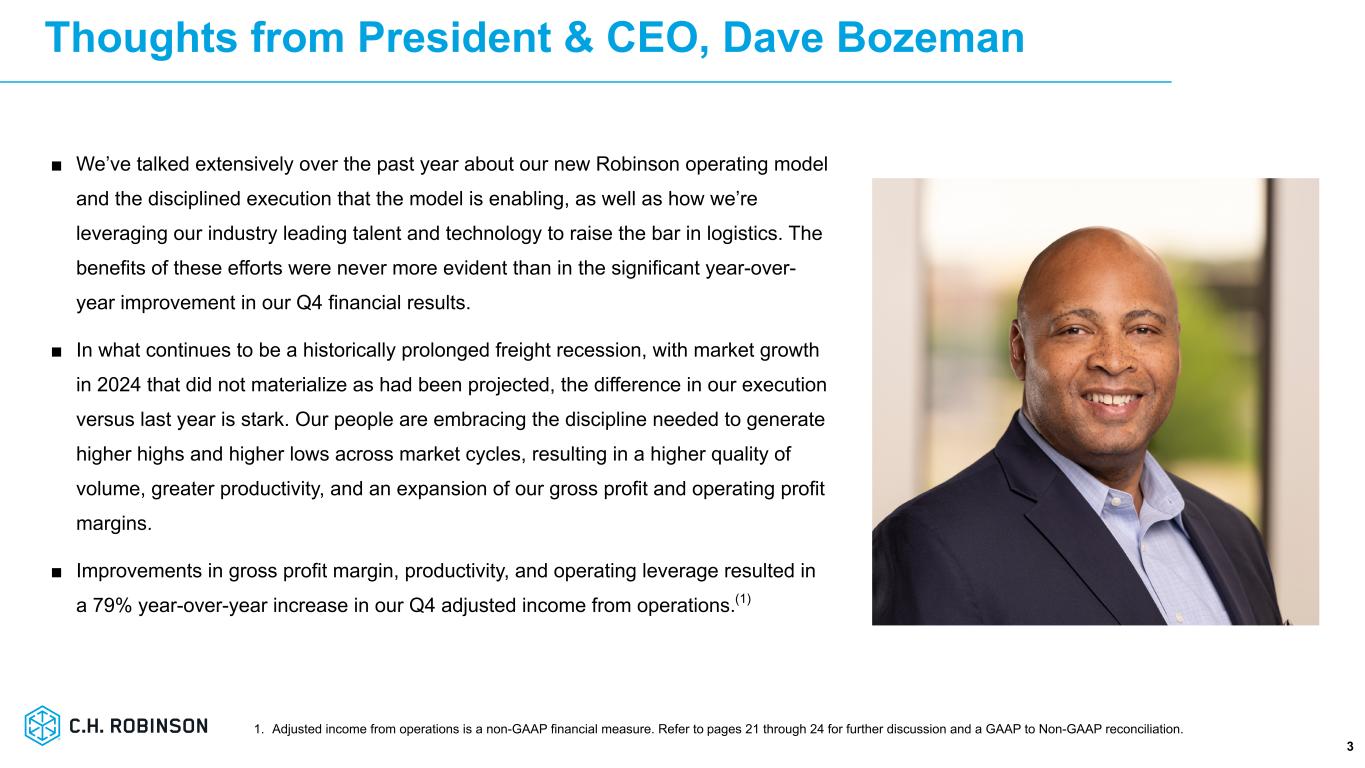
Thoughts from President & CEO, Dave Bozeman 3 ■ We’ve talked extensively over the past year about our new Robinson operating model and the disciplined execution that the model is enabling, as well as how we’re leveraging our industry leading talent and technology to raise the bar in logistics. The benefits of these efforts were never more evident than in the significant year-over- year improvement in our Q4 financial results. ■ In what continues to be a historically prolonged freight recession, with market growth in 2024 that did not materialize as had been projected, the difference in our execution versus last year is stark. Our people are embracing the discipline needed to generate higher highs and higher lows across market cycles, resulting in a higher quality of volume, greater productivity, and an expansion of our gross profit and operating profit margins. ■ Improvements in gross profit margin, productivity, and operating leverage resulted in a 79% year-over-year increase in our Q4 adjusted income from operations.(1) 1. Adjusted income from operations is a non-GAAP financial measure. Refer to pages 21 through 24 for further discussion and a GAAP to Non-GAAP reconciliation.
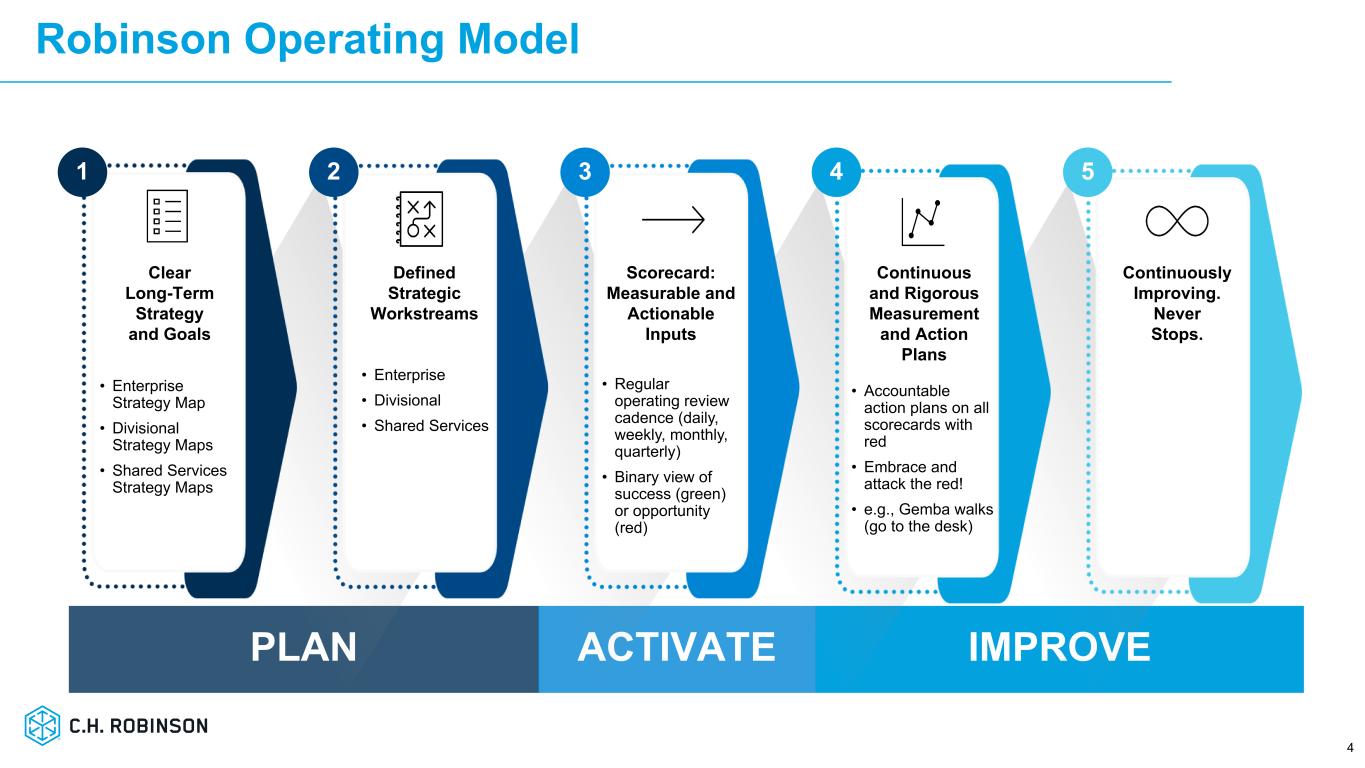
IMPROVEPLAN ACTIVATE • Enterprise Strategy Map • Divisional Strategy Maps • Shared Services Strategy Maps • Regular operating review cadence (daily, weekly, monthly, quarterly) • Binary view of success (green) or opportunity (red) • Enterprise • Divisional • Shared Services • Accountable action plans on all scorecards with red • Embrace and attack the red! • e.g., Gemba walks (go to the desk) Scorecard: Measurable and Actionable Inputs Defined Strategic Workstreams Clear Long-Term Strategy and Goals Continuous and Rigorous Measurement and Action Plans Continuously Improving. Never Stops. 1 2 3 4 5 Robinson Operating Model 4

Q4 Highlights 5 ■ Q4 NAST truckload and LTL AGP/shipment improved Y/Y and sequentially, driving NAST adjusted income from operations up 40% Y/Y(1) ■ Q4 ocean and air volume and AGP/shipment grew Y/Y and Global Forwarding adjusted income from operations increased 197% Y/Y(1) ■ Both NAST and Global Forwarding delivered compounded productivity growth of 30% or more over a two-year period ■ Focused on deploying our new operating model, providing best- in-class service to our customers and carriers, gaining profitable share in targeted market segments, streamlining our processes, applying Lean principles and leveraging generative AI to drive out waste and optimize our costs, and ensuring readiness for the eventual freight market rebound, with a disciplined operating model that responsibly grows market share, decouples headcount growth from volume growth and drives operating leverage $4.2B Total Revenues -0.9% Y/Y $685M Adj. Gross Profits(1) +10.7% Y/Y $184M Income from Operations +71.1% Y/Y $1.22 Net Income/Share +369.2% Y/Y Q4 2024 1. Adjusted gross profits and adjusted income from operations are non-GAAP financial measures. Refer to pages 21 through 24 for further discussion and a GAAP to Non-GAAP reconciliation.

All Other & Corporate ■ Robinson Fresh integrated supply chain solutions generating increased AGP ■ Managed Solutions Q4 AGP down 2.5% Y/Y ■ Other Surface Transportation AGP declined 20.1% Y/Y Global Forwarding (GF) ■ Ongoing conflict in the Red Sea strained ocean capacity and drove rates higher Y/Y ■ Ocean volume grew 3.5% Y/Y & air tonnage grew 15.5% Y/Y ■ Continuing to diversify our trade lane and industry vertical exposure North American Surface Transportation (NAST) ■ Adjusted gross profit (AGP) per load/order increased Y/Y in both TL and LTL ■ NAST volume performance outpaced the market indices for the 7th quarter in a row ■ Significant opportunities for profitable growth remain in a highly fragmented market ■ Focused on initiatives that improve the customer and carrier experience and lower our cost to serve ■ Productivity improvements are being driven by removing waste, increasing automation and Gen AI Complementary Global Suite of Services 6 Q4 2024 Adjusted Gross Profits(2) +6.2% Y/Y +1.2% Y/Y +25.6% Y/Y 1. Measured over trailing twelve months. 2. Adjusted gross profits is a non-GAAP financial measure explained later in this presentation. The difference between adjusted gross profits and gross profits is not material. Over half of total revenues is garnered from customers to whom we provide both surface transportation and global forwarding services.(1)
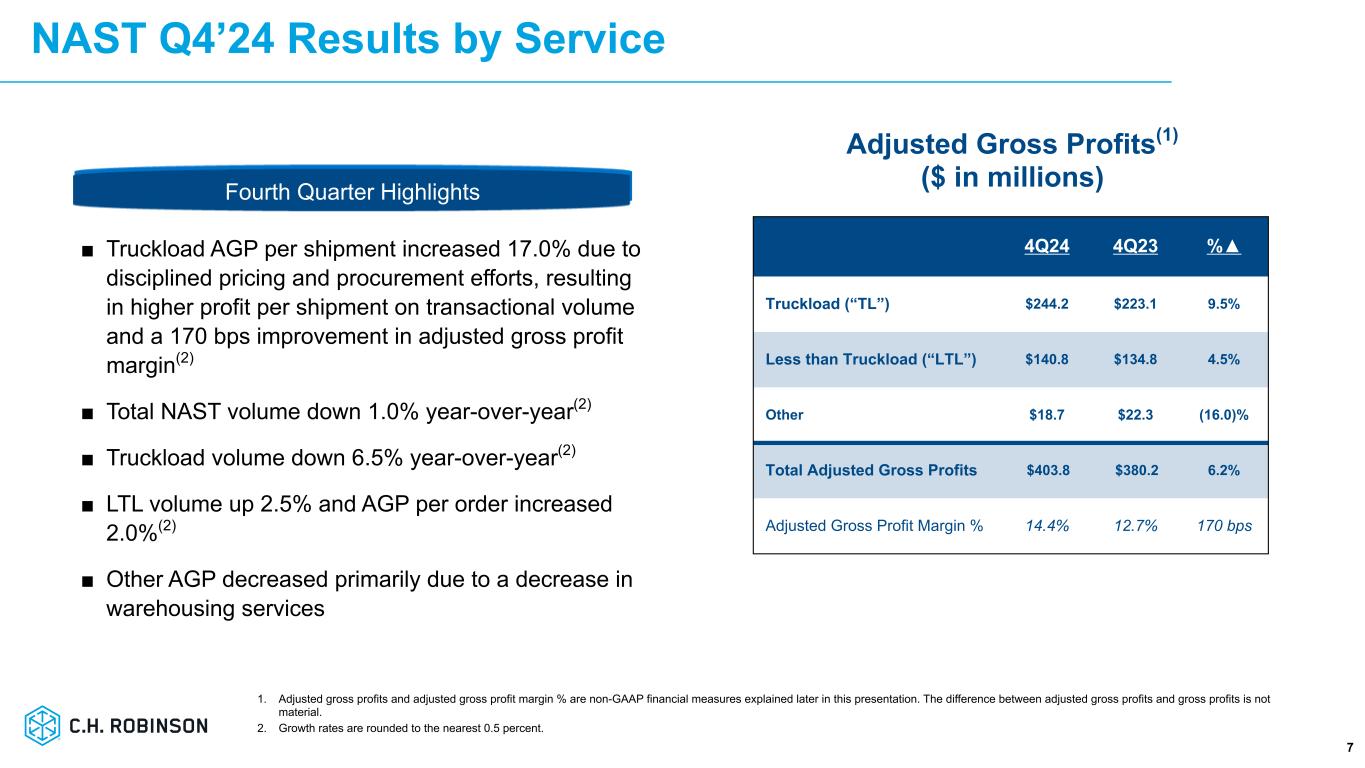
NAST Q4’24 Results by Service 7 ■ Truckload AGP per shipment increased 17.0% due to disciplined pricing and procurement efforts, resulting in higher profit per shipment on transactional volume and a 170 bps improvement in adjusted gross profit margin(2) ■ Total NAST volume down 1.0% year-over-year(2) ■ Truckload volume down 6.5% year-over-year(2) ■ LTL volume up 2.5% and AGP per order increased 2.0%(2) ■ Other AGP decreased primarily due to a decrease in warehousing services 4Q24 4Q23 %▲ Truckload (“TL”) $244.2 $223.1 9.5% Less than Truckload (“LTL”) $140.8 $134.8 4.5% Other $18.7 $22.3 (16.0)% Total Adjusted Gross Profits $403.8 $380.2 6.2% Adjusted Gross Profit Margin % 14.4% 12.7% 170 bps Adjusted Gross Profits(1) ($ in millions) 1. Adjusted gross profits and adjusted gross profit margin % are non-GAAP financial measures explained later in this presentation. The difference between adjusted gross profits and gross profits is not material. 2. Growth rates are rounded to the nearest 0.5 percent. Fourth Quarter Highlights
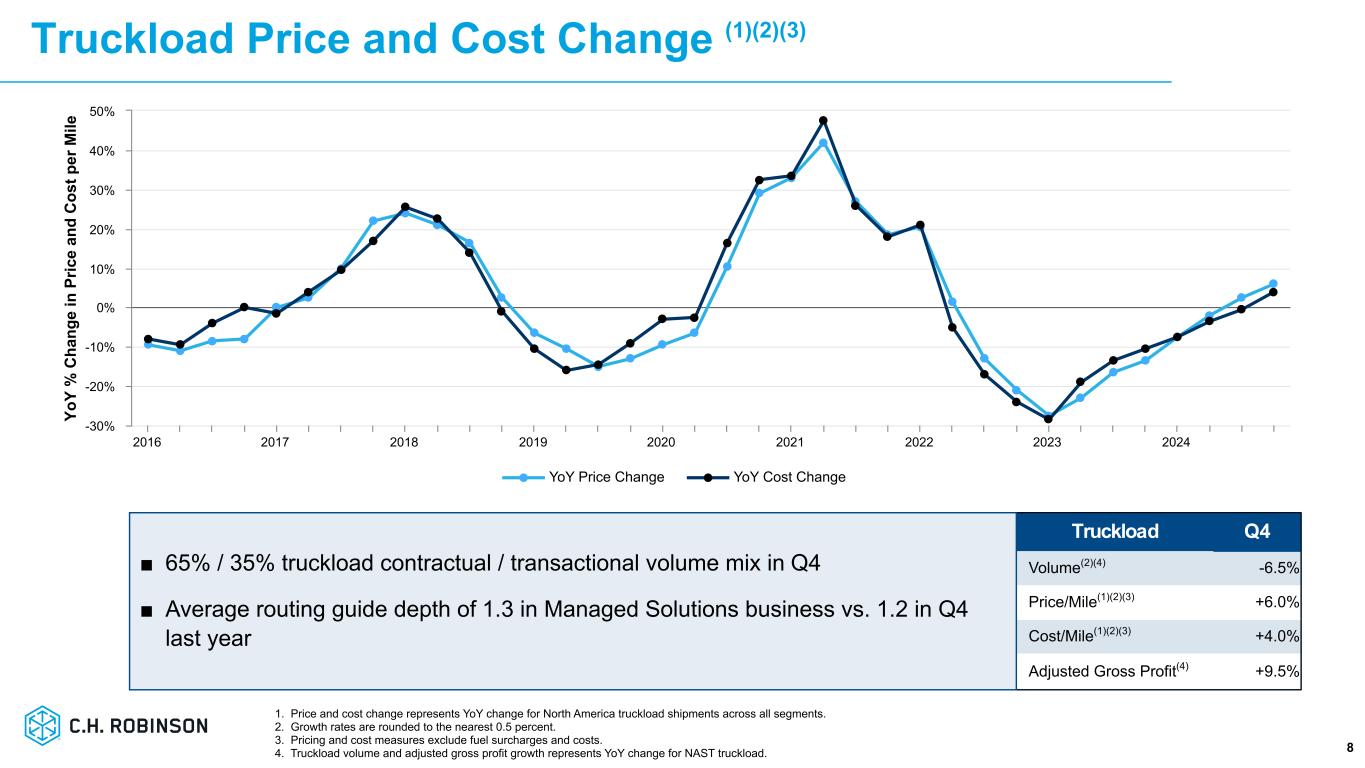
Truckload Price and Cost Change (1)(2)(3) 8 Truckload Q4 Volume(2)(4) -6.5 % Price/Mile(1)(2)(3) +6.0 % Cost/Mile(1)(2)(3) +4.0 % Adjusted Gross Profit(4) +9.5 % 1. Price and cost change represents YoY change for North America truckload shipments across all segments. 2. Growth rates are rounded to the nearest 0.5 percent. 3. Pricing and cost measures exclude fuel surcharges and costs. 4. Truckload volume and adjusted gross profit growth represents YoY change for NAST truckload. ■ 65% / 35% truckload contractual / transactional volume mix in Q4 ■ Average routing guide depth of 1.3 in Managed Solutions business vs. 1.2 in Q4 last year Yo Y % C ha ng e in P ric e an d C os t p er M ile YoY Price Change YoY Cost Change 2016 2017 2018 2019 2020 2021 2022 2023 2024 -30% -20% -10% 0% 10% 20% 30% 40% 50%

Truckload AGP $ per Shipment Trend 9 ■ Disciplined pricing and capacity procurement efforts resulted in improved optimization of volume and AGP per truckload.(1) ■ Increasing adoption of digital brokerage offering is improving our cost of hire. N A ST A dj us te d G ro ss P ro fit $ p er T ru ck lo ad Sh ip m en t N A ST A djusted G ross Profit M argin % NAST Adjusted Gross Profit $ per Truckload Shipment (left axis) NAST Adjusted Gross Profit Margin % (right axis) Average NAST AGP $ per Truckload Shipment (left axis) 2015 2016 2017 2018 2019 2020 2021 2022 2023 2024 11% 12% 13% 14% 15% 16% 17% 18% 19% 20% 1. Adjusted gross profits is a non-GAAP financial measure explained later in this presentation. The difference between adjusted gross profits and gross profits is not material.
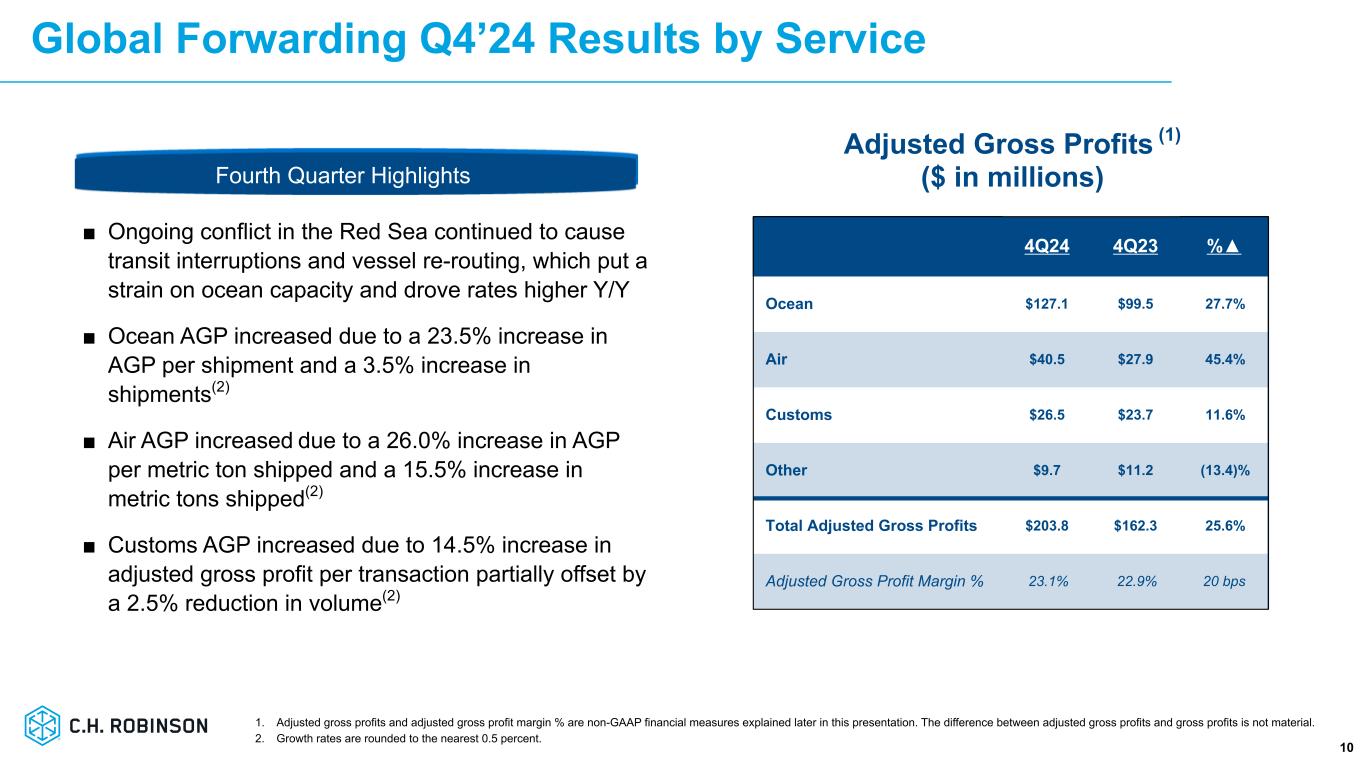
Global Forwarding Q4’24 Results by Service 10 4Q24 4Q23 %▲ Ocean $127.1 $99.5 27.7% Air $40.5 $27.9 45.4% Customs $26.5 $23.7 11.6% Other $9.7 $11.2 (13.4)% Total Adjusted Gross Profits $203.8 $162.3 25.6% Adjusted Gross Profit Margin % 23.1% 22.9% 20 bps Adjusted Gross Profits (1) ($ in millions) ■ Ongoing conflict in the Red Sea continued to cause transit interruptions and vessel re-routing, which put a strain on ocean capacity and drove rates higher Y/Y ■ Ocean AGP increased due to a 23.5% increase in AGP per shipment and a 3.5% increase in shipments(2) ■ Air AGP increased due to a 26.0% increase in AGP per metric ton shipped and a 15.5% increase in metric tons shipped(2) ■ Customs AGP increased due to 14.5% increase in adjusted gross profit per transaction partially offset by a 2.5% reduction in volume(2) 1. Adjusted gross profits and adjusted gross profit margin % are non-GAAP financial measures explained later in this presentation. The difference between adjusted gross profits and gross profits is not material. 2. Growth rates are rounded to the nearest 0.5 percent. Fourth Quarter Highlights

All Other & Corporate Q4’24 Results 11 Robinson Fresh ■ Increased AGP due to an increase in integrated supply chain solutions for retail and foodservice customers Managed Solutions ■ Decline in AGP due to lower transaction volume Other Surface Transportation ■ Decline in AGP primarily driven by a 19.4% decrease in Europe truckload AGP 4Q24 4Q23 %▲ Robinson Fresh $36.0 $31.1 15.7% Managed Solutions $28.1 $28.8 (2.5)% Other Surface Transportation $12.9 $16.2 (20.1)% Total $77.1 $76.1 1.2% Adjusted Gross Profits (1) ($ in millions) 1. Adjusted gross profits is a non-GAAP financial measure explained later in this presentation. The difference between adjusted gross profits and gross profits is not material. Fourth Quarter Highlights
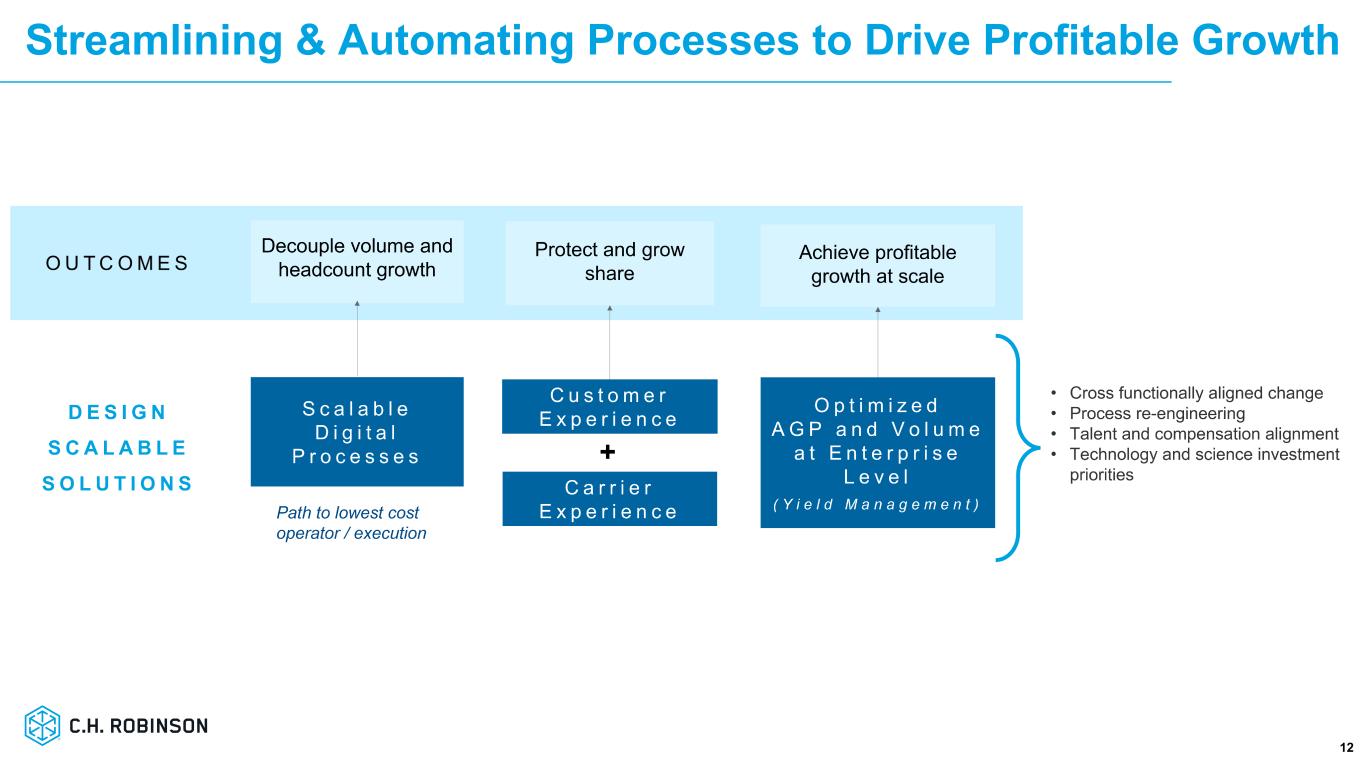
Streamlining & Automating Processes to Drive Profitable Growth 12 12
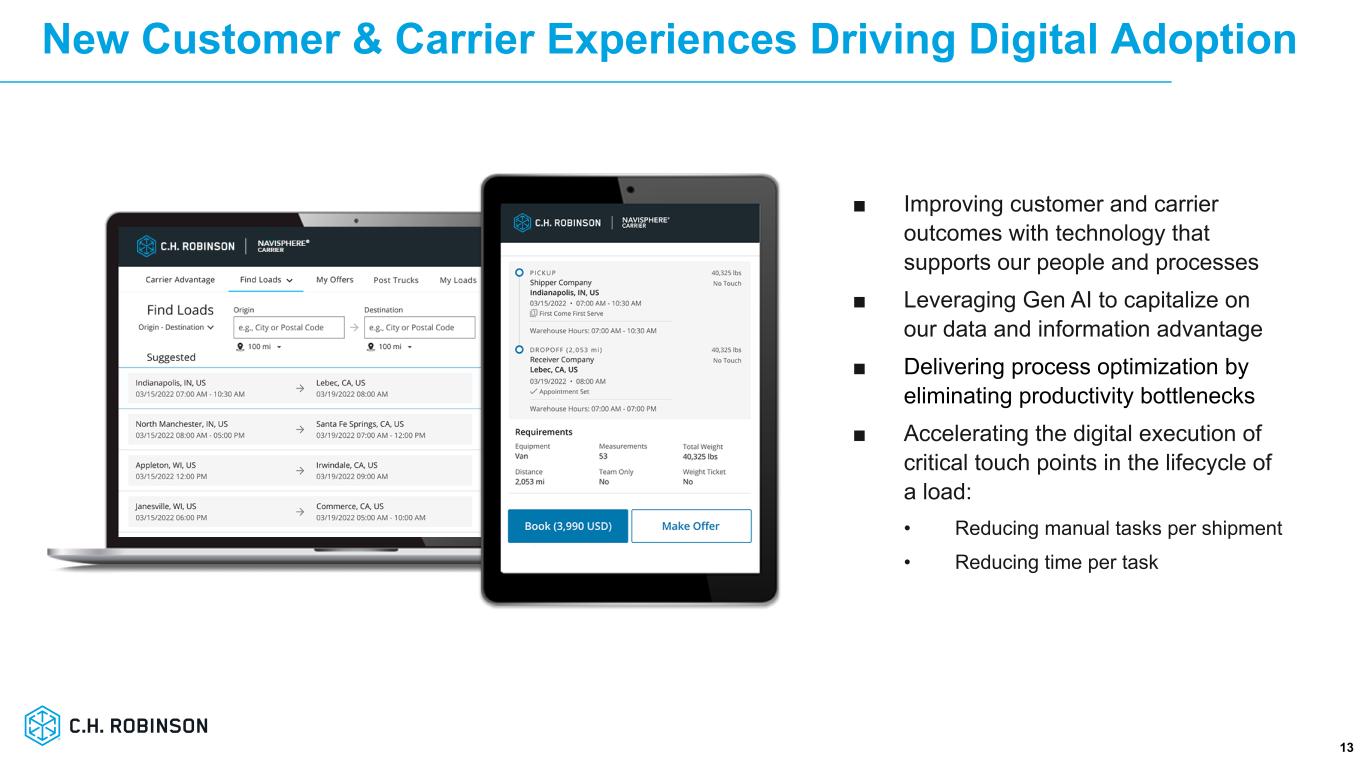
New Customer & Carrier Experiences Driving Digital Adoption 13 ■ Improving customer and carrier outcomes with technology that supports our people and processes ■ Leveraging Gen AI to capitalize on our data and information advantage ■ Delivering process optimization by eliminating productivity bottlenecks ■ Accelerating the digital execution of critical touch points in the lifecycle of a load: • Reducing manual tasks per shipment • Reducing time per task 13
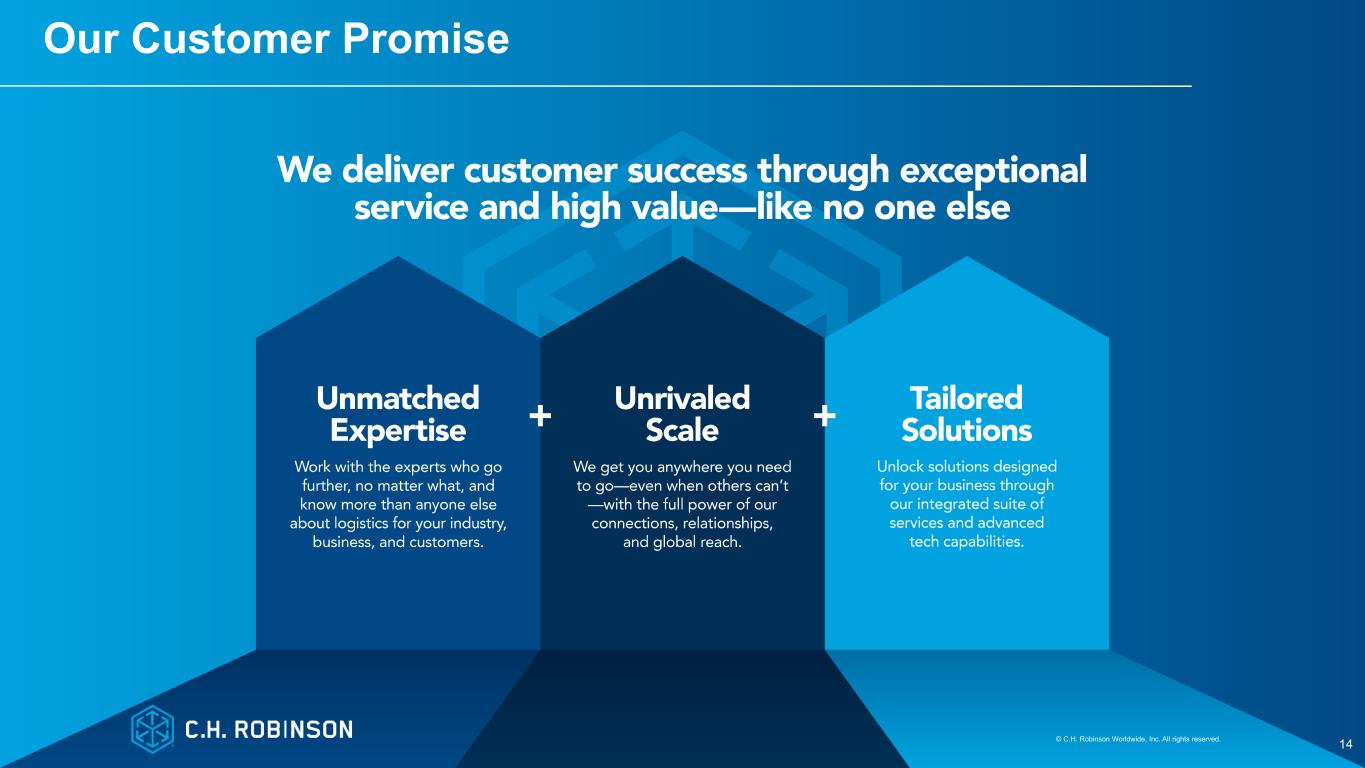
© C.H. Robinson Worldwide, Inc. All rights reserved. 14 Our Customer Promise

Capital Allocation Priorities: Balanced and Opportunistic 15 Cash Flow from Operations & Capital Distribution ($M) ■ $83 million of cash returned to shareholders in Q4 2024 ■ Q4 2024 capital distribution increased 12% Y/Y ■ More than 25 years of annually increasing dividends, on a per share basis ■ 80K shares deemed repurchased, upon surrender of shares to satisfy tax withholding, at an average price of $104.13 ■ The cost and price of ocean transportation declined sequentially in Q4 2024, resulting in a sequential decrease of net operating working capital and higher cash from operations. ■ We'll continue to manage our capital structure to maintain our investment grade credit rating.
2024 INVESTOR DAY Appendix

Q4 2024 Transportation Results(1) 17 Three Months Ended December 31 Twelve Months Ended December 31 $ in thousands 2024 2023 % Change 2024 2023 % Change Total Revenues $ 3,870,927 $ 3,930,461 (1.5) % $ 16,353,745 $ 16,372,660 (0.1) % Total Adjusted Gross Profits(2) $ 652,354 $ 590,988 10.4 % $ 2,633,810 $ 2,486,636 5.9 % Adjusted Gross Profit Margin % 16.9% 15.0% 190 bps 16.1% 15.2% 90 bps Transportation Adjusted Gross Profit Margin % 2015 2016 2017 2018 2019 2020 2021 2022 2023 2024 Q1 16.8% 19.7% 17.3% 16.4% 18.6% 15.3% 14.9% 13.5% 15.2% 15.4% Q2 17.5% 19.3% 16.2% 16.2% 18.3% 17.5% 13.8% 15.4% 15.5% 15.8% Q3 18.4% 17.6% 16.4% 16.6% 16.9% 14.4% 13.7% 15.1% 15.1% 16.4% Q4 19.0% 17.2% 16.6% 17.7% 15.6% 14.3% 13.3% 15.5% 15.0% 16.9% Total 17.9% 18.4% 16.6% 16.7% 17.3% 15.3% 13.8% 14.8% 15.2% 16.1% 1. Includes results across all segments. 2. Adjusted gross profits and adjusted gross profit margin % are non-GAAP financial measures explained later in this presentation. The difference between adjusted gross profits and gross profits is not material.

Q4 2024 NAST Results 18 1. Adjusted gross profits and adjusted gross profit margin % are non-GAAP financial measures explained later in this presentation. The difference between adjusted gross profits and gross profits is not material. 2. Includes $1.8 million of restructuring charges in the Three Months Ended December 31, 2024 mainly related to workforce reductions and $17.1 million of restructuring charges in the Twelve Months Ended December 31, 2024 related to workforce reductions, impairment of internally developed software, and charges to reduce our facilities footprint. Includes $1.1 million in the Twelve Months Ended December 31, 2023 mainly related to workforce reductions. Three Months Ended December 31 Twelve Months Ended December 31, $ in thousands 2024 2023 % Change 2024 2023 % Change Total Revenues $ 2,802,700 $ 3,000,650 (6.6) % $ 11,727,539 $ 12,471,075 (6.0) % Total Adjusted Gross Profits(1) $ 403,764 $ 380,157 6.2 % $ 1,641,195 $ 1,593,854 3.0 % Adjusted Gross Profit Margin % 14.4% 12.7% 170 bps 14.0% 12.8% 120 bps Income from Operations(2) $ 132,528 $ 95,958 38.1 % $ 531,292 $ 459,960 15.5 % Adjusted Operating Margin % 32.8% 25.2% 760 bps 32.4% 28.9% 350 bps Depreciation and Amortization $ 4,891 $ 5,638 (13.2) % $ 20,670 $ 23,027 (10.2) % Total Assets $ 2,874,701 $ 3,008,459 (4.4) % $ 2,874,701 $ 3,008,459 (4.4) % Average Headcount 5,348 6,103 (12.4) % 5,696 6,469 (11.9) %
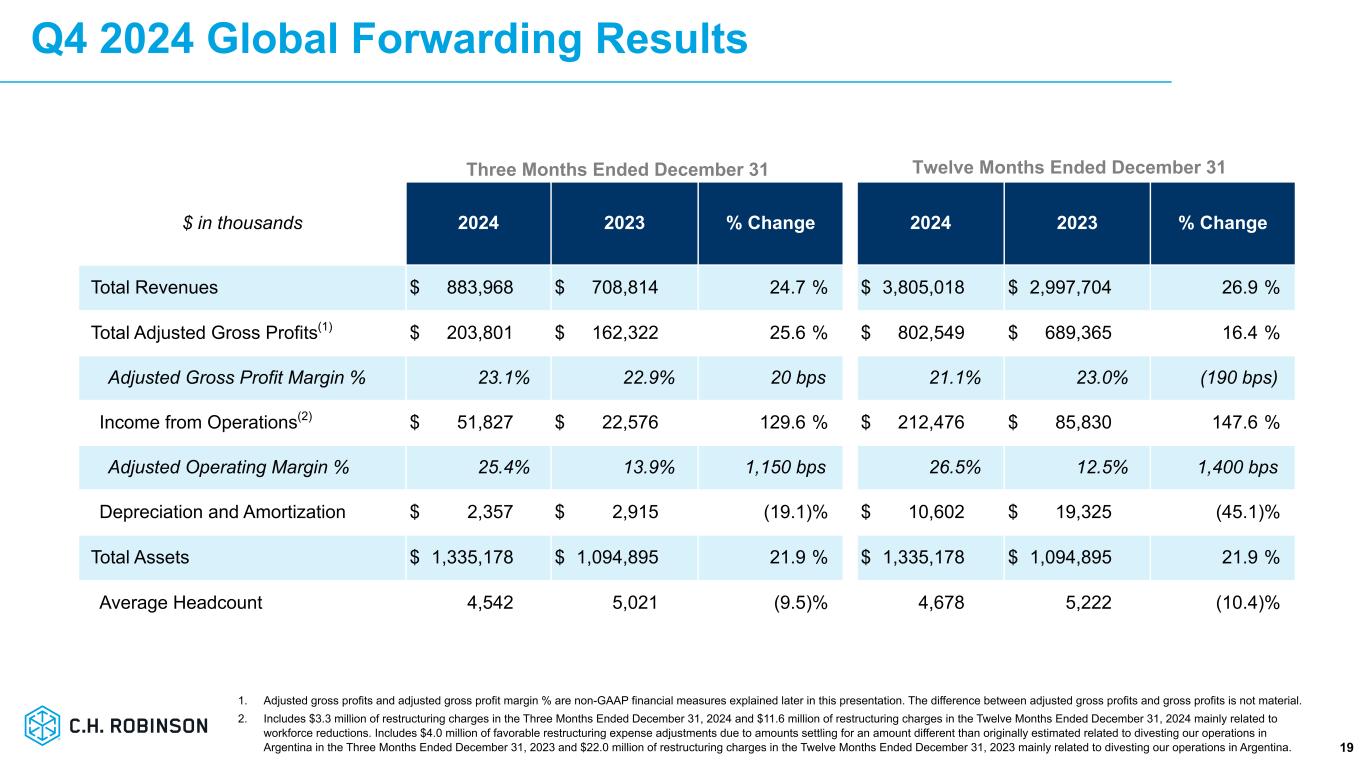
Q4 2024 Global Forwarding Results 19 1. Adjusted gross profits and adjusted gross profit margin % are non-GAAP financial measures explained later in this presentation. The difference between adjusted gross profits and gross profits is not material. 2. Includes $3.3 million of restructuring charges in the Three Months Ended December 31, 2024 and $11.6 million of restructuring charges in the Twelve Months Ended December 31, 2024 mainly related to workforce reductions. Includes $4.0 million of favorable restructuring expense adjustments due to amounts settling for an amount different than originally estimated related to divesting our operations in Argentina in the Three Months Ended December 31, 2023 and $22.0 million of restructuring charges in the Twelve Months Ended December 31, 2023 mainly related to divesting our operations in Argentina. Three Months Ended December 31 Twelve Months Ended December 31 $ in thousands 2024 2023 % Change 2024 2023 % Change Total Revenues $ 883,968 $ 708,814 24.7 % $ 3,805,018 $ 2,997,704 26.9 % Total Adjusted Gross Profits(1) $ 203,801 $ 162,322 25.6 % $ 802,549 $ 689,365 16.4 % Adjusted Gross Profit Margin % 23.1% 22.9% 20 bps 21.1% 23.0% (190 bps) Income from Operations(2) $ 51,827 $ 22,576 129.6 % $ 212,476 $ 85,830 147.6 % Adjusted Operating Margin % 25.4% 13.9% 1,150 bps 26.5% 12.5% 1,400 bps Depreciation and Amortization $ 2,357 $ 2,915 (19.1) % $ 10,602 $ 19,325 (45.1) % Total Assets $ 1,335,178 $ 1,094,895 21.9 % $ 1,335,178 $ 1,094,895 21.9 % Average Headcount 4,542 5,021 (9.5) % 4,678 5,222 (10.4) %
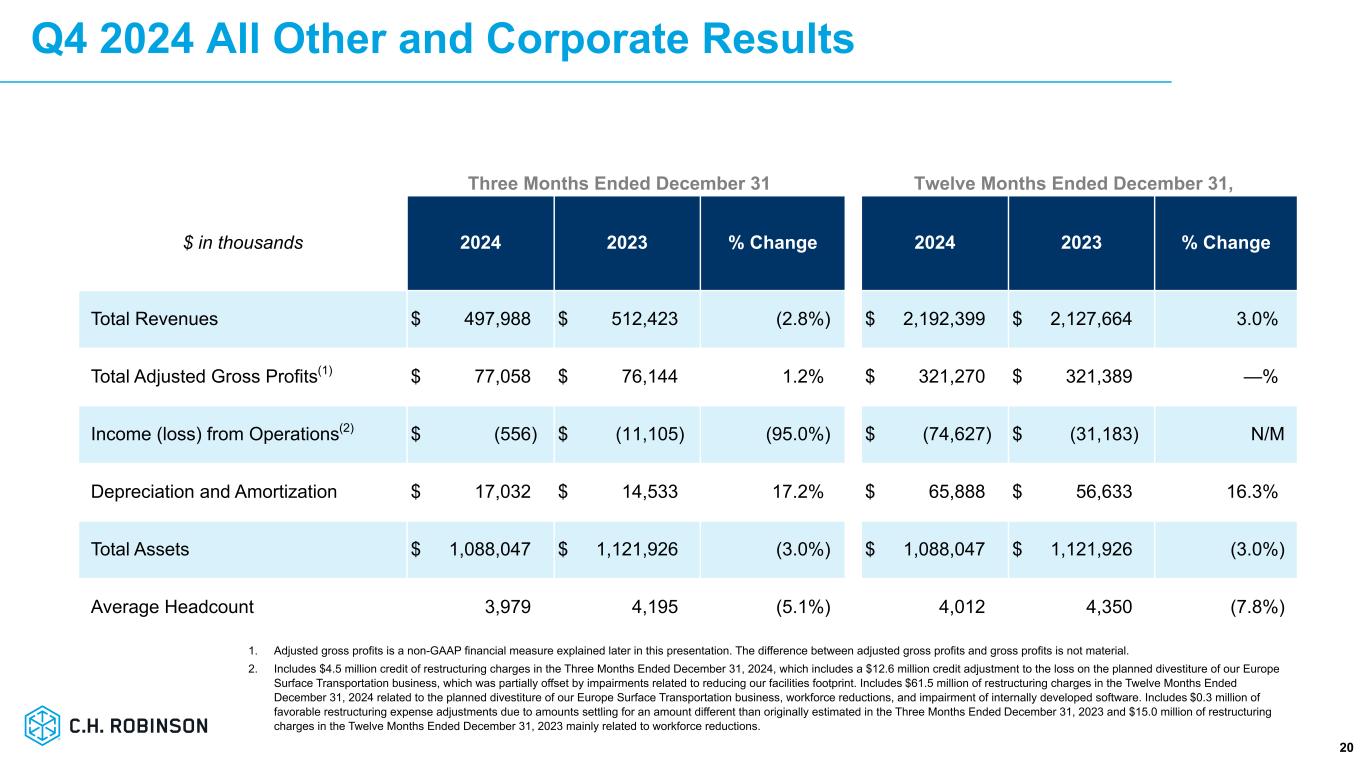
Q4 2024 All Other and Corporate Results 20 1. Adjusted gross profits is a non-GAAP financial measure explained later in this presentation. The difference between adjusted gross profits and gross profits is not material. 2. Includes $4.5 million credit of restructuring charges in the Three Months Ended December 31, 2024, which includes a $12.6 million credit adjustment to the loss on the planned divestiture of our Europe Surface Transportation business, which was partially offset by impairments related to reducing our facilities footprint. Includes $61.5 million of restructuring charges in the Twelve Months Ended December 31, 2024 related to the planned divestiture of our Europe Surface Transportation business, workforce reductions, and impairment of internally developed software. Includes $0.3 million of favorable restructuring expense adjustments due to amounts settling for an amount different than originally estimated in the Three Months Ended December 31, 2023 and $15.0 million of restructuring charges in the Twelve Months Ended December 31, 2023 mainly related to workforce reductions. Three Months Ended December 31 Twelve Months Ended December 31, $ in thousands 2024 2023 % Change 2024 2023 % Change Total Revenues $ 497,988 $ 512,423 (2.8%) $ 2,192,399 $ 2,127,664 3.0% Total Adjusted Gross Profits(1) $ 77,058 $ 76,144 1.2% $ 321,270 $ 321,389 —% Income (loss) from Operations(2) $ (556) $ (11,105) (95.0%) $ (74,627) $ (31,183) N/M Depreciation and Amortization $ 17,032 $ 14,533 17.2% $ 65,888 $ 56,633 16.3% Total Assets $ 1,088,047 $ 1,121,926 (3.0%) $ 1,088,047 $ 1,121,926 (3.0%) Average Headcount 3,979 4,195 (5.1%) 4,012 4,350 (7.8%)
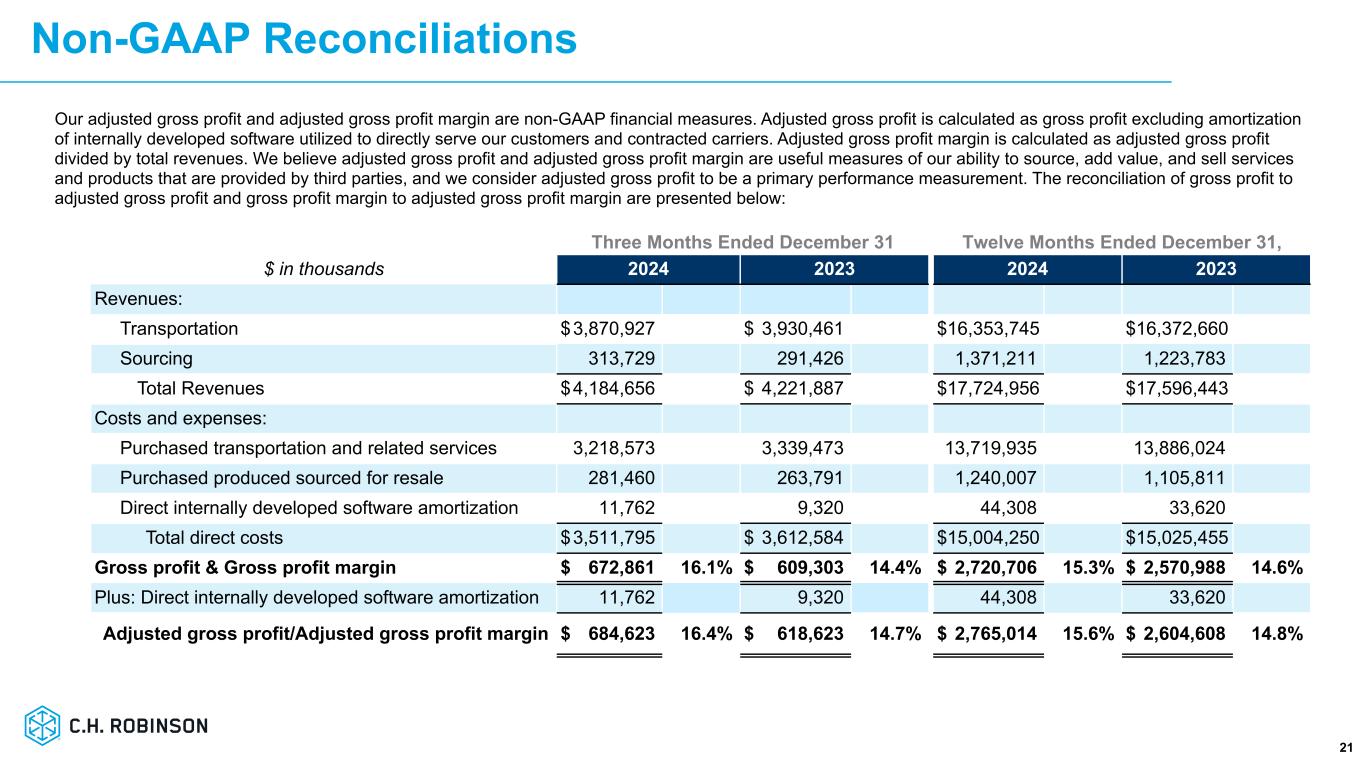
21 Our adjusted gross profit and adjusted gross profit margin are non-GAAP financial measures. Adjusted gross profit is calculated as gross profit excluding amortization of internally developed software utilized to directly serve our customers and contracted carriers. Adjusted gross profit margin is calculated as adjusted gross profit divided by total revenues. We believe adjusted gross profit and adjusted gross profit margin are useful measures of our ability to source, add value, and sell services and products that are provided by third parties, and we consider adjusted gross profit to be a primary performance measurement. The reconciliation of gross profit to adjusted gross profit and gross profit margin to adjusted gross profit margin are presented below: Three Months Ended December 31 Twelve Months Ended December 31, $ in thousands 2024 2023 2024 2023 Revenues: Transportation $ 3,870,927 $ 3,930,461 $ 16,353,745 $ 16,372,660 Sourcing 313,729 291,426 1,371,211 1,223,783 Total Revenues $ 4,184,656 $ 4,221,887 $ 17,724,956 $ 17,596,443 Costs and expenses: Purchased transportation and related services 3,218,573 3,339,473 13,719,935 13,886,024 Purchased produced sourced for resale 281,460 263,791 1,240,007 1,105,811 Direct internally developed software amortization 11,762 9,320 44,308 33,620 Total direct costs $ 3,511,795 $ 3,612,584 $ 15,004,250 $ 15,025,455 Gross profit & Gross profit margin $ 672,861 16.1% $ 609,303 14.4% $ 2,720,706 15.3% $ 2,570,988 14.6% Plus: Direct internally developed software amortization 11,762 9,320 44,308 33,620 Adjusted gross profit/Adjusted gross profit margin $ 684,623 16.4% $ 618,623 14.7% $ 2,765,014 15.6% $ 2,604,608 14.8% Non-GAAP Reconciliations
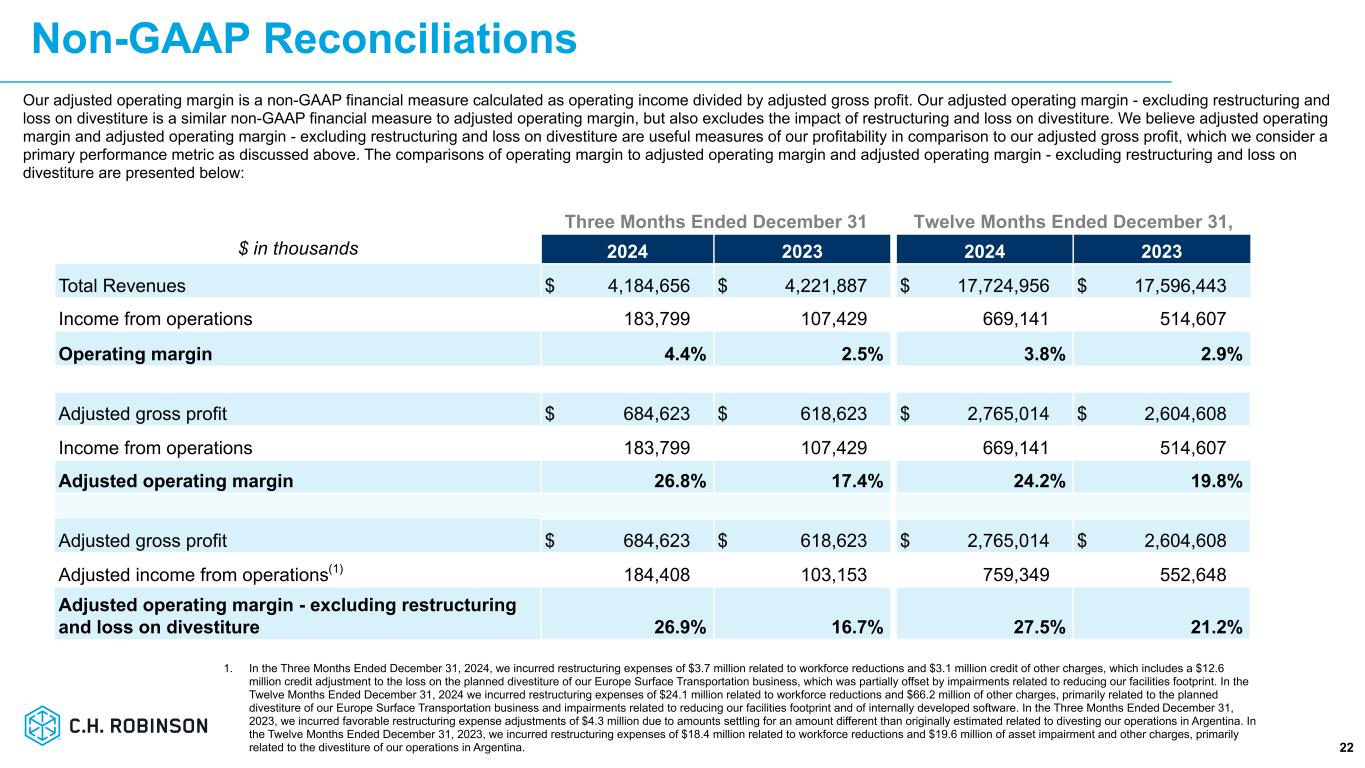
Non-GAAP Reconciliations 22 Our adjusted operating margin is a non-GAAP financial measure calculated as operating income divided by adjusted gross profit. Our adjusted operating margin - excluding restructuring and loss on divestiture is a similar non-GAAP financial measure to adjusted operating margin, but also excludes the impact of restructuring and loss on divestiture. We believe adjusted operating margin and adjusted operating margin - excluding restructuring and loss on divestiture are useful measures of our profitability in comparison to our adjusted gross profit, which we consider a primary performance metric as discussed above. The comparisons of operating margin to adjusted operating margin and adjusted operating margin - excluding restructuring and loss on divestiture are presented below: Three Months Ended December 31 Twelve Months Ended December 31, $ in thousands 2024 2023 2024 2023 Total Revenues $ 4,184,656 $ 4,221,887 $ 17,724,956 $ 17,596,443 Income from operations 183,799 107,429 669,141 514,607 Operating margin 4.4% 2.5% 3.8% 2.9% Adjusted gross profit $ 684,623 $ 618,623 $ 2,765,014 $ 2,604,608 Income from operations 183,799 107,429 669,141 514,607 Adjusted operating margin 26.8% 17.4% 24.2% 19.8% Adjusted gross profit $ 684,623 $ 618,623 $ 2,765,014 $ 2,604,608 Adjusted income from operations(1) 184,408 103,153 759,349 552,648 Adjusted operating margin - excluding restructuring and loss on divestiture 26.9% 16.7% 27.5% 21.2% 1. In the Three Months Ended December 31, 2024, we incurred restructuring expenses of $3.7 million related to workforce reductions and $3.1 million credit of other charges, which includes a $12.6 million credit adjustment to the loss on the planned divestiture of our Europe Surface Transportation business, which was partially offset by impairments related to reducing our facilities footprint. In the Twelve Months Ended December 31, 2024 we incurred restructuring expenses of $24.1 million related to workforce reductions and $66.2 million of other charges, primarily related to the planned divestiture of our Europe Surface Transportation business and impairments related to reducing our facilities footprint and of internally developed software. In the Three Months Ended December 31, 2023, we incurred favorable restructuring expense adjustments of $4.3 million due to amounts settling for an amount different than originally estimated related to divesting our operations in Argentina. In the Twelve Months Ended December 31, 2023, we incurred restructuring expenses of $18.4 million related to workforce reductions and $19.6 million of asset impairment and other charges, primarily related to the divestiture of our operations in Argentina.
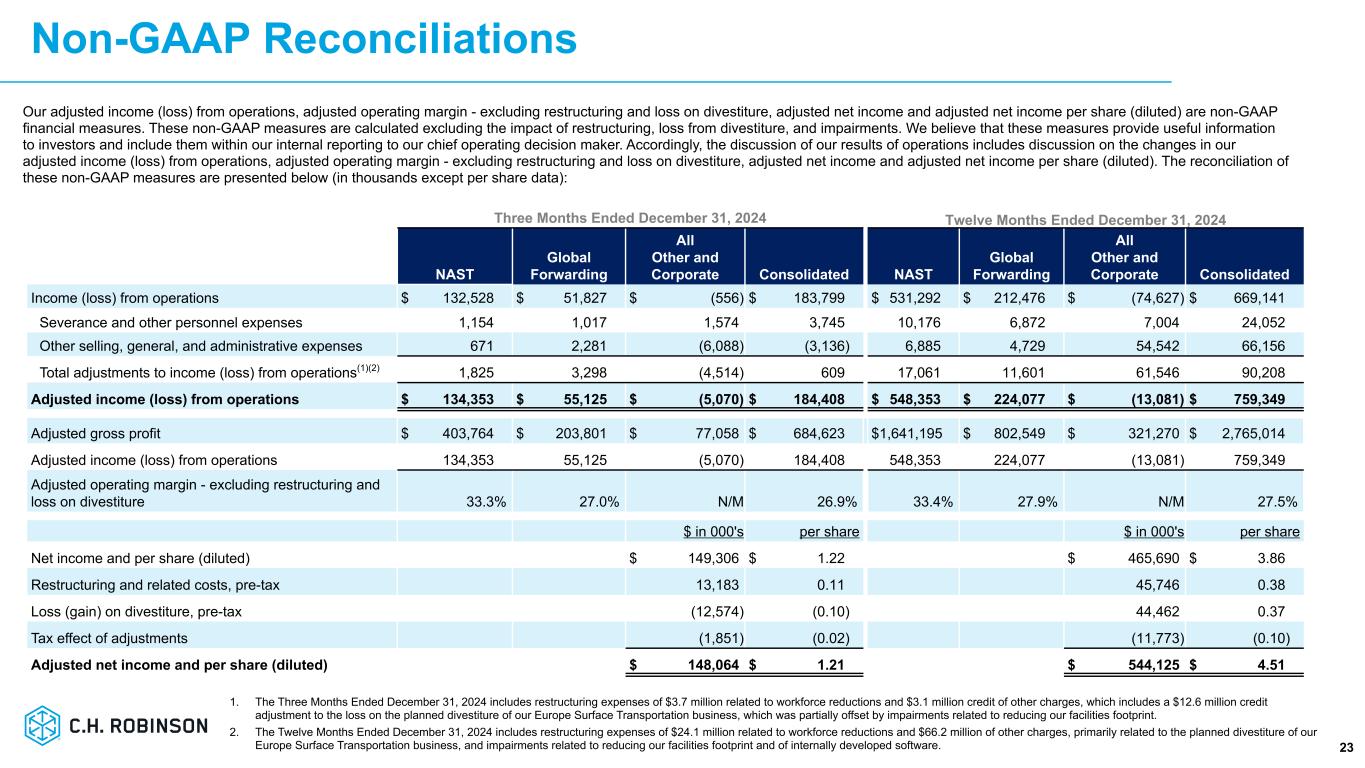
Non-GAAP Reconciliations 23 Our adjusted income (loss) from operations, adjusted operating margin - excluding restructuring and loss on divestiture, adjusted net income and adjusted net income per share (diluted) are non-GAAP financial measures. These non-GAAP measures are calculated excluding the impact of restructuring, loss from divestiture, and impairments. We believe that these measures provide useful information to investors and include them within our internal reporting to our chief operating decision maker. Accordingly, the discussion of our results of operations includes discussion on the changes in our adjusted income (loss) from operations, adjusted operating margin - excluding restructuring and loss on divestiture, adjusted net income and adjusted net income per share (diluted). The reconciliation of these non-GAAP measures are presented below (in thousands except per share data): Three Months Ended December 31, 2024 Twelve Months Ended December 31, 2024 NAST Global Forwarding All Other and Corporate Consolidated NAST Global Forwarding All Other and Corporate Consolidated Income (loss) from operations $ 132,528 $ 51,827 $ (556) $ 183,799 $ 531,292 $ 212,476 $ (74,627) $ 669,141 Severance and other personnel expenses 1,154 1,017 1,574 3,745 10,176 6,872 7,004 24,052 Other selling, general, and administrative expenses 671 2,281 (6,088) (3,136) 6,885 4,729 54,542 66,156 Total adjustments to income (loss) from operations(1)(2) 1,825 3,298 (4,514) 609 17,061 11,601 61,546 90,208 Adjusted income (loss) from operations $ 134,353 $ 55,125 $ (5,070) $ 184,408 $ 548,353 $ 224,077 $ (13,081) $ 759,349 Adjusted gross profit $ 403,764 $ 203,801 $ 77,058 $ 684,623 $ 1,641,195 $ 802,549 $ 321,270 $ 2,765,014 Adjusted income (loss) from operations 134,353 55,125 (5,070) 184,408 548,353 224,077 (13,081) 759,349 Adjusted operating margin - excluding restructuring and loss on divestiture 33.3% 27.0% N/M 26.9% 33.4% 27.9% N/M 27.5% $ in 000's per share $ in 000's per share Net income and per share (diluted) $ 149,306 $ 1.22 $ 465,690 $ 3.86 Restructuring and related costs, pre-tax 13,183 0.11 45,746 0.38 Loss (gain) on divestiture, pre-tax (12,574) (0.10) 44,462 0.37 Tax effect of adjustments (1,851) (0.02) (11,773) (0.10) Adjusted net income and per share (diluted) $ 148,064 $ 1.21 $ 544,125 $ 4.51 1. The Three Months Ended December 31, 2024 includes restructuring expenses of $3.7 million related to workforce reductions and $3.1 million credit of other charges, which includes a $12.6 million credit adjustment to the loss on the planned divestiture of our Europe Surface Transportation business, which was partially offset by impairments related to reducing our facilities footprint. 2. The Twelve Months Ended December 31, 2024 includes restructuring expenses of $24.1 million related to workforce reductions and $66.2 million of other charges, primarily related to the planned divestiture of our Europe Surface Transportation business, and impairments related to reducing our facilities footprint and of internally developed software.
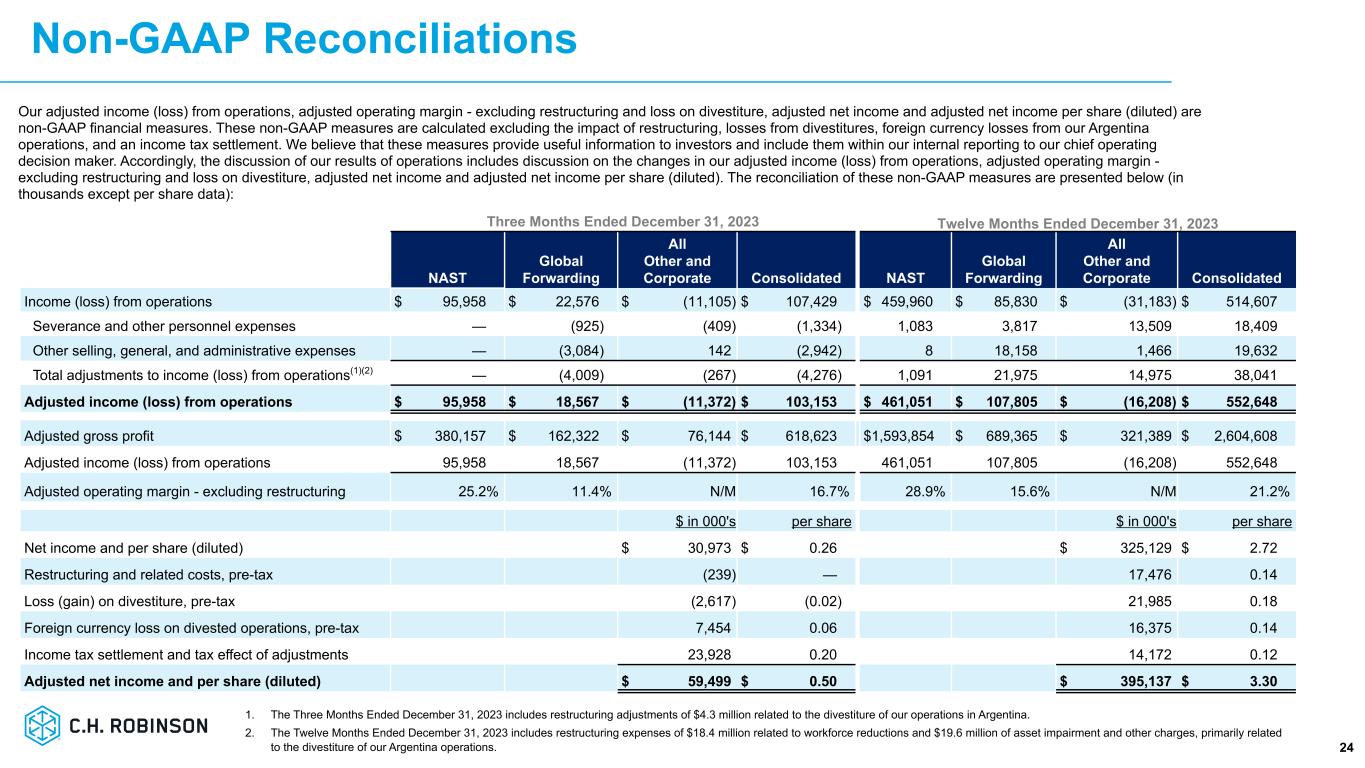
Non-GAAP Reconciliations 24 Our adjusted income (loss) from operations, adjusted operating margin - excluding restructuring and loss on divestiture, adjusted net income and adjusted net income per share (diluted) are non-GAAP financial measures. These non-GAAP measures are calculated excluding the impact of restructuring, losses from divestitures, foreign currency losses from our Argentina operations, and an income tax settlement. We believe that these measures provide useful information to investors and include them within our internal reporting to our chief operating decision maker. Accordingly, the discussion of our results of operations includes discussion on the changes in our adjusted income (loss) from operations, adjusted operating margin - excluding restructuring and loss on divestiture, adjusted net income and adjusted net income per share (diluted). The reconciliation of these non-GAAP measures are presented below (in thousands except per share data): Three Months Ended December 31, 2023 Twelve Months Ended December 31, 2023 NAST Global Forwarding All Other and Corporate Consolidated NAST Global Forwarding All Other and Corporate Consolidated Income (loss) from operations $ 95,958 $ 22,576 $ (11,105) $ 107,429 $ 459,960 $ 85,830 $ (31,183) $ 514,607 Severance and other personnel expenses — (925) (409) (1,334) 1,083 3,817 13,509 18,409 Other selling, general, and administrative expenses — (3,084) 142 (2,942) 8 18,158 1,466 19,632 Total adjustments to income (loss) from operations(1)(2) — (4,009) (267) (4,276) 1,091 21,975 14,975 38,041 Adjusted income (loss) from operations $ 95,958 $ 18,567 $ (11,372) $ 103,153 $ 461,051 $ 107,805 $ (16,208) $ 552,648 Adjusted gross profit $ 380,157 $ 162,322 $ 76,144 $ 618,623 $ 1,593,854 $ 689,365 $ 321,389 $ 2,604,608 Adjusted income (loss) from operations 95,958 18,567 (11,372) 103,153 461,051 107,805 (16,208) 552,648 Adjusted operating margin - excluding restructuring 25.2% 11.4% N/M 16.7% 28.9% 15.6% N/M 21.2% $ in 000's per share $ in 000's per share Net income and per share (diluted) $ 30,973 $ 0.26 $ 325,129 $ 2.72 Restructuring and related costs, pre-tax (239) — 17,476 0.14 Loss (gain) on divestiture, pre-tax (2,617) (0.02) 21,985 0.18 Foreign currency loss on divested operations, pre-tax 7,454 0.06 16,375 0.14 Income tax settlement and tax effect of adjustments 23,928 0.20 14,172 0.12 Adjusted net income and per share (diluted) $ 59,499 $ 0.50 $ 395,137 $ 3.30 1. The Three Months Ended December 31, 2023 includes restructuring adjustments of $4.3 million related to the divestiture of our operations in Argentina. 2. The Twelve Months Ended December 31, 2023 includes restructuring expenses of $18.4 million related to workforce reductions and $19.6 million of asset impairment and other charges, primarily related to the divestiture of our Argentina operations.

2024 INVESTOR DAY Thank you INVESTOR RELATIONS: Chuck Ives 952-683-2508 chuck.ives@chrobinson.com


