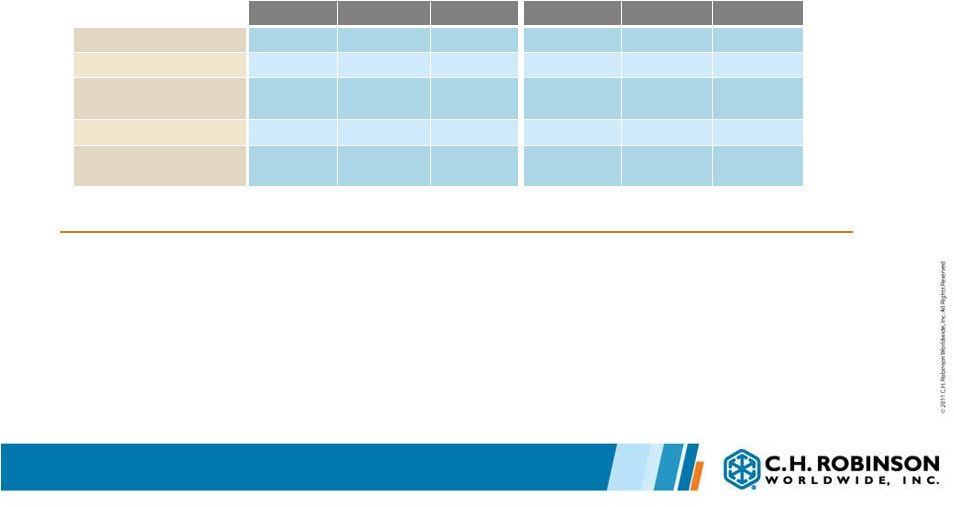
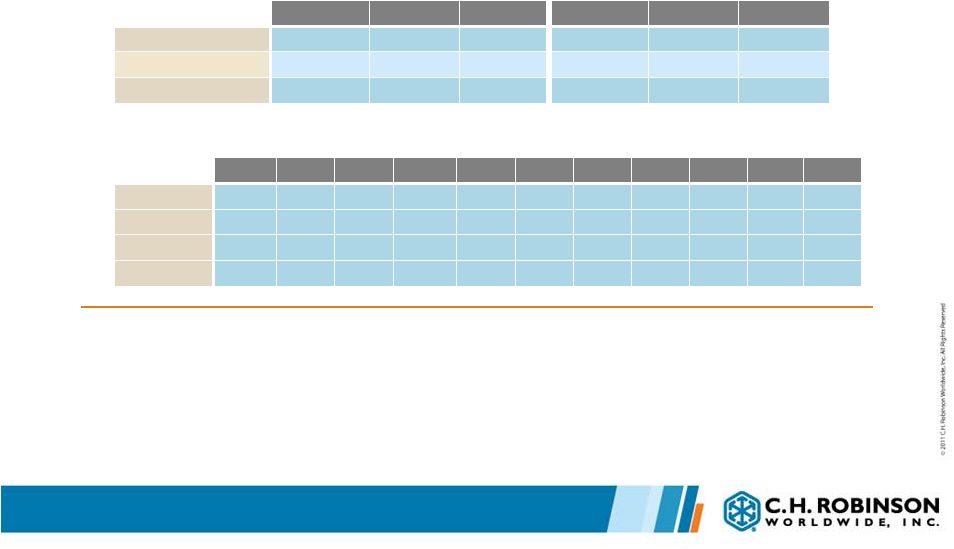
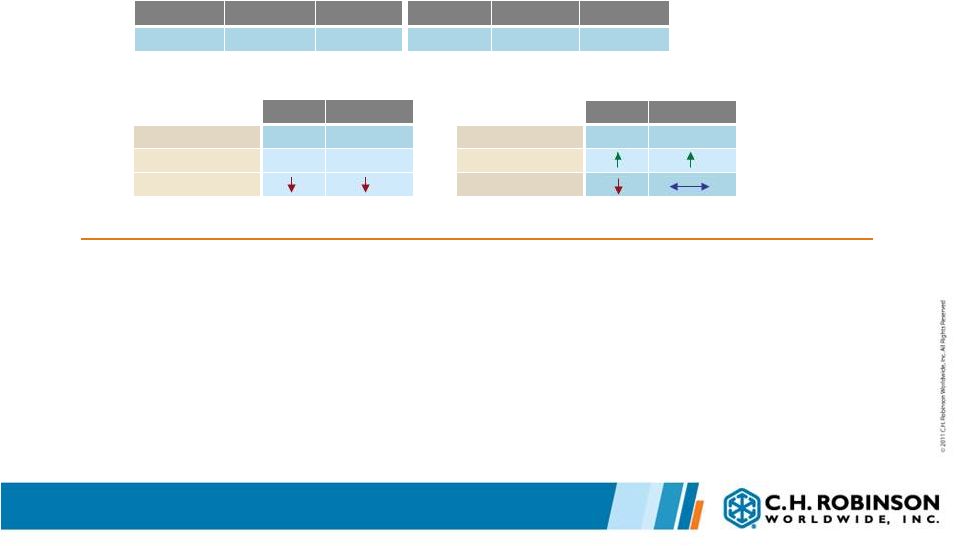
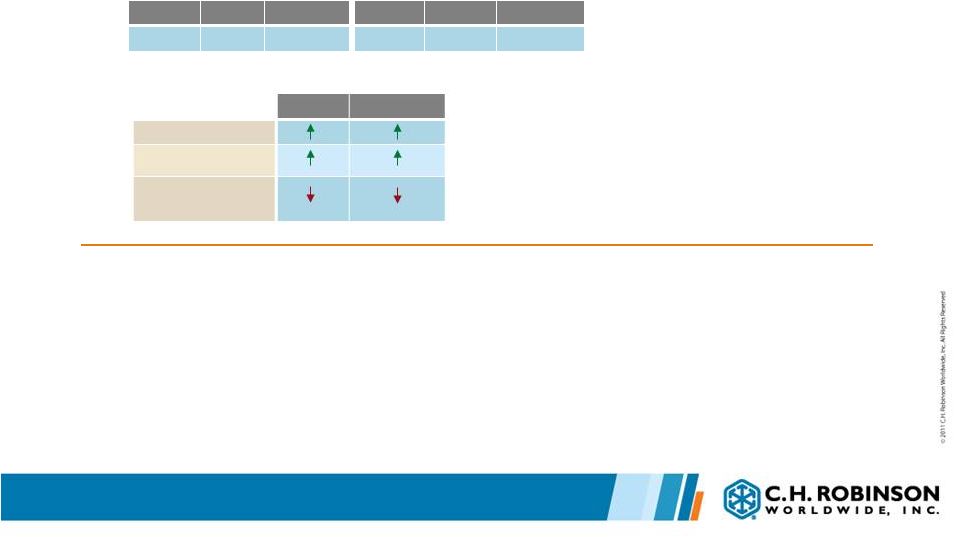
14 Historical Financial Summary Operating Results (in 000’s) (1) Percent Change (1) Percent of Net Revenue (1) (1) Excludes special dividends and distributions related to our initial public offering in October 1997. Period Gross Revenue Net Revenue Total Expense Operating Income Diluted EPS Net Revenue Operating Income Diluted EPS Operating Income 1996 $1,605,905 $179,069 $129,040 $50,029 $0.19 11.9% 11.2% 11.8% 27.9% 1997 $1,790,785 $206,020 $149,285 $56,735 $0.22 15.1% 13.4% 15.8% 27.5% 1998 $2,038,139 $245,666 $177,223 $68,443 $0.26 19.2% 20.6% 18.2% 27.9% 1999 $2,261,027 $293,283 $209,445 $83,828 $0.32 19.4% 22.5% 23.1% 28.6% 2000 $2,822,175 $419,343 $305,791 $113,552 $0.40 43.0% 35.5% 25.0% 27.1% 2001 $3,090,072 $456,572 $328,170 $128,402 $0.47 8.9% 13.1% 17.5% 28.1% 2002 $3,294,473 $483,778 $334,846 $148,932 $0.52 6.0% 16.0% 10.6% 30.8% 2003 $3,613,645 $544,848 $368,802 $176,046 $0.62 12.6% 18.2% 19.2% 32.3% 2004 $4,341,538 $660,991 $438,223 $222,768 $0.79 21.3% 26.5% 27.4% 33.7% 2005 $5,688,948 $879,750 $553,389 $326,361 $1.16 33.1% 46.5% 46.8% 37.1% 2006 $6,556,194 $1,082,544 $664,699 $417,845 $1.53 23.1% 28.0% 31.9% 38.6% 2007 $7,316,223 $1,243,778 $734,094 $509,684 $1.86 14.9% 22.0% 21.6% 41.0% 2008 $8,578,614 $1,374,963 $803,377 $571,586 $2.08 10.5% 12.1% 11.8% 41.6% 2009 $7,577,189 $1,381,959 $797,148 $584,811 $2.13 0.5% 2.3% 2.4% 42.3% 2010 $9,274,305 $1,467,978 $845,118 $622,860 $2.33 6.2% 6.5% 9.4% 42.4% 2011 $10,336,346 $1,632,658 $939,928 $692,730 $2.62 11.2% 11.2% 12.4% 42.4% CAGR Gross Revenue Net Revenue Total Expense Operating Income Diluted EPS 5yr 06-11 9.5% 8.6% 7.2% 10.6% 11.4% 10yr 01-11 12.8% 13.6% 11.1% 18.4% 18.7% 15yr 96-11 13.2% 15.9% 14.2% 19.1% 19.1% |