
Earnings Conference Call - First Quarter 2013
May 7, 2013
John Wiehoff, Chairman & CEO
Scott Hagen, Corporate Controller
Tim Gagnon, Director Investor Relations
© 2012 C.H. Robinson Worldwide, Inc. All Rights Reserved.
Safe Harbor Statement
Except for the historical information contained herein, the matters set forth in this presentation and the accompanying earnings release are forward-looking statements that represent our expectations, beliefs, intentions or strategies concerning future events. These forward-looking statements are subject to certain risks and uncertainties that could cause actual results to differ materially from our historical experience or our present expectations, including, but not limited to such factors as changes in economic conditions, including uncertain consumer demand; changes in market demand and pressures on the pricing for our services; competition and growth rates within the third party logistics industry; freight levels and increasing costs and availability of truck capacity or alternative means of transporting freight, and changes in relationships with existing truck, rail, ocean and air carriers; changes in our customer base due to possible consolidation among our customers; our ability to integrate the operations of acquired companies with our historic operations successfully; risks associated with litigation and insurance coverage; risks associated with operations outside of the U.S.; risks associated with the potential impacts of changes in government regulations; risks associated with the produce industry, including food safety and contamination issues; fuel prices and availability; and the impact of war on the economy; and other risks and uncertainties detailed in our Annual and Quarterly Reports.
We have included herein certain non-GAAP financial information, including certain fiscal 2012 information adjusted to reflect acquisitions and a divestiture that occurred during 2012. In addition to helping us assess our operating performance, we believe that these non-GAAP financial measures assist investors in understanding our operations and results. However, non-GAAP results should not be regarded as a substitute for corresponding GAAP measures, and should be viewed in conjunction with our consolidated financial statements prepared in accordance with GAAP. Reconciliations of such non-GAAP information to actual results are set forth in Appendices A and B.
© 2012 C.H. Robinson Worldwide, Inc. All Rights Reserved.
1
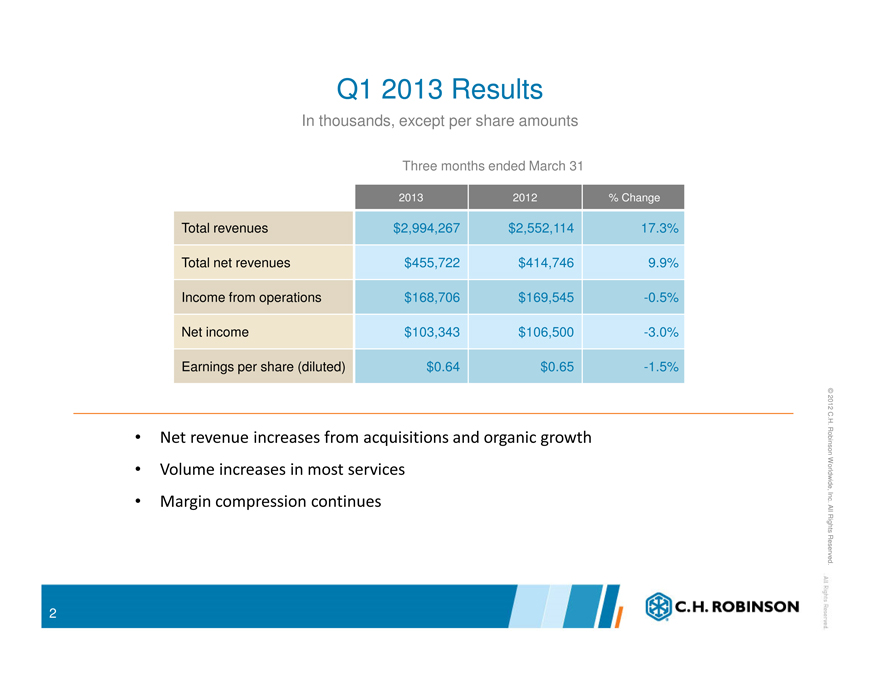
Q1 2013 Results
In thousands, except per share amounts
Three months ended March 31
2013 2012 % Change
Total revenues $2,994,267 $2,552,114 17.3%
Total net revenues $455,722 $414,746 9.9%
Income from operations $168,706 $169,545 -0.5%
Net income $103,343 $106,500 -3.0%
Earnings per share (diluted) $0.64 $0.65 -1.5%
• Net revenue increases from acquisitions and organic growth
• Volume increases in most services
• Margin compression continues
© 2012 C.H. Robinson Worldwide, Inc. All Rights Reserved.
2
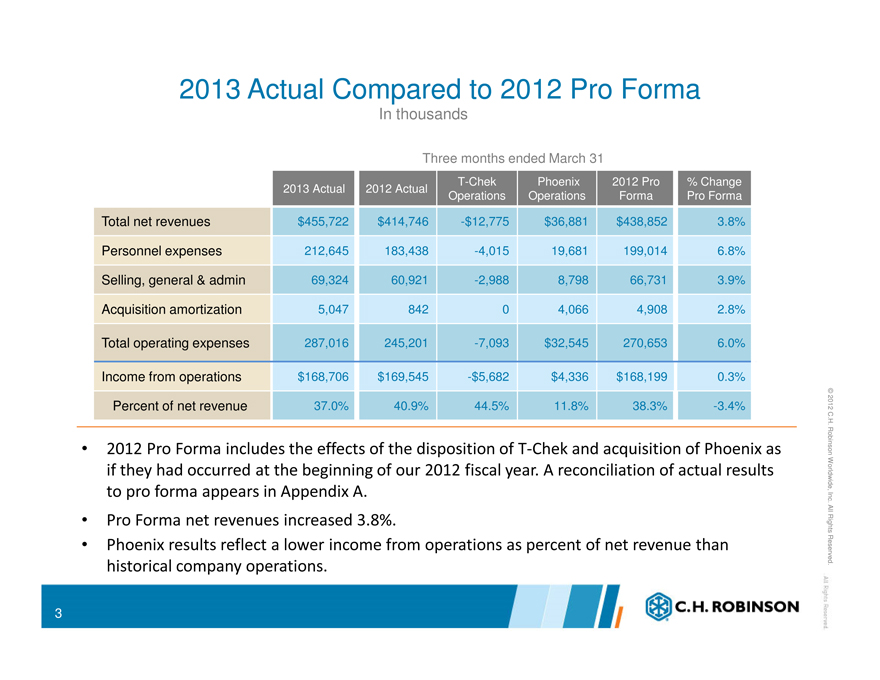
2013 Actual Compared to 2012 Pro Forma
In thousands
Three months ended March 31
2013 Actual 2012 Actual T-Chek Operations Phoenix Operations 2012 Pro Forma % Change Pro Forma
Total net revenues $455,722 $414,746 -$12,775 $36,881 $438,852 3.8%
Personnel expenses 212,645 183,438 -4,015 19,681 199,014 6.8%
Selling, general & admin 69,324 60,921 -2,988 8,798 66,731 3.9%
Acquisition amortization 5,047 842 0 4,066 4,908 2.8%
Total operating expenses 287,016 245,201 -7,093 $32,545 270,653 6.0%
Income from operations $168,706 $169,545 -$5,682 $4,336 $168,199 0.3%
Percent of net revenue 37.0% 40.9% 44.5% 11.8% 38.3% -3.4%
• 2012 Pro Forma includes the effects of the disposition of T-Chek and acquisition of Phoenix as if they had occurred at the beginning of our 2012 fiscal year. A reconciliation of actual results to pro forma appears in Appendix A.
• Pro Forma net revenues increased 3.8%.
• Phoenix results reflect a lower income from operations as percent of net revenue than historical company operations.
© 2012 C.H. Robinson Worldwide, Inc. All Rights Reserved.
3
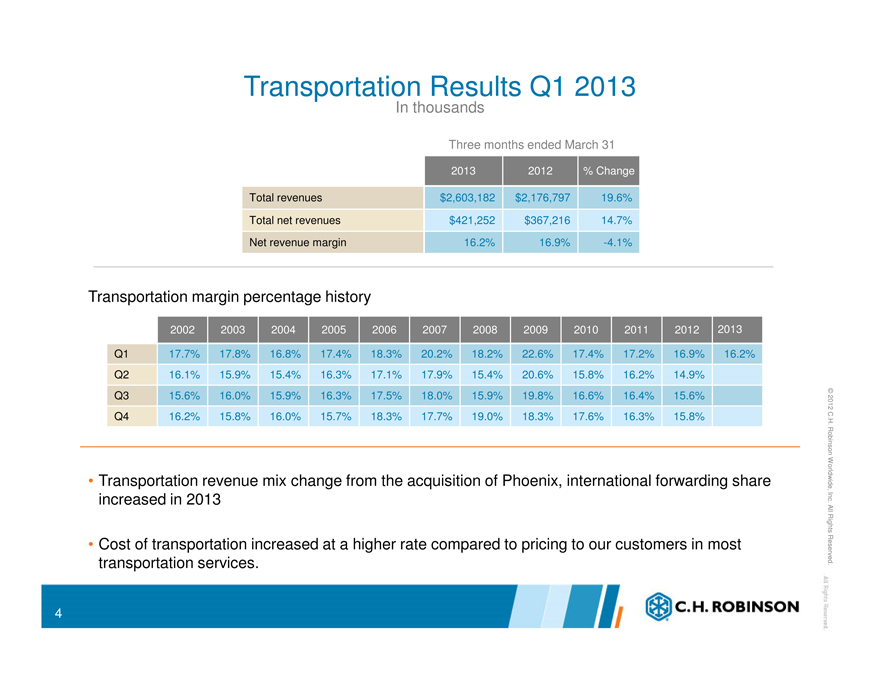
Transportation Results Q1 2013
In thousands
Three months ended March 31
2013 2012 % Change
Total revenues $2,603,182 $2,176,797 19.6%
Total net revenues $421,252 $367,216 14.7%
Net revenue margin 16.2% 16.9% -4.1%
Transportation margin percentage history
2002 2003 2004 2005 2006 2007 2008 2009 2010 2011 2012 2013
Q1 17.7% 17.8% 16.8% 17.4% 18.3% 20.2% 18.2% 22.6% 17.4% 17.2% 16.9% 16.2%
Q2 16.1% 15.9% 15.4% 16.3% 17.1% 17.9% 15.4% 20.6% 15.8% 16.2% 14.9%
Q3 15.6% 16.0% 15.9% 16.3% 17.5% 18.0% 15.9% 19.8% 16.6% 16.4% 15.6%
Q4 16.2% 15.8% 16.0% 15.7% 18.3% 17.7% 19.0% 18.3% 17.6% 16.3% 15.8%
• Transportation revenue mix change from the acquisition of Phoenix, international forwarding share increased in 2013
• Cost of transportation increased at a higher rate compared to pricing to our customers in most transportation services.
© 2012 C.H. Robinson Worldwide, Inc. All Rights Reserved.
4
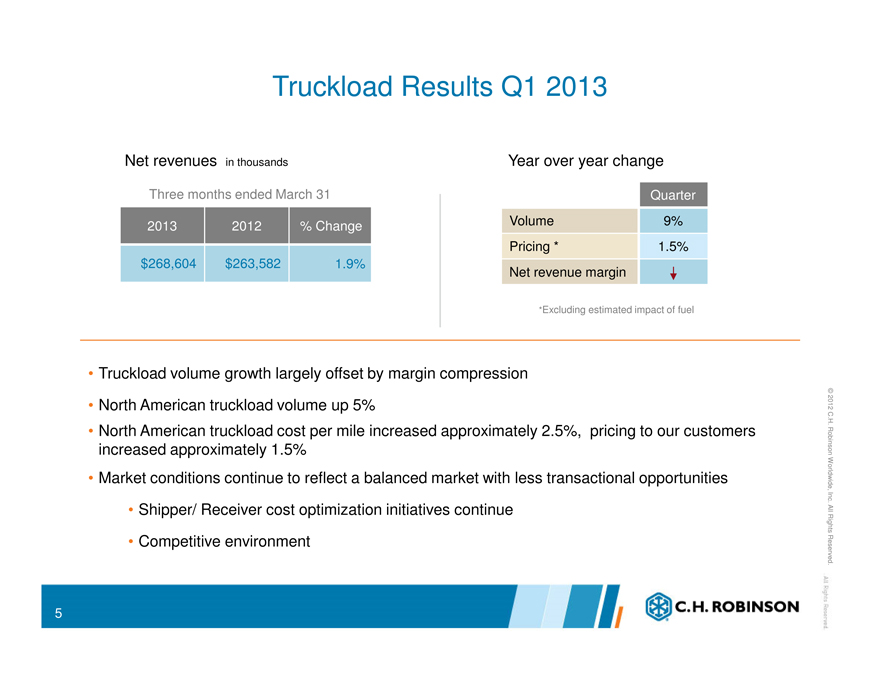
Truckload Results Q1 2013
Net revenues in thousands
Three months ended March 31
2013 2012 % Change
$268,604 $263,582 1.9%
Year over year change
Quarter
Volume 9%
Pricing * 1.5%
Net revenue margin
*Excluding estimated impact of fuel
• Truckload volume growth largely offset by margin compression
• North American truckload volume up 5%
• North American truckload cost per mile increased approximately 2.5%, pricing to our customers increased approximately 1.5%
• Market conditions continue to reflect a balanced market with less transactional opportunities
• Shipper/ Receiver cost optimization initiatives continue
• Competitive environment
© 2012 C.H. Robinson Worldwide, Inc. All Rights Reserved.
5
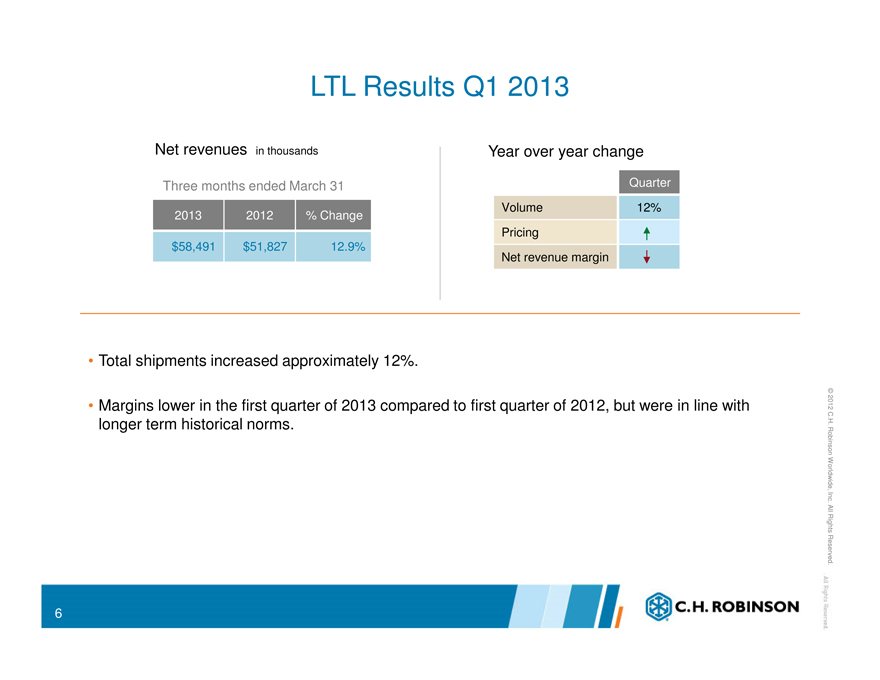
LTL Results Q1 2013
Net revenues in thousands
Three months ended March 31
2013 2012 % Change
$58,491 $51,827 12.9%
Year over year change
Quarter
Volume 12%
Pricing
Net revenue margin
• Total shipments increased approximately 12%.
• Margins lower in the first quarter of 2013 compared to first quarter of 2012, but were in line with longer term historical norms.
© 2012 C.H. Robinson Worldwide, Inc. All Rights Reserved.
6
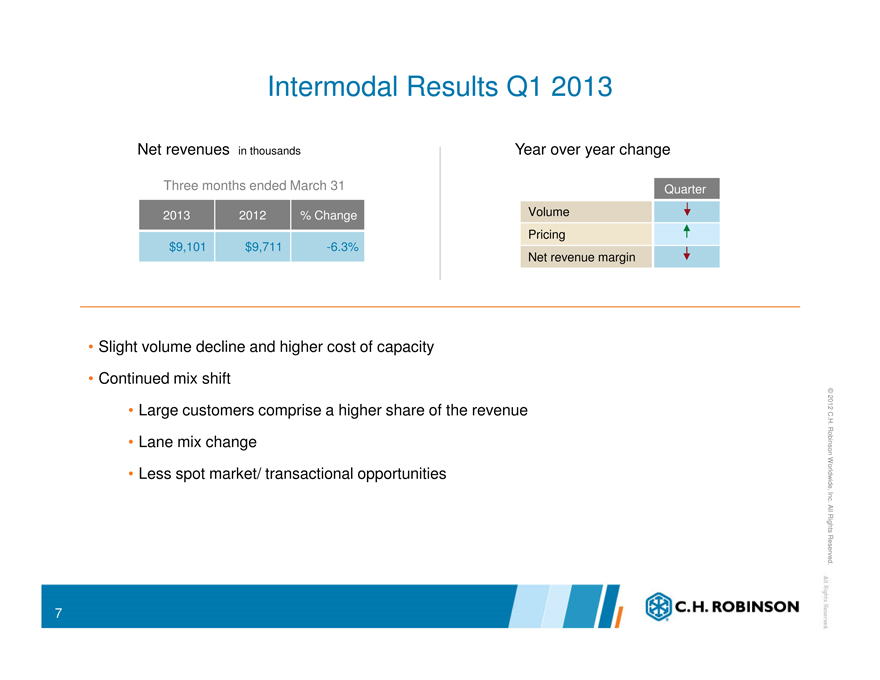
Intermodal Results Q1 2013
Net revenues in thousands
Three months ended March 31
2013 2012 % Change
$9,101 $9,711 -6.3%
Year over year change
Quarter
Volume
Pricing
Net revenue margin
• Slight volume decline and higher cost of capacity
• Continued mix shift
• Large customers comprise a higher share of the revenue
• Lane mix change
• Less spot market/ transactional opportunities
© 2012 C.H. Robinson Worldwide, Inc. All Rights Reserved.
7
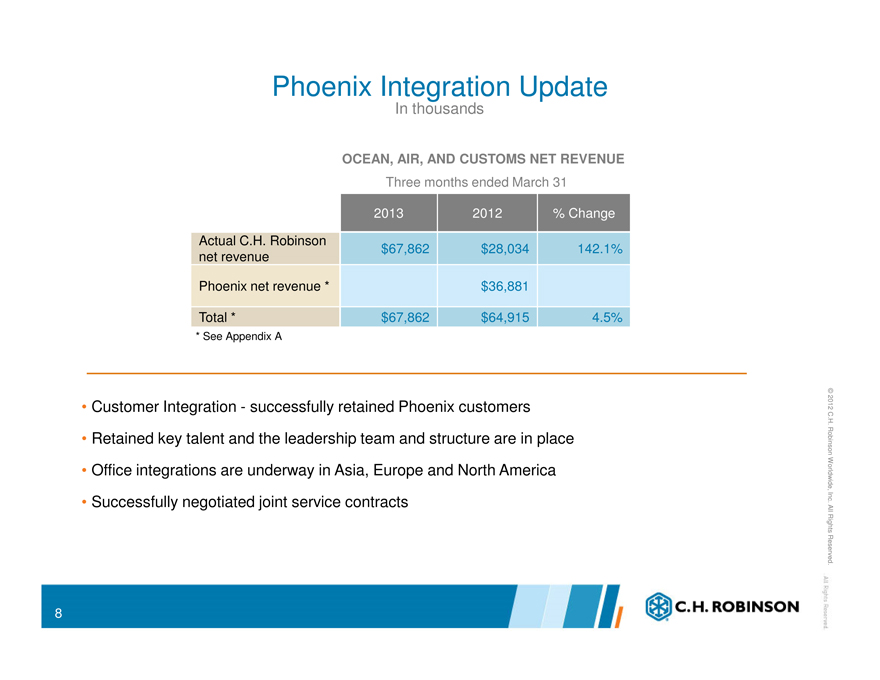
Phoenix Integration Update
In thousands
OCEAN, AIR, AND CUSTOMS NET REVENUE
Three months ended March 31
2013 2012 % Change
Actual C.H. Robinson net revenue $67,862 $28,034 142.1%
Phoenix net revenue * $36,881
Total * $67,862 $64,915 4.5%
* See Appendix A
• Customer Integration - successfully retained Phoenix customers
• Retained key talent and the leadership team and structure are in place
• Office integrations are underway in Asia, Europe and North America
• Successfully negotiated joint service contracts
© 2012 C.H. Robinson Worldwide, Inc. All Rights Reserved.
8
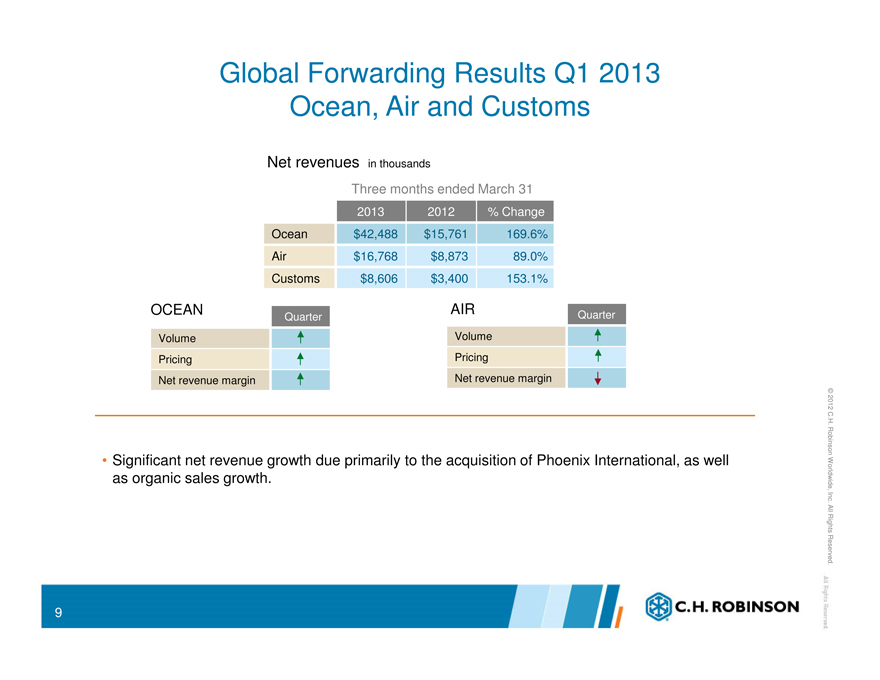
Global Forwarding Results Q1 2013 Ocean, Air and Customs
Net revenues in thousands
Three months ended March 31
2013 2012 % Change
Ocean $42,488 $15,761 169.6%
Air $16,768 $8,873 89.0%
Customs $8,606 $3,400 153.1%
OCEAN Quarter
Volume
Pricing
Net revenue margin
AIR Quarter
Volume
Pricing
Net revenue margin
• Significant net revenue growth due primarily to the acquisition of Phoenix International, as well as organic sales growth.
© 2012 C.H. Robinson Worldwide, Inc. All Rights Reserved.
9
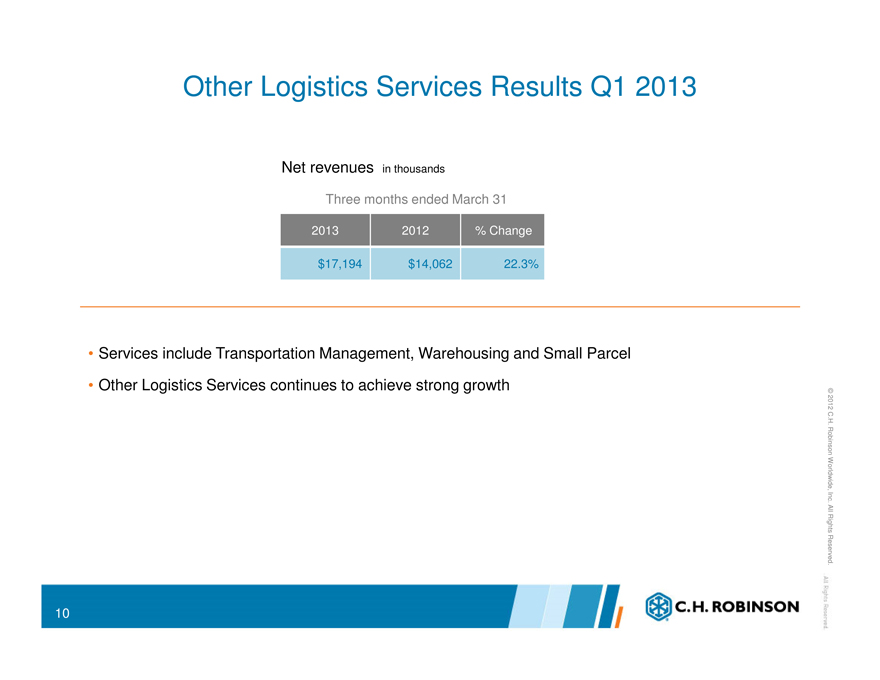
Other Logistics Services Results Q1 2013
Net revenues in thousands
Three months ended March 31
2013 2012 % Change
$17,194 $14,062 22.3%
• Services include Transportation Management, Warehousing and Small Parcel
• Other Logistics Services continues to achieve strong growth
© 2012 C.H. Robinson Worldwide, Inc. All Rights Reserved.
10
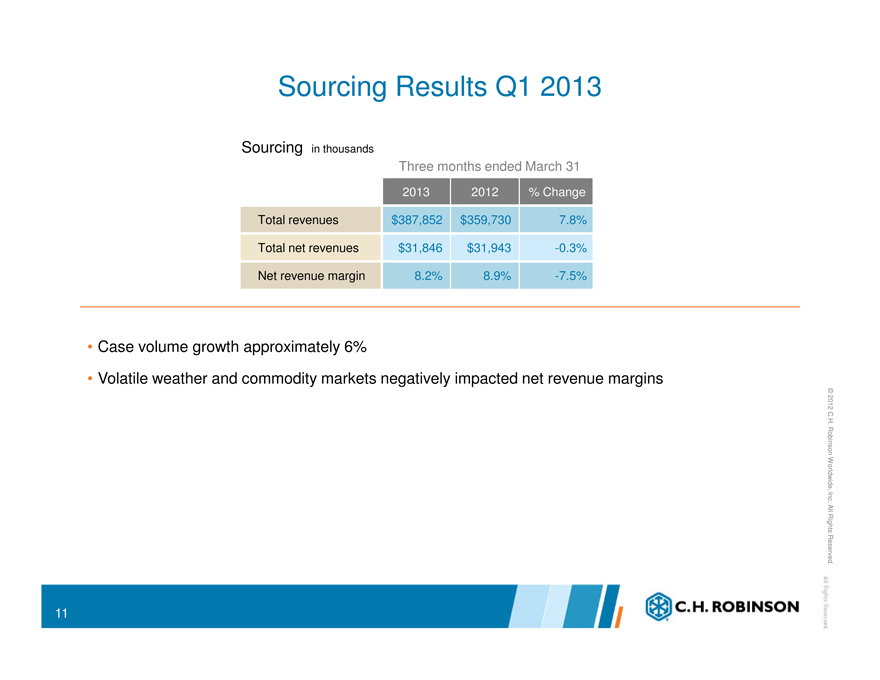
Sourcing Results Q1 2013
Sourcing in thousands
Three months ended March 31
2013 2012 % Change
Total revenues $387,852 $359,730 7.8%
Total net revenues $31,846 $31,943 -0.3%
Net revenue margin 8.2% 8.9% -7.5%
• Case volume growth approximately 6%
• Volatile weather and commodity markets negatively impacted net revenue margins
© 2012 C.H. Robinson Worldwide, Inc. All Rights Reserved.
11
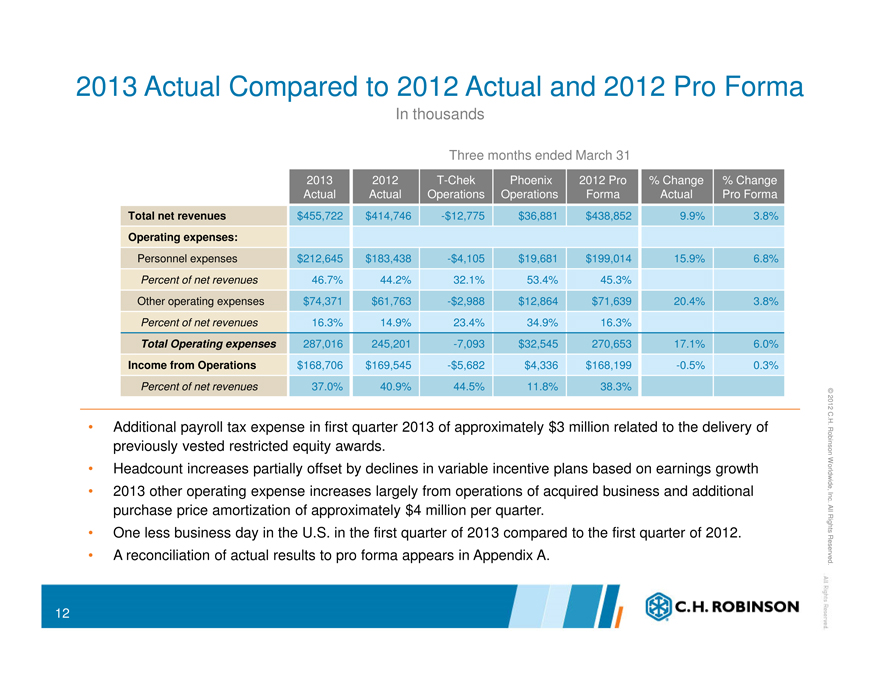
2013 Actual Compared to 2012 Actual and 2012 Pro Forma
In thousands
Three months ended March 31
2013 Actual 2012 Actual T-Chek Operations Phoenix Operations 2012 Pro Forma % Change Actual % Change Pro Forma
Total net revenues $455,722 $414,746 -$12,775 $36,881 $438,852 9.9% 3.8%
Operating expenses:
Personnel expenses $212,645 $183,438 -$4,105 $19,681 $199,014 15.9% 6.8%
Percent of net revenues 46.7% 44.2% 32.1% 53.4% 45.3%
Other operating expenses $74,371 $61,763 -$2,988 $12,864 $71,639 20.4% 3.8%
Percent of net revenues 16.3% 14.9% 23.4% 34.9% 16.3%
Total Operating expenses 287,016 245,201 -7,093 $32,545 270,653 17.1% 6.0%
Income from Operations $168,706 $169,545 -$5,682 $4,336 $168,199 -0.5% 0.3%
Percent of net revenues 37.0% 40.9% 44.5% 11.8% 38.3%
• Additional payroll tax expense in first quarter 2013 of approximately $3 million related to the delivery of previously vested restricted equity awards.
• Headcount increases partially offset by declines in variable incentive plans based on earnings growth
• 2013 other operating expense increases largely from operations of acquired business and additional purchase price amortization of approximately $4 million per quarter.
• One less business day in the U.S. in the first quarter of 2013 compared to the first quarter of 2012.
• A reconciliation of actual results to pro forma appears in Appendix A.
© 2012 C.H. Robinson Worldwide, Inc. All Rights Reserved.
12
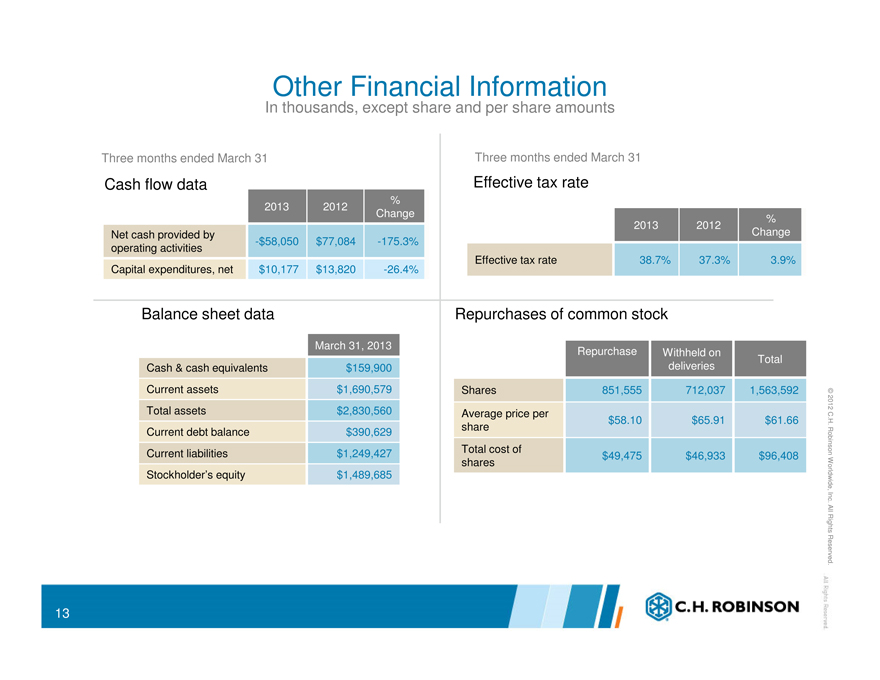
Other Financial Information
In thousands, except share and per share amounts
Three months ended March 31
Cash flow data
2013 2012 % Change
Net cash provided by
-$58,050 $77,084 -175.3%
operating activities
Capital expenditures, net $10,177 $13,820 -26.4%
Three months ended March 31
Effective tax rate
2013 2012 % Change
Effective tax rate 38.7% 37.3% 3.9%
Balance sheet data
March 31, 2013
Cash & cash equivalents $159,900
Current assets $1,690,579
Total assets $2,830,560
Current debt balance $390,629
Current liabilities $1,249,427
Stockholder’s equity $1,489,685
Repurchases of common stock
Repurchase Withheld on deliveries Total
Shares 851,555 712,037 1,563,592
Average price per
$58.10 $65.91 $61.66
share
Total cost of
$49,475 $46,933 $96,408
shares
© 2012 C.H. Robinson Worldwide, Inc. All Rights Reserved.
13
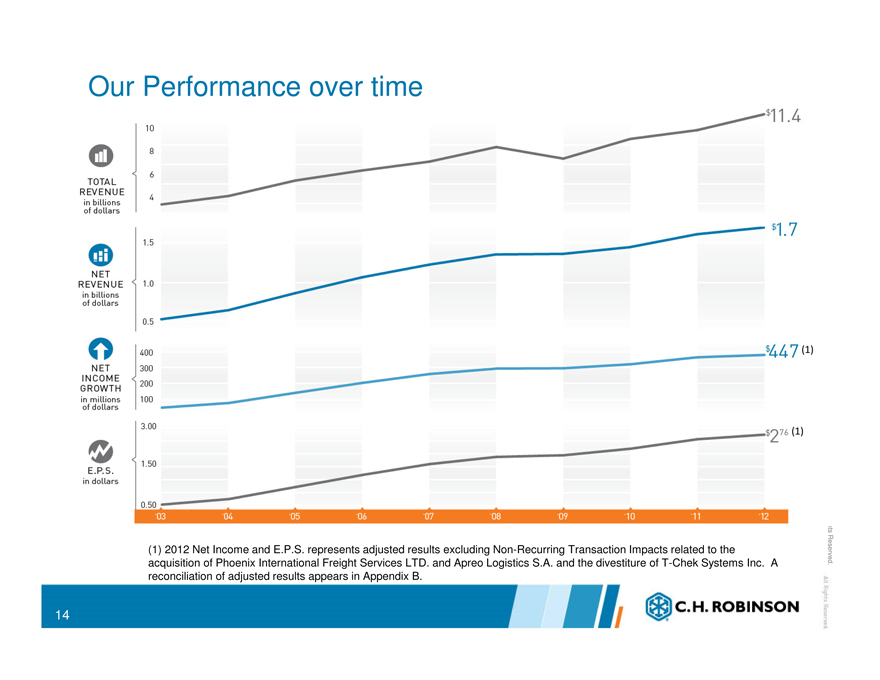
Our Performance over time
(1) 2012 Net Income and E.P.S. represents adjusted results excluding Non-Recurring Transaction Impacts related to the acquisition of Phoenix International Freight Services LTD. and Apreo Logistics S.A. and the divestiture of T-Chek Systems Inc. A reconciliation of adjusted results appears in Appendix B.
ts Reserved.
14
A look ahead
• T-Chek comparisons will remain a variance through the year
• Goal to improve our Global Forwarding results on the combined CHRW/ Phoenix business over the next 3-5 years
• Truckload margin compression will remain a challenge under the current market conditions
• We will continue to aggressively sell and pursue market share gains, while managing the productivity challenges of a more competitive market
*See safe harbor statement on slide 2 regarding forward-looking statements
© 2012 C.H. Robinson Worldwide, Inc. All Rights Reserved.
15
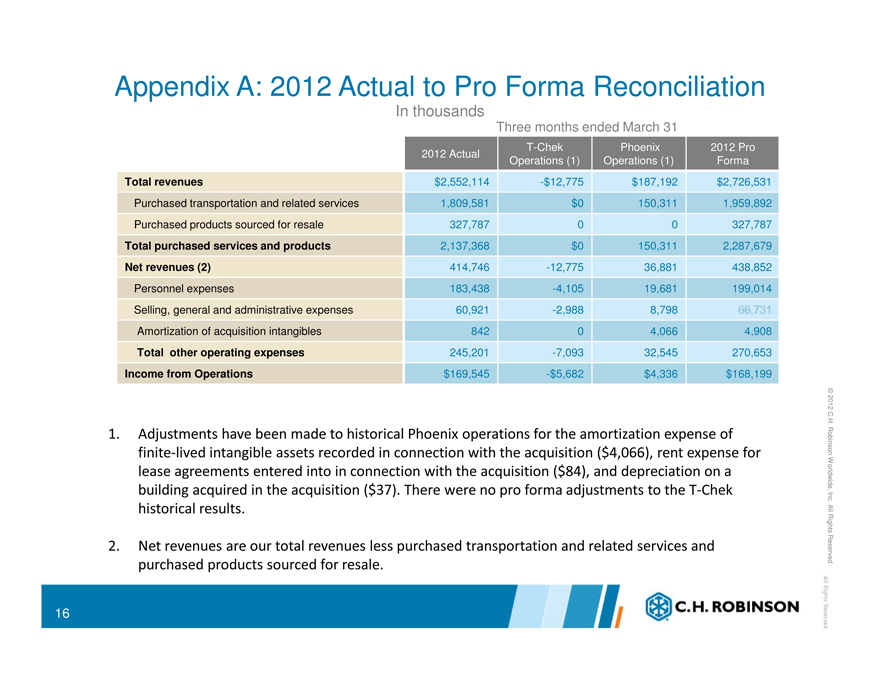
Appendix A: 2012 Actual to Pro Forma Reconciliation
In thousands
Three months ended March 31
2012 Actual T-Chek Operations (1) Phoenix Operations (1) 2012 Pro Forma
Total revenues $2,552,114 -$12,775 $187,192 $2,726,531
Purchased transportation and related services 1,809,581 $0 150,311 1,959,892
Purchased products sourced for resale 327,787 0 0 327,787
Total purchased services and products 2,137,368 $0 150,311 2,287,679
Net revenues (2) 414,746 -12,775 36,881 438,852
Personnel expenses 183,438 -4,105 19,681 199,014
Selling, general and administrative expenses 60,921 -2,988 8,798
Amortization of acquisition intangibles 842 0 4,066 4,908
Total other operating expenses 245,201 -7,093 32,545 270,653
Income from Operations $169,545 -$5,682 $4,336 $168,199
1. Adjustments have been made to historical Phoenix operations for the amortization expense of finite-lived intangible assets recorded in connection with the acquisition ($4,066), rent expense for lease agreements entered into in connection with the acquisition ($84), and depreciation on a building acquired in the acquisition ($37). There were no pro forma adjustments to the T-Chek historical results.
2. Net revenues are our total revenues less purchased transportation and related services and purchased products sourced for resale.
© 2012 C.H. Robinson Worldwide, Inc. All Rights Reserved.
16
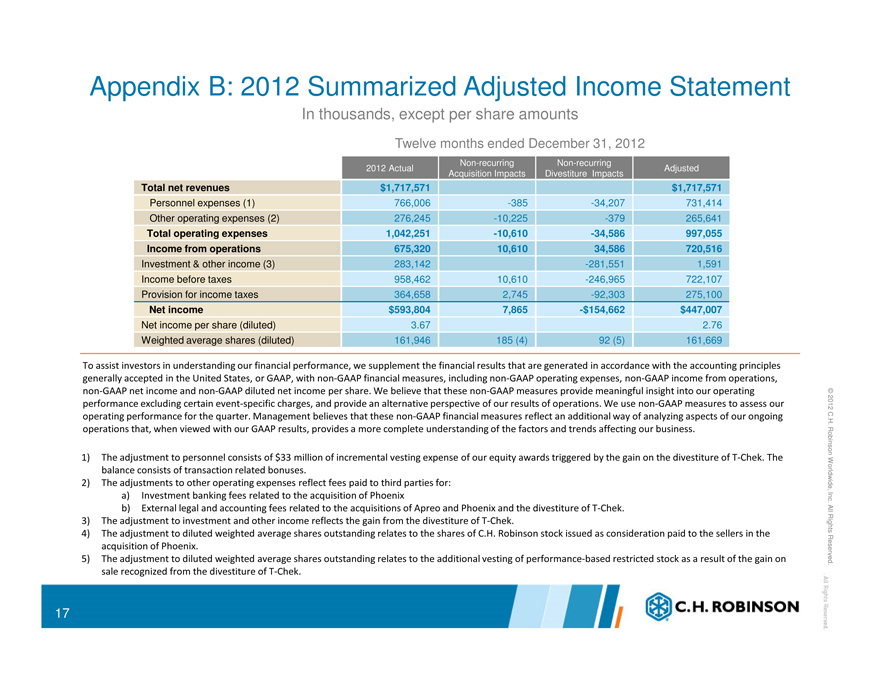
Appendix B: 2012 Summarized Adjusted Income Statement
In thousands, except per share amounts
Twelve months ended December 31, 2012
2012 Actual Non-recurring Acquisition Impacts Non-recurring Divestiture Impacts Adjusted
Total net revenues $1,717,571 $1,717,571
Personnel expenses (1) 766,006 -385 -34,207 731,414
Other operating expenses (2) 276,245 -10,225 -379 265,641
Total operating expenses 1,042,251 -10,610 -34,586 997,055
Income from operations 675,320 10,610 34,586 720,516
Investment & other income (3) 283,142 -281,551 1,591
Income before taxes 958,462 10,610 -246,965 722,107
Provision for income taxes 364,658 2,745 -92,303 275,100
Net income $593,804 7,865 -$154,662 $447,007
Net income per share (diluted) 3.67 2.76
Weighted average shares (diluted) 161,946 185(4) 92(5) 161,669
To assist investors in understanding our financial performance, we supplement the financial results that are generated in accordance with the accounting principles generally accepted in the United States, or GAAP, with non-GAAP financial measures, including non-GAAP operating expenses, non-GAAP income from operations, non-GAAP net income and non-GAAP diluted net income per share. We believe that these non-GAAP measures provide meaningful insight into our operating performance excluding certain event-specific charges, and provide an alternative perspective of our results of operations. We use non-GAAP measures to assess our operating performance for the quarter. Management believes that these non-GAAP financial measures reflect an additional way of analyzing aspects of our ongoing operations that, when viewed with our GAAP results, provides a more complete understanding of the factors and trends affecting our business.
1) The adjustment to personnel consists of $33 million of incremental vesting expense of our equity awards triggered by the gain on the divestiture of T-Chek. The balance consists of transaction related bonuses.
2) The adjustments to other operating expenses reflect fees paid to third parties for: a) Investment banking fees related to the acquisition of Phoenix b) External legal and accounting fees related to the acquisitions of Apreo and Phoenix and the divestiture of T-Chek.
3) The adjustment to investment and other income reflects the gain from the divestiture of T-Chek.
4) The adjustment to diluted weighted average shares outstanding relates to the shares of C.H. Robinson stock issued as consideration paid to the sellers in the acquisition of Phoenix.
5) The adjustment to diluted weighted average shares outstanding relates to the additional vesting of performance-based restricted stock as a result of the gain on sale recognized from the divestiture of T-Chek.
© 2012 C.H. Robinson Worldwide, Inc. All Rights Reserved.
17

© 2012 C.H. Robinson Worldwide, Inc. All Rights Reserved.