Earnings Conference Call – Third Quarter 2013 November 6, 2013 John Wiehoff, Chairman & CEO Chad Lindbloom, CFO Tim Gagnon, Director, Investor Relations Exhibit 99.2 |
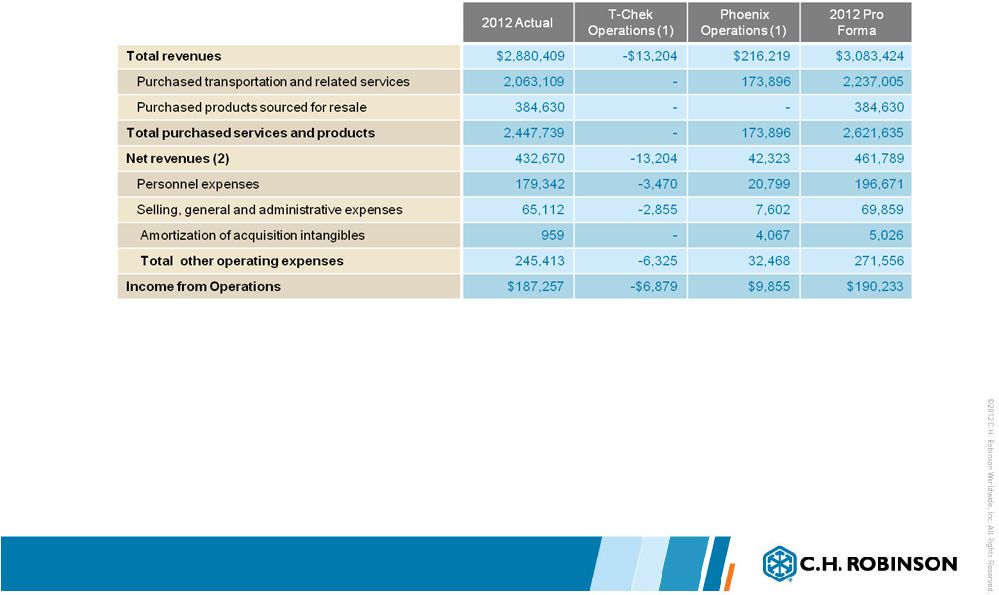
2 Safe Harbor Statement Except for the historical information contained herein, the matters set forth in this presentation and the accompanying earnings release are forward-looking statements that represent our expectations, beliefs, intentions or strategies concerning future events. These forward-looking statements are subject to certain risks and uncertainties that could cause actual results to differ materially from our historical experience or our present expectations, including, but not limited to such factors as changes in economic conditions, including uncertain consumer demand; changes in market demand and pressures on the pricing for our services; competition and growth rates within the third party logistics industry; freight levels and increasing costs and availability of truck capacity or alternative means of transporting freight, and changes in relationships with existing truck, rail, ocean and air carriers; changes in our customer base due to possible consolidation among our customers; our ability to integrate the operations of acquired companies with our historic operations successfully; risks associated with litigation and insurance coverage; risks associated with operations outside of the U.S.; risks associated with the potential impacts of changes in government regulations; risks associated with the produce industry, including food safety and contamination issues; fuel prices and availability; changes to our capital structure and termination of our accelerated share repurchase program; and the impact of war on the economy; and other risks and uncertainties detailed in our Annual and Quarterly Reports. We have included herein certain non-GAAP financial information, including certain fiscal 2012 information adjusted to reflect an acquisition and a divestiture that occurred during 2012. In addition to helping us assess our operating performance, we believe that these non-GAAP financial measures assist investors in understanding our operations and results. However, non-GAAP results should not be regarded as a substitute for corresponding GAAP measures, and should be viewed in conjunction with our consolidated financial statements prepared in accordance with GAAP. Reconciliations of such non-GAAP information to actual results are set forth in Appendices A, B and C. |
3 Q3 2013 Results 2013 2012 % Change 2013 2012 % Change Total revenues $3,316,665 $2,880,409 15.1% $9,599,194 $8,388,237 14.4% Total net revenues $463,306 $432,670 7.1% $1,391,630 $1,272,939 9.3% Income from operations $176,355 $187,257 -5.8% $527,537 $541,716 -2.6% Net income $107,737 $116,330 -7.4% $322,952 $337,412 -4.3% Earnings per share (diluted) $0.69 $0.72 -4.2% $2.03 $2.08 -2.4% Three months ended September 30 Nine months ended September 30 In thousands, except per share amounts • Total revenue growth is primarily a result of acquired business and market share gains • Net revenue margin compression continues to be a challenge • We continue to invest in the business and have confidence in our long term strategy • Accelerated Share Repurchases, made in late August 2013, had no EPS impact in the third quarter. We expect an approximate $.02 per quarter EPS impact in the future |
4 In thousands 2013 Actual 2012 Actual T-Chek Operations Phoenix Operations 2012 Pro Forma % Change Pro Forma Total revenues $3,316,665 $2,880,409 -$13,204 $216,219 $3,083,424 7.6% Total net revenues $463,306 $432,670 -$13,204 $42,323 $461,789 0.3% Personnel expenses 204,388 179,342 -3,470 20,799 196,671 3.9% Selling, general & admin 77,523 65,112 -2,855 7,602 69,859 11.0% Acquisition amortization 5,040 959 - 4,067 5,026 0.3% Total operating expenses 286,951 245,413 -6,325 32,468 271,556 5.7% Income from operations $176,355 $187,257 -$6,879 $9,855 $190,233 -7.3% Percent of net revenue 38.1% 43.3% 52.1% 23.3% 41.2% -7.5% Q3 2013 Actual Compared to Q3 2012 Pro Forma • 2012 Pro Forma includes the effects of the disposition of T-Chek and acquisition of Phoenix as if they had occurred at the beginning of our 2012 fiscal year. A reconciliation of actual results for the third quarter of 2012 to pro forma appears in Appendix A • Excluding the employees of Phoenix, Apreo and T-Chek, average headcount increased approximately eight percent in the third quarter of 2013 compared to the third quarter of 2012. Headcount increases were partially offset by declines in variable incentive plans based on earnings growth • Income from operations as a percent of net revenue has been generally consistent through the first three quarters of 2013 • (Q1 2013 37.0%, Q2 2013 38.6%, Q3 2013 38.1%) • See Appendix B for the nine months ending September 30, 2012. Three months ended September 30 |
5 Transportation Results Q3 2013 • Total revenue growth is primarily attributed to the Phoenix acquisition and Truckload volume growth • Significant net revenue margin compression in Truckload, partially offset by margin expansion in the Global Forwarding services 2013 2012 % Change 2013 2012 % Change Total revenues $2,880,901 $2,445,883 17.8% $8,302,160 $7,099,485 16.9% Total net revenues $429,978 $382,774 12.3% $1,282,375 $1,118,996 14.6% Net revenue margin 14.9% 15.6% -4.6% 15.4% 15.8% -2.0% Three months ended September 30 Nine months ended September 30 TRANSPORTATION in thousands TRANSPORTATION NET REVENUE MARGIN PERCENTAGE 2002 2003 2004 2005 2006 2007 2008 2009 2010 2011 2012 2013 Q1 17.7% 17.8% 16.8% 17.4% 18.3% 20.2% 18.2% 22.6% 17.4% 17.2% 16.9% 16.2% Q2 16.1% 15.9% 15.4% 16.3% 17.1% 17.9% 15.4% 20.6% 15.8% 16.2% 14.9% 15.3% Q3 15.6% 16.0% 15.9% 16.3% 17.5% 18.0% 15.9% 19.8% 16.6% 16.4% 15.6% 14.9% Q4 16.2% 15.8% 16.0% 15.7% 18.3% 17.7% 19.0% 18.3% 17.6% 16.3% 15.8% |
6 Truckload Results Q3 2013 2013 2012 % Change 2013 2012 % Change $265,509 $269,097 -1.3% $798,448 $788,872 1.2% Three months ended September 30 Nine months ended September 30 TRUCKLOAD NET REVENUES in thousands Quarter Year to Date Volume 13% 10% Pricing * 2% 1% Net revenue margin TRUCKLOAD Year over year change *Excluding estimated impact of fuel • North America Truckload volumes grew approximately nine percent in the third quarter when compared to the third quarter of 2012 • North America Truckload cost per mile, excluding the impact of fuel, increased approximately four percent in the third quarter of 2013 when compared to the third quarter of 2012 • North America Truckload price per mile, excluding the impact of fuel, increased approximately two percent in the third quarter of 2013 when compared to the third quarter of 2012 |
7 LTL Results Q3 2013 2013 2012 % Change 2013 2012 % Change $61,436 $58,863 4.4% $180,638 $167,135 8.1% Three months ended September 30 Nine months ended September 30 LTL NET REVENUES in thousands Quarter Year to Date Volume 5% 8% Pricing Net revenue margin LTL Year over year change • Net revenue growth rate slowed in the third quarter when compared to the growth rate in the first two quarters of 2013 • LTL experienced net revenue margin compression in the third quarter of 2013 when compared to the third quarter of 2012 • Carrier costs are increasing industry wide, customer pricing has not kept up with the increase in carrier costs • LTL marketplace remains very competitive |
8 Intermodal Results Q3 2013 • Net revenues up slightly based on price increases and slightly higher margins offset by reduced volume from customers. • The mix of business was improved in the third quarter of 2013 by eliminating some low or unprofitable lanes and added volume from truckload conversion. 2013 2012 % Change 2013 2012 % Change $10,202 $10,074 1.3% $29,223 $29,804 -1.9% Three months ended September 30 Nine months ended September 30 INTERMODAL NET REVENUES in thousands Quarter Year to Date Volume Pricing Net revenue margin Year over year change |
9 Global Forwarding Results Q3 2013 Ocean, Air and Customs 2013 2012 % Change 2013 2012 % Change Ocean $49,692 $18,498 168.6% $141,304 $51,217 175.9% Air $18,137 $9,046 100.5% $55,107 $28,496 93.4% Customs $8,932 $4,109 117.4% $27,307 $11,443 138.6% Three months ended September 30 Nine months ended September 30 NET REVENUES in thousands Quarter Year to Date Volume Pricing Net revenue margin OCEAN Quarter Year to Date Volume Pricing Net revenue margin AIR Year over year change Year over year change • Significant net revenue increases resulting from the acquisition of Phoenix International • In the third quarter, CHRW was the #1 NVOCC from China, Eastbound (ranking based on TEU’s shipped in the third quarter of 2013) |
10 Phoenix Integration Update • Global Forwarding results through three quarters on track with the acquisition plan • Year one integration plan, on track with good results to date • Year two integration initiatives include, systems conversions and sales activities from the combined global forwarding network 2013 2012 % Change Actual C.H. Robinson net revenue $76,761 $31,653 142.5% Phoenix net revenue * $42,323 Total * $76,761 $73,976 3.8% Three months ended September 30 OCEAN, AIR, AND CUSTOMS NET REVENUE In thousands * See Appendices A and C for reconciliation information for 2012 periods 2013 2012 % Change $223,718 $91,156 145.4% $125,243 $223,718 $216,399 3.4% Nine months ended September 30 |
11 Other Logistics Services Results Q3 2013 • Other Logistics Services net revenues include transportation management services, warehousing and small parcel • These services continue to perform well and the sales pipeline is strong 2013 2012 % Change 2013 2012 % Change $16,070 $13,087 22.8% $50,348 $42,029 19.8% Three months ended September 30 Nine months ended September 30 NET REVENUES in thousands |
12 Sourcing Results Q3 2013 • Low crop yields due primarily to weather drove higher cost of goods sold and a disruption in planned supply • Lost certain commodity business with a significant customer • Case volume decreased approximately one percent in the third quarter of 2013 compared to the third quarter of 2012 • Our foodservice business segment experiencing growth with existing customers and through the addition of new customers in the third quarter of 2013 compared to the third quarter of 2012 2013 2012 % Change 2013 2012 % Change Total revenues $432,373 $418,377 3.3% $1,287,036 $1,240,704 3.7% Total net revenues $30,553 $33,747 -9.5% $101,151 $105,895 -4.5% Net revenue margin 7.1% 8.1% -12.4% 7.9% 8.5% -7.9% Three months ended September 30 Nine months ended September 30 SOURCING in thousands |
13 2013 2012 % Change 2013 2012 % Change Net cash provided by operating activities $124,658 $157,128 -20.7% $182,929 $267,156 -31.5% Capital expenditures, net $11,659 $13,921 -16.2% $34,236 $38,891 -12.0% Three months ended September 30 Nine months ended September 30 September 30, 2013 Cash & investments $129,723 Current assets $1,753,441 Total assets $2,891,568 Debt $850,000 Current liabilities $1,306,231 Stockholders’ investment $988,563 CASH FLOW DATA BALANCE SHEET DATA Other Financial Information In thousands, except share and per share amounts • Strong operating cash flow quarter • Total debt $850 million • Borrowed $500 million during the quarter • Average duration 15 years • Average coupon 4.28% |
14 Repurchases of Common Stock in thousands except per share Q3 2013 YTD through Sept. 30, 2013 ASR Other Activity Total ASR Other Activity Total Shares 6,119 1,219 7,338 6,119 3,671 9,790 Average price per share $59.24 $59.80 Total cost of shares $72,198 $219,556 • Year to date total includes the shares withheld on the delivery of restricted shares to employees • $500 million Accelerated Share Repurchase (ASR) initiated on August 26, 2013 • 6.1 million shares delivered upon initial purchase, approximately 70% of total expected shares • Share repurchases under the ASR program will terminate between December 11, 2013 and April 16, 2014 at the discretion of the participating banks • Final number of shares acquired will be based upon the average of the daily VWAP, less and agreed to discount, during the duration or the share repurchase program • Balance of shares purchased, will be delivered upon termination of the program |
15 A look ahead • The truckload environment remains challenging and it will be difficult to grow our earnings in the fourth quarter of 2013 • We will continue to invest in our business, including our focus on; • Market Share Gains • Global Forwarding network • European Network • Management Services • Share repurchases and evaluation of potential M&A opportunities • We have confidence in our long term strategy and will discuss key initiatives during the Investor Day event on November 19 |
16 Appendix A: Q3 2012 Actual to Pro Forma Reconciliation In thousands Three months ended September 30 1. Adjustments have been made to historical Phoenix operations for addition of amortization expense of finite- lived intangible assets recorded in connection with the acquisition ($4.1 million), rent expense for lease agreements entered into in connection with the acquisition ($84 thousand), and depreciation on a building acquired in the acquisition ($37 thousand). An adjustment has also been made to reduce purchased transportation and related services ($7.3 million) and other selling, general, and administrative expenses ($13.5 million) and to increase personnel expenses ($20.8 million) to conform to C.H. Robinson’s historical financial reporting presentation. There were no pro forma adjustments to the T-Chek historical results. 2. Net revenues are our total revenues less purchased transportation and related services, including contracted motor carrier, rail, ocean, air, and other costs, and the purchased price and services related to the products we source. |
17 In thousands 2013 Actual 2012 Actual T-Chek Operations Phoenix Operations 2012 Pro Forma % Change Pro Forma Total net revenues $1,391,630 $1,272,939 -$39,333 $125,243 $1,358,849 2.4% Personnel expenses 623,042 539,964 -11,176 61,899 590,687 5.5% Selling, general & admin 225,938 188,622 -8,781 26,352 206,193 9.6% Acquisition amortization 15,113 2,637 - 12,200 14,837 1.9% Total operating expenses 864,093 731,223 -19,957 100,451 811,717 6.5% Income from operations $527,537 $541,716 -$19,376 $24,792 $547,132 -3.6% Percent of net revenue 37.9% 42.6% 49.3% 19.8% 40.3% -6.0% Appendix B: Nine Month 2013 Actual Compared to Nine Month 2012 Pro Forma • 2012 Pro Forma includes the effects of the disposition of T-Chek and acquisition of Phoenix as if they had occurred at the beginning of our 2012 fiscal year. A reconciliation of actual 2012 results to pro forma appears in Appendix C Nine months ended September 30 |
18 Appendix C: Nine Month 2012 Actual to Pro Forma Reconciliation In thousands Nine months ended September 30 1. Adjustments have been made to historical Phoenix operations for addition of amortization expense of finite-lived intangible assets recorded in connection with the acquisition ($12.2 million), rent expense for lease agreements entered into in connection with the acquisition ($252 thousand), and depreciation on a building acquired in the acquisition ($111 thousand). An adjustment has also been made for the elimination of contractual changes in compensation ($5.1 million). An adjustment has also been made to reduce purchased transportation and related services ($21.9 million) and other selling, general, and administrative expenses ($45.1 million) and to increase personnel expenses ($67.0 million) to conform to C.H. Robinson’s historical financial reporting presentation. There were no pro forma adjustments to the T-Chek historical results. 2. Net revenues are our total revenues less purchased transportation and related services, including contracted motor carrier, rail, ocean, air, and other costs, and the purchased price and services related to the products we source. |