Earnings Conference Call – Fourth Quarter 2013 February 5, 2014 John Wiehoff, Chairman & CEO Chad Lindbloom, CFO Tim Gagnon, Director, Investor Relations Exhibit 99.2 |
2 Safe Harbor Statement Except for the historical information contained herein, the matters set forth in this presentation and the accompanying earnings release are forward-looking statements that represent our expectations, beliefs, intentions or strategies concerning future events. These forward-looking statements are subject to certain risks and uncertainties that could cause actual results to differ materially from our historical experience or our present expectations, including, but not limited to such factors as changes in economic conditions, including uncertain consumer demand; changes in market demand and pressures on the pricing for our services; competition and growth rates within the third party logistics industry; freight levels and increasing costs and availability of truck capacity or alternative means of transporting freight, and changes in relationships with existing truck, rail, ocean and air carriers; changes in our customer base due to possible consolidation among our customers; our ability to integrate the operations of acquired companies with our historic operations successfully; risks associated with litigation and insurance coverage; risks associated with operations outside of the U.S.; risks associated with the potential impacts of changes in government regulations; risks associated with the produce industry, including food safety and contamination issues; fuel prices and availability; changes to our capital structure and termination of our accelerated share repurchase program; and the impact of war on the economy; and other risks and uncertainties detailed in our Annual and Quarterly Reports. We have included herein certain non-GAAP financial information, including certain fiscal 2012 information adjusted to reflect an acquisition and a divestiture that occurred during 2012. In addition to helping us assess our operating performance, we believe that these non-GAAP financial measures assist investors in understanding our operations and results. However, non-GAAP results should not be regarded as a substitute for corresponding GAAP measures, and should be viewed in conjunction with our consolidated financial statements prepared in accordance with GAAP. Reconciliations of such non- GAAP information to actual results are set forth in Appendices A, B and C. |
3 Q4 2013 Results 2013 2012 % Change 2013 2012 % Change Total revenues $3,152,882 $2,970,876 6.1% $12,752,076 $11,359,113 12.3% Total net revenues $444,465 $444,632 0.0% $1,836,095 $1,717,571 6.9% Income from operations $155,113 $133,604 16.1% $682,650 $675,320 1.1% Net income $92,952 $256,392 -63.7% $415,904 $593,804 -30.0% Earnings per share (diluted) $0.62 $1.58 -60.8% $2.65 $3.67 -27.8% Three months ended December 31, Twelve months ended December 31, in thousands, except per share amounts • 2012 includes the gain on the sale of T-Chek Systems, Inc. and the acquisition related costs for Phoenix International, Inc. • T-Chek Systems, Inc. was sold on October 16, 2012 • Phoenix was acquired on November 1, 2012 |
4 in thousands 2013 Actual 2012 Pro Forma % Change Pro Forma Total revenues $3,152,882 $3,038,595 3.8% Total net revenues $444,465 $453,782 -2.1% Personnel expenses 203,619 198,307 2.7% Selling, general & admin 80,718 75,006 7.6% Acquisition amortization 5,015 5,022 -0.1% Total operating expenses 289,352 278,335 4.0% Income from operations $155,113 $175,447 -11.6% Percent of net revenue 34.9% 38.7% -9.7% 2013 Actual Compared to 2012 Pro Forma • 2012 Pro Forma includes the effects of the divestiture of T-Chek and acquisition of Phoenix as if they had occurred at the beginning of our 2012 fiscal year. A reconciliation of actual results for the fourth quarter and full year of 2012 to pro forma appears in Appendix A and B • Total revenue growth continues to outpace net revenue growth resulting from margin compression • Income from operations declined as a result of a 2.1% decrease in net revenues and a four percent increase in operating expenses (2013 Actual compared to 2012 Pro Forma) • The Phoenix integration progressed as planned and the Global Forwarding results were strong in the fourth quarter Three months ended December 31, 2013 Actual 2012 Pro Forma % Change Pro Forma $12,752,076 $12,010,326 6.2% $1,836,095 $1,812,631 1.3% 826,661 788,959 4.8% 306,656 279,744 9.6% 20,128 19,859 1.4% 1,153,445 1,088,562 6.0% $682,650 $724,069 -5.7% 37.2% 39.9% -6.8% Twelve months ended December 31, |
5 Transportation Results Q4 2013 • Transportation net revenue margin compression continued in the fourth quarter • Truckload margin compression continued in the fourth quarter 2013 2012 % Change 2013 2012 % Change Total revenues $2,767,550 $2,585,930 7.0% $11,069,710 $9,685,415 14.3% Total net revenues $416,020 $409,141 1.7% $1,698,395 $1,528,137 11.1% Net revenue margin 15.0% 15.8% -5.0% 15.3% 15.8% -2.8% Three months ended December 31, Twelve months ended December 31, TRANSPORTATION in thousands TRANSPORTATION NET REVENUE MARGIN PERCENTAGE 2002 2003 2004 2005 2006 2007 2008 2009 2010 2011 2012 2013 Q1 17.7% 17.8% 16.8% 17.4% 18.3% 20.2% 18.2% 22.6% 17.4% 17.2% 16.9% 16.2% Q2 16.1% 15.9% 15.4% 16.3% 17.1% 17.9% 15.4% 20.6% 15.8% 16.2% 14.9% 15.3% Q3 15.6% 16.0% 15.9% 16.3% 17.5% 18.0% 15.9% 19.8% 16.6% 16.4% 15.6% 14.9% Q4 16.2% 15.8% 16.0% 15.7% 18.3% 17.7% 19.0% 18.3% 17.6% 16.3% 15.8% 15.0% Year 16.3% 16.3% 16.0% 16.3% 17.8% 18.4% 17.0% 20.2% 16.8% 16.5% 15.8% 15.3% |
6 Truckload Results Q4 2013 2013 2012 2013 2012 % Change $256,117 $271,248 -5.6% $1,054,565 $1,060,120 -0.5% Three months ended December 31, Twelve months ended December 31, TRUCKLOAD NET REVENUES in thousands Quarter Year to Date Volume 7% 10% Pricing * 3.5% 2% Net revenue margin TRUCKLOAD Year over year change *Pricing measures represent North America only and excludes estimated impact of the change in fuel • North America Truckload volumes grew approximately six percent in the fourth quarter when compared to the fourth quarter of 2012 • North America Truckload cost per mile, excluding the impact of the change in fuel, increased approximately five percent in the fourth quarter of 2013 when compared to the fourth quarter of 2012 • North America Truckload price per mile, excluding the impact of the change in fuel, increased approximately 3.5 percent in the fourth quarter of 2013 when compared to the fourth quarter of 2012 % Change |
7 LTL Results Q4 2013 2013 2012 % Change 2013 2012 % Change $58,839 $57,025 3.2% $239,477 $224,160 6.8% Three months ended December 31, Twelve months ended December 31, LTL NET REVENUES in thousands Quarter Year to Date Volume 4% 7% Pricing Net revenue margin LTL Year over year change • Net revenue growth rate slowed in the fourth quarter when compared to the growth rate in the first three quarters of 2013 • LTL experienced net revenue margin compression in the fourth quarter of 2013 when compared to the fourth quarter of 2012 • Carrier costs are increasing industry wide, customer pricing has not kept up with the increase in carrier costs • LTL marketplace remains very competitive |
8 Intermodal Results Q4 2013 • Net revenues increase was driven by a change in the mix of business and improved customer pricing • Intermodal volume declined in the fourth quarter of 2013 when compared to the fourth quarter of 2012 2013 2012 % Change 2013 2012 % Change $9,861 $9,011 9.4% $39,084 $38,815 0.7% Three months ended December 31, Twelve months ended December 31, INTERMODAL NET REVENUES in thousands Quarter Year to Date Volume Pricing Net revenue margin Year over year change |
9 Global Forwarding Results Q4 2013 Ocean, Air and Customs 2013 2012 % Change 2013 2012 % Change Ocean $46,367 $33,707 37.6% $187,671 $84,924 121.0% Air $17,982 $15,948 12.8% $73,089 $44,444 64.5% Customs $9,271 $6,782 36.7% $36,578 $18,225 100.7% Three months ended December 31, Twelve months ended December 31, NET REVENUES in thousands Quarter Year to Date Volume Pricing Net revenue margin OCEAN Quarter Year to Date Volume Pricing Net revenue margin AIR Year over year change Year over year change • Net revenue growth across all Global Forwarding Services when compared to the fourth quarter of 2012 • In the fourth quarter, CHRW was again the #1 NVOCC from China, Eastbound and finished the year at #1 (ranking based on TEU’s shipped in the fourth quarter and full year of 2013) |
10 Phoenix Integration Update • Global Forwarding results through four quarters on track with the acquisition plan • Offices, agents, gateways & operational process integrations are complete • Systems integration for Phoenix offices is under way and will continue through 2014 2013 2012 % Change Actual C.H. Robinson net revenue $73,620 $56,437 30.4% Phoenix net revenue * $11,440 Total * $73,620 $67,877 8.5% Three months ended December 31, OCEAN, AIR, AND CUSTOMS NET REVENUE in thousands * See Appendices A and B for reconciliation information for 2012 periods 2013 2012 % Change $297,338 $147,593 101.5% $136,683 $297,338 $284,276 4.6% Twelve months ended December 31, |
11 Other Logistics Services Results Q4 2013 • Other Logistics Services net revenues include transportation management services, warehousing and small parcel • These services continued to perform well and the sales pipeline is strong 2013 2012 % Change 2013 2012 % Change $17,583 $15,420 14.0% $67,931 $57,449 18.2% Three months ended December 31, Twelve months ended December 31, NET REVENUES in thousands |
12 Sourcing Results Q4 2013 • Continued volume and net revenue decreases from a large customer, impact will continue in 2014 • Case volume decreased approximately two percent in the fourth quarter of 2013 when compared to the fourth quarter of 2012 • Sourcing margins were impacted by weather and a change in our commodity and service mix 2013 2012 % Change 2013 2012 % Change Total revenues $382,098 $379,479 0.7% $1,669,134 $1,620,183 3.0% Total net revenues $25,799 $30,543 -15.5% $126,950 $136,438 -7.0% Net revenue margin 6.8% 8.0% -16.1% 7.6% 8.4% -9.7% Three months ended December 31, Twelve months ended December 31, SOURCING in thousands |
13 Three months ended December 31 Twelve months ended December 31 December 31, 2013 Cash & investments $162,047 Current assets $1,664,485 Total assets $2,802,818 Debt $875,000 Current liabilities $1,269,981 Stockholders’ investment $939,724 CASH FLOW DATA BALANCE SHEET DATA Other Financial Information in thousands • Strong operating cash flow • Total debt $875 million • $500 million, 15 year average duration, 4.28% weighted average coupon • $375 million drawn on revolver, 1.67% current rate 2013 2012 % Change 2013 2012 % Change Net cash provided by operating activities - actual/reported $164,848 $193,186 -14.7% $347,777 $460,342 -24.5% Adjust: Impact of accrued income taxes -11,830 103,853 -105,857 104,542 Net cash provided by operating activities - adjusted $176,678 $89,333 97.8% $453,634 $355,800 27.5% Capital expenditures, net $13,970 $11,765 18.7% $48,206 $50,656 -4.8% |
14 Repurchases of Common Stock in thousands, except per share Q4 2013 YTD through December 31, 2013 ASR Other Activity Total ASR Other Activity Total Shares 1,195 1,540 2,735 7,314 5,211 12,525 Average price per share $59.04 $59.57 Total cost of shares $90,923 $310,449 • Other activity includes the shares withheld on the delivery of restricted shares to employees • $500 million Accelerated Share Repurchase (ASR) initiated on August 26, 2013 • 6.1 million shares delivered upon initial purchase, approximately 70% of total expected shares • One of the two banks terminated their ASR plan and delivered 1.2 million shares • The remaining ASR plan will terminate on or before April 16, 2014 at the banks discretion • Final number of shares delivered to CHR will be based upon the average of the daily VWAP, less an agreed to discount of .94% during the duration of the ASR plan • Balance of shares under the ASR calculation will be delivered upon termination of the plan |
15 2014 Thoughts and Initiatives • Our long term growth targets assume margin stabilization, margins continued to compress throughout 2013 • Net revenues decreased in January 2014 when compared to January 2013 • Pricing will be a high priority in 2014 • Growth continues to be our top priority through leveraging our current resources CAGR 1997-2007 CAGR 2007-2012 Long Term Growth Target Total revenue growth 15% 9% 6-11% Net revenue growth 20% 7% 5-10% Income from operations growth 25% 7% 5-10% Diluted earnings per share growth 24% 8% 7-12% |
16 Appendix A: Q4 2012 Actual to Pro Forma Reconciliation in thousands Three months ended December 31, * See next slide for explanation of footnotes 1, 2 & 3 |
17 Appendix A: Q4 2012 Actual to Pro Forma Reconciliation 1. The adjustment to personnel consists of $33 million of incremental vesting expense of our equity awards triggered by the gain on the divestiture of T-Chek. The balance consists of transaction-related bonuses. The adjustments to other operating expenses reflect fees paid to third parties for investment banking fees related to the acquisition of Phoenix and external legal and accounting fees related to the acquisitions of Apreo and Phoenix and the divestiture of T-Chek. The adjustment to investment and other income reflects the gain from the divestiture of T-Chek. The adjustment to diluted weighted average shares outstanding relates to the shares of C.H. Robinson stock issued as consideration paid to the sellers in the acquisition of Phoenix and the additional vesting of performance-based restricted stock as a result of the gain on sale recognized from the divestiture of T-Chek. 2. Adjustments have been made to historical Phoenix operations for the addition of amortization expense of finite-lived intangible assets recorded in connection with the acquisition ($1.4 million), rent expense for lease agreements entered into in connection with the acquisition ($28 thousand), depreciation on a building acquired in the acquisition ($12 thousand), and incremental interest expense on the borrowings associated with the acquisition ($213 thousand). Adjustments have been made for the elimination of additional bonuses ($1.4 million) and third party advisory fees ($582 thousand) paid by Phoenix. An adjustment has also been made to reduce purchased transportation and related services ($2.5 million) and other selling, general, and administrative expenses ($5.0 million) and to increase personnel expenses ($7.5 million) to conform to C.H. Robinson’s historical financial reporting presentation. The adjustment to diluted weighted average shares outstanding relates to the shares of C.H. Robinson stock issued as consideration paid to the sellers in the acquisition of Phoenix. There were no pro forma adjustments to the T-Chek historical results. 3. Net revenues are our total revenues less purchased transportation and related services, including contracted motor carrier, rail, ocean, air, and other costs, and the purchased price and services related to the products we source. |
18 Appendix B: 2012 Actual to Pro Forma Reconciliation in thousands Twelve months ended December 31, * See next slide for explanation of footnotes 1, 2 & 3 |
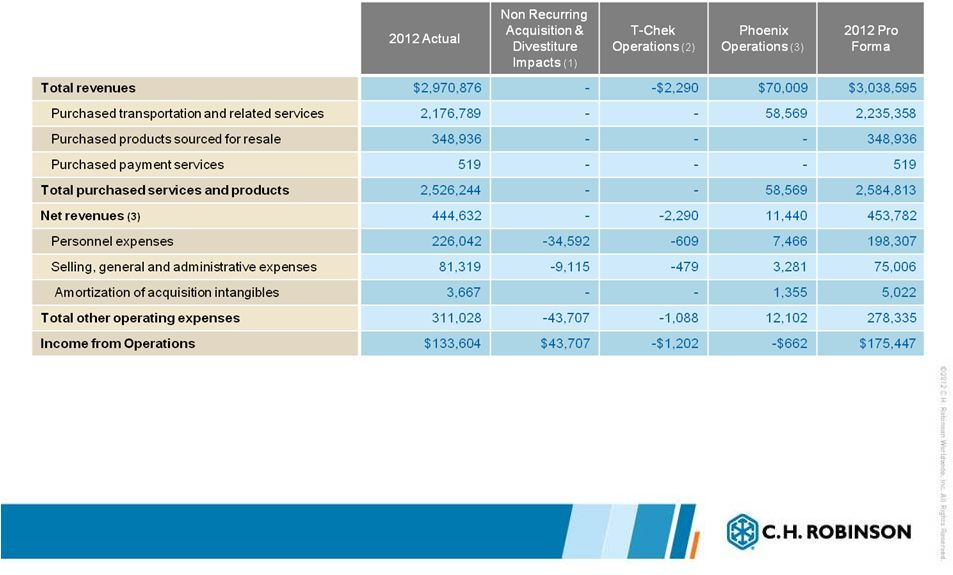
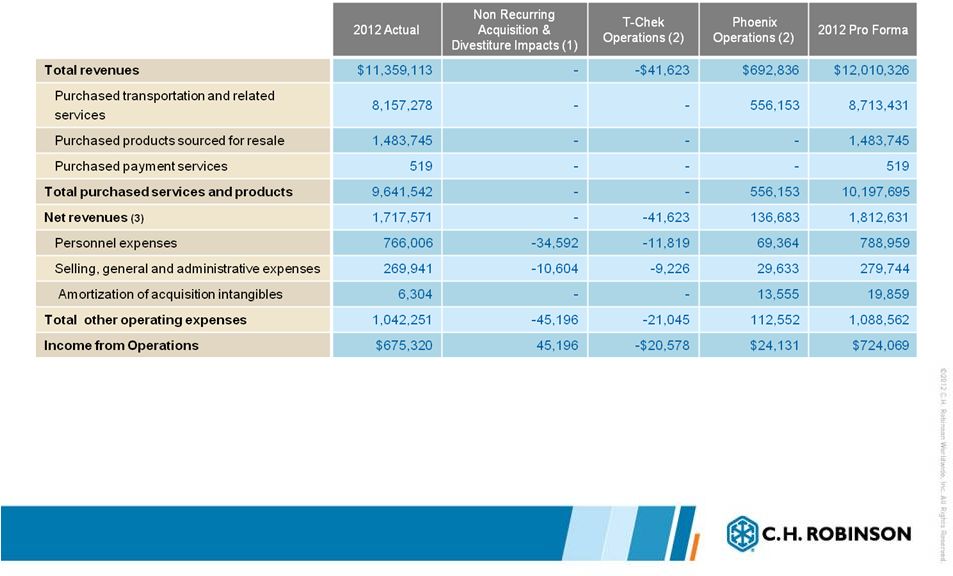
19 Appendix B: Twelve Month 2012 Actual to Pro Forma Reconciliation 1. The adjustment to personnel consists of $33 million of incremental vesting expense of our equity awards triggered by the gain on the divestiture of T-Chek. The balance consists of transaction-related bonuses. The adjustments to other operating expenses reflect fees paid to third parties for investment banking fees related to the acquisition of Phoenix and external legal and accounting fees related to the acquisitions of Apreo and Phoenix and the divestiture of T-Chek. The adjustment to investment and other income reflects the gain from the divestiture of T-Chek. The adjustment to diluted weighted average shares outstanding relates to the shares of C.H. Robinson stock issued as consideration paid to the sellers in the acquisition of Phoenix and the additional vesting of performance-based restricted stock as a result of the gain on sale recognized from the divestiture of T-Chek. 2. Adjustments have been made to historical Phoenix operations for addition of amortization expense of finite-lived intangible assets recorded in connection with the acquisition ($13.6 million), rent expense for lease agreements entered into in connection with the acquisition ($280 thousand), depreciation on a building acquired in the acquisition ($123 thousand), and incremental interest expense on the borrowings associated with the acquisition ($2.1 million). Adjustments have been made for the elimination of contractual changes in compensation ($5.1 million), and additional bonuses ($1.4 million) and third party advisory fees ($582 thousand) paid by Phoenix. An adjustment has also been made to reduce purchased transportation and related services ($24.4 million) and other selling, general, and administrative expenses ($50.1 million) and to increase personnel expenses ($74.5 million) to conform to C.H. Robinson’s historical financial reporting presentation. The adjustment to diluted weighted average shares outstanding relates to the shares of C.H. Robinson stock issued as consideration paid to the sellers in the acquisition of Phoenix. There were no pro forma adjustments to the T-Chek historical results. 3. Net revenues are our total revenues less purchased transportation and related services, including contracted motor carrier, rail, ocean, air, and other costs, and the purchased price and services related to the products we source. |