Exhibit 99.1

C.H. ROBINSON INVESTOR DAY 2017 Wednesday, May 3, 2017
SAFE HARBOR STATEMENT
This presentation includes forward-looking statements which are subject to risk and uncertainties that could cause actual results to differ materially, including changes in market demand and pressures on the pricing for our services, freight levels and increasing costs and availability of trucking and other transportation alternatives, our ability to integrate the operations of acquired businesses and those risks and uncertainties detailed in our most recently filed Annual Report on Form10-K and Quarterly Report on Form10-Q. We have included herein certainnon-GAAP financial information, including certain fiscal 2012 information adjusted to reflect an acquisition and a divestiture that occurred during 2012. Reconciliations of suchnon-GAAP information to actual results are available in our press release dated February 5, 2013 furnished as an exhibit to our Form8-K filing of the same date. 2

WELCOME AND AGENDA REVIEW Tim Gagnon Director of Investor Relations
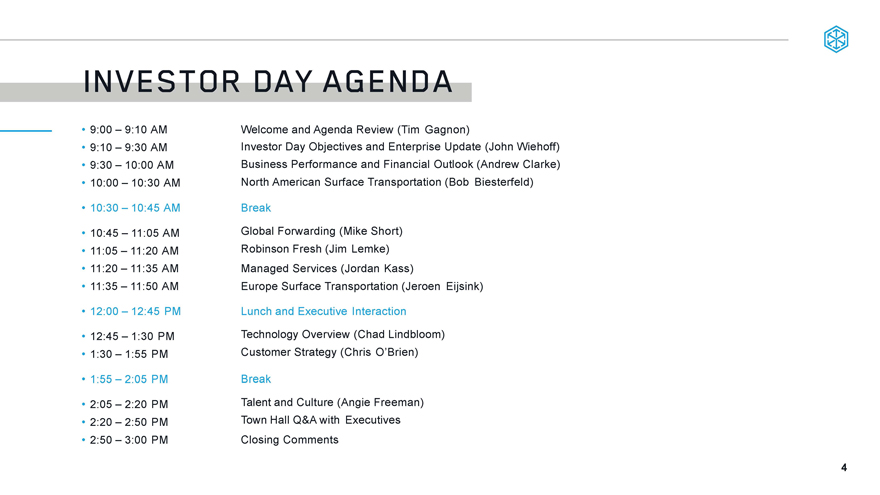
INVESTOR DAY AGENDA 9:00 – 9:10 AM Welcome and Agenda Review (Tim Gagnon) 9:10 – 9:30 AM Investor Day Objectives and Enterprise Update (John Wiehoff) 9:30 – 10:00 AM Business Performance and Financial Outlook (Andrew Clarke) 10:00 – 10:30 AM North American Surface Transportation (Bob Biesterfeld) 10:30 – 10:45 AM Break 10:45 – 11:05 AM Global Forwarding (Mike Short) 11:05 – 11:20 AM Robinson Fresh (Jim Lemke) 11:20 – 11:35 AM Managed Services (Jordan Kass) 11:35 – 11:50 AM Europe Surface Transportation (Jeroen Eijsink) 12:00 – 12:45 PM Lunch and Executive Interaction 12:45 – 1:30 PM Technology Overview (Chad Lindbloom) 1:30 – 1:55 PM Customer Strategy (Chris O’Brien) 1:55 – 2:05 PM Break 2:05 – 2:20 PM Talent and Culture (Angie Freeman) 2:20 – 2:50 PM Town Hall Q&A with Executives 2:50 – 3:00 PM Closing Comments 4
INVESTOR DAY OBJECTIVES AND ENTERPRISE UPDATE John Wiehoff Chairman, President, and Chief Executive Officer
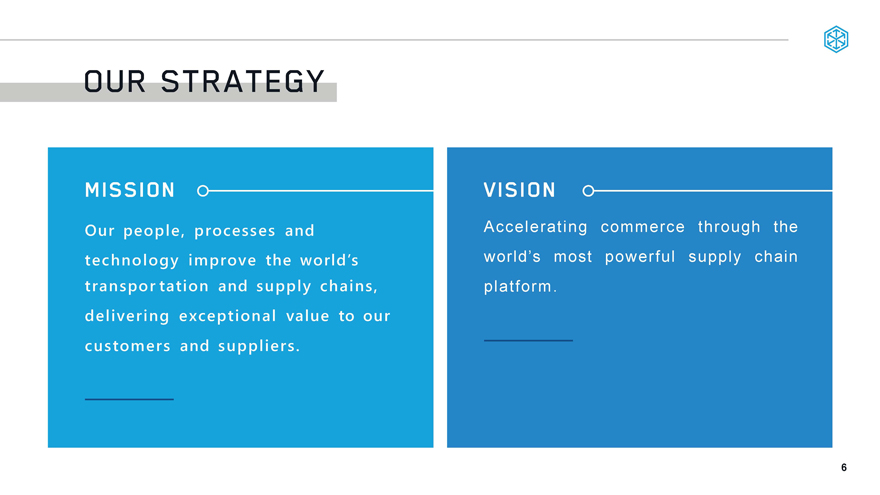
OUR STRATEGY MISSION Our people, processes and technology improve the world’s transportation and supply chains, delivering exceptional value to our customers and suppliers. VISION Accelerating commerce through the world’s most powerful supply chain platform. 6
HOW WE DO IT PEOPLE PROCESS TECHNOLOGY 7
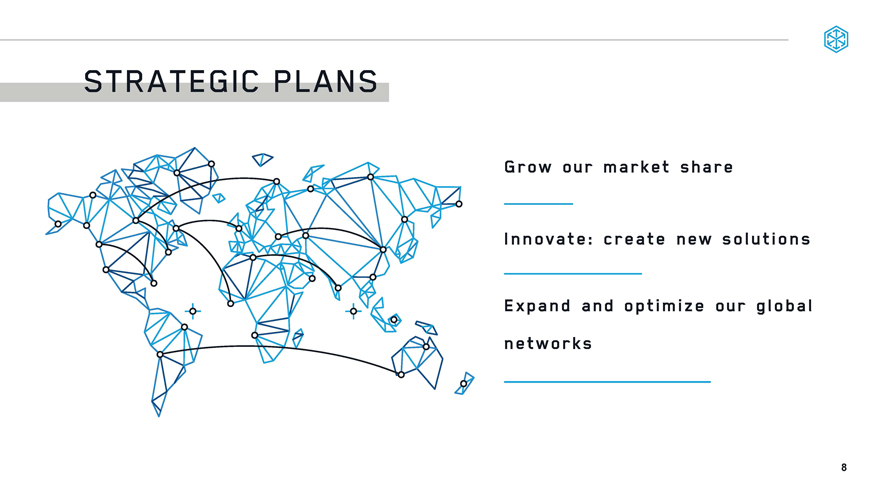
STRATEGIC PLANS Grow our market share Innovate: create new solutions Expand and optimize our global networks 8
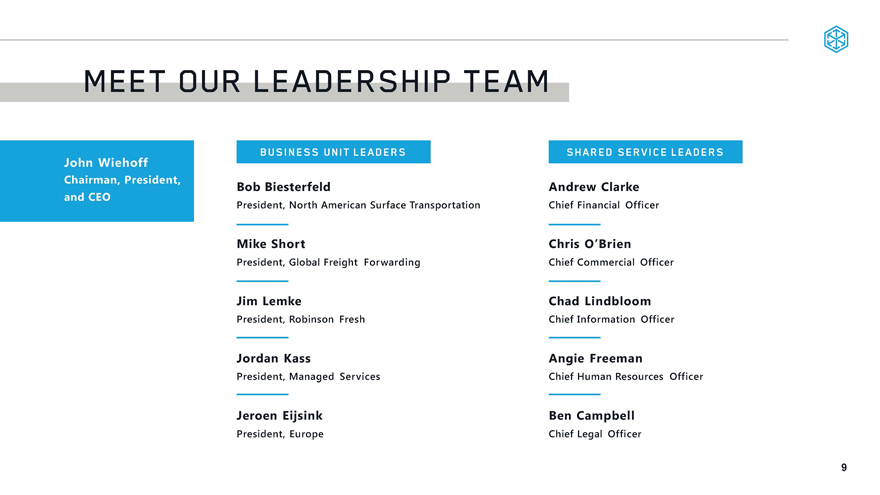
MEET OUR LEADERSHIP TEAM John Wiehoff Chairman, President, and CEO BUSINESS UNIT LEADERS Bob Biesterfeld President, North American Surface Transportation Mike Short President, Global Freight Forwarding Jim Lemke President, Robinson Fresh Jordan Kass President, Managed Services Jeroen Eijsink President, Europe SHARED SERVICE LEADERS Andrew Clarke Chief Financial Officer Chris O’Brie Chief Commercial Officer Chad Lindbloom Chief Information Officer Angie Freeman Chief Human Resources Officer Ben Campbell Chief Legal Officer 9
BUSINESS PERFORMANCE AND FINANCIAL OUTLOOK Andrew Clarke Chief Financial Officer
FINANCIAL HEALTH FREE CASH FLOW & SHAREHOLDER RETURNS HISTORICAL DEBT & EQUITY RETURN ACCUMULATED CAPITAL ALLOCATION SEGMENT RATIONALE ENTERPRISE STRATEGY AND MBA BUSINESS OUTLOOK—GROWTH TARGETS 11
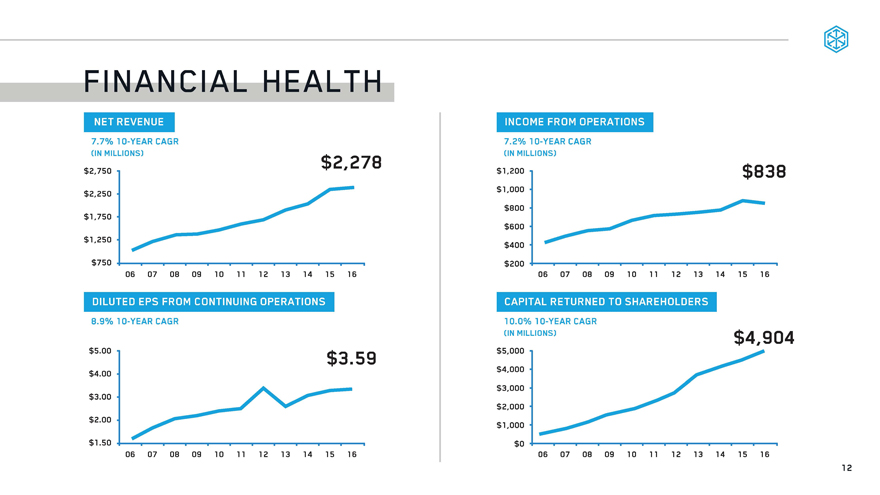
FINANCIAL HEALTH 7.7%10-YEAR CAGR (IN MILLIONS) $2,750 $2,250 $4,904 $2,278 $1,750 $1,250 $750 06 07 08 09 10 11 12 13 14 15 16 DILUTED EPS FROM CONTINUING OPERATIONS 8.9% 1010-YEAR CAGR $5.00 $4.00 $3.00 $2.00 06 07 08 09 10 11 12 13 14 15 16 $3.59 INCOME FROM OPERATIONS 7.2%10-YEAR CAGR (IN MILLIONS) $1,200 $1,000 $800 $600 $400 $200 06 07 08 09 10 11 12 13 14 15 16 CAPITAL RETURNED TO SHAREHOLDERS 10.0%10-YEAR CAGR (IN MILLIONS) $5,000 $4,000 $3,000 $2,000 $1,000 $0 06 07 08 09 10 11 12 13 14 15 16 12
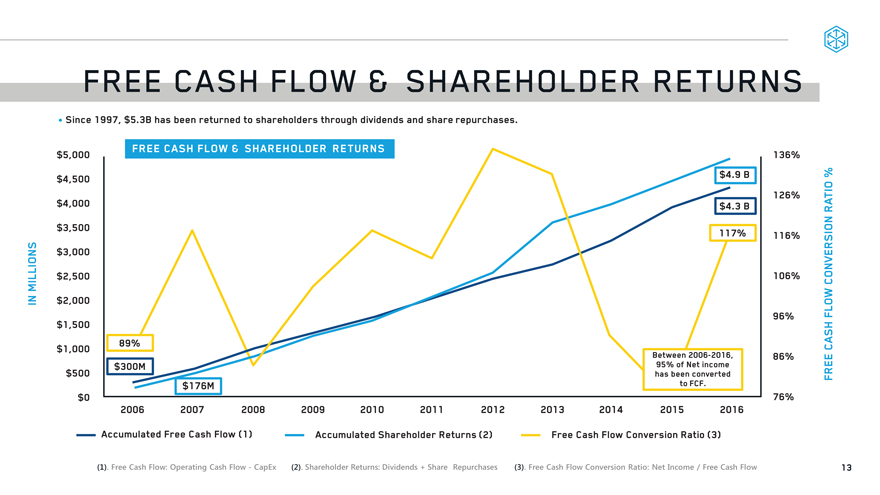
Free Cash Flow Conversion Ratio (3) Accumulated Free Cash Flow (1) FREE CASH FLOW & SHAREHOLDER RETURNS Since 1997, $5.3 B has been returned to shareholders through dividends and share repurchases. Accumulated Shareholder Returns (2) (1). Free Cash Flow: Operating Cash Flow - CapEx (2). Shareholder Returns: Dividends + Share Repurchases (3). Free Cash Flow Conversion Ratio: Net Income / Free Cash Flow IN MILLIONS Between 2006-2016, 95% of Net income has been converted to FCF. 2006 2007 2008 2009 2010 2011 2012 2013 2014 2015 $5,000 $4,500 $4,000 $3,500 $3,000 $2,500 $2,000 $1,500 $1,000 $500 $0 £ (1).FreeCashFlow:OperatingCashFlow-CapEx (2). Shareholder Returns: Dividends + Share Repurchases(3).FreeCashFlowConversionRatio:NetIncome/FreeCashFlow 13
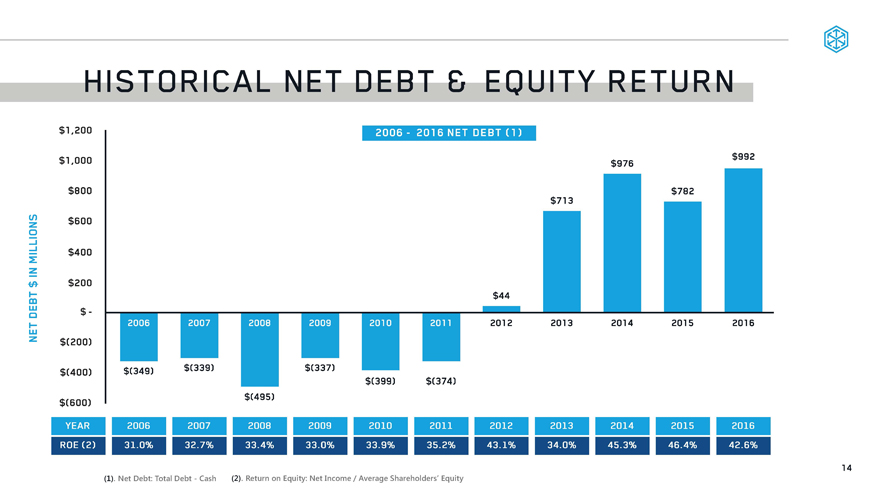
HISTORICAL NET DEBT & EQUITY RETURN 2006 – 2016 NET DEBT (1) $1,200 $1,000 $800 $600 $400 $200 $- $(200) $(400) $(600) 2006 2007 2008 2009 2010 2011 2012 2013 2014 2015 2016 $976 $992 YEAR 2006 2007 2008 ROE (2) 31.0% 32.7% 33.4% 2009 2010 2011 2012 $(349) $(339) $(495) $(337) $(399) $(374) 33.0% 33.9% 35.2% 43.1% 2013 2014 2015 2016 34.0% 45.3% 46.4% 42.6% (1) . Net Debt: Total Debt—Cash (2). Return on Equity: Net Income / Average Shareholders’ Equity 14
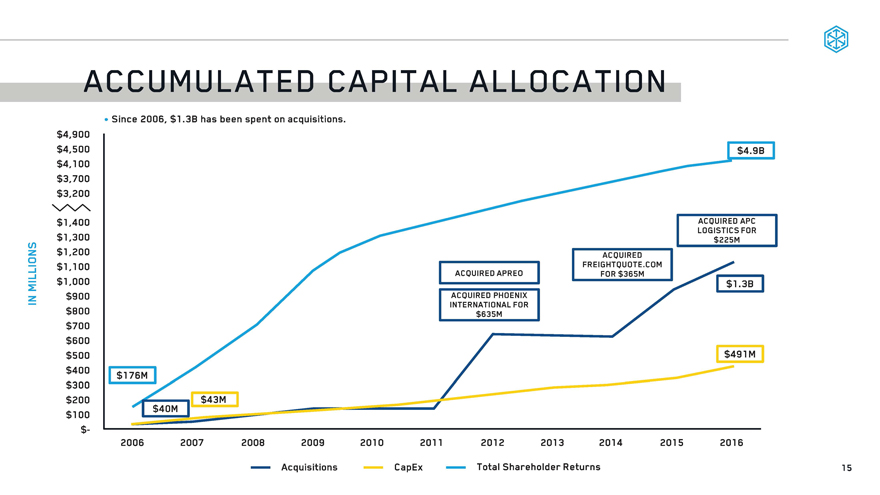
ACCUMULATED CAPITAL ALLOCATION Since 2006, $1.3B has been spent on acquisitions. $4,900 $4,500 $4,100 $3,700 $3,200 $1,400 $1,300 $1,200 $1,100 $1,000 $900 $800 $700 $600 $500 $400 $300 $200 $100 $- $4.9B ACQUIRED PHOENIX INTERNATIONAL FOR $635M ACQUIRED FREIGHTQUOTE.COM FOR $365M ACQUIRED APC LOGISTICS FOR $225M $1.3B $491 M 2006 2007 2008 2009 2010 2011 2012 2013 2014 2015 2016 Acquisitions CapEx Total Shareholder Returns 15
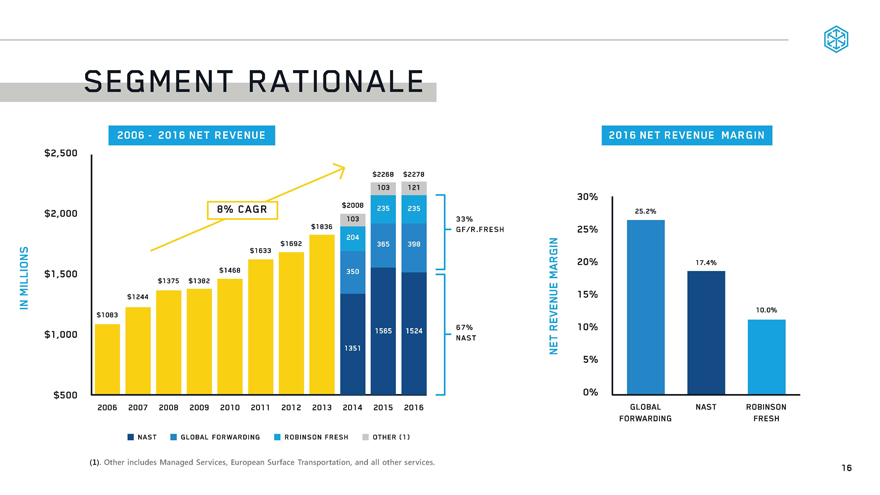
SEGMENT RATIONALE 2006 – 2016 NET REVENUE IN MILLIONS 8% CARG $2,500 $2,000 $1,500 $1,000 $500 $1083 $1244 $1375 $1382 $1468 $1692 $1836 $2008 $2268 $2278 103 103 121 204 350 1351 103 235 365 1565 121 235 398 1524 33% GF/R.FRESH 67% NAST NAST GLOBAL FORWARDING ROBINSON FRESH OTHER (1) (1). Other includes Managed Services, European Surface Transportation, and all other services. 16
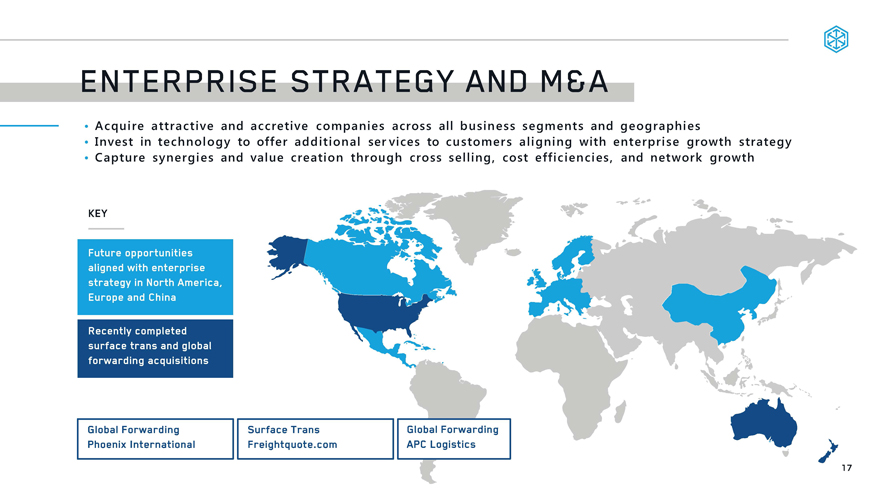
ENTERPRISE STRATEGY AND M&A Acquire attractive and accretive companies across all business segments and geographies • Invest in technology to offer additional services to customers aligning with enterprise growth strategy • Capture synergies and value creation through cross selling, cost efficiencies, and network growth Future opportunities aligned with enterprise strategy in North America, Europe and China Recently completed surface trans and global forwarding acquisitions Global Forwarding Surface Trans Global Forwarding Phoenix International Freightquote.com APC Logistics 17
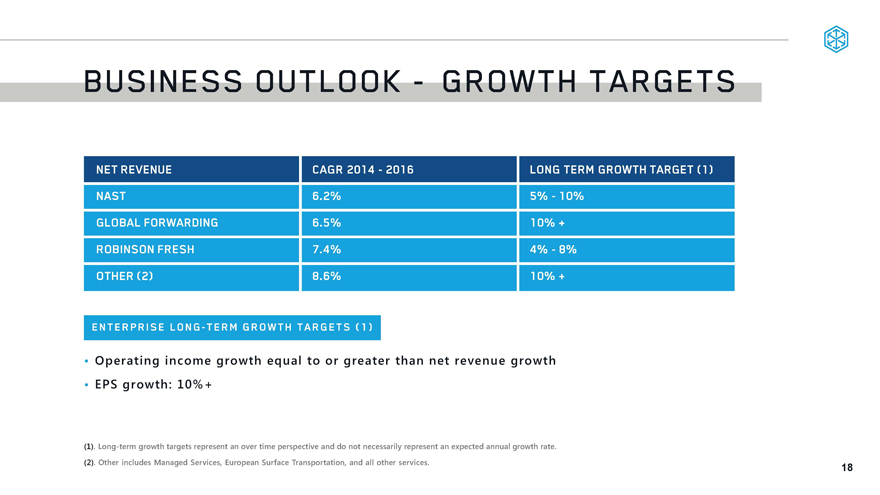
BUSINESS OUTLOOK—GROWTH TARGETS NET REVENUE NAST GLOBAL FORWARDING ROBINSON FRESH OTHER (2) CAGR 2014 – 2016 6.2% 6.5% 7.4 % 8.6% LONG TERM GROWTH TARGET (1) 5%—10% 10% + 4%—8% 10% ENTERPRISE LONG-TERM GROWTH TARGETS (1) • Operating income growth equal to or greater than net revenue growth • EPS growth: 10% + (1) . Long-term growth targets represent an over time perspective and do not necessarily represent an expected annual growth rate. (2) . Other includes Managed Services, European Surface Transportation, and all other services. 18
NORTH AMERICAN TRANSPORTATION Bob Biesterfeld President, North American Surface Transportation
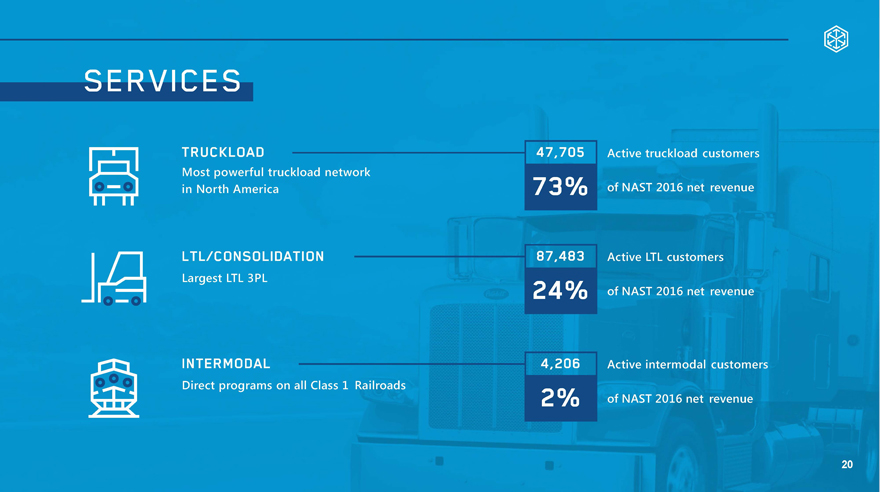
SERVICES TRUCKLOAD Most powerful truckload network in North America LTL/CONSOLIDATION Largest LTL BPL INTERMODAL Direct programs on all Class 1 Railroads 47,705 73% 87,483 24% 4,206 2% Active truckload customers of NAST 2016 net revenue Active LTL customers of NAST 2016 net revenue Active intermodal customers of NAST 2016 net revenue 20
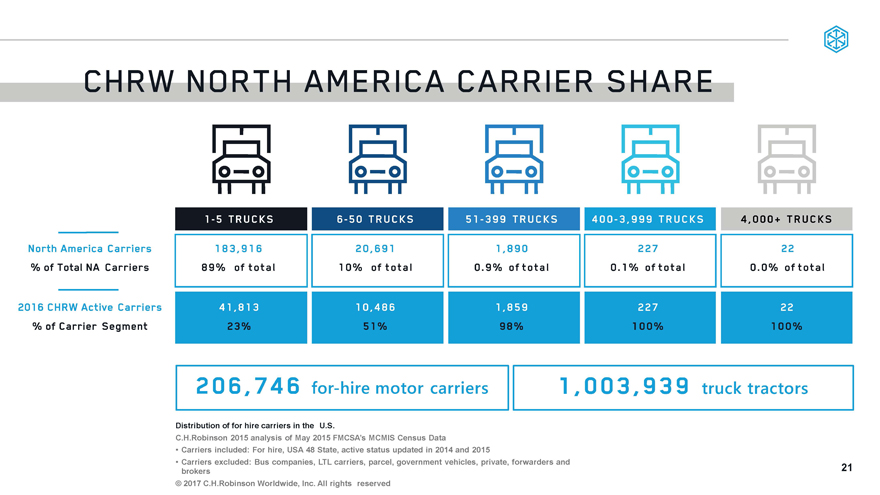
CHRW NORTH AMERICA CARRIERSHARE1-5TRUCKS6-50 TRUCKS41,8131 0,486North America Carriers % of Total NA Carriers183,916 89% of total 1,890 0.9% of total20,691 10% of total4,000+ TRUCKS227 0.1% of total220.0% of total2016 CHRW Active Carriers % of Carrier Segment23%98%51206,746for-hire motor carriersDistribution of for hire carriers in the U.S.C.H.Robinson 2015 analysis of May 2015 FMCSA’s MCMIS Census DataCarriers included: For hire, USA 48 State, active status updated in 2014 and 2015Carriers excluded: Bus companies, LTL carriers, parcel, government vehicles, private, forwarders and brokers© 2017 C.H.Robinson Worldwide, Inc. All rights reserved 21
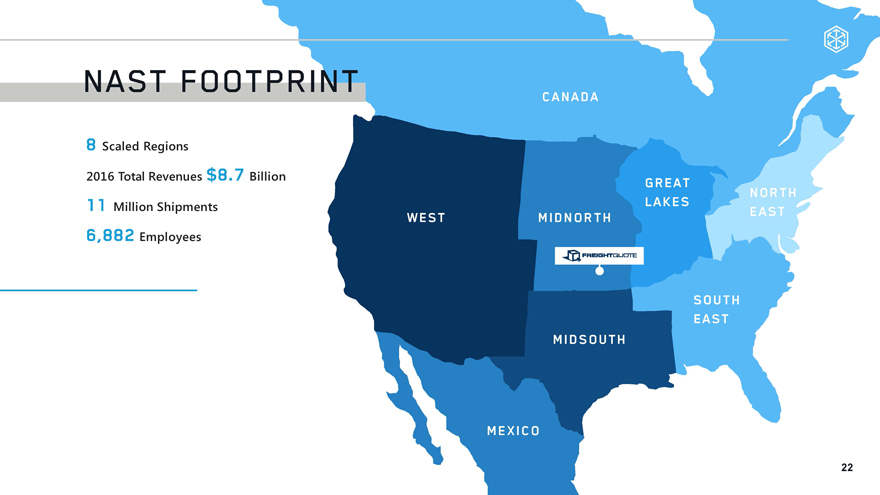
NAST FOOTPRINTScaled Regions 2016 Total Revenues $8.7 Billion 1 1 Million Shipments6,882 Employees
WEST MIDNORTH GREAT LAKES NORTH EAST SOUTH EAST MIDSOUTH MEXICO CANADA FREIGHTQOUTE 22
TRANSFORMATIO
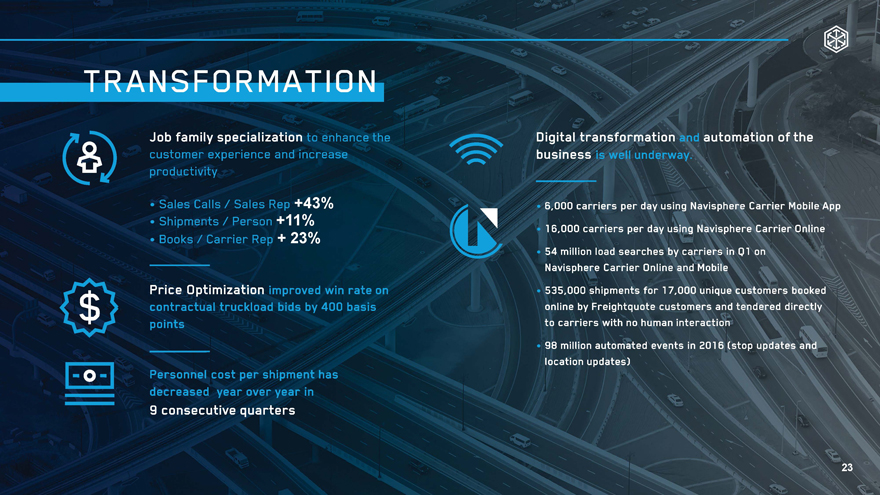
Job family specialization to enhance the customer experience and increase productivity Sales Calls / Sales Rep +43%Shipments / Person +11%Books / Carrier Rep + 23%Price Optimization improved win rate on contractual truckload bids by 400 basis points Personnel cost per shipment has decreased year over year inconsecutive quarters Digital transformation automation of the business e I underway. 6,000 carriers per day using Navisphere Carrier Mobile Appcarriers per day using Navisphere Carrier Online54 million load searches by carriers in Q1 on Navisphere Carrier Online and Mobile shipments for 17,000 unique customers booked online by Freight quote customers and tendered directly to carriers with no human interaction98 million automated events in 2016 (stop updates and location updates) 23
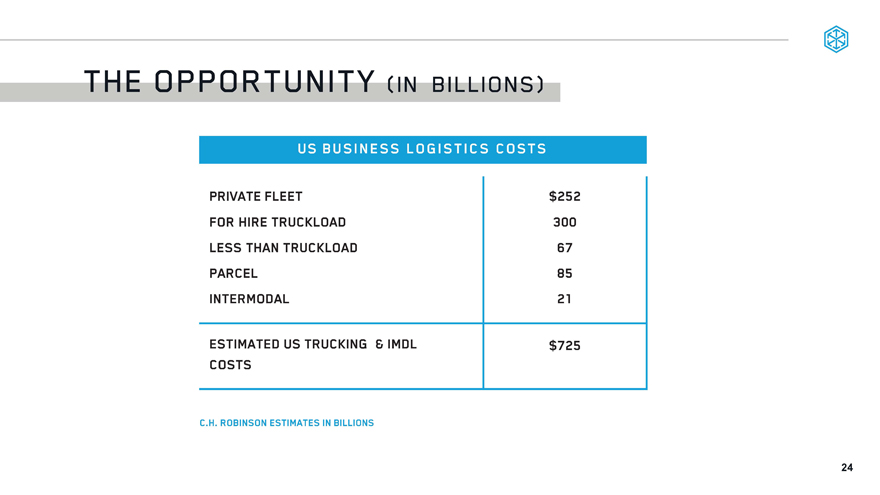
THE OPPORTUNITY (in billions)US BUSINESS LOGISTICS COSTSPRIVATE FLEET$252FOR HIRE TRUCKLOAD300LESS THAN TRUCKLOAD67PARCEL85INTERMODAL21ESTIMATED US TRUCKING & IMDL COSTS$725
C.H. ROBINSON ESTIMATES IN BILLIONS 24
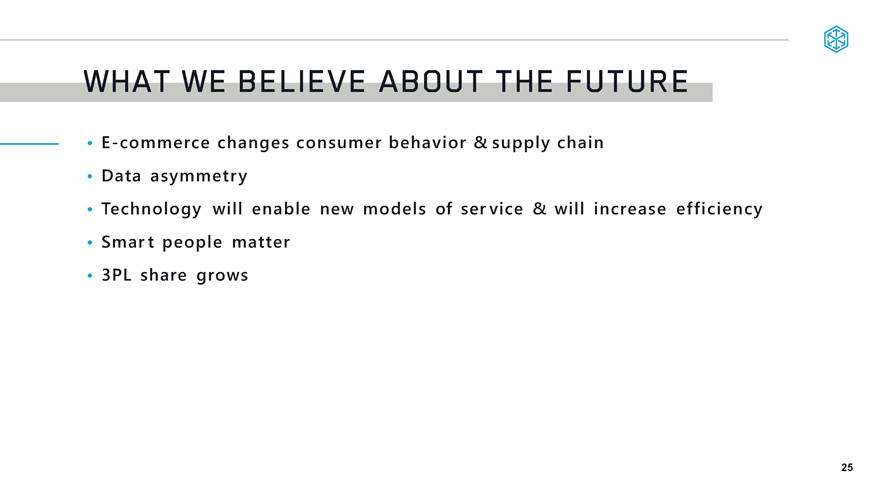
WHAT WE BELIEVE ABOUT THEFUTUREE-commerce changes consumer behavior &supply chain Data asymmetry Technology will enable new models of service & will increase efficiency Smart people matter3PL share grows 26
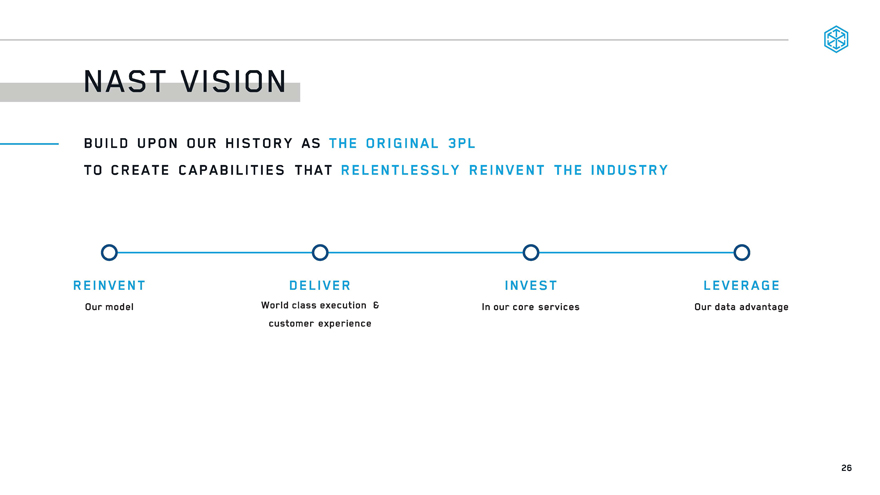
NAST VISIONBUILD UPON OUR HISTORY AS THE ORIGINAL 3PLTO CREATE CAPABILITIES THAT RELENTLESSLY REINVENT THE INDUSTRY
REINVENT Our model DELIVER World class execution 6 customer experience INVEST In our core services
LEVERAGE Our data advantage 26
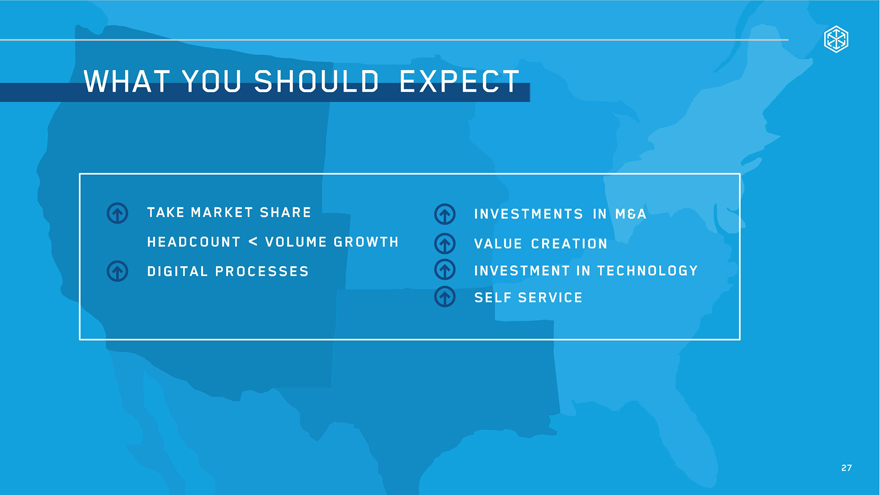
WHAT YOU SHOULD EXPECT
TAKE MARKET SHARE HEADCOUTN < VOLUME GROWTH DIGITAL PROCESSES INVESTMENTS IN M& A VALUE CREATION INVESTMENT IN TECHNOLOGY SELF SERVICE 27
GLOBAL FORWARDING Mike Short President, Global Freight Forwarding
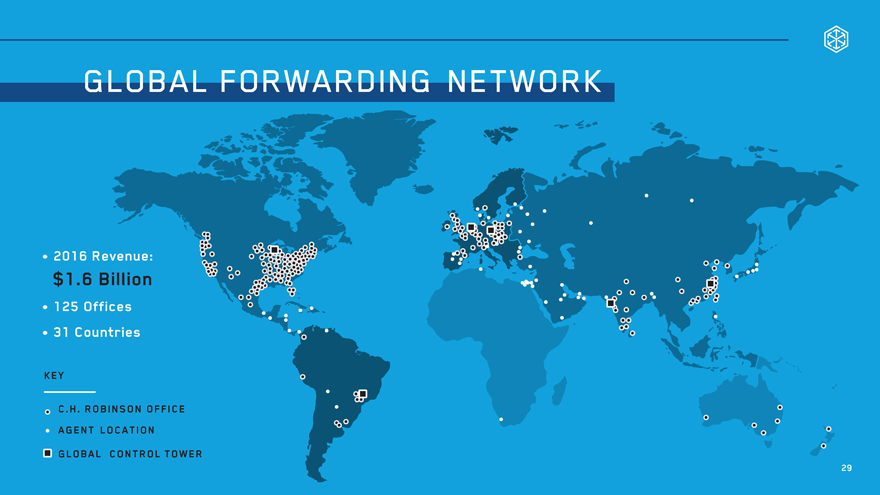
GLOBAL FORWARDING NETWORK 2016 Revenue: $1.6 Billion 125 Offices31 Countries KEY. C.H. ROBINSON OFFICEGENT LOCATION? GLOBAL CONTROL TOWER
29
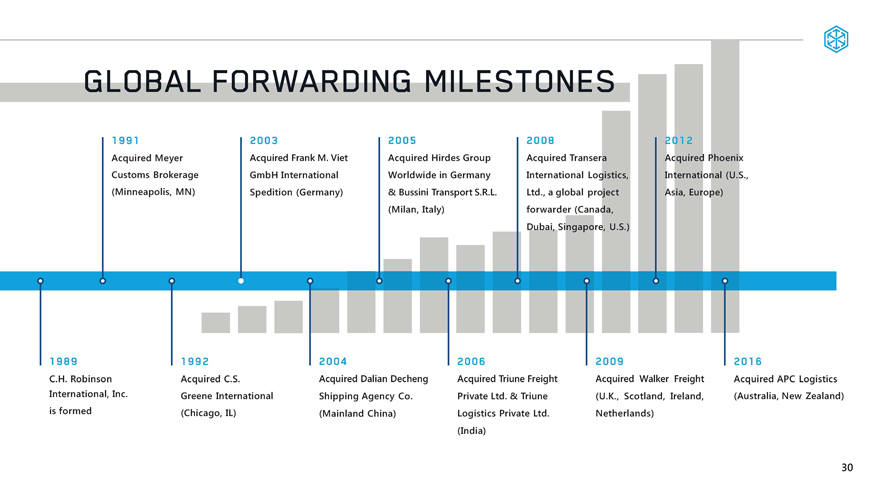
GLOBAL FORWARDING MILESTONES
1991Acquired Meyer Customs Brokerage (Minneapolis, MN) 2003Acquired Frank M. Viet GmbH International Spedition (Germany)2005Acquired Hirdes Group Worldwide in Germany & Bussini Transport S.R.L. (Milan, Italy)2008Acquired Transera International Logistics, Ltd., a global project forwarder (Canada, Dubai, Singapore, U.S.)201 2Acquired Phoenix International (U.S. Asia, Europe)
1992Acquired C.S.Greene International (Chicago, IL)2004Acquired Dalian Decheng Shipping Agency Co. (Mainland China) 2006Acquired Triune Freight Private Ltd. & Triune Logistics Private Ltd. (India)2009Acquired Walker Freight (U.K., Scotland, Ireland, Netherlands) 201 6Acquired APC Logistics (Australia, New Zealand) 30
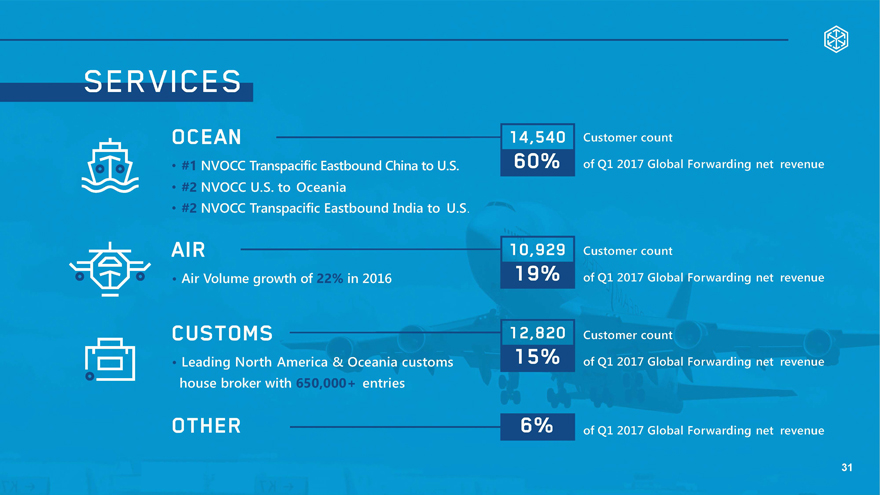
SERVICES OCEAN #1NVOCC Transpacific Eastbound China to U.S. #2NVOCC U.S. to Oceania #3NVOCC Transpacific Eastbound India to U.S Air Volume growth of in 2016customsLeading North America & Oceania customs house broker with entries OTHER
14,540 60%
14,540 60% Customer count of Q1 2017 Global Forwarding net revenue
10,929 19% Customer count of Q1 2017 Global Forwarding net revenue
12,820 15% Customer count of Q1 2017 Global Forwarding net revenue
6% Customer count of Q1 2017 Global Forwarding net revenue
31
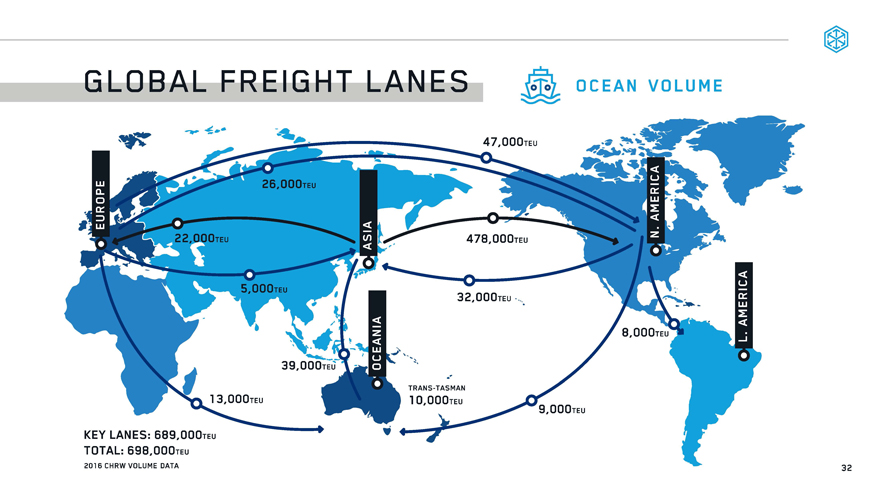
GLOBAL FREIGHT LANES
OCEAN VOLUME
EUROPE ASIA OCEANIA L. AMERICA N. AMERICA 22,000 TEU 5,000TEU 26,000TEU 39,000TEU 9,000 TEU 47,000 TEU 478,000 TEU 32

AIR TONNAGE
GLOBAL FREIGHT LANES AIR TONNAGE EUROPE 6,000mt 35,000mt 10,000 t2016 CHRW VOLUME DATA
INTRA-NORTH AMERIC 10,000mt 35,000mt 17,000mt 35,000mt 14,000mt 3,000mt 10,000mt 2,000mt 6,500mt 8,000mt KEY LANES: 137,9000mt TOTAL: 144,000mt EUROPE ASIA OCENIA N.AMERICA L.AMERICA 33
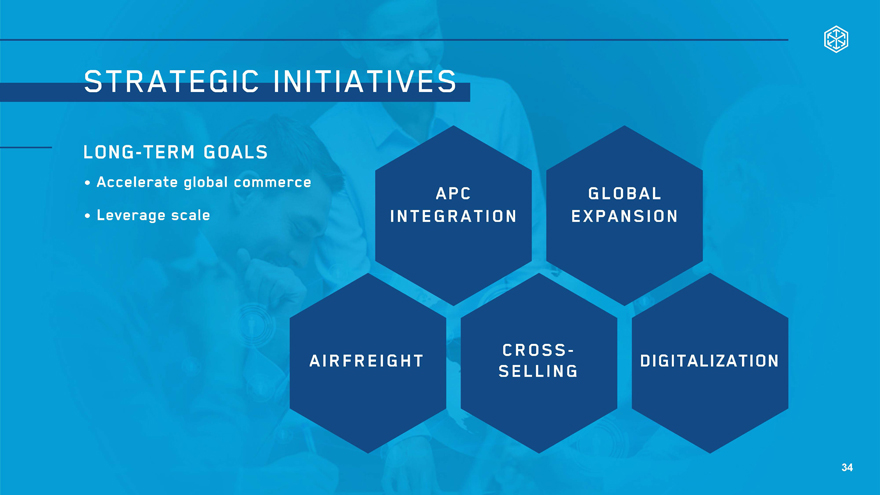
STRATEGIC INITIATIVES LONG-TERM GOALS Accelerate global commerce Leverage scale APCINTEGRATION DIGITALIZATION 34

ROBINSON FRESH Jim Lemke President, Robinson Fresh
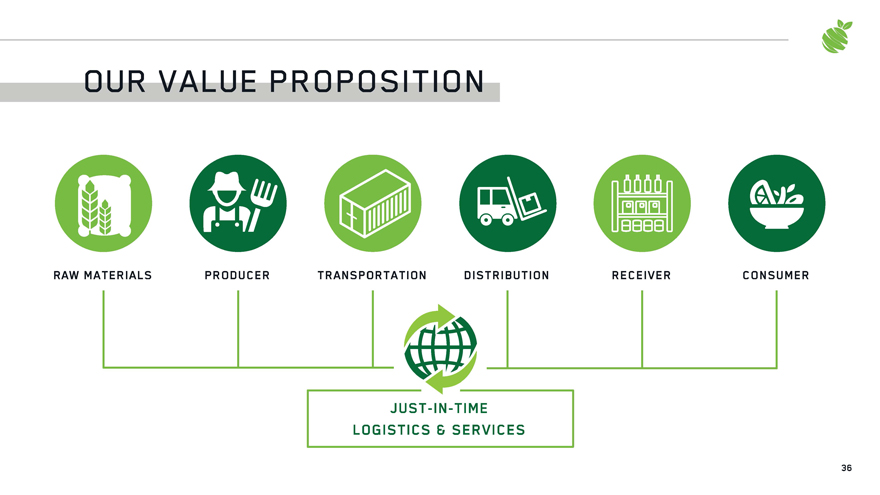
OUR VALUE PROPOSITION
RAW MATERIALS PRODU ER TRANSPORTATION DISTRIBUTION RECEIVER CONSUMER
JUST-IN-TIME LOGISTICS & SERVICES 36
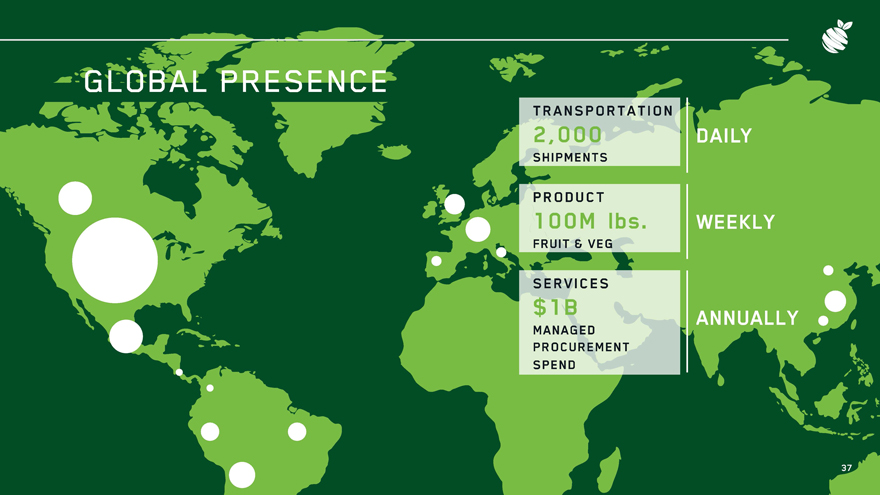
GLOBAL PRESENCE
TRANSPORTATION 2,000 SHIPMENTS DAILY
PRODUCT 100M lbs. FRUITY & VEG. WEEKLY
SERVI CES $1B MANAGED PROCUREMENT SPEND ANNUALY
37
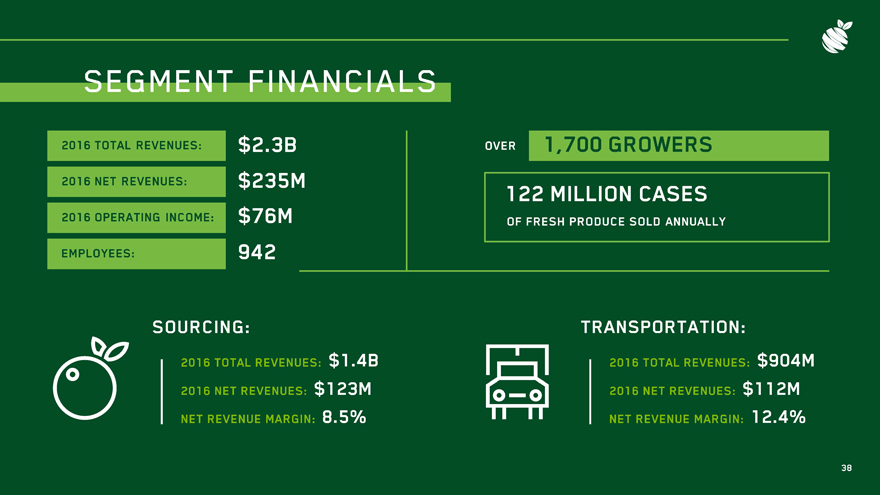
SEGMENT FINANCIALS
2016 TOTAL REVENUES: $2.3B
2016 NTE REVENUES: $235M 2016 OPERATING INCOEM: $76M EMPLOYEES: 942
OVER 1,700 GROWERS 122 MILLION CASES OF FRESH PRODUCE SOLD ANNUALLY
SOURCING:2016 TOTAL REVENUES: $1.4B 2016 NET REVENUES: $123M NET REVENUE MARGIN: 8.5% TRANSPORTATION:2016 TOTAL REVENUES: $904M2016 NET REVENUES: $112M NET REVENUE MARGIN: 12.4% 38
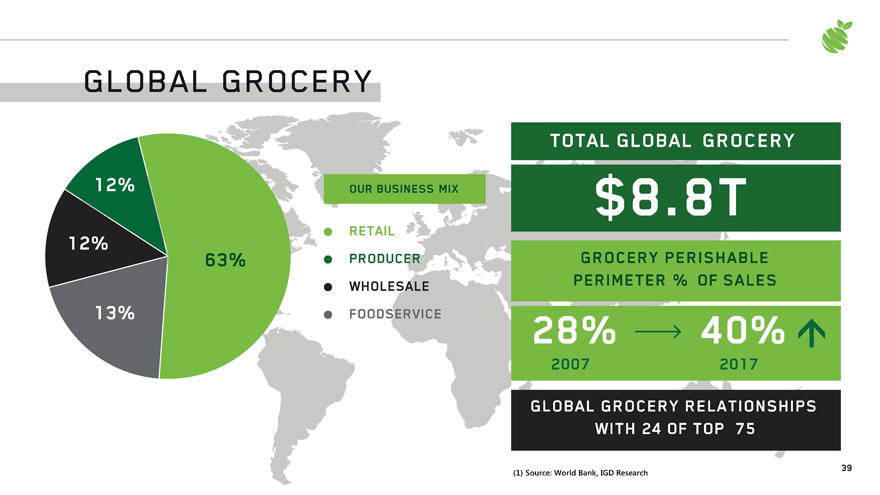
GLOBAL GROCERY TOTAL GLOBAL GROCERY$8.8T OUR BUSINESS MIX RETAIL GROCERY PERISHABLE PERIMETER % OF SALES GLOBAL GROCERY RELATIONSHIPSWITH 24 OF TOP 75(1) Source: World Bank, IGD Research PRODUCER WHOLESALE FOODSERVICE 28% 2007 40% 2017 39
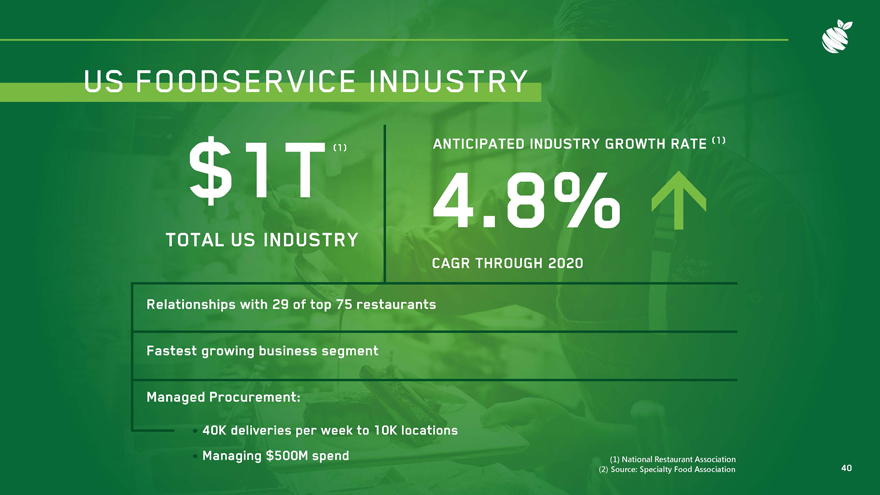
US FOODSERVICE INDUSTRY ANTICIPATED INDUSTRY GROWTH RATE4.8% * TOTAL US INDUSTRY CAGR THROUGH 2020 Relationships with 29 of top 75 restaurants Fastest growing business segment Managed Procurement:*40K deliveries per week to 1 OK locations Managing $500M spend (1) National Restaurant
Association (2) Source: Specialty Food Association 40
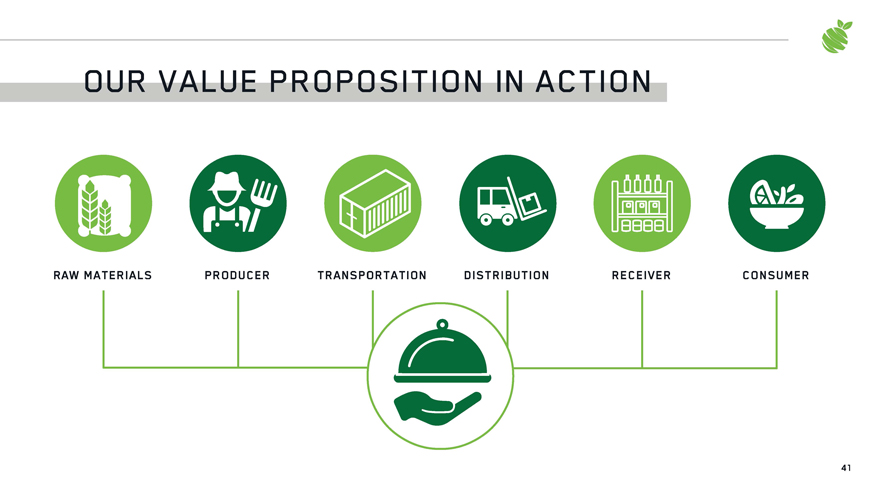
OUR VALUE PROPOSITION RAW MATERIALS PRODUCER TRANSPORTATION DISTRIBUTION RECEIVER CONSUMER 41
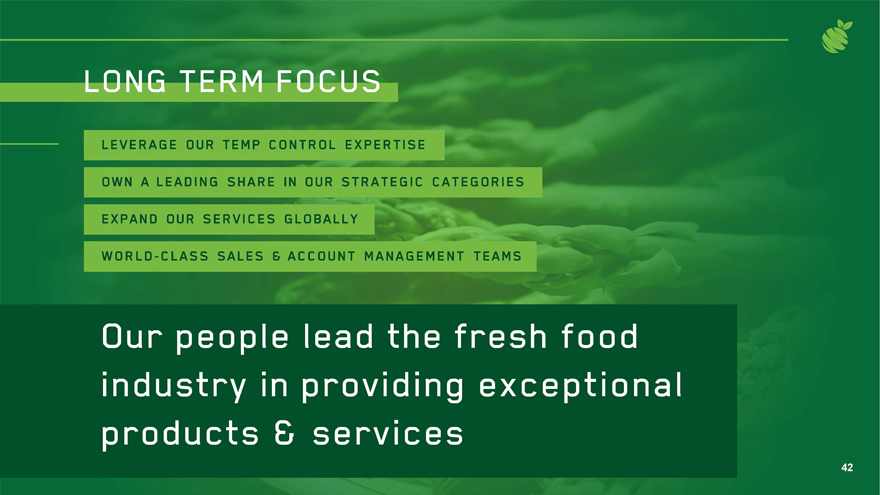
LONG TERM FOCUS LEVERAGE OUR TEMP CONTROL EXPERTISE OWN A LEADING SHARE IN OUR STRATEGIC CATEGORIES EXPAND OUR SERVICES GLOBALLY WORLD – CLASS SALES & ACCOUNT MANAGEMENT TEAMS Our people lead the fresh food industry in providing exceptional products G services 42
MANAGED SERVICES Jordan Kass President, Managed Services 43

TODAY’S TOPICS HISTORY MEGA TRENDS INNOVATION 44
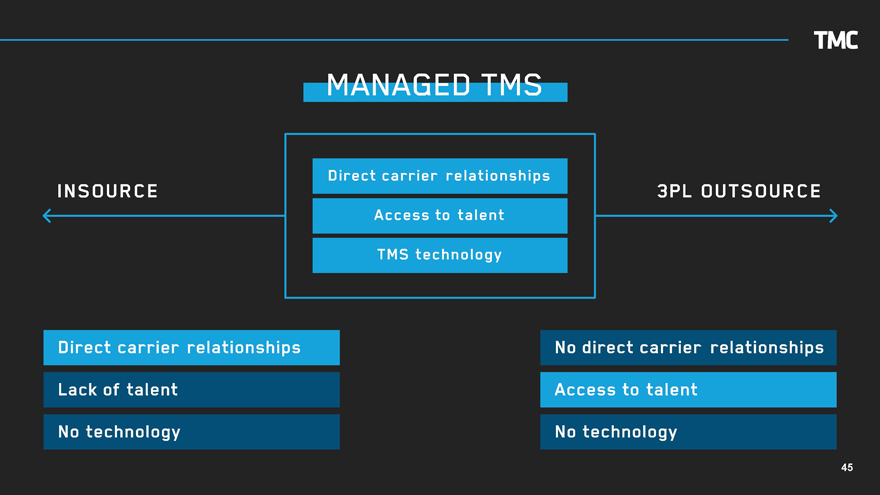
TMC MANAGED TMS Direct carrier relationships Access to talent TMS technology 3PL OUTSOURCE Direct carrier relationships Lack of talent No technology No direct carrier relationships Access to talent No technology 45
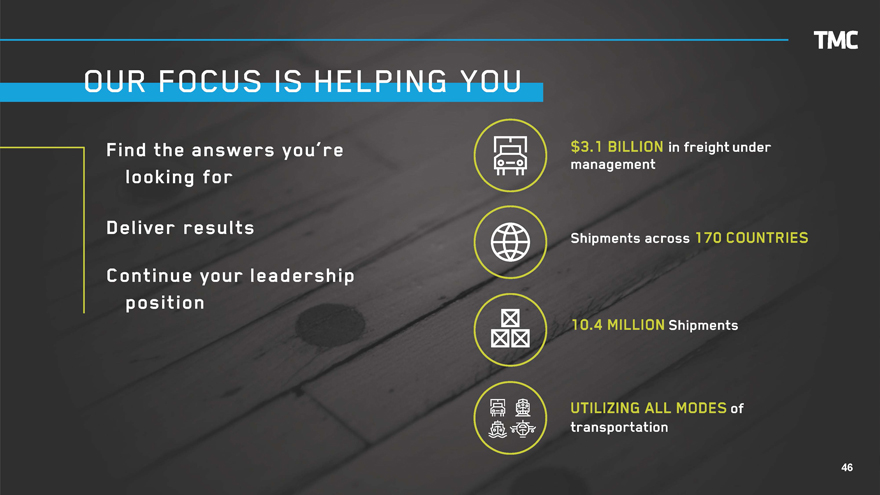
TMC OUR FOCUS IS HELPING YOU Find the answers you’re looking for Deliver results Continue your leadership position $3.1 BILLION in freight under management Shipments across 170 COUNTRIES 10.4 MILLION Shipments UTILIZING ALL MODES of transportation 46

TMC MEGATRENDS 47
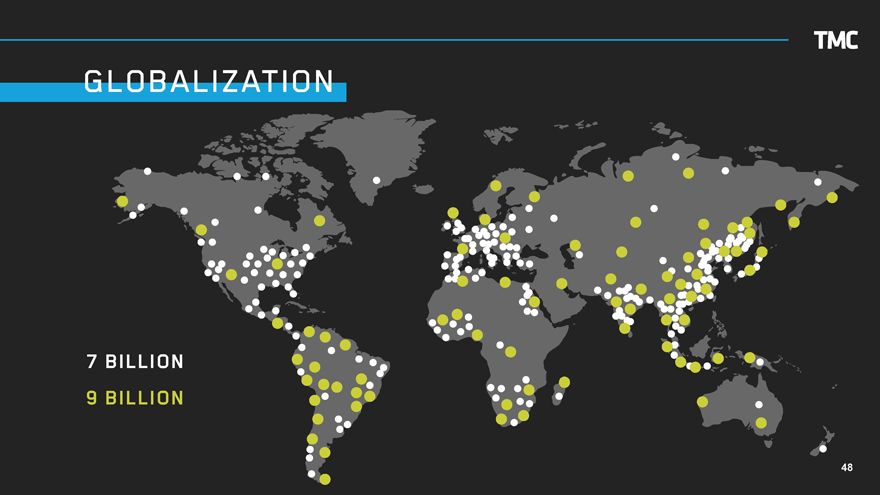
TMC GLOBALIZATION 7 BILLION 9 BILLION 48
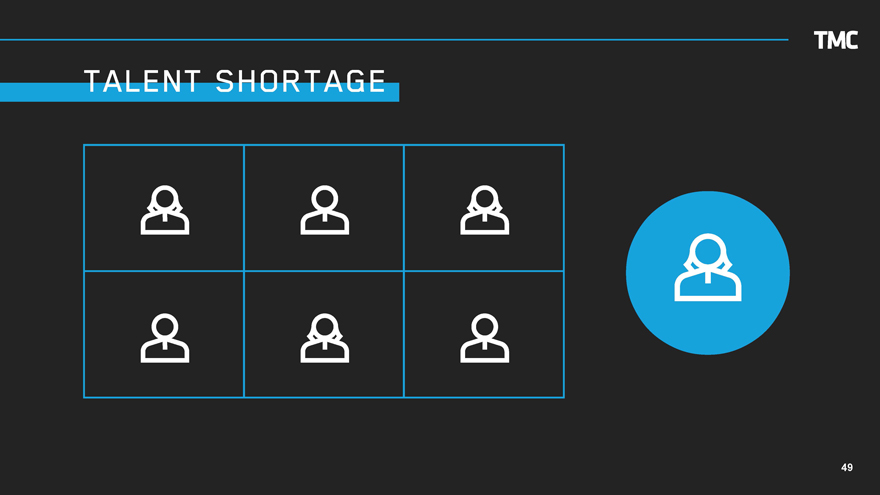
TMC TALENT SHORTAGE 49
TMC MULTI CHANNEL LOGISTICS 50
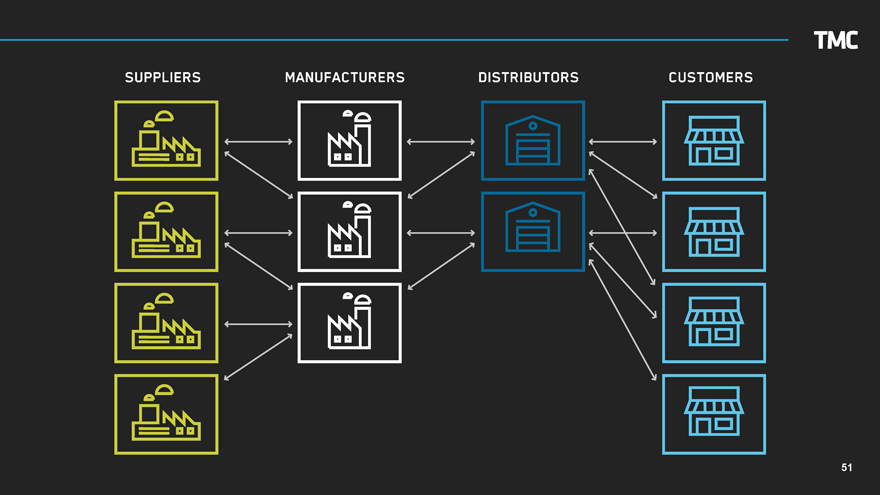
TMC SUPPLIER MANUFACTURERS DISTRIBUTORS CUSTOMERS 51
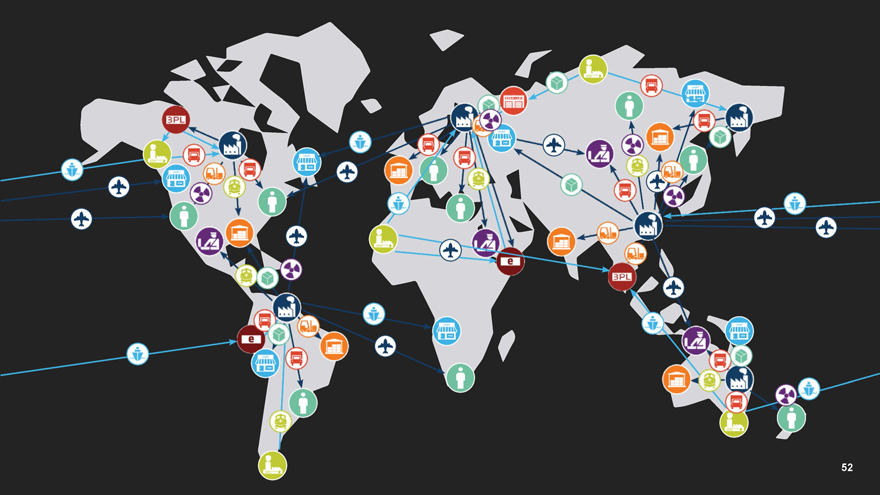
3PL 3PL 52
TMC NAVI SPHERE® 53
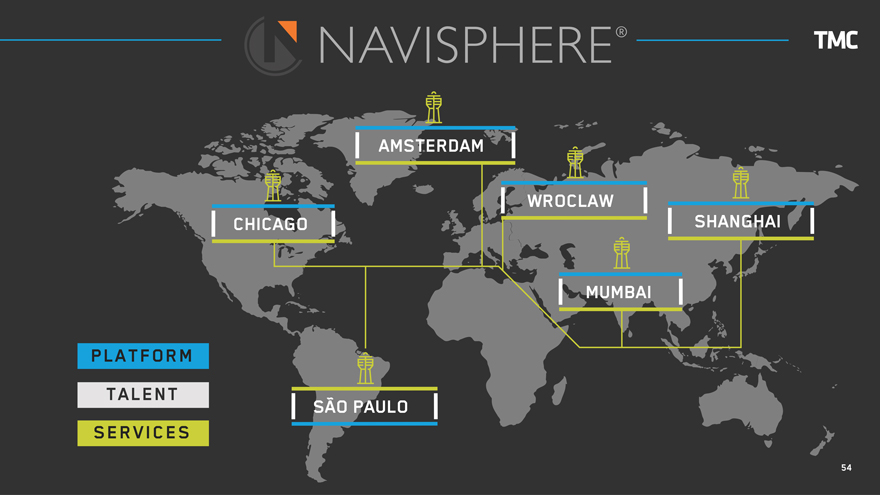
TMC NAVI SPHERE® AMSTERDAM CHICAGO WROCLAW SHANGHAI MUMBAI SAO PAULO PLATFORM TALENT SERVICES 54

TMC INNOVATION 55

TMC CUSTOMERS 56
FREIGHTVIEW 57

TMC TODAY’S TOPICS HISTORY MEGA TRENDS INNOVATION 58

EUROPE SURFACE TRANSPORTATION Jeroen Eijsink President of Europe
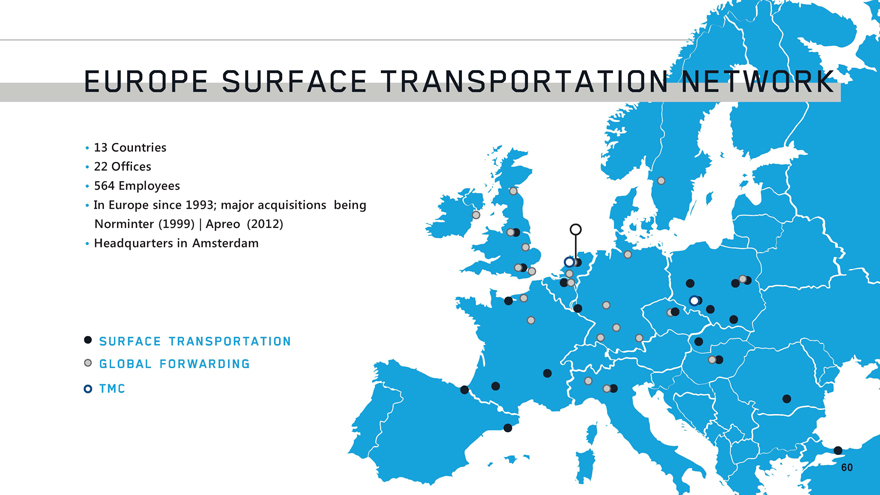
EUROPE SURFACE • 13 Countries • 22 Offices •564 Employees •In Europe since 1993; major acquisitions being Norminter (1999) | Apreo (2012) •Headquarters in Amsterdam •SURFACE TRANSPORTATION GLOBAL FORWARDING TMC 60
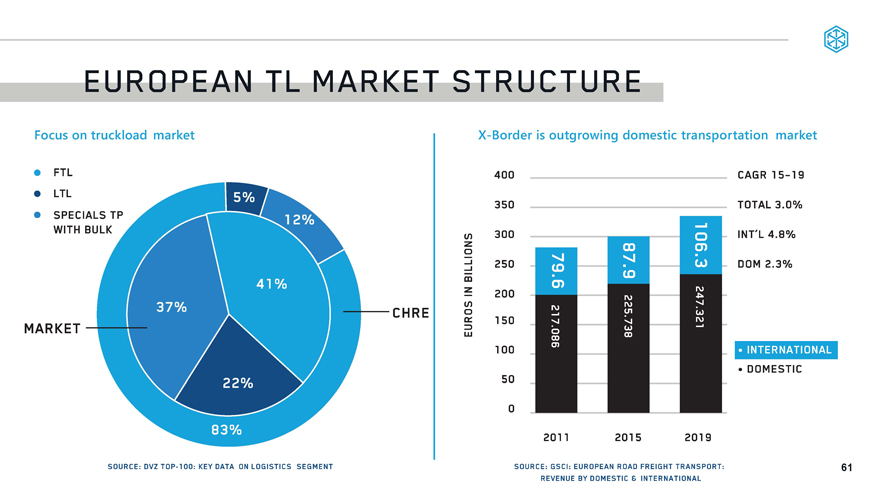
EUROPEAN TL MARKET STRUCTURE Focus on truckload market FTL LTL SPECIALS TP WITH BULK 5% 12% 41% 37% 22% 83% MARKET SOURCE: DVZ TOP-lOO: KEY DATA ON LOGISTICS SEGMENT CHRE X-Border is outgrowing domestic transportation market 400 350 300 250 200 150 100 50 0 CAGR 15-19 TOTAL 3.0% INT’L 4.8% DOM 2.3% 79.6 217.086 87.9 225.738 106.3 247.321 INTERNATIONAL DOMESTIC 2011 2015 2019 SOURCE: GSCI: EUROPEAN ROAD FREIGHT TRANSPORT: REVENUE BY DOMESTIC 8 INTERNATIONAL 61
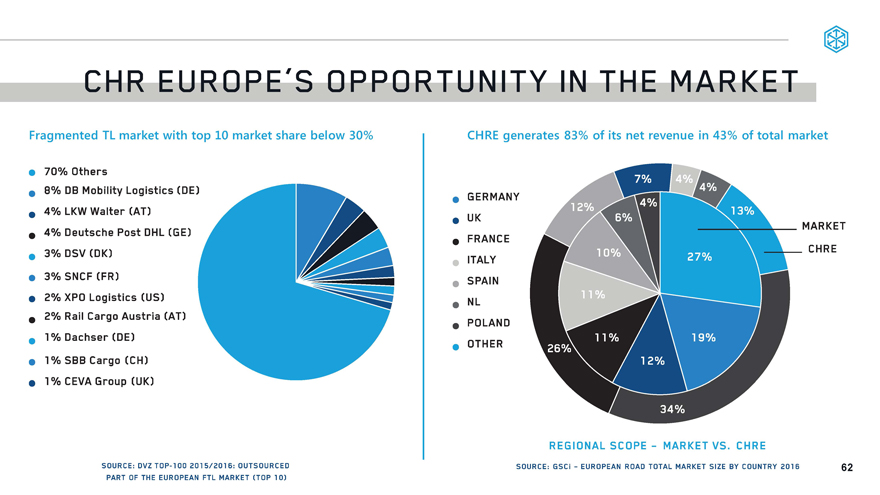
CHR EUROPE’S OPPORTUNITY THE MARKET Fragmented TL market with top 10 market share below 30% 70% Others 8% DB Mobility Logistics CDE) 4% LKW Walter (AT) 4% Deutsche Post DHL (GE) 3% DSV (DK) 3% SNCF (FR) 2% XPO Logistics (US) 2% Rail Cargo Austria (AT) 1% Dachser (DE) 1% SBB Cargo (CH) 1% CEVA Group (UK) SOURCE: DVZ TOP-1 00 2015/2016: OUTSOURCED PART OF THE EUROPEAN FTL MARKET (TOP 10) CHRE generates 83% of its net revenue in 43% of total market GERMANY UK FRANCE ITALY SPAIN NL POLAND OTHER 7% 4% 13% 27% 6% 12% 26% 34% 11% 10% 13% 19% MARKET CHRE REGIONAL SCOPE - MARKET VS. CHRE Source: GSCI – EUROPEAN ROAD TOTAL MARKET SIZE BY COUNTRY 2016 62
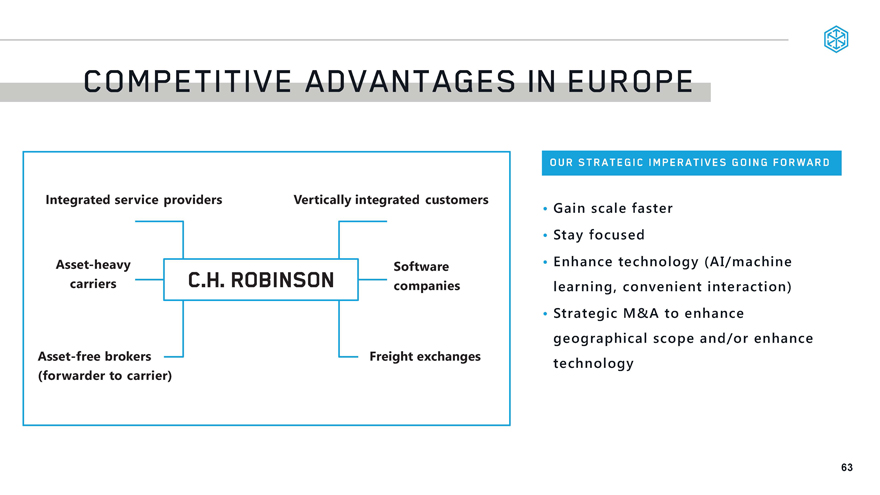
COMPETITIVE ADVANTAGES IN EUROPE OUR STRATEGIC IMPERATIVES GOING FORWARD • Stay focused • Enhance technology (AI/machine learning, convenient interaction) • Strategic M&A to enhance geographical scope and/or enhance technology Integrated service providers Vertically integrated customers Asset-heavy Software carriers companies Asset-free brokers Freight exchanges (forwarder to carrier) 63
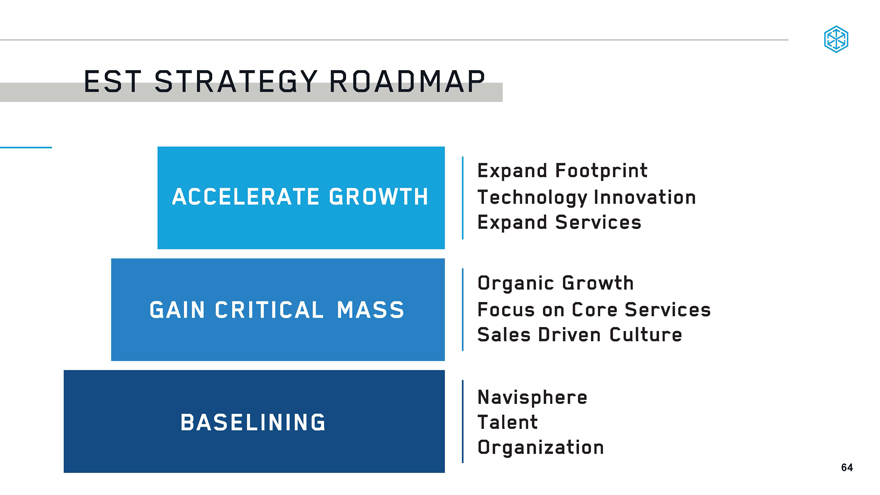
EST STRATEGY ROADMAP Expand Footprint Technology Innovation Expand Services Organic Growth Focus on Core Services Sales Driven Culture Navisphere Talent Organization ACCELERATE GROWTH GAIN CRITICAL MASS BASELINING 64

TECHNOLOGY OVERVIEW
Chad Lindbloom
Chief Information Officer
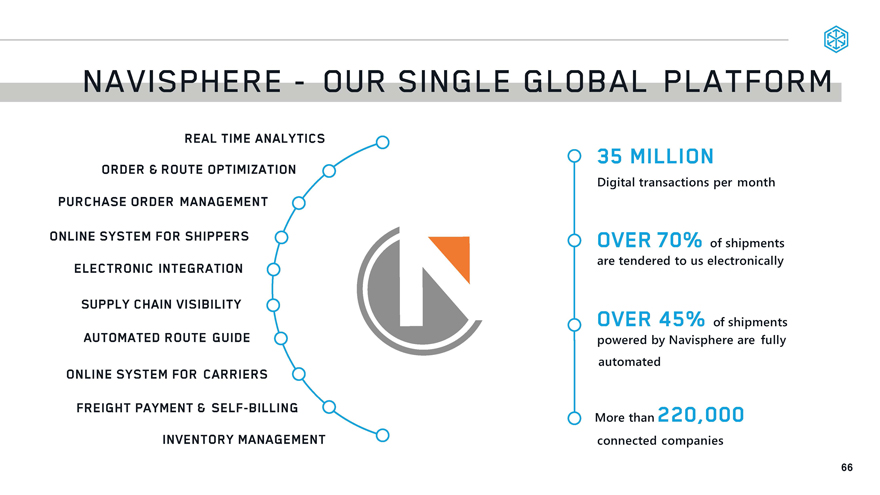
NAVISPHERE—OUR SINGLE GLOBAL PLATFORM35 MILLION OVER 45% of shipment powered by Navisphere are fully automatedMore than 220,000connected companies PURCHASE ORDER MANAGEMENTSUPPLY CHAIN VISIBILITYAUTOMATED ROUTE GUIDEONLINE SYSTEM FOR CARRIERSONLINE SYSTEM FOR SHIPPERSELECTRONIC INTEGRATION of shipments are tendered to us electronically

GLOBAL CONNECTIVITY
TRACKING
RATING
DOCUMENTS
SEARCHING
TENDERING
DEMAND
MANUAL
MOBILE
WEB
EDI
API
EXTERNAL DATA
API
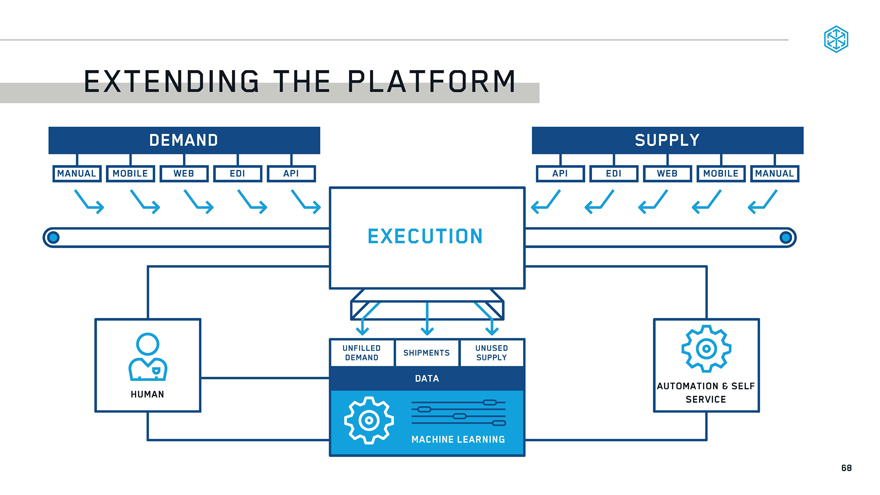
EXTENDING THE PLATFORM
DEMAND
MANUAL
MOBILE
WEB
EDI
API
EXECUTION
HUMAN
UNFILED DEMAND
SHIPMENTS UNUSED SUPPLY MACHINE LEARNING DATA AUTOMATION & SELF SERVICE
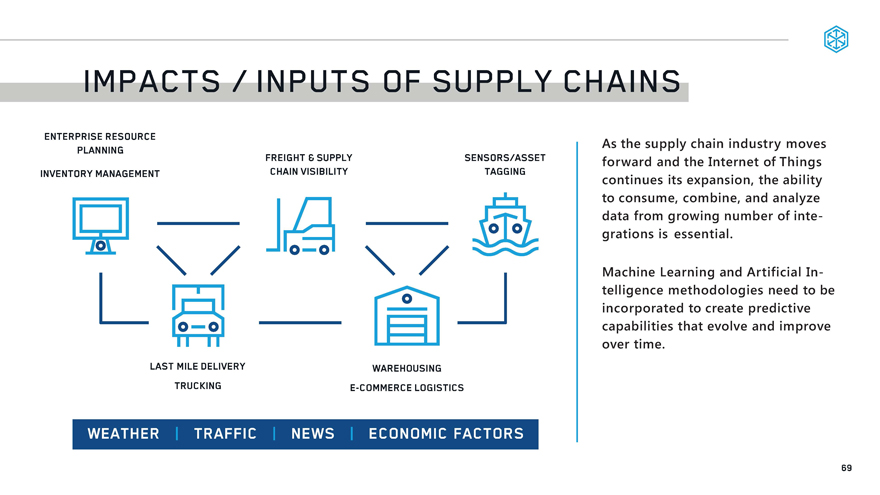
IMPACTS INPUTS OF SUPPLY CHAINS
ENTERPRISE RESOURCE PLANNING
INVENTORY MANAGEMENT FREIGHT 6 SUPPLY CHAIN VISIBILITY SENSORS/ASSET
TAGGING
LAST MILE DELIVERY
TRUCKING
WAREHOUSINGE-COMMERCE LOGISTICS
As the supply chain industry moves forward and the Internet of Things continues its expansion, the ability to consume, combine, and analyze data from growing number of integrations is essential.
Machine Learning and Artificial Intelligence methodologies need to be incorporated to create predictive capabilities that evolve and improve over time.
WAETHER TRAFFIC NEWS ECONOMIC FACTORS WEATHER
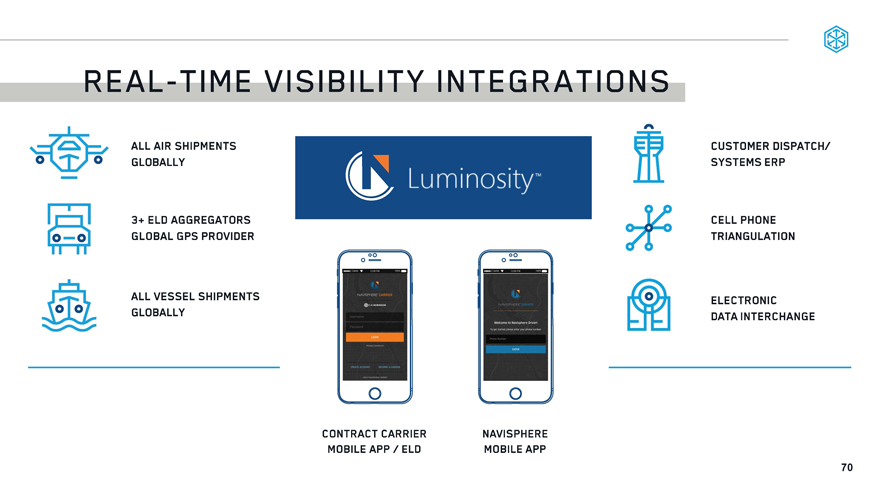
REAL-TIME VISIBILITY INTEGRATIONS
ALL AIR SHIPMENTS GLOBALLY
3+ ELD AGGREGATORS GLOBAL GPS PROVIDER
ALL VESSEL SHIPMENTS GLOBALLY
Sity O Luminosty TM
CONTRACT CARRIER MOBILE APP/ELD
NAVISPHERE MOBILE APP
CUSTOMER DISPATCH SYSTEMS ERP
CELL PHONE TRIANGULATION
ELECTRONIC DATA INTERCHANGE
70
CUSTOMER STRATEGY
Chris O’Brien
Chief Commercial Officer
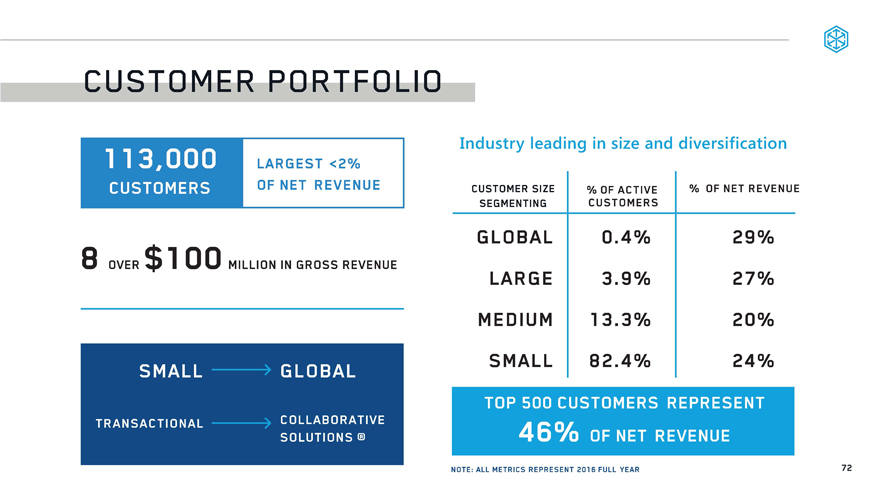
CUSTOMER PORTFOLIO113,000 CUSTOMERS LARGEST <2% OF NET REVENUE8 OVER $100 MILLION IN GROSS REVENUESMALL GLOBAL TRANSACTIONAL COLLABORATIVE SOLUTIONS rIndustry leading in size and diversification global large medium small 0.4% 3.9% 13.3% 82.4% 29% 27% 20% 27% top 500 customers represent 46% of net revenue note: all metrics represent 2016 full year72
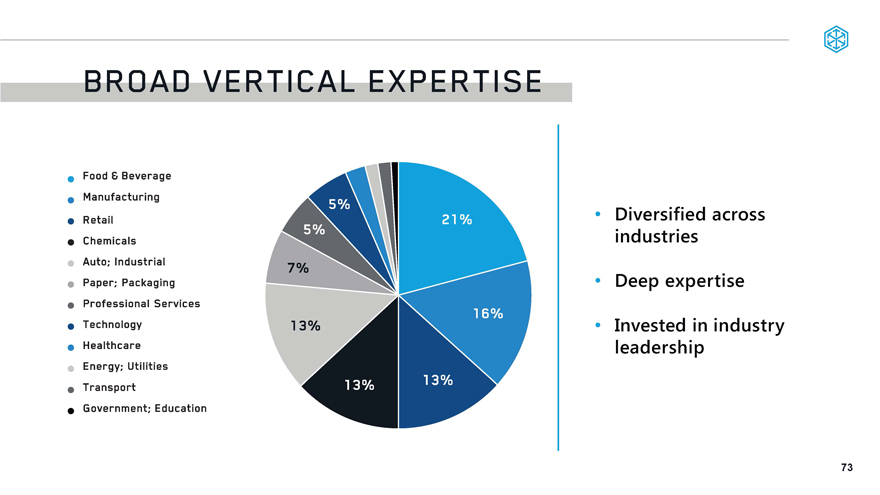
Broad vertical expertise Food & beverage Manufacturing retail chemicals auto; industrial paper; packaging professional services technology healthcare energy; utilities transport government; education
Diversified across industries deep expertise invested in industry leadership
5% 5% 7% 13% 13% 13%16% 21%
73
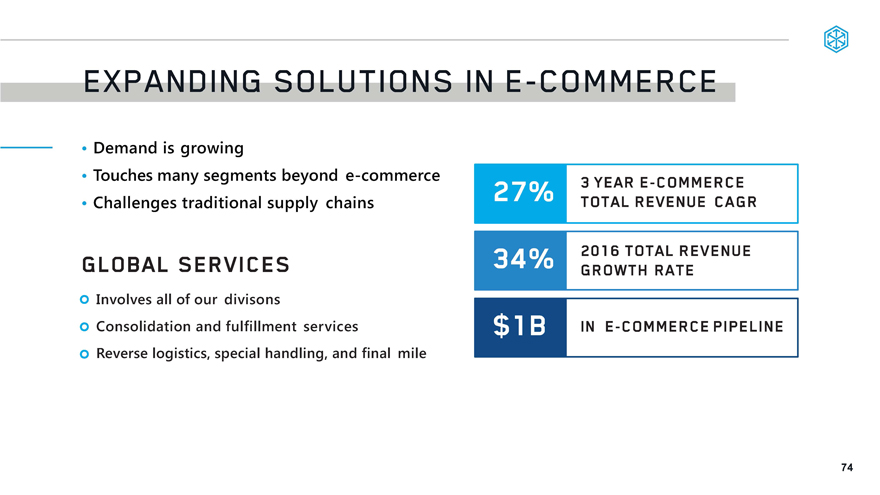
Expanding solutions ine-commerce demand is growing touches many segments beyonde-commerce challenges traditional supply chains global services involves all of our divisions consolidation and fulfillment services reverse logistics, special handling, and final mile
27% 3 yeare-commerce total revenue cagr
34% 2016 total revenue growth rate
$1b ine-commerce pipeline
74
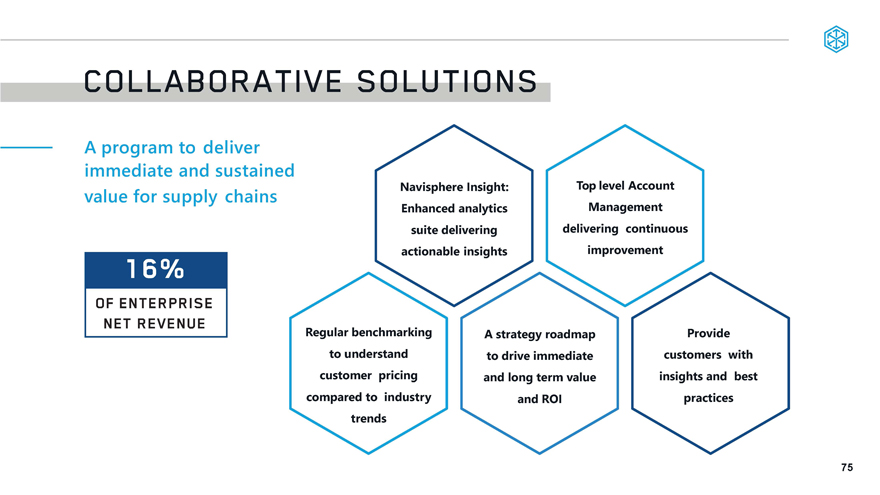
COLLABORATIVE SOLUTIONS A program to deliver immediate and sustained value for supply chains 16% OF ENTERPRISE NET REVENUE navisphere insight: enhanced analytics suite delivering actionable insights top level account management delivering continuous improvement Regular benchmarking to understand customer pricing compared to industry trends A strategy roadmap to drive immediate and long term value and ROI provide customers with insights and best practices 75
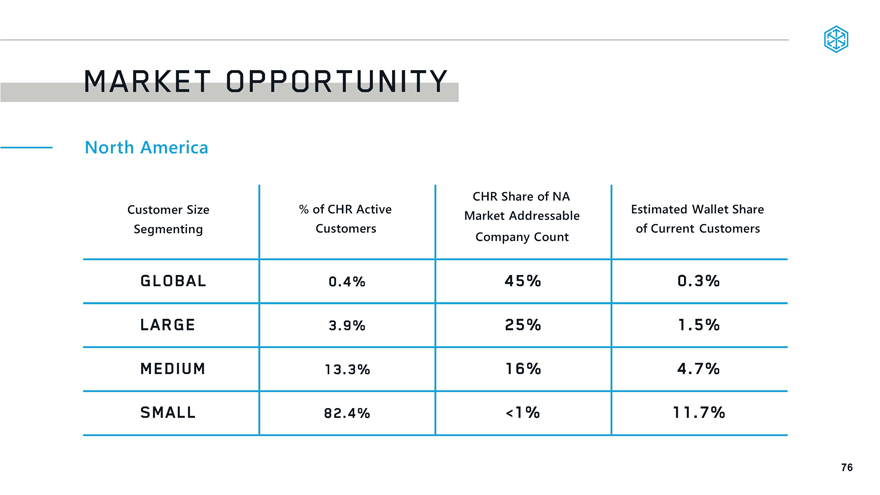
MARKET OPPORTUNITY North America customer size segmenting % of CHR active customers CHR Share of NA market addressable company count estimated wallet share of current customers global 0.4% 45% 0.3% large 3.9% 25% 1.5% medium 13.3% 16% 4.7% small 82.4% <1% 11.7% 76
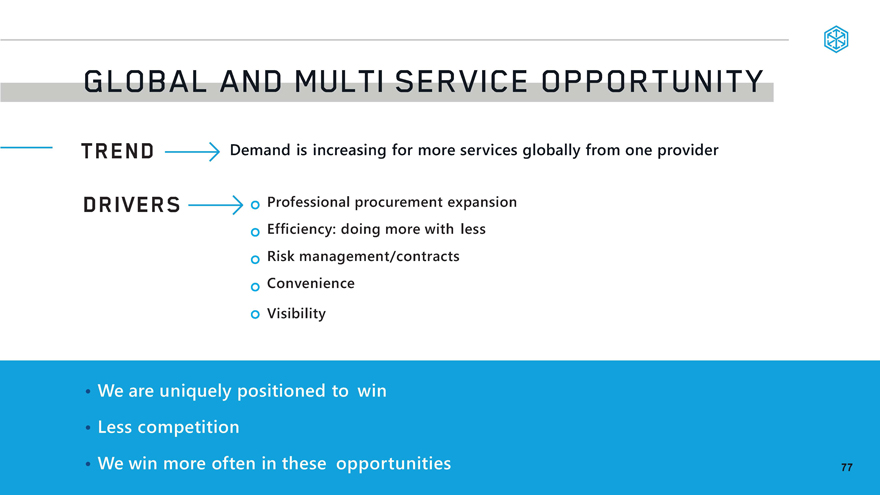
GLOBAL AND MULTI SERVICE OPPORTUNITY TREND Demand is increasing for more services globally from one provider DRIVERS Professional procurement expansion Efficiency: doing more with less Risk management/contracts Convenience Visibility We are uniquely positioned to win Less competition We win more often in these opportunities 77
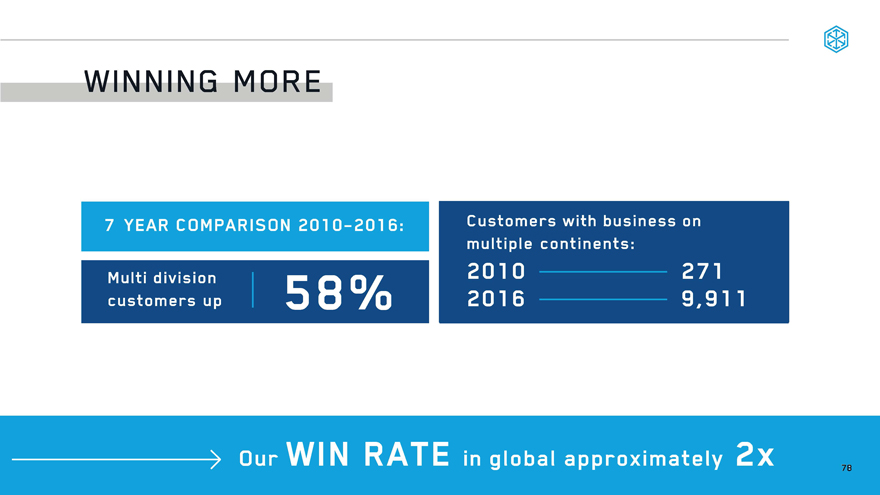
WINNING MORE 7 YEAR COMPARISON 2010-2016: Multi division customers up 58% Customers with business on multiple continents”2010-2712016-9,911 Our WIN RATE in global approximately 2x 78
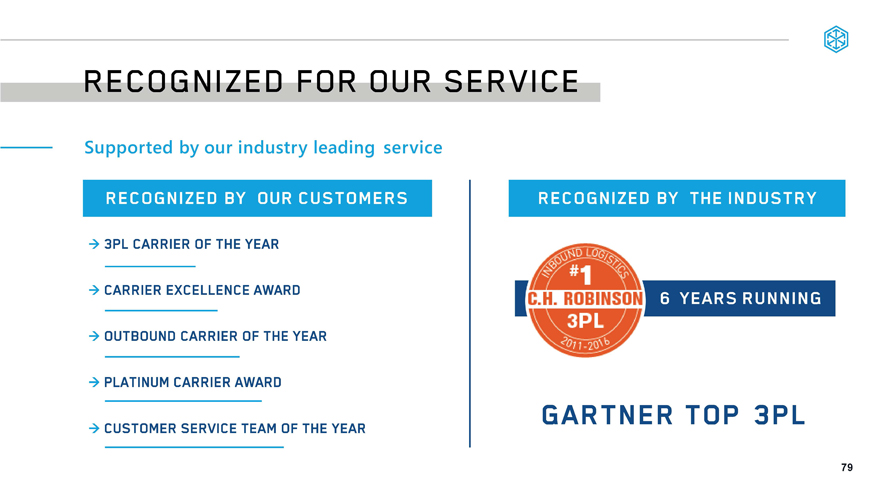
RECOGNIZED FOR OUT SERVICE Supported by our industry leading service RECOGNIZED BY OUR CUSTOMERS 3PL CARRIER OF THE YEAR CARRIER EXCELLENCE AWARD OUTBOUND CARRIER OF THE YEAR PLATINUM CARRIER AWARD CUSTOMER SERVICE TEAM OF THE YEAR RECOGNIZED BY THE INDUSTRY INBOUND LOGISTICS C.H. ROBINSON 3PL 2011-2016 6 YEARS RUNNING GARTNER TOP 3PL 79
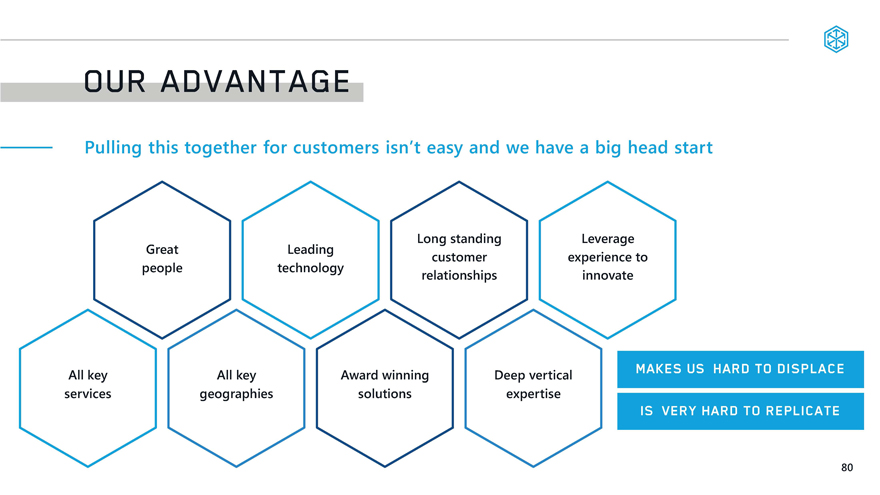
OUR ADVANTAGE Pulling this together for customers isn’t easy and we have a big head start Great people Leading technology Long standing customer relationships Leverage experience to innovate All key service All key geographies Award winning solutions Deep vertical expertise MAKES US HARD TO DISPLACE IS VERY HARD TO REPLICATE 80
TALENT AND CULTURE Angie Freeman Chief Human Resources Officer
Toshiba International Corporation
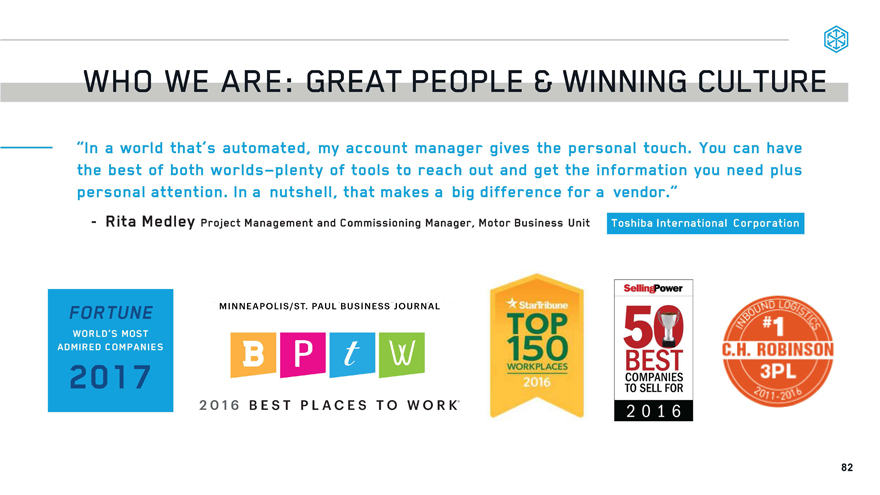
WHO WE ARE: GREAT PEOPLE & WINNING CULTURE“In a world that’s automated, my account manager gives the personal touch. You can have the best of both worlds-plenty of tools to reach out and get the information you need plus personal attention. In a nutshell, that makes a big difference for a vendor.”- Rita Medley Project Management and Commissioning Manager, Motor Business Unit Toshiba International Corporation top 150 WORKPLACES 2016 50 BEST COMPANIES TO SELL FOR 2016 C.H. ROBINSON 3PL 2011-2016 MINNEAPOLIS.ST. PAUL BUSINESS JOURNAL 2106 BEST PLACES TO WORK FORTUNE WORLD’S MOST ADMIRED COMPANIES 2017 82
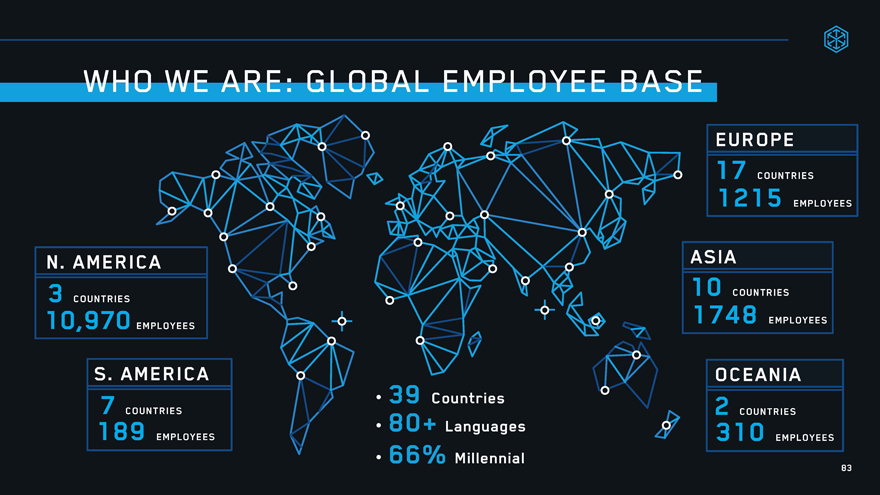
WHO WE ARE: GLOBAL EMPLOYEE BASE 66% Millennial N. AMERICA 3 COUNTRIES 10,970 EMPLOYEES S. AMERICA 7 COUNTRIES 189 EMPLOYEES 39 Countries 80+ Languages OCEANIA 2 COUNTRIES 310 EMPLOYEES ASIA 10 COUNTRIES 1748 EMPLOYEES 17 COUNTRIES 1215 EMPLOYEES
WHO WE ARE: ONE COMMON CULTURE Performance driven Customer centric Supply chain experts Empowered front-line leaders Relationship focused Constantly evolving Hustle Integrity and professionalism Community impact 84
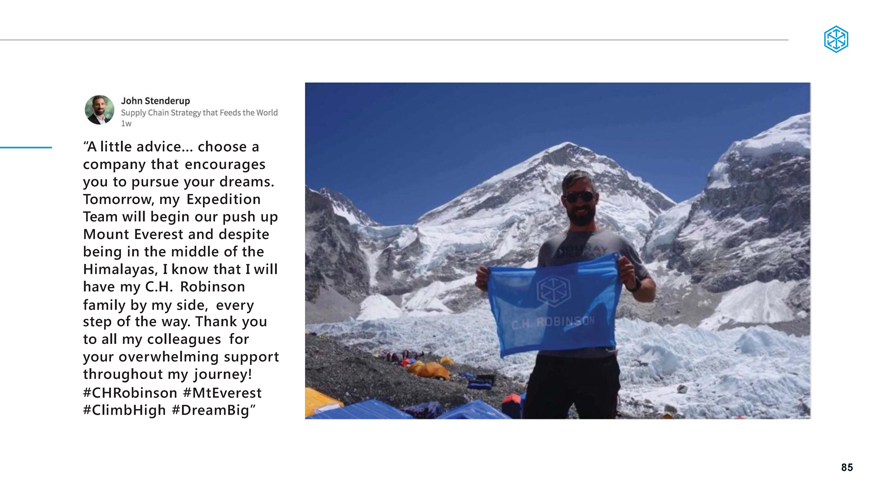
John Stenderup[GRAPHIC APPEARS HERE]Supply Chain Strategy that Feeds the World lw“A little advice... choose a company that encourages you to pursue your dreams. Tomorrow, my Expedition Team will begin our push up Mount Everest and despite being in the middle of the Himalayas, I know that I will have my C.H. Robinsonfamily by my side, every step of the way. Thank you to all my colleagues for your overwhelming support throughout my journey! #CHRobinson #MtEverest #ClimbHigh #DreamBig” 85
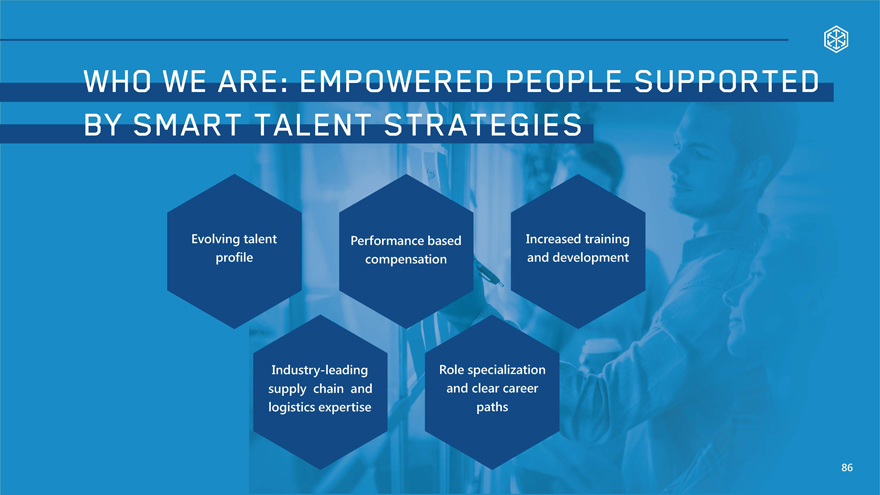
WHO WE ARE: EMPOWERED PEOPLE SUPPORTED BY SMART TALENT STRATEGIES Evolving talent profile Performance based compensation Increased training and development Industry-leading supply chain and logistics expertise Role specialization and clear career paths 86
Our people make the difference. Recognized by customers • One global common culturePerformance driven • Smart talent strategy Engaged Empowered Enabled 87
Q&AC.H. ROBINSON TEAM

CLOSING COMMENTS Andrew Clarke Chief Financial Officer

C.H. ROBINSONACCELERATE YOUR ADVANTAGE