
Third - Quarter 2019 Results October 31, 2019 Exhibit 99.2

2 Forward - Looking Statements Statements in this presentation that are not historical facts are forward - looking statements, which involve risks and uncertaint ies that could cause actual events or results to differ materially from those expressed or implied by the statements. Important factors that ma y cause actual results to differ materially from those in the forward - looking statements include, among other factors, the loss or bankruptcy o f a major customer; the costs and timing of facility closures, business realignment or similar actions; a significant change in commerc ial vehicle, automotive, agricultural and off - highway vehicle production; our ability to achieve cost reductions that offset or exceed custom er - mandated selling price reductions; a significant change in general economic conditions in any of the various countries in which Stoner idg e operates; labor disruptions at Stoneridge’s facilities or at any of Stoneridge’s significant customers or suppliers; the ability of sup pli ers to supply Stoneridge with parts and components at competitive prices on a timely basis; the amount of Stoneridge’s indebtedness and the re strictive covenants contained in the agreements governing its indebtedness, including its revolving credit facility; customer acceptanc e o f new products; capital availability or costs, including changes in interest rates or market perceptions; the failure to achieve su cce ssful integration of any acquired company or business; the occurrence or non - occurrence of circumstances beyond Stoneridge’s control; and the items described in “Risk Factors” and other uncertainties or risks discussed in Stoneridge’s periodic and current reports filed wit h t he Securities and Exchange Commission. Important factors that could cause the performance of the commercial vehicle and automotive industry to differ materially fro m t hose in the forward - looking statements include factors such as (1) continued economic instability or poor economic conditions in the United States and global markets, (2) changes in economic conditions, housing prices, foreign currency exchange rates, commodity prices, includ ing shortages of and increases or volatility in the price of oil, (3) changes in laws and regulations, (4) the state of the credit markets, (5 ) political stability, (6) international conflicts and (7) the occurrence of force majeure events. These factors should not be construed as exhaustive and should be considered with the other cautionary statements in Stonerid ge’ s filings with the Securities and Exchange Commission. Forward - looking statements are not guarantees of future performance; Stoneridge’s actual results of operations, financial condit ion and liquidity, and the development of the industry in which Stoneridge operates may differ materially from those described in or sug gested by the forward - looking statements contained in this presentation. In addition, even if Stoneridge’s results of operations, financial co ndition and liquidity, and the development of the industry in which Stoneridge operates are consistent with the forward - looking statements c ontained in this presentation, those results or developments may not be indicative of results or developments in subsequent periods. This presentation contains time - sensitive information that reflects management’s best analysis only as of the date of this prese ntation. Any forward - looking statements in this presentation speak only as of the date of this presentation, and Stoneridge undertakes no obl igation to update such statements. Comparisons of results for current and any prior periods are not intended to express any future tren ds or indications of future performance, unless expressed as such, and should only be viewed as historical data. Stoneridge does not undertake any obligation to publicly update or revise any forward - looking statement as a result of new infor mation, future events or otherwise, except as otherwise required by law. Rounding Disclosure: There may be slight immaterial differences between figures represented in our public filings compared t o w hat is shown in this presentation. The differences are the result of rounding due to the representation of values in millions rathe r t han thousands in public filings.
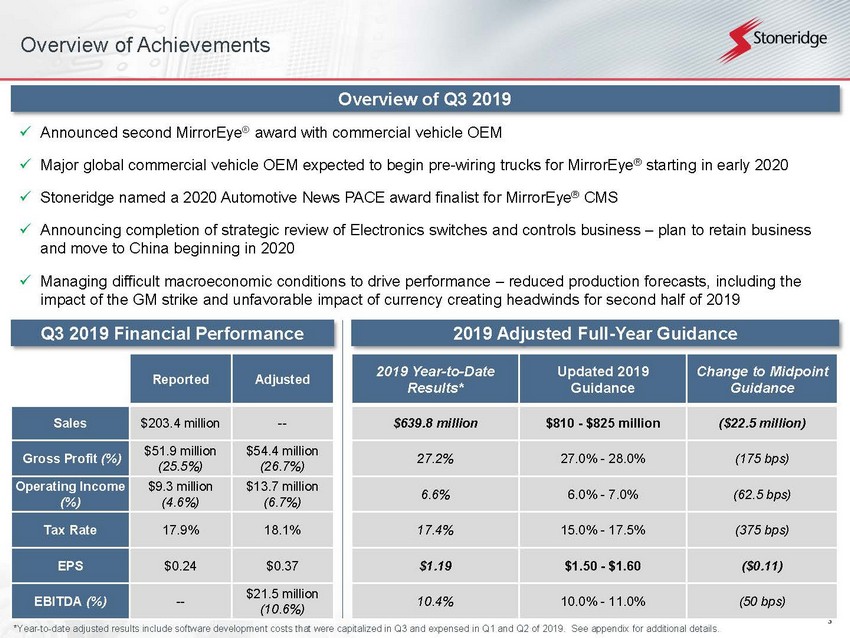
3 Overview of Achievements x Announced second MirrorEye ® award with commercial vehicle OEM x Major global commercial vehicle OEM expected to begin pre - wiring trucks for MirrorEye ® starting in early 2020 x Stoneridge named a 2020 Automotive News PACE award finalist for MirrorEye ® CMS x Announcing completion of strategic review of Electronics switches and controls business – plan to retain business and move to China beginning in 2020 x Managing difficult macroeconomic conditions to drive performance – reduced production forecasts, including the impact of the GM strike and unfavorable impact of currency creating headwinds for second half of 2019 Overview of Q 3 2019 Q 3 2019 Financial Performance 2019 Adjusted Full - Year Guidance Reported Adjusted Sales $203.4 million -- Gross Profit (%) $51.9 million (25.5%) $54.4 million (26.7%) Operating Income (%) $9.3 million (4.6%) $13.7 million (6.7%) Tax Rate 17.9% 18.1% EPS $0.24 $0.37 EBITDA (%) -- $21.5 million (10.6%) 2019 Year - to - Date Results* Updated 2019 Guidance Change to Midpoint Guidance $639.8 million $810 - $825 million ($22.5 million) 27.2% 27.0% - 28.0% (175 bps) 6.6% 6.0% - 7.0% (62.5 bps) 17.4% 15.0% - 17.5% (375 bps) $1.19 $1.50 - $1.60 ($0.11) 10.4% 10.0% - 11.0% (50 bps) *Year - to - date adjusted results include software development costs that were capitalized in Q3 and expensed in Q1 and Q2 of 2019. See appendix for additional details.

4 3 rd Quarter 2019 Quarterly Financial Comparison Reduced production volumes, other external factors and increased expediting costs more than offset continued operational improvements during the quarter Quarterly Comparison* Sales Adjusted Gross Profit Adjusted Operating Income Adjusted EBITDA $’s in USD Millions *Excluding estimated impact of recently divested switches and connectors product lines **Based upon October IHS and Q3 LMC data and Company sales data ▸ Excluding the impact of the GM strike and continued ramp down of shift - by - wire, revenue growth on core business of 1.4% vs. weighted average end market contraction of (1.3%)** over the same period ▸ Q3 margin negatively impacted by increased expediting costs primarily at Control Devices (approximately $1.2 million in Q3 ’19 vs. Q3 ’18) ▸ Macroeconomic headwinds continue to dampen operating performance • Currency – ($0.6) million operating income impact Q3 ‘19 vs Q3 ‘18 • Electronic component allocations and premiums – ($0.5) million operating income impact Q3 ‘19 vs Q3 ’18 • Tariffs – ($0.5) million operating income impact Q3 ‘19 vs Q3 ’18 ▸ Reduced production volumes, including the impact of the GM strike, other external factors and increased expediting costs reduced operating income by over $4 million in the quarter Q 3 Financial Highlights $197.8 $192.6 $170.0 $190.0 $210.0 Q3 2018 Q3 2019 $60.0 $53.3 30.4% 27.7% $40.0 $50.0 $60.0 Q3 2018 Q3 2019 20.0% 25.0% 30.0% 35.0% 40.0% $16.4 $12.6 8.3% 6.5% $5.0 $10.0 $15.0 $20.0 Q3 2018 Q3 2019 0.0% 2.0% 4.0% 6.0% 8.0% 10.0% 12.0% 14.0% 16.0% 18.0% 20.0% $23.1 $20.4 11.7% 10.6% $5.0 $15.0 $25.0 Q3 2018 Q3 2019 0.0% 5.0% 10.0% 15.0% 20.0%
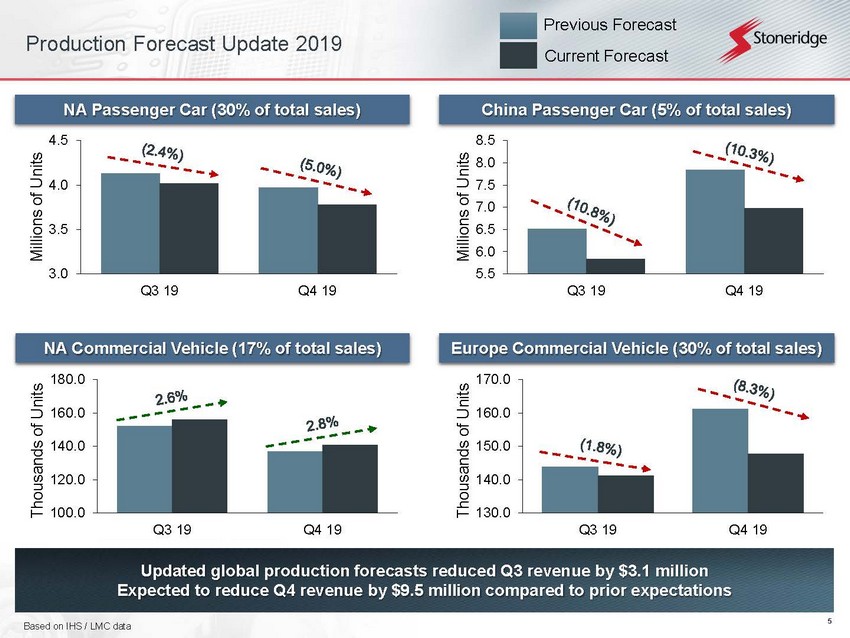
5 Production Forecast Update 2019 Updated global production forecasts reduced Q3 revenue by $3.1 million Expected to reduce Q4 revenue by $9.5 million compared to prior expectations NA Passenger Car (30% of total sales) China Passenger Car (5% of total sales) NA Commercial Vehicle (17% of total sales) Europe Commercial Vehicle (30% of total sales) 3.0 3.5 4.0 4.5 Q3 19 Q4 19 Millions of Units 100.0 120.0 140.0 160.0 180.0 Q3 19 Q4 19 Thousands of Units 5.5 6.0 6.5 7.0 7.5 8.0 8.5 Q3 19 Q4 19 Millions of Units 130.0 140.0 150.0 160.0 170.0 Q3 19 Q4 19 Thousands of Units Based on IHS / LMC data Previous Forecast Current Forecast
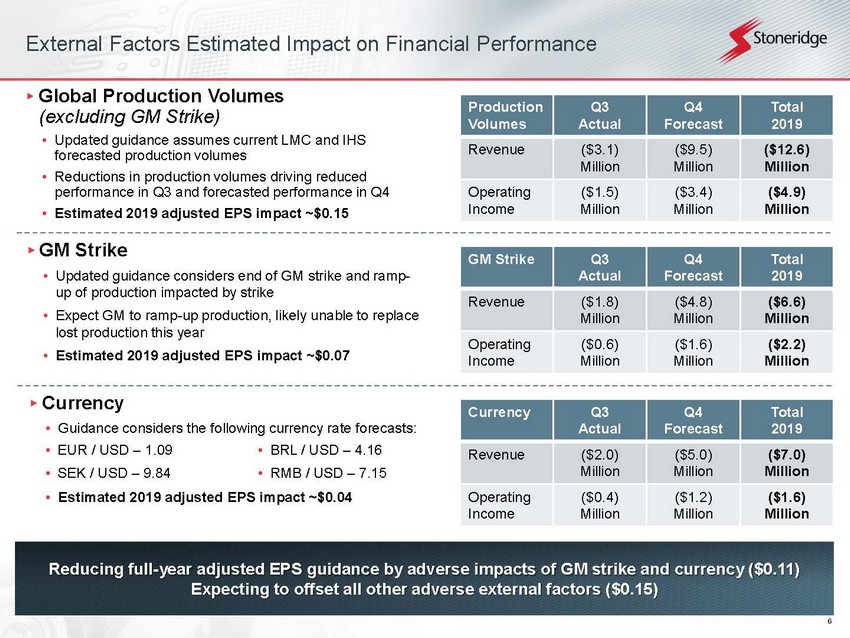
6 External Factors Estimated Impact on Financial Performance Reducing full - year adjusted EPS guidance by adverse impacts of GM strike and currency ($0.11) Expecting to offset all other adverse external factors ($0.15) ▸ GM Strike • Updated guidance considers end of GM strike and ramp - up of production impacted by strike • Expect GM to ramp - up production, likely unable to replace lost production this year • Estimated 2019 adjusted EPS impact ~$0.07 GM Strike Q3 Actual Q4 Forecast Total 2019 Revenue ($1.8) Million ($4.8) Million ($6.6) Million Operating Income ($0.6) Million ($1.6) Million ($2.2) Million Currency Q3 Actual Q4 Forecast Total 2019 Revenue ($2.0) Million ($5.0) Million ($7.0) Million Operating Income ($0.4) Million ($1.2) Million ($1.6) Million ▸ Currency • Guidance considers the following currency rate forecasts: • Estimated 2019 adjusted EPS impact ~$0.04 ▸ Global Production Volumes (excluding GM Strike) • Updated guidance assumes current LMC and IHS forecasted production volumes • Reductions in production volumes driving reduced performance in Q3 and forecasted performance in Q4 • Estimated 2019 adjusted EPS impact ~$0.15 Production Volumes Q3 Actual Q4 Forecast Total 2019 Revenue ($3.1) Million ($9.5) Million ($12.6) Million Operating Income ($1.5) Million ($3.4) Million ($4.9) Million • EUR / USD – 1.09 • SEK / USD – 9.84 • BRL / USD – 4.16 • RMB / USD – 7.15
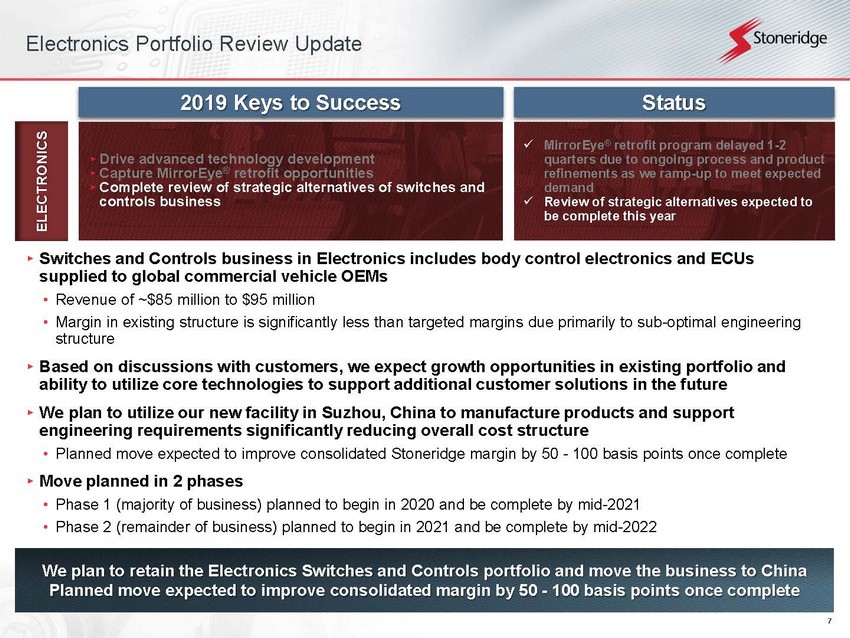
7 Electronics Portfolio Review Update ELECTRONICS ▸ Drive advanced technology development ▸ Capture MirrorEye ® retrofit opportunities ▸ Complete review of strategic alternatives of switches and controls business Status x MirrorEye ® retrofit program delayed 1 - 2 quarters due to ongoing process and product refinements as we ramp - up to meet expected demand x Review of strategic alternatives expected to be complete this year 2019 Keys to Success ▸ Switches and Controls business in Electronics includes body control electronics and ECUs supplied to global commercial vehicle OEMs • Revenue of ~$85 million to $95 million • Margin in existing structure is significantly less than targeted margins due primarily to sub - optimal engineering structure ▸ Based on discussions with customers, we expect growth opportunities in existing portfolio and ability to utilize core technologies to support additional customer solutions in the future ▸ We plan to utilize our new facility in Suzhou, China to manufacture products and support engineering requirements significantly reducing overall cost structure • Planned move expected to improve consolidated Stoneridge margin by 50 - 100 basis points once complete ▸ Move planned in 2 phases • Phase 1 (majority of business) planned to begin in 2020 and be complete by mid - 2021 • Phase 2 (remainder of business) planned to begin in 2021 and be complete by mid - 2022 We plan to retain the Electronics Switches and Controls portfolio and move the business to China Planned move expected to improve consolidated margin by 50 - 100 basis points once complete

8 MirrorEye ® Update 2 nd OEM award and pre - wire agreement continue to advance commercialization strategy Major global commercial vehicle OEM expected to begin pre - wiring for MirrorEye ® in early 2020 ▸ Second MirrorEye ® award with commercial vehicle OEM • Estimated $10 million peak annual revenue based on forecasted production levels and assumed penetration rate of 10% - 15% as directed by customer • Production is scheduled to begin in 2021 ▸ Retrofit rollout moving forward • Continuing to increase fleet evaluations • Several fleets have expressed interest in pre - wire option ▸ Major global commercial vehicle OEM expected to begin pre - wiring trucks for MirrorEye ® systems in early 2020 • Pre - wire option will reduce installation times for end - customers • Pre - wiring will be specific to MirrorEye ® camera monitor system (CMS) ▸ Stoneridge named a 2020 Automotive News PACE award finalist for MirrorEye ® CMS ▸ MirrorEye ® featured on Freightliner customer demonstration vehicle to showcase safety solutions and gather driver opinions
9 Summary ▸ Focused on driving financial performance despite significant external headwinds, including reduced production volumes due in - part to the GM strike ▸ We are reducing full - year adjusted EPS guidance to account for forecasted adverse impacts of the GM strike and currency ($0.11). We expect to offset all other adverse external factors ($0.15). ▸ Completed review of strategic alternatives for Switches and Controls business. Plan to move business to China to facilitate growth opportunities and significantly improve financial performance. ▸ Announced 2 nd OEM MirrorEye ® award ▸ Major global commercial vehicle OEM expected to begin pre - wiring trucks for MirrorEye ® starting in early 2020 Driving shareholder value through strong financial performance and a well - defined long - term strategy

10 Financial Update
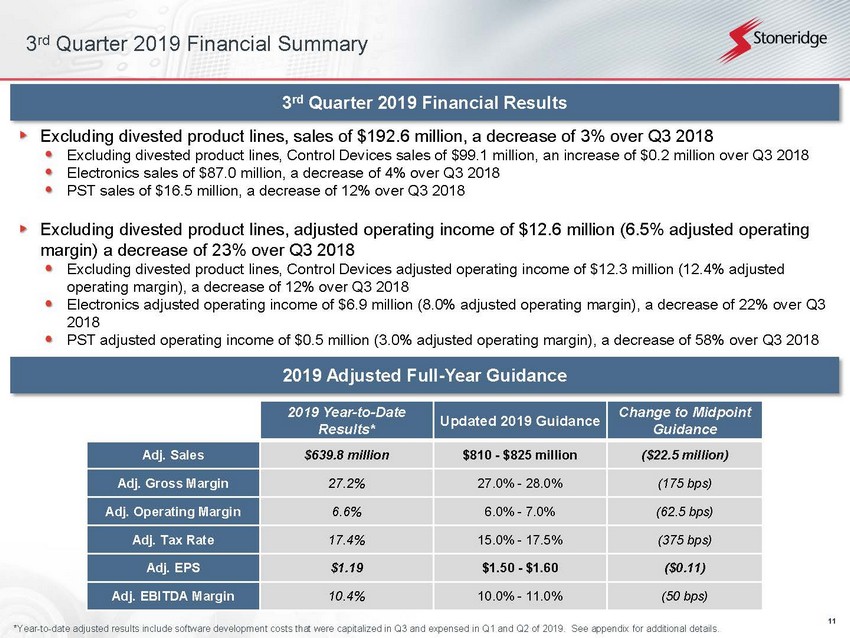
11 3 rd Quarter 2019 Financial Summary Excluding divested product lines, sales of $192.6 million, a decrease of 3% over Q3 2018 Excluding divested product lines, Control Devices sales of $99.1 million, an increase of $0.2 million over Q3 2018 Electronics sales of $87.0 million, a decrease of 4% over Q3 2018 PST sales of $16.5 million, a decrease of 12% over Q3 2018 Excluding divested product lines, adjusted operating income of $12.6 million (6.5% adjusted operating margin) a decrease of 23% over Q3 2018 Excluding divested product lines, Control Devices adjusted operating income of $12.3 million (12.4% adjusted operating margin), a decrease of 12% over Q3 2018 Electronics adjusted operating income of $6.9 million (8.0% adjusted operating margin), a decrease of 22% over Q3 2018 PST adjusted operating income of $0.5 million (3.0% adjusted operating margin), a decrease of 58% over Q3 2018 2019 Adjusted Full - Year Guidance 3 rd Quarter 2019 Financial Results 2019 Year - to - Date Results* Updated 2019 Guidance Change to Midpoint Guidance Adj. Sales $639.8 million $810 - $825 million ($22.5 million) Adj. Gross Margin 27.2% 27.0% - 28.0% (175 bps) Adj. Operating Margin 6.6% 6.0% - 7.0% (62.5 bps) Adj. Tax Rate 17.4% 15.0% - 17.5% (375 bps) Adj. EPS $1.19 $1.50 - $1.60 ($0.11) Adj. EBITDA Margin 10.4% 10.0% - 11.0% (50 bps) *Year - to - date adjusted results include software development costs that were capitalized in Q3 and expensed in Q1 and Q2 of 2019. See appendix for additional details.
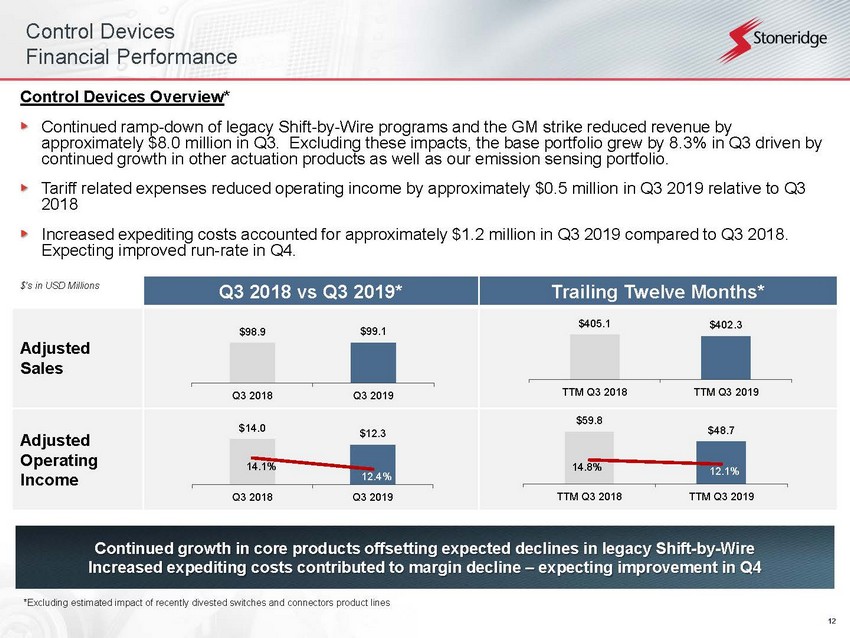
12 Q3 2018 vs Q3 2019* Trailing Twelve Months* Adjusted Sales Adjusted Operating Income Control Devices Financial Performance Continued growth in core products offsetting expected declines in legacy Shift - by - Wire Increased expediting costs contributed to margin decline – expecting improvement in Q4 Control Devices Overview * Continued ramp - down of legacy Shift - by - Wire programs and the GM strike reduced revenue by approximately $8.0 million in Q3. Excluding these impacts, the base portfolio grew by 8.3% in Q3 driven by continued growth in other actuation products as well as our emission sensing portfolio. Tariff related expenses reduced operating income by approximately $0.5 million in Q3 2019 relative to Q3 2018 Increased expediting costs accounted for approximately $1.2 million in Q3 2019 compared to Q3 2018. Expecting improved run - rate in Q4. *Excluding estimated impact of recently divested switches and connectors product lines $’s in USD Millions $98.9 $99.1 $50.0 $70.0 $90.0 $110.0 $130.0 Q3 2018 Q3 2019 $405.1 $402.3 $300.0 $350.0 $400.0 $450.0 TTM Q3 2018 TTM Q3 2019 $14.0 $12.3 14.1% 12.4% $0.0 $5.0 $10.0 $15.0 $20.0 Q3 2018 Q3 2019 10.0% 12.0% 14.0% 16.0% 18.0% 20.0% $59.8 $48.7 14.8% 12.1% $0.0 $20.0 $40.0 $60.0 TTM Q3 2018 TTM Q3 2019 0.0% 10.0% 20.0% 30.0% 40.0%
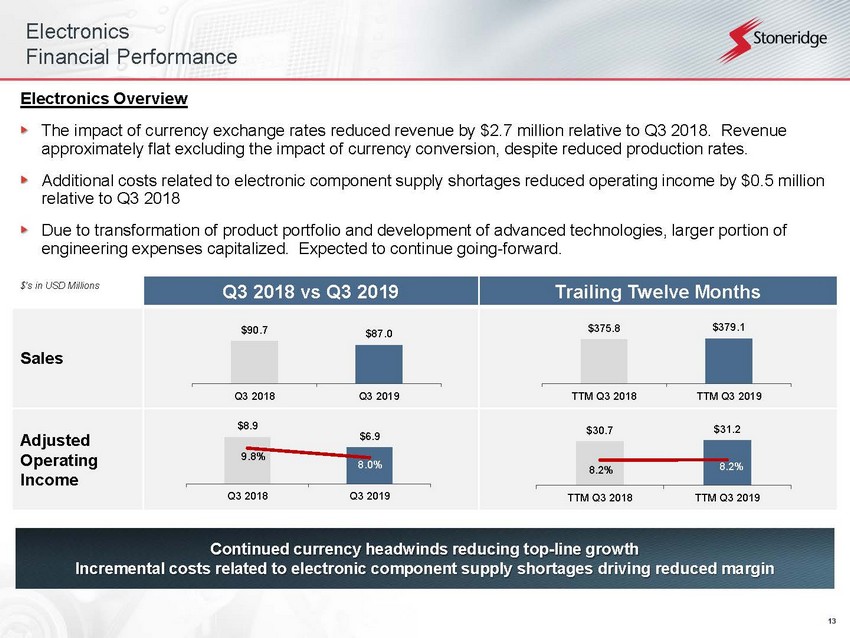
13 Electronics Financial Performance Continued currency headwinds reducing top - line growth Incremental costs related to electronic component supply shortages driving reduced margin Q3 2018 vs Q3 2019 Trailing Twelve Months Sales Adjusted Operating Income $’s in USD Millions Electronics Overview The impact of currency exchange rates reduced revenue by $2.7 million relative to Q3 2018. Revenue approximately flat excluding the impact of currency conversion, despite reduced production rates. Additional costs related to electronic component supply shortages reduced operating income by $0.5 million relative to Q3 2018 Due to transformation of product portfolio and development of advanced technologies, larger portion of engineering expenses capitalized. Expected to continue going - forward. $90.7 $87.0 $50.0 $70.0 $90.0 $110.0 Q3 2018 Q3 2019 $375.8 $379.1 $200.0 $300.0 $400.0 TTM Q3 2018 TTM Q3 2019 $8.9 $6.9 9.8% 8.0% $0.0 $5.0 $10.0 Q3 2018 Q3 2019 3.0% 5.0% 7.0% 9.0% 11.0% 13.0% 15.0% $30.7 $31.2 8.2% 8.2% $10.0 $20.0 $30.0 $40.0 TTM Q3 2018 TTM Q3 2019 5.0% 7.0% 9.0% 11.0% 13.0%
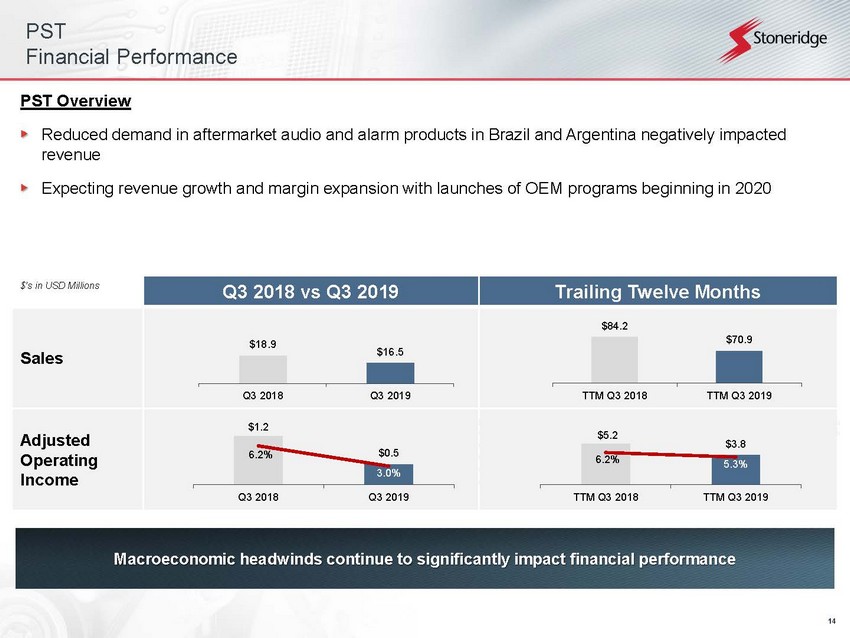
14 PST Financial Performance Macroeconomic headwinds continue to significantly impact financial performance Q3 2018 vs Q3 2019 Trailing Twelve Months Sales Adjusted Operating Income $’s in USD Millions PST Overview Reduced demand in aftermarket audio and alarm products in Brazil and Argentina negatively impacted revenue Expecting revenue growth and margin expansion with launches of OEM programs beginning in 2020 $18.9 $16.5 $10.0 $15.0 $20.0 $25.0 $30.0 Q3 2018 Q3 2019 $1.2 $0.5 6.2% 3.0% $0.0 $0.5 $1.0 $1.5 Q3 2018 Q3 2019 0.0% 2.0% 4.0% 6.0% 8.0% 10.0% $84.2 $70.9 $40.0 $60.0 $80.0 $100.0 TTM Q3 2018 TTM Q3 2019 $5.2 $3.8 6.2% 5.3% $0.0 $2.0 $4.0 $6.0 $8.0 TTM Q3 2018 TTM Q3 2019 0.0% 2.0% 4.0% 6.0% 8.0% 10.0% 12.0%
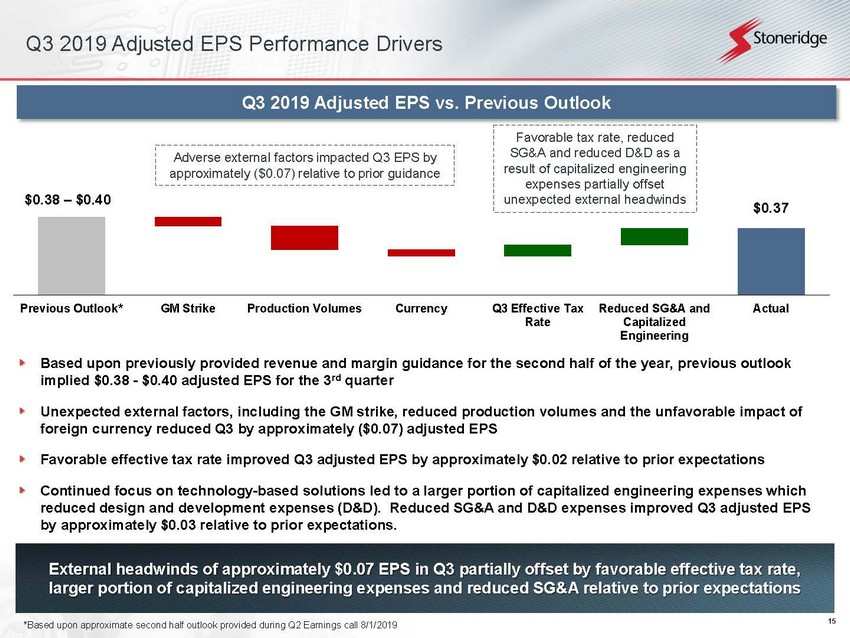
15 Q3 2019 Adjusted EPS Performance Drivers $0.38 – $0.40 $0.37 Previous Outlook* GM Strike Production Volumes Currency Q3 Effective Tax Rate Reduced SG&A and Capitalized Engineering Actual External headwinds of approximately $0.07 EPS in Q3 partially offset by favorable effective tax rate, larger portion of capitalized engineering expenses and reduced SG&A relative to prior expectations *Based upon approximate second half outlook provided during Q2 Earnings call 8/1/2019 Based upon previously provided revenue and margin guidance for the second half of the year, previous outlook implied $0.38 - $0.40 adjusted EPS for the 3 rd quarter Unexpected external factors, including the GM strike, reduced production volumes and the unfavorable impact of foreign currency reduced Q3 by approximately ($0.07) adjusted EPS Favorable effective tax rate improved Q3 adjusted EPS by approximately $0.02 relative to prior expectations Continued focus on technology - based solutions led to a larger portion of capitalized engineering expenses which reduced design and development expenses (D&D). Reduced SG&A and D&D expenses improved Q3 adjusted EPS by approximately $0.03 relative to prior expectations. Q3 2019 Adjusted EPS vs. Previous Outlook Adverse external factors impacted Q3 EPS by approximately ($0.07) relative to prior guidance Favorable tax rate, reduced SG&A and reduced D&D as a result of capitalized engineering expenses partially offset unexpected external headwinds
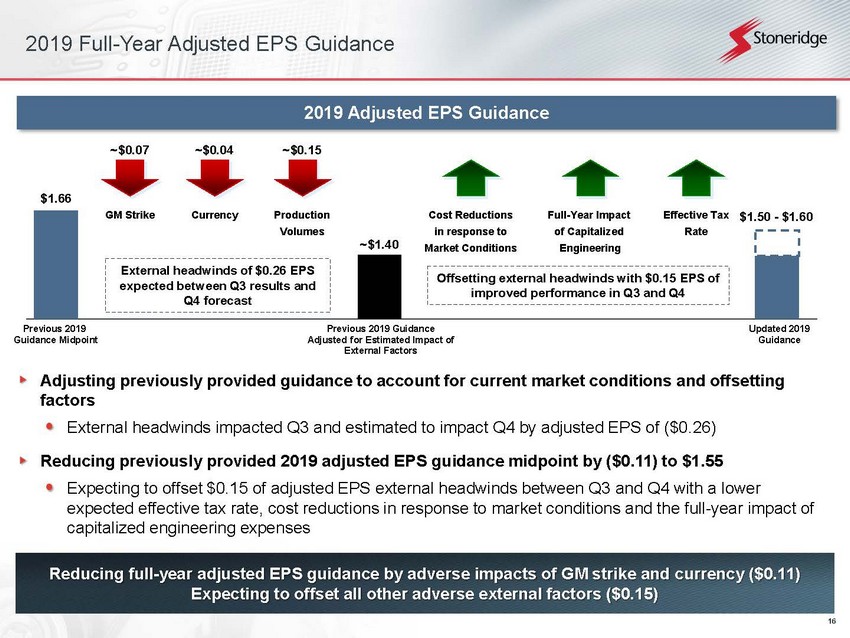
16 2019 Full - Year Adjusted EPS Guidance Reducing full - year adjusted EPS guidance by adverse impacts of GM strike and currency ($0.11) Expecting to offset all other adverse external factors ($0.15) Adjusting previously provided guidance to account for current market conditions and offsetting factors External headwinds impacted Q3 and estimated to impact Q4 by adjusted EPS of ($0.26) Reducing previously provided 2019 adjusted EPS guidance midpoint by ($0.11) to $1.55 Expecting to offset $0.15 of adjusted EPS external headwinds between Q3 and Q4 with a lower expected effective tax rate, cost reductions in response to market conditions and the full - year impact of capitalized engineering expenses Previous 2019 Guidance Midpoint GM Strike $1.50 - $1.60 Updated 2019 Guidance Currency $1.66 Production Volumes Previous 2019 Guidance Adjusted for Estimated Impact of External Factors ~$1.40 2019 Adjusted EPS Guidance Cost Reductions in response to Market Conditions Full - Year Impact of Capitalized Engineering ~$0.07 ~$0.04 ~$0.15 Effective Tax Rate Offsetting external headwinds with $0.15 EPS of improved performance in Q3 and Q4 External headwinds of $0.26 EPS expected between Q3 results and Q4 forecast
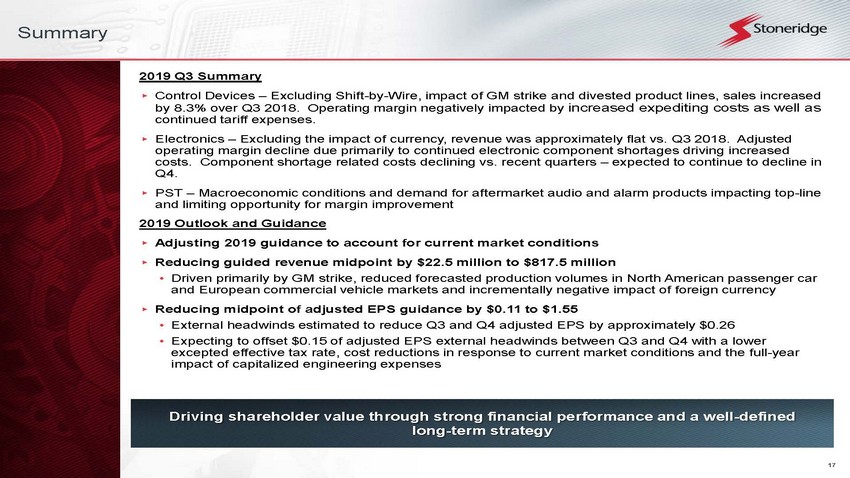
17 Summary 2019 Q3 Summary ▸ Control Devices – Excluding Shift - by - Wire, impact of GM strike and divested product lines, sales increased by 8.3% over Q3 2018. Operating margin negatively impacted by increased expediting costs as well as continued tariff expenses. ▸ Electronics – Excluding the impact of currency, revenue was approximately flat vs. Q3 2018. Adjusted operating margin decline due primarily to continued electronic component shortages driving increased costs. Component shortage related costs declining vs. recent quarters – expected to continue to decline in Q4. ▸ PST – Macroeconomic conditions and demand for aftermarket audio and alarm products impacting top - line and limiting opportunity for margin improvement 2019 Outlook and Guidance ▸ Adjusting 2019 guidance to account for current market conditions ▸ Reducing guided revenue midpoint by $22.5 million to $817.5 million • Driven primarily by GM strike, reduced forecasted production volumes in North American passenger car and European commercial vehicle markets and incrementally negative impact of foreign currency ▸ Reducing midpoint of adjusted EPS guidance by $0.11 to $1.55 • External headwinds estimated to reduce Q3 and Q4 adjusted EPS by approximately $0.26 • Expecting to offset $0.15 of adjusted EPS external headwinds between Q3 and Q4 with a lower excepted effective tax rate, cost reductions in response to current market conditions and the full - year impact of capitalized engineering expenses Driving shareholder value through strong financial performance and a well - defined long - term strategy

18 Appendix
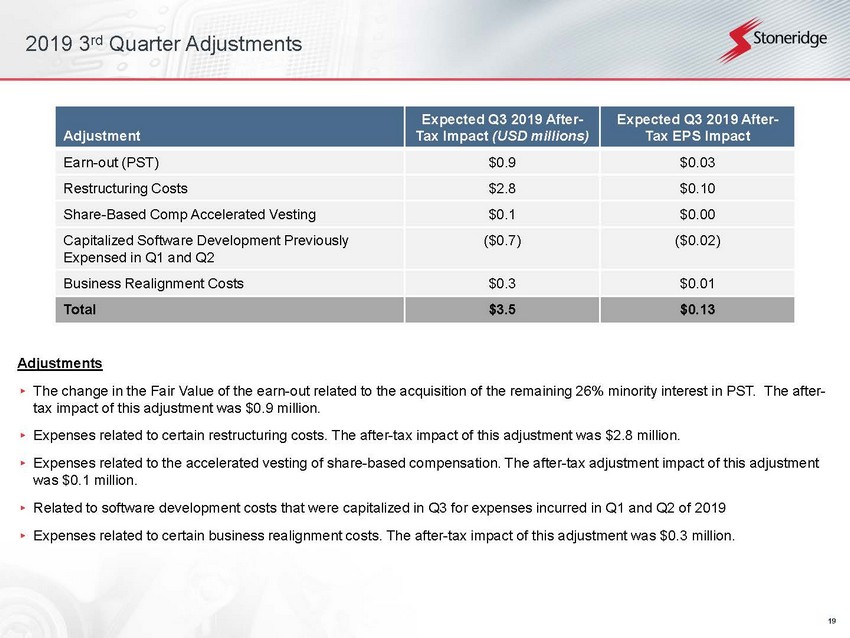
19 2019 3 rd Quarter Adjustments Adjustments ▸ The change in the Fair Value of the earn - out related to the acquisition of the remaining 26% minority interest in PST. The afte r - tax impact of this adjustment was $0.9 million. ▸ Expenses related to certain restructuring costs. The after - tax impact of this adjustment was $2.8 million. ▸ Expenses related to the accelerated vesting of share - based compensation. The after - tax adjustment impact of this adjustment was $0.1 million. ▸ Related to software development costs that were capitalized in Q3 for expenses incurred in Q1 and Q2 of 2019 ▸ Expenses related to certain business realignment costs. The after - tax impact of this adjustment was $0.3 million. Adjustment Expected Q3 2019 After - Tax Impact (USD millions) Expected Q3 2019 After - Tax EPS Impact Earn - out (PST) $0.9 $0.03 Restructuring Costs $2.8 $0.10 Share - Based Comp Accelerated Vesting $0.1 $0.00 Capitalized Software Development Previously Expensed in Q1 and Q2 ($0.7) ($0.02) Business Realignment Costs $0.3 $0.01 Total $3.5 $0.13

20 Income Statement (in thousands, except per share data) Net sales $ 203,386 $ 208,853 $ 643,924 $ 655,385 Costs and expenses: Cost of goods sold 151,531 145,568 474,389 456,713 Selling, general and administrative 30,978 32,589 94,088 105,106 Gain on disposal of non-core products, net - - (33,599) - Design and development 11,554 12,384 38,838 39,226 Operating income 9,323 18,312 70,208 54,340 Interest expense, net 1,149 1,155 3,153 3,679 Equity in earnings of investee (318) (249) (1,230) (1,435) Other income (loss), net 381 647 (148) (216) 8,111 16,759 68,433 52,312 1,450 3,467 12,351 10,520 Net income $ 6,661 $ 13,292 $ 56,082 $ 41,792 Earnings per share: Basic $ 0.24 $ 0.47 $ 2.01 $ 1.47 Diluted $ 0.24 $ 0.46 $ 1.97 $ 1.44 Weighted-average shares outstanding: Basic 27,370 28,453 27,929 28,384 Diluted 27,796 29,065 28,425 29,073 Three months ended September 30, 2019 2018 CONSOLIDATED STATEMENTS OF OPERATIONS Income before income taxes Provision for income taxes 2019 2018 September 30, Nine months ended
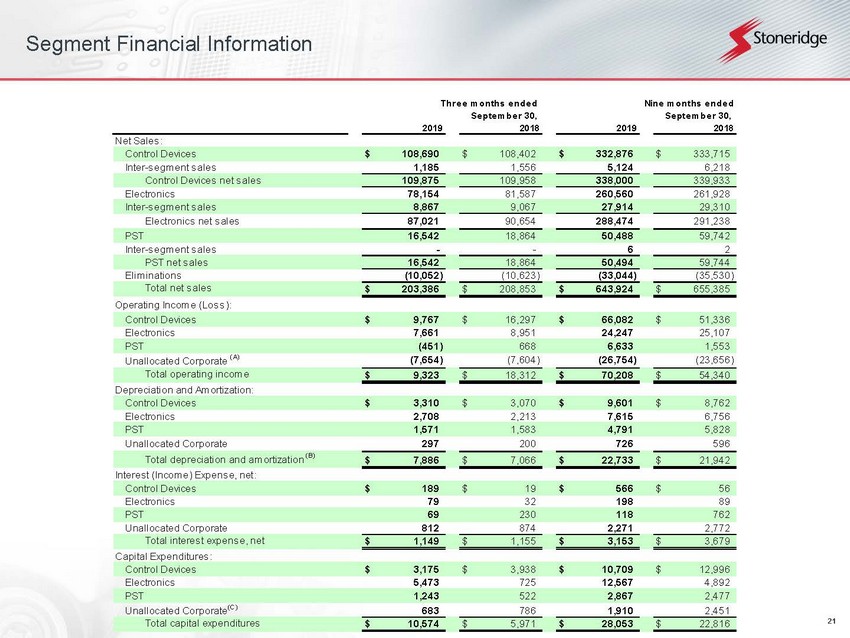
21 Segment Financial Information Net Sales: Control Devices $ 108,690 $ 108,402 $ 332,876 $ 333,715 Inter-segment sales 1,185 1,556 5,124 6,218 Control Devices net sales 109,875 109,958 338,000 339,933 Electronics 78,154 81,587 260,560 261,928 Inter-segment sales 8,867 9,067 27,914 29,310 Electronics net sales 87,021 90,654 288,474 291,238 PST 16,542 18,864 50,488 59,742 Inter-segment sales - - 6 2 PST net sales 16,542 18,864 50,494 59,744 Eliminations (10,052) (10,623) (33,044) (35,530) Total net sales $ 203,386 $ 208,853 $ 643,924 $ 655,385 Operating Income (Loss): Control Devices $ 9,767 $ 16,297 $ 66,082 $ 51,336 Electronics 7,661 8,951 24,247 25,107 PST (451) 668 6,633 1,553 Unallocated Corporate (A) (7,654) (7,604) (26,754) (23,656) Total operating income $ 9,323 $ 18,312 $ 70,208 $ 54,340 Depreciation and Amortization: Control Devices $ 3,310 $ 3,070 $ 9,601 $ 8,762 Electronics 2,708 2,213 7,615 6,756 PST 1,571 1,583 4,791 5,828 Unallocated Corporate 297 200 726 596 Total depreciation and amortization (B) $ 7,886 $ 7,066 $ 22,733 $ 21,942 Interest (Income) Expense, net: Control Devices $ 189 $ 19 $ 566 $ 56 Electronics 79 32 198 89 PST 69 230 118 762 Unallocated Corporate 812 874 2,271 2,772 Total interest expense, net $ 1,149 $ 1,155 $ 3,153 $ 3,679 Capital Expenditures: Control Devices $ 3,175 $ 3,938 $ 10,709 $ 12,996 Electronics 5,473 725 12,567 4,892 PST 1,243 522 2,867 2,477 Unallocated Corporate (C) 683 786 1,910 2,451 Total capital expenditures $ 10,574 $ 5,971 $ 28,053 $ 22,816 2019 20182019 2018 September 30, Three months ended Nine months ended September 30,
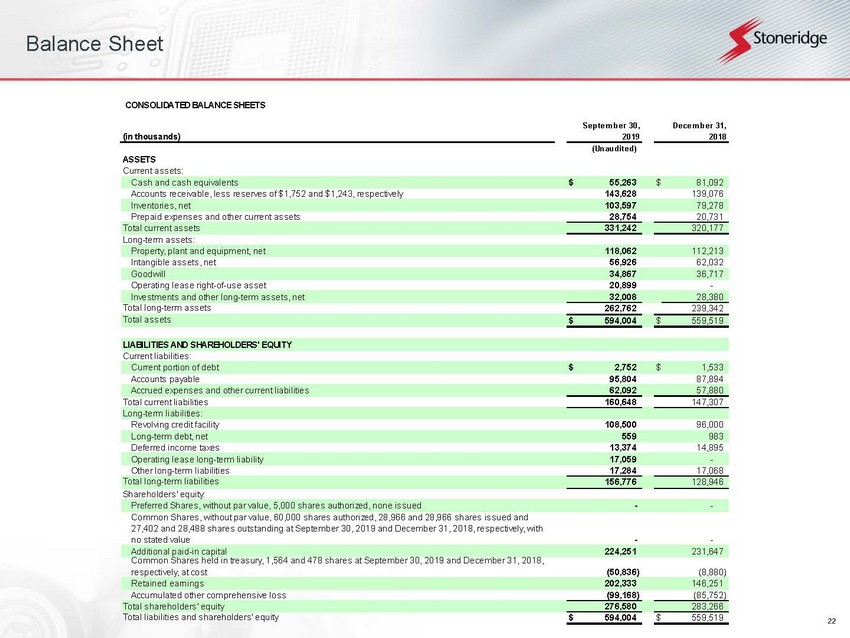
22 Balance Sheet CONSOLIDATED BALANCE SHEETS (in thousands) (Unaudited) ASSETS Current assets: Cash and cash equivalents $ 55,263 $ 81,092 Accounts receivable, less reserves of $1,752 and $1,243, respectively 143,628 139,076 Inventories, net 103,597 79,278 Prepaid expenses and other current assets 28,754 20,731 Total current assets 331,242 320,177 Long-term assets: Property, plant and equipment, net 118,062 112,213 Intangible assets, net 56,926 62,032 Goodwill 34,867 36,717 Operating lease right-of-use asset 20,899 - Investments and other long-term assets, net 32,008 28,380 Total long-term assets 262,762 239,342 Total assets $ 594,004 $ 559,519 LIABILITIES AND SHAREHOLDERS' EQUITY Current liabilities: Current portion of debt $ 2,752 $ 1,533 Accounts payable 95,804 87,894 Accrued expenses and other current liabilities 62,092 57,880 Total current liabilities 160,648 147,307 Long-term liabilities: Revolving credit facility 108,500 96,000 Long-term debt, net 559 983 Deferred income taxes 13,374 14,895 Operating lease long-term liability 17,059 - Other long-term liabilities 17,284 17,068 Total long-term liabilities 156,776 128,946 Shareholders' equity: Preferred Shares, without par value, 5,000 shares authorized, none issued - - Common Shares, without par value, 60,000 shares authorized, 28,966 and 28,966 shares issued and 27,402 and 28,488 shares outstanding at September 30, 2019 and December 31, 2018, respectively, with no stated value - - Additional paid-in capital 224,251 231,647 Common Shares held in treasury, 1,564 and 478 shares at September 30, 2019 and December 31, 2018, respectively, at cost (50,836) (8,880) Retained earnings 202,333 146,251 Accumulated other comprehensive loss (99,168) (85,752) Total shareholders' equity 276,580 283,266 Total liabilities and shareholders' equity $ 594,004 $ 559,519 2018 December 31, 2019 September 30,
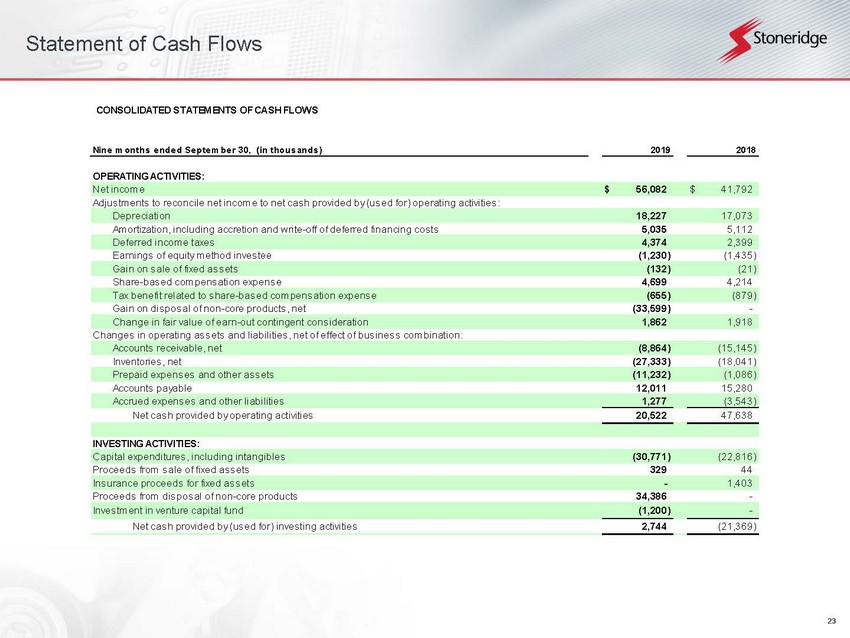
23 Statement of Cash Flows CONSOLIDATED STATEMENTS OF CASH FLOWS Nine months ended September 30, (in thousands) OPERATING ACTIVITIES: Net income $ 56,082 $ 41,792 Adjustments to reconcile net income to net cash provided by (used for) operating activities: Depreciation 18,227 17,073 Amortization, including accretion and write-off of deferred financing costs 5,035 5,112 Deferred income taxes 4,374 2,399 Earnings of equity method investee (1,230) (1,435) Gain on sale of fixed assets (132) (21) Share-based compensation expense 4,699 4,214 Tax benefit related to share-based compensation expense (655) (879) Gain on disposal of non-core products, net (33,599) - Change in fair value of earn-out contingent consideration 1,862 1,918 Changes in operating assets and liabilities, net of effect of business combination: Accounts receivable, net (8,864) (15,145) Inventories, net (27,333) (18,041) Prepaid expenses and other assets (11,232) (1,086) Accounts payable 12,011 15,280 Accrued expenses and other liabilities 1,277 (3,543) Net cash provided by operating activities 20,522 47,638 INVESTING ACTIVITIES: Capital expenditures, including intangibles (30,771) (22,816) Proceeds from sale of fixed assets 329 44 Insurance proceeds for fixed assets - 1,403 Proceeds from disposal of non-core products 34,386 - Investment in venture capital fund (1,200) - Net cash provided by (used for) investing activities 2,744 (21,369) 2019 2018

24 Statement of Cash Flows (Cont.) CONSOLIDATED STATEMENTS OF CASH FLOWS Nine months ended September 30, (in thousands) FINANCING ACTIVITIES: Revolving credit facility borrowings 81,500 27,500 Revolving credit facility payments (69,000) (47,500) Proceeds from issuance of debt 2,195 369 Repayments of debt (1,300) (4,372) Earn-out consideration cash payment (3,394) - Other financing costs (1,346) - Common Share repurchase program (50,000) - Repurchase of Common Shares to satisfy employee tax withholding (4,037) (4,206) Net cash used for financing activities (45,382) (28,209) Effect of exchange rate changes on cash and cash equivalents (3,713) (3,408) Net change in cash and cash equivalents (25,829) (5,348) Cash and cash equivalents at beginning of period 81,092 66,003 Cash and cash equivalents at end of period $ 55,263 $ 60,655 Supplemental disclosure of cash flow information: Cash paid for interest $ 3,210 $ 3,899 Cash paid for income taxes, net $ 11,858 $ 14,899 Supplemental disclosure of non-cash operating and financing activities: Bank payment of vendor payables under short-term debt obligations $ - $ - 2019 2018

25 Reconciliations to US GAAP

26 Reconciliations to US GAAP This document contains information about Stoneridge's financial results which is not presented in accordance with accounting principles generally accepted in the United States ("GAAP"). Such non - GAAP financial measures are reconciled to their closest GAAP financial measures in the appendix of this document. The provision of these non - GAAP financial measures is not intended to indicate that Stoneridge is explicitly or implicitly providing projections on those non - GAAP financial measures, and actual results for such measures are likely to vary from those presented. The reconciliations include all information reasonably available to the Company at the date of this document and the adjustments that management can reasonably predict.
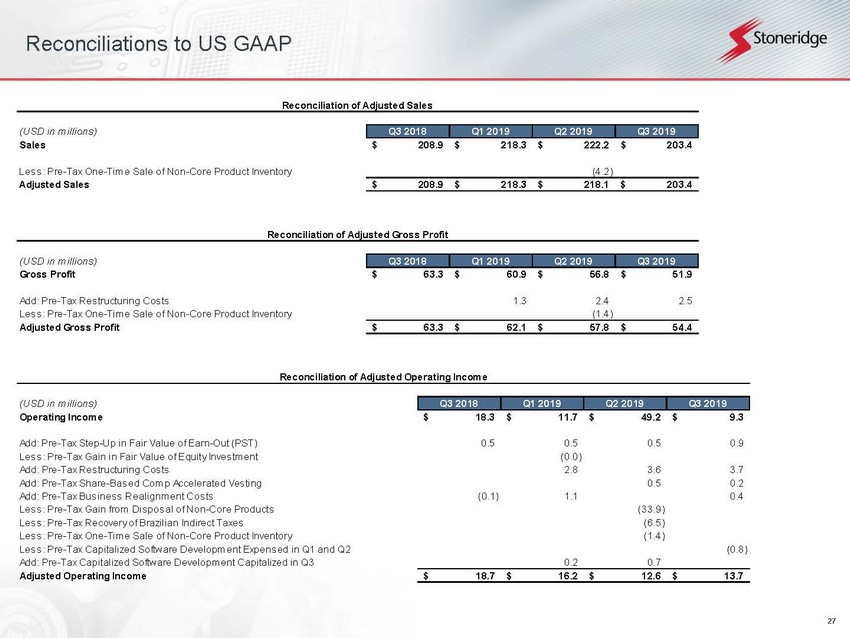
27 Reconciliations to US GAAP (USD in millions) Q3 2018 Q1 2019 Q2 2019 Q3 2019 Sales 208.9$ 218.3$ 222.2$ 203.4$ Less: Pre-Tax One-Time Sale of Non-Core Product Inventory (4.2) Adjusted Sales 208.9$ 218.3$ 218.1$ 203.4$ Reconciliation of Adjusted Sales (USD in millions) Q3 2018 Q1 2019 Q2 2019 Q3 2019 Gross Profit 63.3$ 60.9$ 56.8$ 51.9$ Add: Pre-Tax Restructuring Costs 1.3 2.4 2.5 Less: Pre-Tax One-Time Sale of Non-Core Product Inventory (1.4) Adjusted Gross Profit 63.3$ 62.1$ 57.8$ 54.4$ Reconciliation of Adjusted Gross Profit (USD in millions) Q3 2018 Q1 2019 Q2 2019 Q3 2019 Operating Income 18.3$ 11.7$ 49.2$ 9.3$ Add: Pre-Tax Step-Up in Fair Value of Earn-Out (PST) 0.5 0.5 0.5 0.9 Less: Pre-Tax Gain in Fair Value of Equity Investment (0.0) Add: Pre-Tax Restructuring Costs 2.8 3.6 3.7 Add: Pre-Tax Share-Based Comp Accelerated Vesting 0.5 0.2 Add: Pre-Tax Business Realignment Costs (0.1) 1.1 0.4 Less: Pre-Tax Gain from Disposal of Non-Core Products (33.9) Less: Pre-Tax Recovery of Brazilian Indirect Taxes (6.5) Less: Pre-Tax One-Time Sale of Non-Core Product Inventory (1.4) Less: Pre-Tax Capitalized Software Development Expensed in Q1 and Q2 (0.8) Add: Pre-Tax Capitalized Software Development Capitalized in Q3 0.2 0.7 Adjusted Operating Income 18.7$ 16.2$ 12.6$ 13.7$ Reconciliation of Adjusted Operating Income
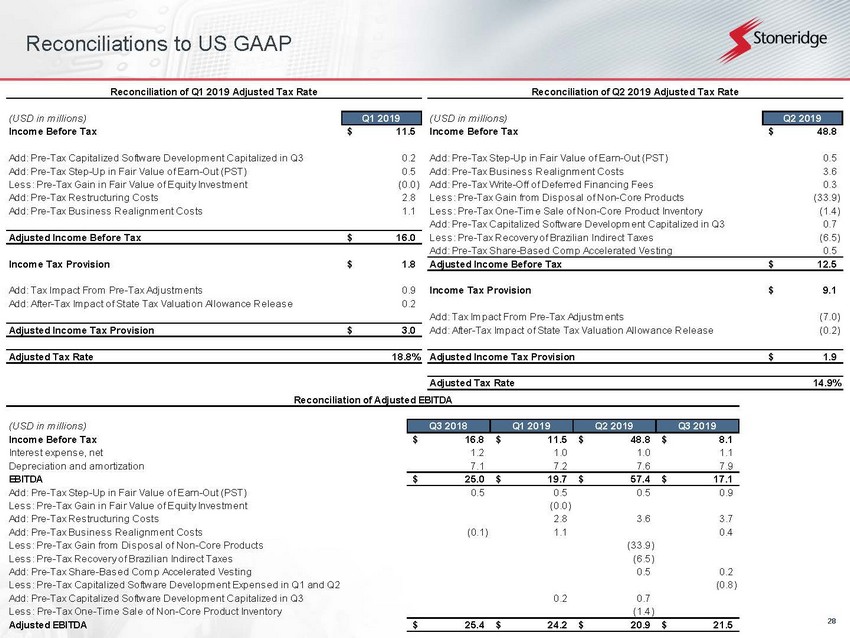
28 Reconciliations to US GAAP (USD in millions) Q3 2018 Q1 2019 Q2 2019 Q3 2019 Income Before Tax 16.8$ 11.5$ 48.8$ 8.1$ Interest expense, net 1.2 1.0 1.0 1.1 Depreciation and amortization 7.1 7.2 7.6 7.9 EBITDA 25.0$ 19.7$ 57.4$ 17.1$ Add: Pre-Tax Step-Up in Fair Value of Earn-Out (PST) 0.5 0.5 0.5 0.9 Less: Pre-Tax Gain in Fair Value of Equity Investment (0.0) Add: Pre-Tax Restructuring Costs 2.8 3.6 3.7 Add: Pre-Tax Business Realignment Costs (0.1) 1.1 0.4 Less: Pre-Tax Gain from Disposal of Non-Core Products (33.9) Less: Pre-Tax Recovery of Brazilian Indirect Taxes (6.5) Add: Pre-Tax Share-Based Comp Accelerated Vesting 0.5 0.2 Less: Pre-Tax Capitalized Software Development Expensed in Q1 and Q2 (0.8) Add: Pre-Tax Capitalized Software Development Capitalized in Q3 0.2 0.7 Less: Pre-Tax One-Time Sale of Non-Core Product Inventory (1.4) Adjusted EBITDA 25.4$ 24.2$ 20.9$ 21.5$ Reconciliation of Adjusted EBITDA (USD in millions) Q1 2019 Income Before Tax 11.5$ Add: Pre-Tax Capitalized Software Development Capitalized in Q3 0.2 Add: Pre-Tax Step-Up in Fair Value of Earn-Out (PST) 0.5 Less: Pre-Tax Gain in Fair Value of Equity Investment (0.0) Add: Pre-Tax Restructuring Costs 2.8 Add: Pre-Tax Business Realignment Costs 1.1 Adjusted Income Before Tax 16.0$ Income Tax Provision 1.8$ Add: Tax Impact From Pre-Tax Adjustments 0.9 Add: After-Tax Impact of State Tax Valuation Allowance Release 0.2 Adjusted Income Tax Provision 3.0$ Adjusted Tax Rate 18.8% Reconciliation of Q1 2019 Adjusted Tax Rate (USD in millions) Q2 2019 Income Before Tax 48.8$ Add: Pre-Tax Step-Up in Fair Value of Earn-Out (PST) 0.5 Add: Pre-Tax Business Realignment Costs 3.6 Add: Pre-Tax Write-Off of Deferred Financing Fees 0.3 Less: Pre-Tax Gain from Disposal of Non-Core Products (33.9) Less: Pre-Tax One-Time Sale of Non-Core Product Inventory (1.4) Add: Pre-Tax Capitalized Software Development Capitalized in Q3 0.7 Less: Pre-Tax Recovery of Brazilian Indirect Taxes (6.5) Add: Pre-Tax Share-Based Comp Accelerated Vesting 0.5 Adjusted Income Before Tax 12.5$ Income Tax Provision 9.1$ Add: Tax Impact From Pre-Tax Adjustments (7.0) Add: After-Tax Impact of State Tax Valuation Allowance Release (0.2) Adjusted Income Tax Provision 1.9$ Adjusted Tax Rate 14.9% Reconciliation of Q2 2019 Adjusted Tax Rate
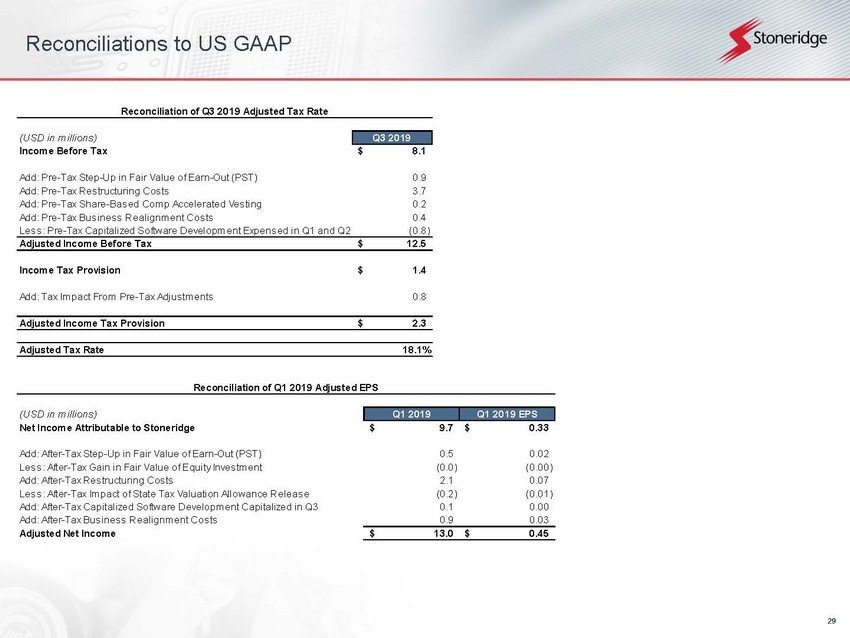
29 Reconciliations to US GAAP (USD in millions) Q1 2019 Q1 2019 EPS Net Income Attributable to Stoneridge 9.7$ 0.33$ Add: After-Tax Step-Up in Fair Value of Earn-Out (PST) 0.5 0.02 Less: After-Tax Gain in Fair Value of Equity Investment (0.0) (0.00) Add: After-Tax Restructuring Costs 2.1 0.07 Less: After-Tax Impact of State Tax Valuation Allowance Release (0.2) (0.01) Add: After-Tax Capitalized Software Development Capitalized in Q3 0.1 0.00 Add: After-Tax Business Realignment Costs 0.9 0.03 Adjusted Net Income 13.0$ 0.45$ Reconciliation of Q1 2019 Adjusted EPS (USD in millions) Q3 2019 Income Before Tax 8.1$ Add: Pre-Tax Step-Up in Fair Value of Earn-Out (PST) 0.9 Add: Pre-Tax Restructuring Costs 3.7 Add: Pre-Tax Share-Based Comp Accelerated Vesting 0.2 Add: Pre-Tax Business Realignment Costs 0.4 Less: Pre-Tax Capitalized Software Development Expensed in Q1 and Q2 (0.8) Adjusted Income Before Tax 12.5$ Income Tax Provision 1.4$ Add: Tax Impact From Pre-Tax Adjustments 0.8 Adjusted Income Tax Provision 2.3$ Adjusted Tax Rate 18.1% Reconciliation of Q3 2019 Adjusted Tax Rate

30 Reconciliations to US GAAP (USD in millions) Q2 2019 Q2 2019 EPS Net Income Attributable to Stoneridge 39.8$ 1.41$ Add: After-Tax Step-Up in Fair Value of Earn-Out (PST) 0.4 0.02 Add: After-Tax Business Realignment Costs 2.7 0.10 Add: After-Tax Write-Off of Deferred Financing Fees 0.2 0.01 Add: After-Tax Share-Based Comp Accelerated Vesting 0.4 0.01 Add: After-Tax Capitalized Software Development Capitalized in Q3 0.5 0.02 Add: After-Tax Impact of State Tax Valuation Allowance Release 0.2 0.01 Less: After-Tax Gain from Disposal of Non-Core Products (28.0) (0.99) Less: After-Tax Recovery of Brazilian Indirect Taxes (5.6) (0.20) Adjusted Net Income 10.7$ 0.38$ Reconciliation of Q2 2019 Adjusted EPS (USD in millions) Q3 2019 Q3 2019 EPS Net Income Attributable to Stoneridge 6.7$ 0.24$ Add: After-Tax Step-Up in Fair Value of Earn-Out (PST) 0.9 0.03 Add: After-Tax Restructuring Costs 2.8 0.10 Add: After-Tax Share-Based Comp Accelerated Vesting 0.1 0.00 Less: After-Tax Capitalized Software Development Expensed in Q1 and Q2 (0.7) (0.02) Add: After-Tax Business Realignment Costs 0.3 0.01 Adjusted Net Income 10.2$ 0.37$ Reconciliation of Q3 2019 Adjusted EPS
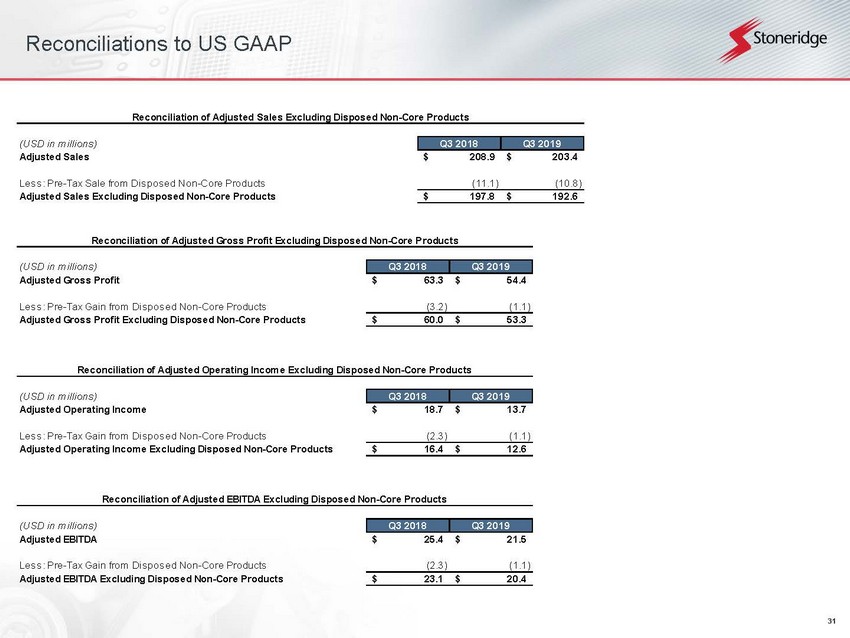
31 Reconciliations to US GAAP (USD in millions) Q3 2018 Q3 2019 Adjusted Gross Profit 63.3$ 54.4$ Less: Pre-Tax Gain from Disposed Non-Core Products (3.2) (1.1) Adjusted Gross Profit Excluding Disposed Non-Core Products 60.0$ 53.3$ Reconciliation of Adjusted Gross Profit Excluding Disposed Non-Core Products (USD in millions) Q3 2018 Q3 2019 Adjusted Operating Income 18.7$ 13.7$ Less: Pre-Tax Gain from Disposed Non-Core Products (2.3) (1.1) Adjusted Operating Income Excluding Disposed Non-Core Products 16.4$ 12.6$ Reconciliation of Adjusted Operating Income Excluding Disposed Non-Core Products (USD in millions) Q3 2018 Q3 2019 Adjusted EBITDA 25.4$ 21.5$ Less: Pre-Tax Gain from Disposed Non-Core Products (2.3) (1.1) Adjusted EBITDA Excluding Disposed Non-Core Products 23.1$ 20.4$ Reconciliation of Adjusted EBITDA Excluding Disposed Non-Core Products (USD in millions) Q3 2018 Q3 2019 Adjusted Sales 208.9$ 203.4$ Less: Pre-Tax Sale from Disposed Non-Core Products (11.1) (10.8) Adjusted Sales Excluding Disposed Non-Core Products 197.8$ 192.6$ Reconciliation of Adjusted Sales Excluding Disposed Non-Core Products

32 Reconciliations to US GAAP (USD in millions) Q4 2017 Q1 2018 Q2 2018 Q3 2018 Q4 2018 Q1 2019 Q2 2019 Q3 2019 Control Devices Sales 109.6$ 117.5$ 112.4$ 110.0$ 109.7$ 112.0$ 116.1$ 109.9$ Less: Pre-Tax One-Time Sale of Non-Core Product Inventory - - - - - - (4.2) Adjusted Control Devices Sales 109.6$ 117.5$ 112.4$ 110.0$ 109.7$ 112.0$ 112.0$ 109.9$ Reconciliation of Control Devices Adjusted Sales (USD in millions) Q4 2017 Q1 2018 Q2 2018 Q3 2018 Q4 2018 Q1 2019 Q2 2019 Q3 2019 Control Devices Operating Income 17.3$ 17.9$ 17.2$ 16.3$ 12.9$ 11.9$ 44.4$ 9.8$ Add: Pre-Tax Restructuring Costs 2.2 3.5 3.6 Less: Pre-Tax Gain from Disposal of Non-Core Products (35.0) Add: Pre-Tax Business Realignment Costs 0.1 0.5 Control Devices Adjusted Operating Income 17.3$ 17.9$ 17.3$ 16.3$ 12.9$ 14.7$ 12.9$ 13.3$ Reconciliation of Control Devices Adjusted Operating Income (USD in millions) Q4 2017 Q1 2018 Q2 2018 Q3 2018 Q4 2018 Q1 2019 Q2 2019 Q3 2019 Adjusted Operating Income 17.3$ 17.9$ 17.3$ 16.3$ 12.9$ 14.7$ 12.9$ 13.3$ Less: Pre-Tax Gain from Disposed Non-Core Products (1.9) (2.4) (2.3) (2.3) (2.0) (2.0) - (1.1) Adjusted Operating Income Excluding Disposed Non-Core Products 15.4$ 15.5$ 15.0$ 14.0$ 10.8$ 12.7$ 12.9$ 12.3$ Reconciliation of Control Devices Adjusted Operating Income Excluding Disposed Non-Core Products (USD in millions) Q4 2017 Q1 2018 Q2 2018 Q3 2018 Q4 2018 Q1 2019 Q2 2019 Q3 2019 Adjusted Control Devices Sales 109.6$ 117.5$ 112.4$ 110.0$ 109.7$ 112.0$ 112.0$ 109.9$ Less: Sales from Disposed Non-Core Products (10.2) (11.9) (11.2) (11.1) (10.3) (11.1) (9.1) (10.8) Adjusted Control Devices Sales Excluding Disposed Non-Core Products 99.4$ 105.7$ 101.2$ 98.9$ 99.4$ 100.9$ 102.9$ 99.1$ Reconciliation of Control Devices Adjusted Sales Excluding Disposed Non-Core Products
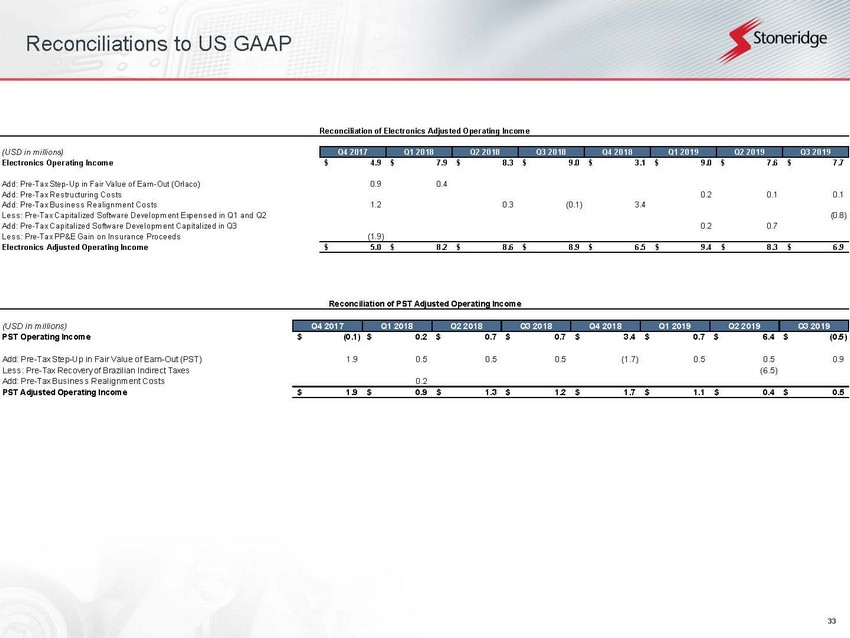
33 Reconciliations to US GAAP (USD in millions) Q4 2017 Q1 2018 Q2 2018 Q3 2018 Q4 2018 Q1 2019 Q2 2019 Q3 2019 PST Operating Income (0.1)$ 0.2$ 0.7$ 0.7$ 3.4$ 0.7$ 6.4$ (0.5)$ Add: Pre-Tax Step-Up in Fair Value of Earn-Out (PST) 1.9 0.5 0.5 0.5 (1.7) 0.5 0.5 0.9 Less: Pre-Tax Recovery of Brazilian Indirect Taxes (6.5) Add: Pre-Tax Business Realignment Costs 0.2 PST Adjusted Operating Income 1.9$ 0.9$ 1.3$ 1.2$ 1.7$ 1.1$ 0.4$ 0.5$ Reconciliation of PST Adjusted Operating Income (USD in millions) Q4 2017 Q1 2018 Q2 2018 Q3 2018 Q4 2018 Q1 2019 Q2 2019 Q3 2019 Electronics Operating Income 4.9$ 7.9$ 8.3$ 9.0$ 3.1$ 9.0$ 7.6$ 7.7$ Add: Pre-Tax Step-Up in Fair Value of Earn-Out (Orlaco) 0.9 0.4 Add: Pre-Tax Restructuring Costs 0.2 0.1 0.1 Add: Pre-Tax Business Realignment Costs 1.2 0.3 (0.1) 3.4 Less: Pre-Tax Capitalized Software Development Expensed in Q1 and Q2 (0.8) Add: Pre-Tax Capitalized Software Development Capitalized in Q3 0.2 0.7 Less: Pre-Tax PP&E Gain on Insurance Proceeds (1.9) Electronics Adjusted Operating Income 5.0$ 8.2$ 8.6$ 8.9$ 6.5$ 9.4$ 8.3$ 6.9$ Reconciliation of Electronics Adjusted Operating Income