Full - Year and Q4 2021 Results March 1, 2022 Exhibit 99.2
2 Forward - Looking Statements Statements in this presentation that are not historical facts are forward - looking statements, which involve risks and uncertaint ies that could cause actual events or results to differ materially from those expressed or implied by the statements. Important factors that ma y cause actual results to differ materially from those in the forward - looking statements include, among other factors, the impact of COVID - 19, or other future pandemics, on the global economy, and on our customers, suppliers, employees, business and cash flows; the reduced purchases, lo ss or bankruptcy of a major customer or supplier; the costs and timing of facility closures, business realignment or similar action s; a significant change in automotive, commercial, off - highway and agricultural vehicle production; competitive market conditions and resulting effects on sales and pricing; our ability to successfully launch/produce products for awarded business; adverse changes in laws, governm ent regulations or market conditions, including tariffs, affecting our products or customers products; labor disruptions at Stone rid ge’s facilities or at any of Stoneridge’s significant customers or suppliers; the ability of suppliers to supply Stoneridge with parts and compo nen ts at competitive prices on a timely basis; the amount of Stoneridge’s indebtedness and the restrictive covenants contained in the agr eements governing its indebtedness, including its revolving credit facility; customer acceptance of new products; capital availabilit y o r costs, including changes in interest rates or market perceptions; the failure to achieve successful integration of any acquired company or bus ine ss; the occurrence or non - occurrence of circumstances beyond Stoneridge’s control; and the items described in “Risk Factors” and other uncertainties or risks discussed in Stoneridge’s periodic and current reports filed with the Securities and Exchange Commissi on. Important factors that could cause the performance of the commercial vehicle and automotive industry to differ materially fro m t hose in the forward - looking statements include factors such as (1) the ability of our suppliers to supply us with parts and components at co mpetitive prices on a timely basis, including the impact of potential tariffs and trade considerations on their operations and output, (2) our ability to achieve cost reductions that offset or exceed customer - mandated selling price reductions, (3) the impact of COVID - 19, or other f uture pandemics, on the global economy, and on our customers, suppliers, employees, business and cash flows, (4) continued economic in stability or poor economic conditions in the United States and global markets, (5) changes in economic conditions, housing prices, fore ign currency exchange rates, commodity prices, including shortages of and increases or volatility in the price of oil, (6) changes in laws an d regulations, (7) the state of the credit markets, (8) political stability, (9) international conflicts and (10) the occurrence of force ma jeu re events. These factors should not be construed as exhaustive and should be considered with the other cautionary statements in Stonerid ge’ s filings with the Securities and Exchange Commission. Forward - looking statements are not guarantees of future performance; Stoneridge’s actual results of operations, financial condit ion and liquidity, and the development of the industry in which Stoneridge operates may differ materially from those described in or sug gested by the forward - looking statements contained in this presentation. In addition, even if Stoneridge’s results of operations, financial co ndition and liquidity, and the development of the industry in which Stoneridge operates are consistent with the forward - looking statements c ontained in this presentation, those results or developments may not be indicative of results or developments in subsequent periods. This presentation contains time - sensitive information that reflects management’s best analysis only as of the date of this prese ntation. Any forward - looking statements in this presentation speak only as of the date of this presentation, and Stoneridge undertakes no obl igation to update such statements. Comparisons of results for current and any prior periods are not intended to express any future tren ds or indications of future performance, unless expressed as such, and should only be viewed as historical data. Stoneridge does not undertake any obligation to publicly update or revise any forward - looking statement as a result of new infor mation, future events or otherwise, except as otherwise required by law. Rounding Disclosure: There may be slight immaterial differences between figures represented in our public filings compared t o w hat is shown in this presentation. The differences are the result of rounding due to the representation of values in millions rathe r t han thousands in public filings.

3 Overview of Achievements Q 4 2021 Key Accomplishments and 2022 Expectations Q 4 2021 Financial Performance 2021 Financial Performance and 2022 Guidance 2021 Reported 2021 Adjusted 2022 Guidance $ 770.5 million $750.5 million $860.0 – $900.0 million $ 166.9 million 21.7% $ 168.4 million 22.4% 21.5% - 22.5% $15.4 million 2.0% ($12.2 million) (1.6%) 0.75% - 1.75% 72.6% 2.8% $2.5 million - $4.5 million $0.12 ($0.59) ($0.15) - $0.10 $51.5 million 6.7% $23.7 million 3.2% $43 million - $54 million 5.0% - 6.0% Reported Adjusted Sales $203 .7 million $184.7 million Gross Profit Margin $ 41.9 million 20.6% $ 42.0 million 22.7% Operating Income Margin ($4.4 million) (2.2%) ($7.0 million) (3.8%) Tax Rate (59.2%) 15.0% EPS ($0.23) ($0.24) EBITDA Margin $5.0 million 2.4% $2.4 million 1.3% x Offset ~78% of gross supply chain - related costs, including recoveries for historical costs in Q4, driving net impact of supply c hain - related costs favorable vs. prior guidance despite significant increase in gross costs x Beginning to recognize impact of price recovery negotiations with customers – including one - time recoveries for historical costs x First MirrorEye OEM program launched in Europe – initial take rate of at least 35% of new trucks (vs. quoted take rate of ~16%) x Fleet expansions continuing and incremental bus awards expanding non - traditional market opportunities x Backlog increased from $3.0 billion in 2021 to $3.4 billion in 2022 (13% increase) x Updated long - term guidance to ~$1.0 billion of revenue in 2023, $1.25 billion+ of revenue in 2026 (~9% 5 - year revenue CAGR) and EBITDA margin target of 14% in 2026
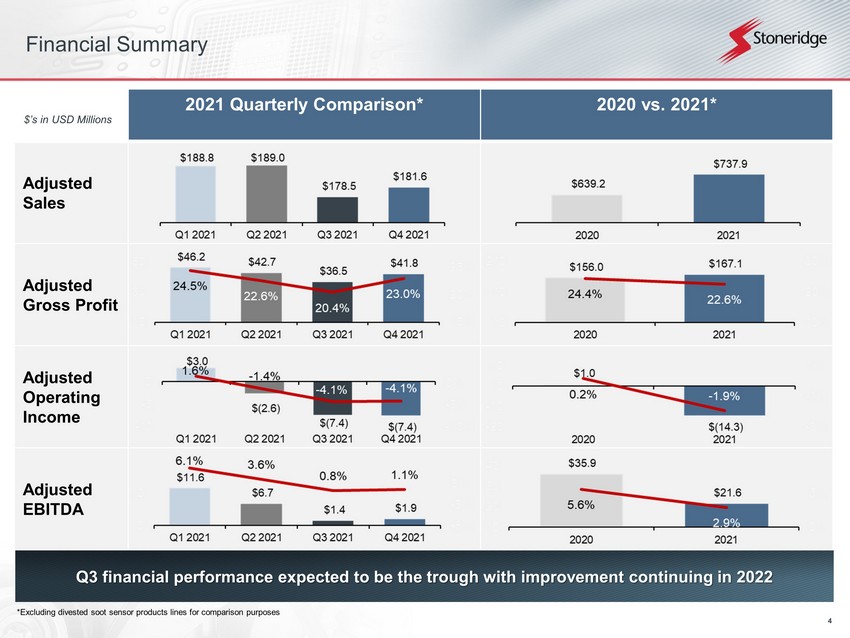
4 2021 Quarterly Comparison* 2020 vs. 2021* Adjusted Sales Adjusted Gross Profit Adjusted Operating Income Adjusted EBITDA Q3 financial performance expected to be the trough with improvement continuing in 2022 $’s in USD Millions * Excluding divested soot sensor products lines for comparison purposes Financial Summary

5 Continued progress in recovering incremental supply chain - related costs Material cost increases continue to be the largest driver of incremental net supply chain - related costs Continued Supply Chain Challenges Offset ~78% of costs in Q4 Supply Chain Update ▸ Offset ~$18.5 million of incremental supply chain - related costs in Q4, or ~78% of supply chain - related costs (including recovery of historical costs) ▸ Significant increase in Q4 gross supply - chain related costs primarily related to electronic component shortages and spot - buys ▸ Material cost increases through our traditional supply chain continue to be our largest net cost driver – expected to continue in 2022 ($3.1 million of $5.1 million net costs in Q4) *Net spot purchases include recoveries from prior period expenses
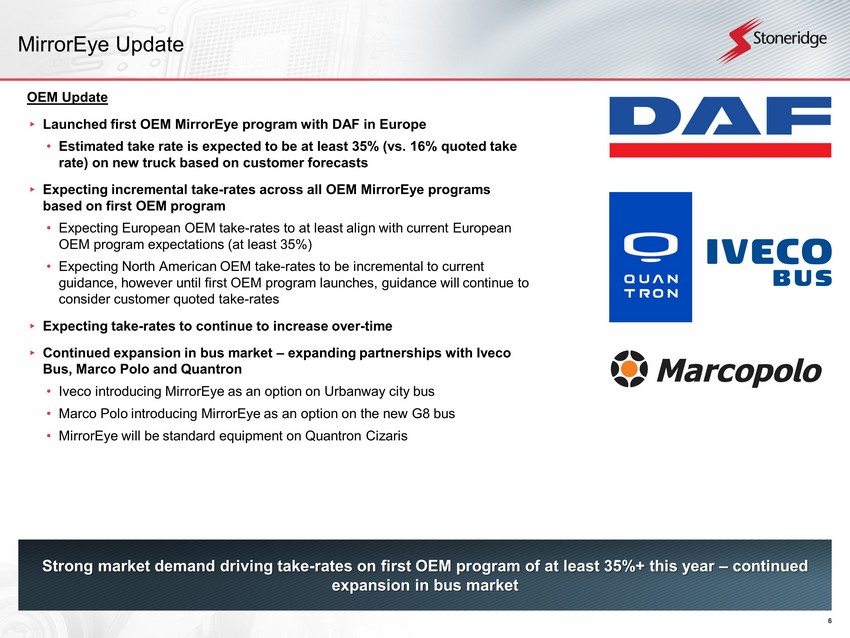
6 MirrorEye Update Strong market demand driving take - rates on first OEM program of at least 35%+ this year – continued expansion in bus market OEM Update ▸ Launched first OEM MirrorEye program with DAF in Europe • Estimated take rate is expected to be at least 35% (vs. 16% quoted take rate) on new truck based on customer forecasts ▸ Expecting incremental take - rates across all OEM MirrorEye programs based on first OEM program • Expecting European OEM take - rates to at least align with current European OEM program expectations (at least 35%) • Expecting North American OEM take - rates to be incremental to current guidance, however until first OEM program launches, guidance will continue to consider customer quoted take - rates ▸ Expecting take - rates to continue to increase over - time ▸ Continued expansion in bus market – expanding partnerships with Iveco Bus, Marco Polo and Quantron • Iveco introducing MirrorEye as an option on Urbanway city bus • Marco Polo introducing MirrorEye as an option on the new G8 bus • MirrorEye will be standard equipment on Quantron Cizaris
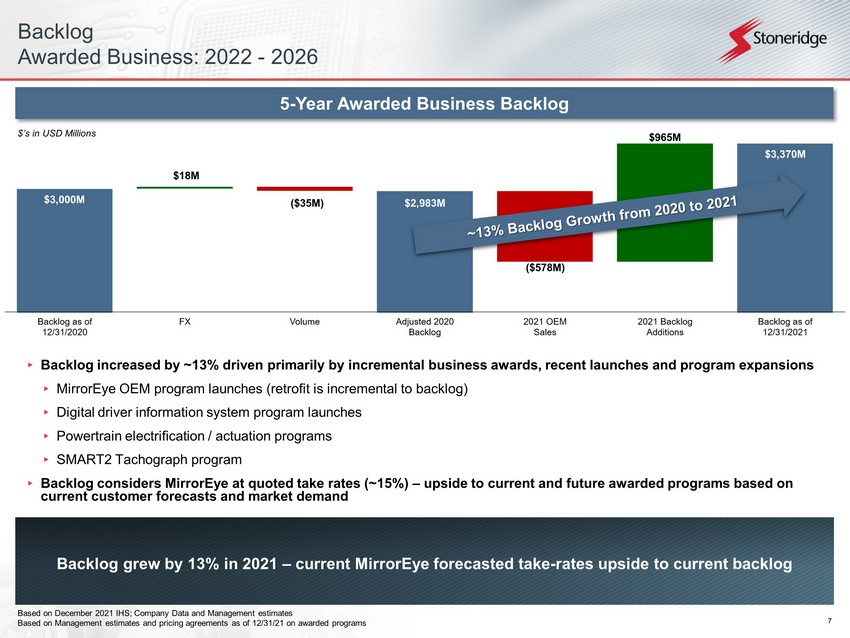
7 ▸ Backlog increased by ~13% driven primarily by incremental business awards, recent launches and program expansions ▸ MirrorEye OEM program launches (retrofit is incremental to backlog) ▸ Digital driver information system program launches ▸ Powertrain electrification / actuation programs ▸ SMART2 Tachograph program ▸ Backlog considers MirrorEye at quoted take rates (~15%) – upside to current and future awarded programs based on current customer forecasts and market demand Backlog grew by 13% in 2021 – current MirrorEye forecasted take - rates upside to current backlog Based on December 2021 IHS; Company Data and Management estimates Based on Management estimates and pricing agreements as of 12/31/21 on awarded programs 5 - Year Awarded Business Backlog Backlog Awarded Business: 2022 - 2026 $’s in USD Millions $3,000 $18M ($35M) $3,000M $2,983M ($578M) $965M $3,370M
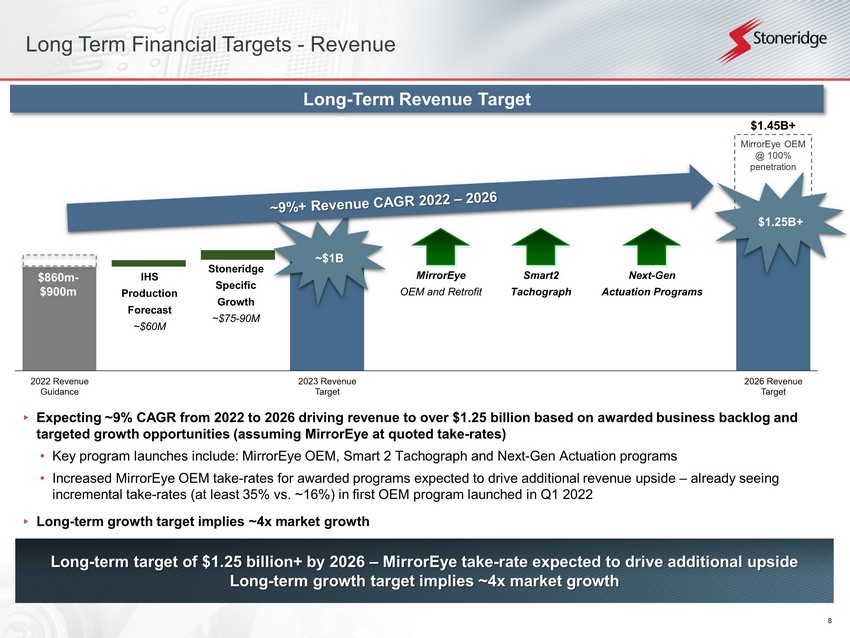
8 Long Term Financial Targets - Revenue ▸ Expecting ~9% CAGR from 2022 to 2026 driving revenue to over $1.25 billion based on awarded business backlog and targeted growth opportunities (assuming MirrorEye at quoted take - rates) • Key program launches include: MirrorEye OEM, Smart 2 Tachograph and Next - Gen Actuation programs • Increased MirrorEye OEM take - rates for awarded programs expected to drive additional revenue upside – already seeing incremental take - rates (at least 35% vs. ~16%) in first OEM program launched in Q1 2022 ▸ Long - term growth target implies ~4x market growth $860m - $900m Long - Term Revenue Target MirrorEye OEM @ 100% penetration $1.25B+ ~$1B Long - term target of $1.25 billion+ by 2026 – MirrorEye take - rate expected to drive additional upside Long - term growth target implies ~4x market growth IHS Production Forecast ~$60M Stoneridge Specific Growth ~$75 - 90M MirrorEye OEM and Retrofit Next - Gen Actuation Programs Smart2 Tachograph $1.45B+
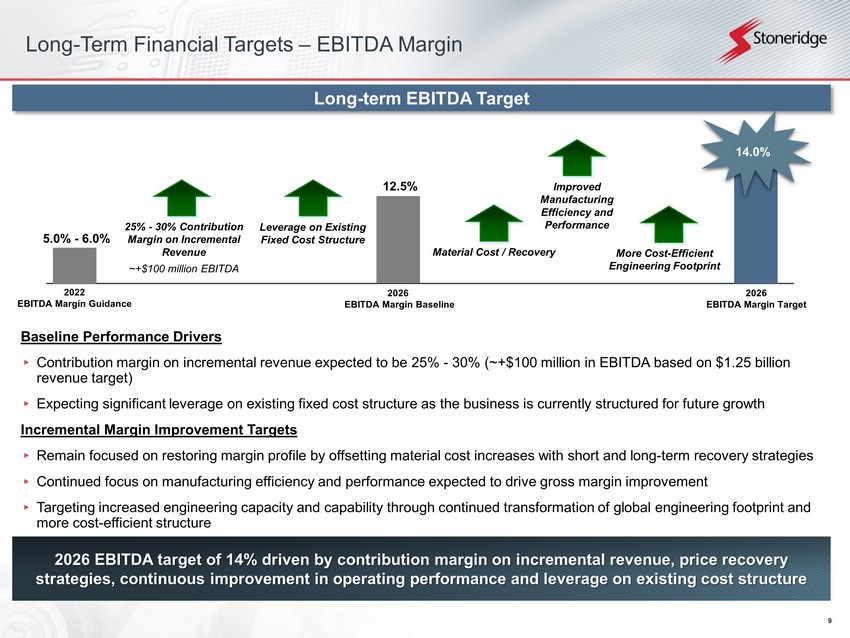
9 2026 EBITDA target of 14% driven by contribution margin on incremental revenue, price recovery strategies, continuous improvement in operating performance and leverage on existing cost structure 2022 EBITDA Margin Guidance Long - term EBITDA Target 2026 EBITDA Margin Target 14.0% Material Cost / Recovery More Cost - Efficient Engineering Footprint Leverage on Existing Fixed Cost Structure Improved Manufacturing Efficiency and Performance 5.0% - 6.0% Long - Term Financial Targets – EBITDA Margin 25% - 30% Contribution Margin on Incremental Revenue ~+$100 million EBITDA 2026 EBITDA Margin Baseline 12.5% Baseline Performance Drivers ▸ Contribution margin on incremental revenue expected to be 25% - 30% (~+$100 million in EBITDA based on $1.25 billion revenue target) ▸ Expecting significant leverage on existing fixed cost structure as the business is currently structured for future growth Incremental Margin Improvement Targets ▸ Remain focused on restoring margin profile by offsetting material cost increases with short and long - term recovery strategies ▸ Continued focus on manufacturing efficiency and performance expected to drive gross margin improvement ▸ Targeting increased engineering capacity and capability through continued transformation of global engineering footprint and more cost - efficient structure

10 Summary 2021 Summary x Supply chain challenges and rapidly increasing material costs created instability in production for our customers and pressure on gross margin throughout 2021 x As the year progressed, we put processes in place to pass through a significant portion of our gross supply chain - related costs x Continued expansion of MirrorEye opportunity as first OEM program launch take - rate forecasted to significantly exceed previous expectations and continue to improve going - forward x MirrorEye retrofit opportunities expanding and incremental bus market awards with Iveco, Marco Polo and Quantron Forward Outlook x Expecting continued incremental material costs due to inflation and supply chain shortages. Working with customers and suppliers to at - least offset the incremental costs and maintain margin profile. x Backlog growth of 13% year - over - year continues to support strong medium and long - term growth targets x Targeting over $1 billion in revenue in 2023 and over $1.25 billion by 2026 x Upside to growth targets based on MirrorEye take - rates – already seeing incremental take - rates (at least 35% vs. ~16%) in first OEM program vehicle launched x Growth supports significant EBITDA margin expansion – targeting 14% EBITDA margin by 2026 x Contribution margin on incremental revenue supports baseline EBITDA margin of 12.5% by 2026 x Incremental margin opportunity related to continued optimization of our future engineering footprint, continuous improvement in our manufacturing facilities and our ability to recover margin relative to material costs Strong 2021 performance and continued transformation positioning the Company for long - term profitable growth

11 Financial Update
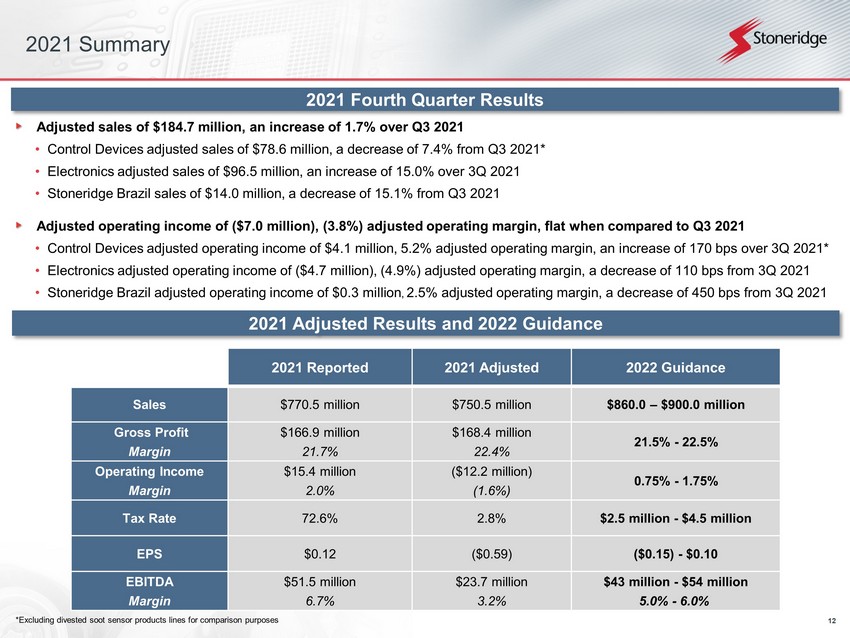
12 2021 Fourth Quarter Results Adjusted sales of $184.7 million, an increase of 1.7% over Q3 2021 • Control Devices adjusted sales of $78.6 million, a decrease of 7.4% from Q3 2021* • Electronics adjusted sales of $96.5 million, an increase of 15.0% over 3Q 2021 • Stoneridge Brazil sales of $14.0 million, a decrease of 15.1% from Q3 2021 Adjusted operating income of ($7.0 million), (3.8%) adjusted operating margin, flat when compared to Q3 2021 • Control Devices adjusted operating income of $4.1 million, 5.2% adjusted operating margin, an increase of 170 bps over 3Q 202 1* • Electronics adjusted operating income of ($4.7 million), (4.9%) adjusted operating margin, a decrease of 110 bps from 3Q 2021 • Stoneridge Brazil adjusted operating income of $0.3 million , 2.5% adjusted operating margin, a decrease of 450 bps from 3Q 2021 2021 Adjusted Results and 2022 Guidance 2021 Summary 2021 Reported 2021 Adjusted 2022 Guidance Sales $ 770.5 million $750.5 million $860.0 – $900.0 million Gross Profit Margin $ 166.9 million 21.7% $ 168.4 million 22.4% 21.5% - 22.5% Operating Income Margin $15.4 million 2.0% ($12.2 million) (1.6%) 0.75% - 1.75% Tax Rate 72.6% 2.8% $2.5 million - $4.5 million EPS $0.12 ($0.59) ($0.15) - $0.10 EBITDA Margin $51.5 million 6.7% $23.7 million 3.2% $43 million - $54 million 5.0% - 6.0% * Excluding divested soot sensor products lines for comparison purposes

13 Q4 2021 Performance Drivers vs. Prior Expectations ▸ Unfavorable impact of volume and mix primarily due to reduction in North American passenger car customer production schedules ▸ Net supply chain costs and customer recoveries favorable vs. prior expectations ▸ Cost control and focus on manufacturing execution resulted in improved manufacturing cost in Q4 ▸ 4Q performance negatively impacted by $0.09 EPS due to timing of customer funded engineering recovery – previously expected in Q4, currently expected in 2023 Q4 performance impacted by reduced customer production and timing of engineering recoveries Offset by favorable net supply chain costs, customer recoveries and manufacturing performance ($0.11) ($0.21) ($0.04) ($0.02) $0.02 $0.04 ($0.09) ($0.01) ($0.25) $0.02 ($0.24)
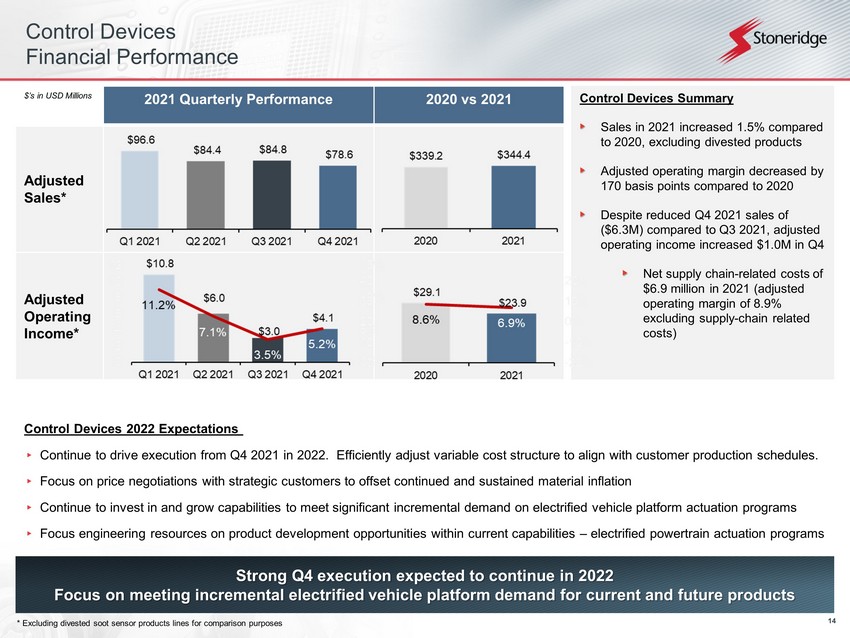
14 Control Devices Financial Performance Strong Q4 execution expected to continue in 2022 Focus on meeting incremental electrified vehicle platform demand for current and future products Control Devices 2022 Expectations ▸ Continue to drive execution from Q4 2021 in 2022. Efficiently adjust variable cost structure to align with customer producti on schedules. ▸ Focus on price negotiations with strategic customers to offset continued and sustained material inflation ▸ Continue to invest in and grow capabilities to meet significant incremental demand on electrified vehicle platform actuation pro grams ▸ Focus engineering resources on product development opportunities within current capabilities – electrified powertrain actuation programs 2021 Quarterly Performance 2020 vs 2021 Adjusted Sales* Adjusted Operating Income* $’s in USD Millions * Excluding divested soot sensor products lines for comparison purposes Control Devices Summary Sales in 2021 increased 1.5% compared to 2020, excluding divested products Adjusted operating margin decreased by 170 basis points compared to 2020 Despite reduced Q4 2021 sales of ($6.3M) compared to Q3 2021, adjusted operating income increased $1.0M in Q4 Net supply chain - related costs of $6.9 million in 2021 (adjusted operating margin of 8.9% excluding supply - chain related costs)
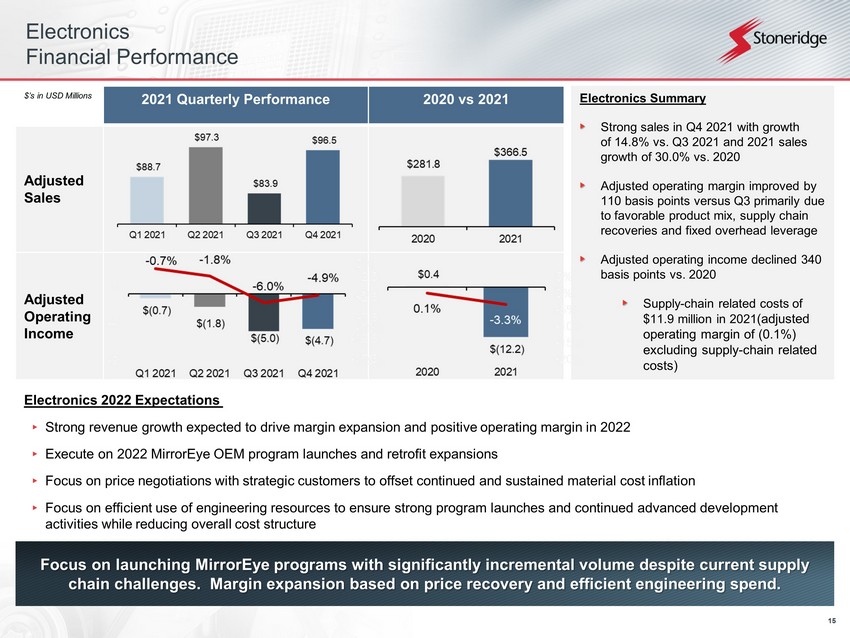
15 Electronics Financial Performance Electronics 2022 Expectations ▸ Strong revenue growth expected to drive margin expansion and positive operating margin in 2022 ▸ Execute on 2022 MirrorEye OEM program launches and retrofit expansions ▸ Focus on price negotiations with strategic customers to offset continued and sustained material cost inflation ▸ Focus on efficient use of engineering resources to ensure strong program launches and continued advanced development activities while reducing overall cost structure 2021 Quarterly Performance 2020 vs 2021 Adjusted Sales Adjusted Operating Income $’s in USD Millions Electronics Summary Strong sales in Q4 2021 with growth of 14.8% vs. Q3 2021 and 2021 sales growth of 30.0% vs. 2020 Adjusted operating margin improved by 110 basis points versus Q3 primarily due to favorable product mix, supply chain recoveries and fixed overhead leverage Adjusted operating income declined 340 basis points vs. 2020 Supply - chain related costs of $11.9 million in 2021 (adjusted operating margin of (0.1%) excluding supply - chain related costs) Focus on launching MirrorEye programs with significantly incremental volume despite current supply chain challenges. Margin expansion based on price recovery and efficient engineering spend.
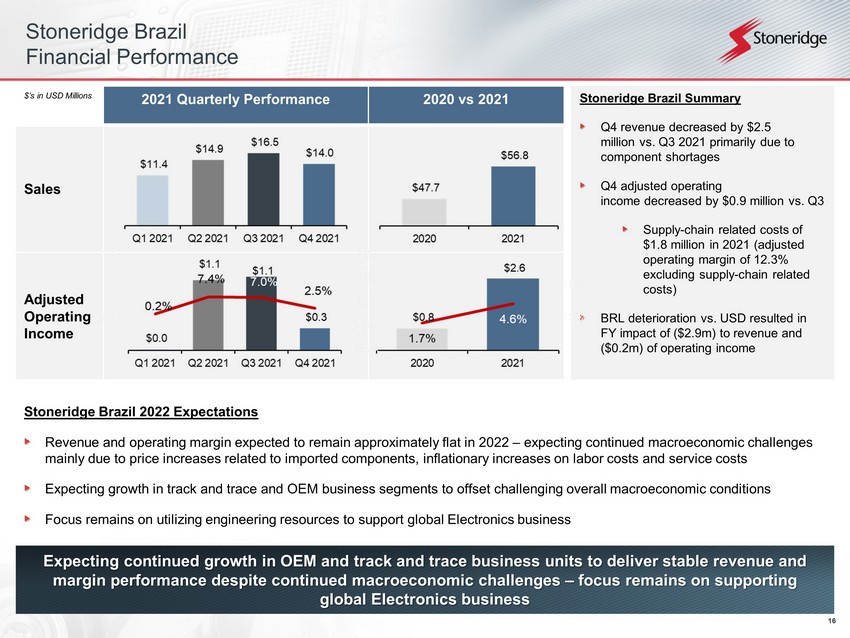
16 Stoneridge Brazil Financial Performance Expecting continued growth in OEM and track and trace business units to deliver stable revenue and margin performance despite continued macroeconomic challenges – focus remains on supporting global Electronics business Stoneridge Brazil 2022 Expectations Revenue and operating margin expected to remain approximately flat in 2022 – expecting continued macroeconomic challenges mainly due to price increases related to imported components, inflationary increases on labor costs and service costs Expecting growth in track and trace and OEM business segments to offset challenging overall macroeconomic conditions Focus remains on utilizing engineering resources to support global Electronics business 2021 Quarterly Performance 2020 vs 2021 Sales Adjusted Operating Income $’s in USD Millions Stoneridge Brazil Summary Q4 revenue decreased by $2.5 million vs. Q3 2021 primarily due to component shortages Q4 adjusted operating income decreased by $0.9 million vs. Q3 Supply - chain related costs of $1.8 million in 2021 (adjusted operating margin of 12.3% excluding supply - chain related costs) BRL deterioration vs. USD resulted in FY impact of ($2.9m) to revenue and ($0.2m) of operating income
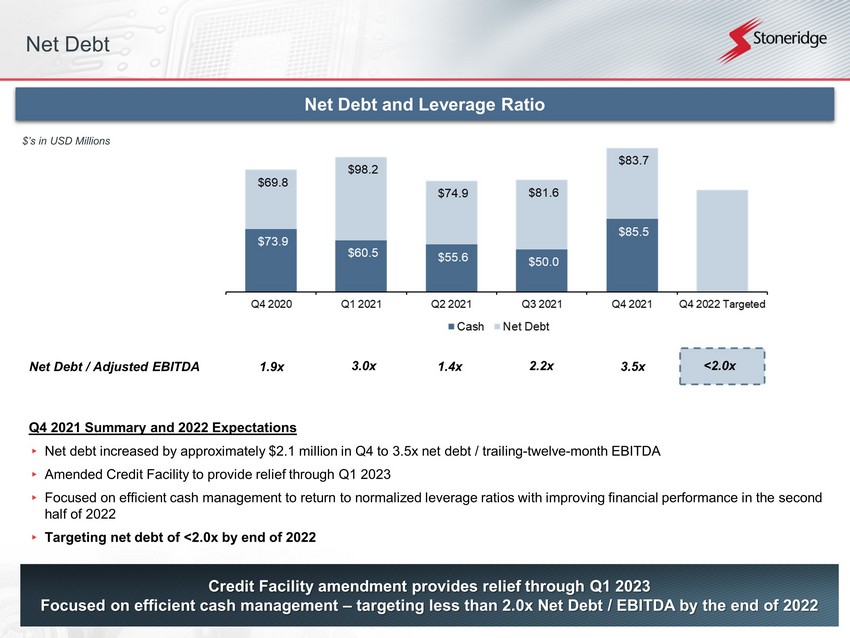
17 Credit Facility amendment provides relief through Q1 2023 Focused on efficient cash management – targeting less than 2.0x Net Debt / EBITDA by the end of 2022 Q4 2021 Summary and 2022 Expectations ▸ Net debt increased by approximately $2.1 million in Q4 to 3.5x net debt / trailing - twelve - month EBITDA ▸ Amended Credit Facility to provide relief through Q1 2023 ▸ Focused on efficient cash management to return to normalized leverage ratios with improving financial performance in the seco nd half of 2022 ▸ Targeting net debt of <2.0x by end of 2022 3.5x 2.2x 1.4x 3.0x Net Debt / Adjusted EBITDA 1.9x Net Debt and Leverage Ratio $’s in USD Millions Net Debt <2.0x
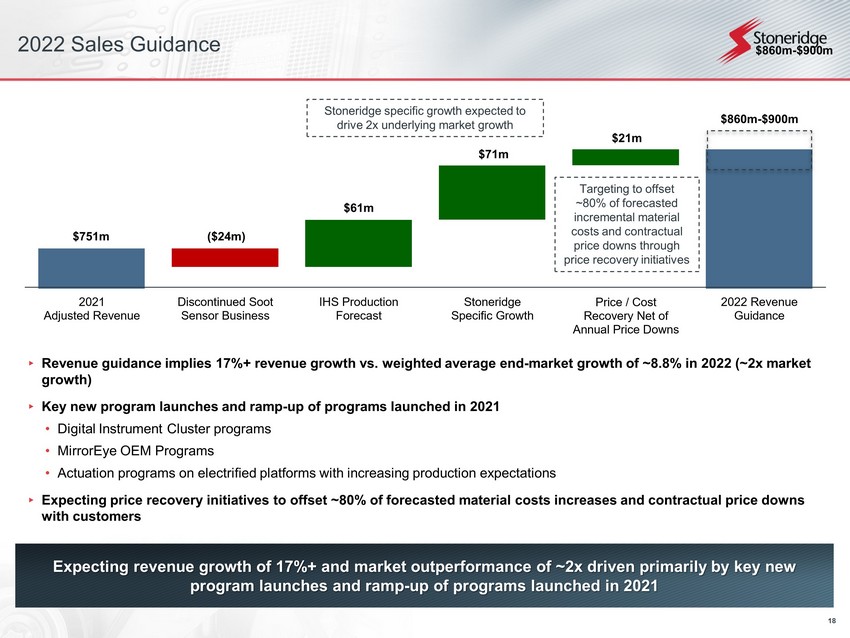
18 2022 Sales Guidance ▸ Revenue guidance implies 17%+ revenue growth vs. weighted average end - market growth of ~8.8% in 2022 (~2x market growth) ▸ Key new program launches and ramp - up of programs launched in 2021 • Digital Instrument Cluster programs • MirrorEye OEM Programs • Actuation programs on electrified platforms with increasing production expectations ▸ Expecting price recovery initiatives to offset ~80% of forecasted material costs increases and contractual price downs with customers $751m ($24m) $61m $860m - $900m $860m - $900m Expecting revenue growth of 17%+ and market outperformance of ~2x driven primarily by key new program launches and ramp - up of programs launched in 2021 $71m $21m Targeting to offset ~80% of forecasted incremental material costs and contractual price downs through price recovery initiatives Stoneridge specific growth expected to drive 2x underlying market growth
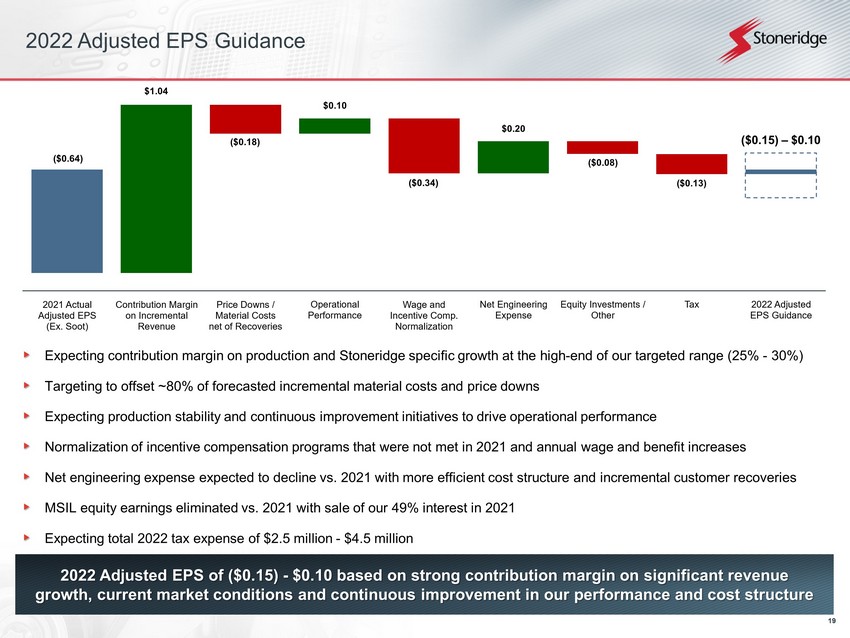
19 2022 Adjusted EPS Guidance 2022 Adjusted EPS of ($0.15) - $0.10 based on strong contribution margin on significant revenue growth, current market conditions and continuous improvement in our performance and cost structure Expecting contribution margin on production and Stoneridge specific growth at the high - end of our targeted range (25% - 30%) Targeting to offset ~80% of forecasted incremental material costs and price downs Expecting production stability and continuous improvement initiatives to drive operational performance Normalization of incentive compensation programs that were not met in 2021 and annual wage and benefit increases Net engineering expense expected to decline vs. 2021 with more efficient cost structure and incremental customer recoveries MSIL equity earnings eliminated vs. 2021 with sale of our 49% interest in 2021 Expecting total 2022 tax expense of $2.5 million - $4.5 million $1.04 ($0.18) $0.10 ($0.34) $0.20 ($0.08) ($0.13) ($0.64) ($0.15) – $0.10
20 2021 Summary ▸ Control Devices – Strong sales in the first half of the year declined into the second half of the year as supply chain volatility and material availability impacted customer production. Material cost challenges led to reduced margin with improvement in Q4. ▸ Electronics – Despite strong demand, sales volatility tied - to material availability throughout 2021. Significant supply chain - related costs particularly in the second half. ▸ Stoneridge Brazil – Continued macroeconomic volatility resulted in volatility in quarterly financial performance. Focus remains on supporting global engineering initiatives and growth in OEM and track and trace businesses. 2022 Outlook and Guidance ▸ Midpoint revenue guidance of $880.0 million • Midpoint revenue suggests ~2x market growth ▸ Midpoint adjusted gross margin guidance of ~22.0% ▸ Midpoint adjusted operating margin guidance of ~1.25% ▸ Midpoint adjusted EPS guidance of $(0.03) per share ▸ Midpoint adjusted EBITDA guidance of $48.5 million in 2022 • Adjusted midpoint EBITDA margin of 5.5% Driving shareholder value through strong financial performance and a well - defined long - term strategy Summary

21 Appendix
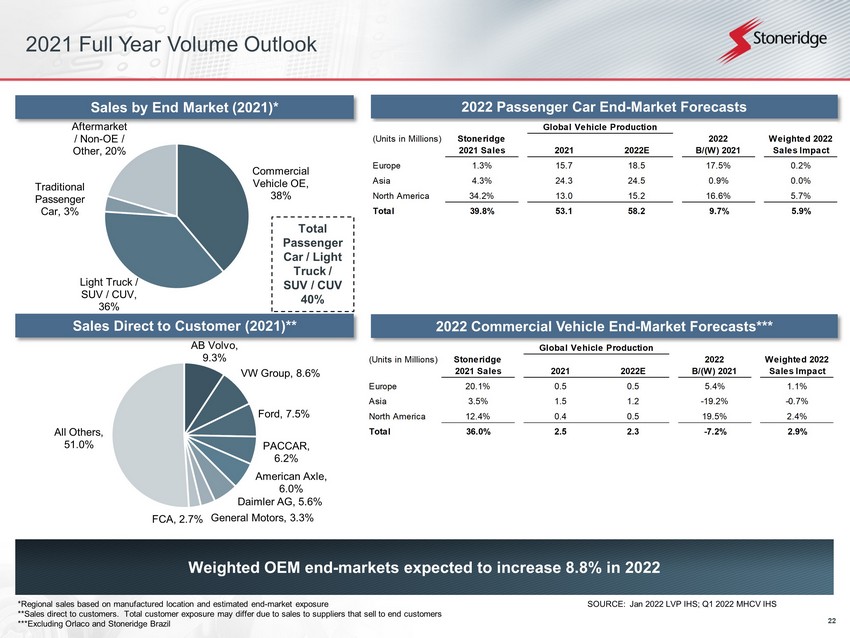
22 Weighted OEM end - markets expected to increase 8.8% in 2022 *Regional sales based on manufactured location and estimated end - market exposure **Sales direct to customers. Total customer exposure may differ due to sales to suppliers that sell to end customers ***Excluding Orlaco and Stoneridge Brazil Sales by End Market ( 2021 )* 2022 Passenger Car End - Market Forecasts SOURCE: Jan 2022 LVP IHS; Q1 2022 MHCV IHS 2022 Commercial Vehicle End - Market Forecasts*** Total Passenger Car / Light Truck / SUV / CUV 40% Sales Direct to Customer ( 2021 )** 2021 Full Year Volume Outlook (Units in Millions) Stoneridge 2021 Sales 2021 2022E 2022 B/(W) 2021 Weighted 2022 Sales Impact Europe 1.3% 15.7 18.5 17.5% 0.2% Asia 4.3% 24.3 24.5 0.9% 0.0% North America 34.2% 13.0 15.2 16.6% 5.7% Total 39.8% 53.1 58.2 9.7% 5.9% Global Vehicle Production (Units in Millions) Stoneridge 2021 Sales 2021 2022E 2022 B/(W) 2021 Weighted 2022 Sales Impact Europe 20.1% 0.5 0.5 5.4% 1.1% Asia 3.5% 1.5 1.2 -19.2% -0.7% North America 12.4% 0.4 0.5 19.5% 2.4% Total 36.0% 2.5 2.3 -7.2% 2.9% Global Vehicle Production Commercial Vehicle OE , 38% Light Truck / SUV / CUV , 36% Traditional Passenger Car , 3% Aftermarket / Non - OE / Other , 20% AB Volvo , 9.3% VW Group , 8.6% Ford , 7.5% PACCAR , 6.2% American Axle , 6.0% Daimler AG , 5.6% General Motors , 3.3% FCA , 2.7% All Others , 51.0%

23 Primary Stoneridge Foreign Currency Sensitivities SRI Currency Exposures 2022 Assumption Rates If 5% Weaker vs. USD N et Annual EBITDA * Transaction Impact Translation Impact Euro 1.18 Mexican Peso 19.93 N/A Chinese Yuan 6.46 Swedish Krona 8.63 Brazilia n Real 5.32 *Before impact of hedging programs, approximate USD in millions $0.0 $2.2 $1.7 $0.7 $0.9 $0.4 $0.0 $0.1 $0.9
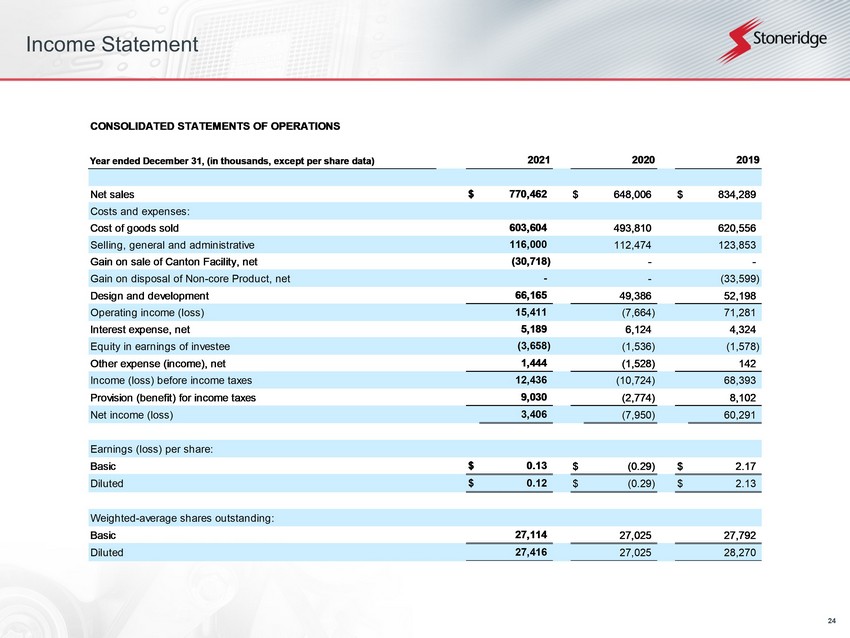
24 Income Statement CONSOLIDATED STATEMENTS OF OPERATIONS Year ended December 31, (in thousands, except per share data) Net sales $ 770,462 $ 648,006 $ 834,289 Costs and expenses: Cost of goods sold 603,604 493,810 620,556 Selling, general and administrative 116,000 112,474 123,853 Gain on sale of Canton Facility, net (30,718) - - Gain on disposal of Non-core Product, net - - (33,599) Design and development 66,165 49,386 52,198 Operating income (loss) 15,411 (7,664) 71,281 Interest expense, net 5,189 6,124 4,324 Equity in earnings of investee (3,658) (1,536) (1,578) Other expense (income), net 1,444 (1,528) 142 Income (loss) before income taxes 12,436 (10,724) 68,393 Provision (benefit) for income taxes 9,030 (2,774) 8,102 Net income (loss) 3,406 (7,950) 60,291 Earnings (loss) per share: Basic $ 0.13 $ (0.29) $ 2.17 Diluted $ 0.12 $ (0.29) $ 2.13 Weighted-average shares outstanding: Basic 27,114 27,025 27,792 Diluted 27,416 27,025 28,270 2021 2020 2019

25 Segment Financial Information SEGMENT REPORTING December 31, Net Sales: Control Devices $ 355,775 $ 342,576 $ 431,560 Inter-segment sales 3,502 5,475 6,438 Control Devices net sales 359,276 348,051 437,998 Electronics 357,910 257,767 335,195 Inter-segment sales 26,192 24,027 33,735 Electronics net sales 384,103 281,794 368,930 Stoneridge Brazil 56,777 47,663 67,534 Inter-segment sales - - 6 Stoneridge Brazil net sales 56,777 47,663 67,540 Eliminations (29,694) (29,502) (40,179) Total net sales $ 770,462 $ 648,006 $ 834,289 Operating Income (Loss): Control Devices $ 54,933 $ 22,072 $ 73,327 Electronics (12,502) (3,672) 25,006 Stoneridge Brazil 995 3,766 6,539 Unallocated Corporate (A) (28,015) (29,830) (33,591) Total operating income (loss) $ 15,411 $ (7,664) $ 71,281 Depreciation and Amortization: Control Devices $ 15,351 $ 15,377 $ 13,397 Electronics 12,487 10,501 9,872 Stoneridge Brazil 3,856 4,766 6,338 Unallocated Corporate 2,134 2,086 1,252 Total depreciation and amortization (B) $ 33,828 $ 32,730 $ 30,859 Interest Expense (Income), net: Control Devices $ 132 $ 173 $ 172 Electronics 462 320 162 Stoneridge Brazil (1,353) (4) 167 Unallocated Corporate 5,948 5,635 3,823 Total interest expense, net $ 5,189 $ 6,124 $ 4,324 Capital Expenditures: Control Devices $ 9,154 $ 11,760 $ 12,646 Electronics 9,735 11,617 15,476 Stoneridge Brazil 2,918 2,839 5,003 Unallocated Corporate (C) 1,142 1,444 2,699 Total capital expenditures $ 22,949 $ 27,660 $ 35,824 (A) Unallocated Corporate expenses include, among other items, accounting/finance, human resources, information technology and legal costs as well as share-based compensation. (B) These amounts represent depreciation and amortization on property, plant and equipment and certain intangible assets. (C) Assets located at Corporate consist primarily of cash, intercompany receivables, fixed and leased assets for the headquarter building, information technology assets, equity investments and investments in subsidiaries. 2021 2020 2019
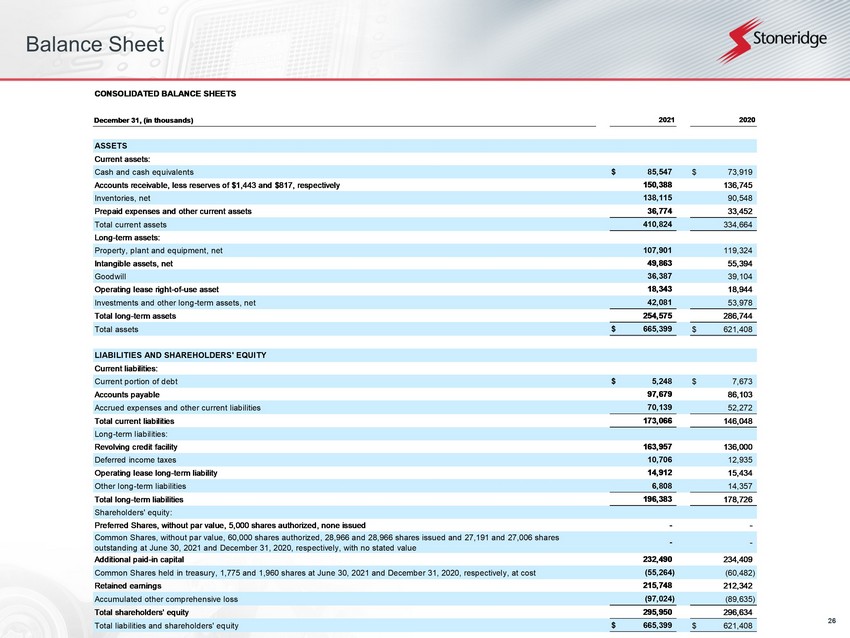
26 Balance Sheet CONSOLIDATED BALANCE SHEETS December 31, (in thousands) ASSETS Current assets: Cash and cash equivalents $ 85,547 $ 73,919 Accounts receivable, less reserves of $1,443 and $817, respectively 150,388 136,745 Inventories, net 138,115 90,548 Prepaid expenses and other current assets 36,774 33,452 Total current assets 410,824 334,664 Long-term assets: Property, plant and equipment, net 107,901 119,324 Intangible assets, net 49,863 55,394 Goodwill 36,387 39,104 Operating lease right-of-use asset 18,343 18,944 Investments and other long-term assets, net 42,081 53,978 Total long-term assets 254,575 286,744 Total assets $ 665,399 $ 621,408 LIABILITIES AND SHAREHOLDERS' EQUITY Current liabilities: Current portion of debt $ 5,248 $ 7,673 Accounts payable 97,679 86,103 Accrued expenses and other current liabilities 70,139 52,272 Total current liabilities 173,066 146,048 Long-term liabilities: Revolving credit facility 163,957 136,000 Deferred income taxes 10,706 12,935 Operating lease long-term liability 14,912 15,434 Other long-term liabilities 6,808 14,357 Total long-term liabilities 196,383 178,726 Shareholders' equity: Preferred Shares, without par value, 5,000 shares authorized, none issued - - Common Shares, without par value, 60,000 shares authorized, 28,966 and 28,966 shares issued and 27,191 and 27,006 shares outstanding at June 30, 2021 and December 31, 2020, respectively, with no stated value - - Additional paid-in capital 232,490 234,409 Common Shares held in treasury, 1,775 and 1,960 shares at June 30, 2021 and December 31, 2020, respectively, at cost (55,264) (60,482) Retained earnings 215,748 212,342 Accumulated other comprehensive loss (97,024) (89,635) Total shareholders' equity 295,950 296,634 Total liabilities and shareholders' equity $ 665,399 $ 621,408 2021 2020
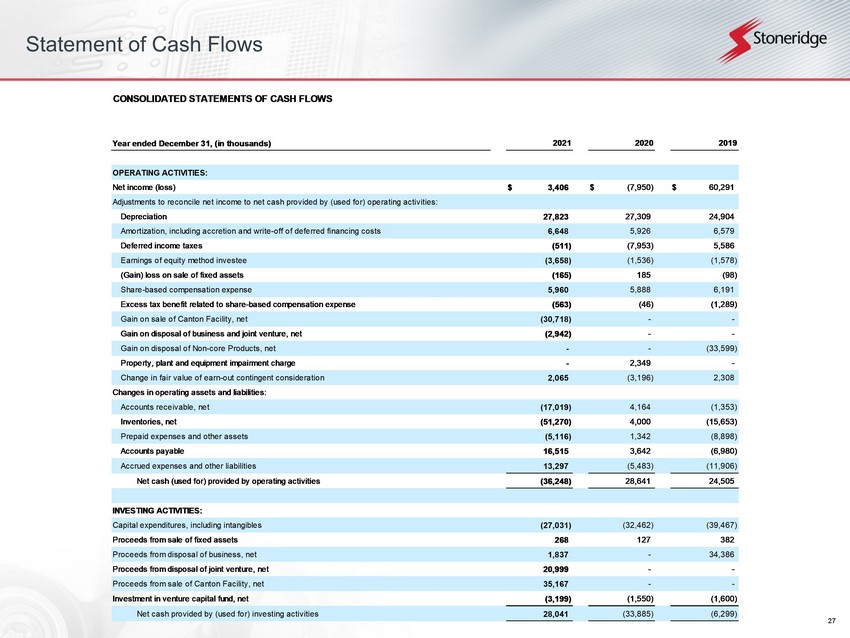
27 Statement of Cash Flows CONSOLIDATED STATEMENTS OF CASH FLOWS Year ended December 31, (in thousands) OPERATING ACTIVITIES: Net income (loss) $ 3,406 $ (7,950) $ 60,291 Adjustments to reconcile net income to net cash provided by (used for) operating activities: Depreciation 27,823 27,309 24,904 Amortization, including accretion and write-off of deferred financing costs 6,648 5,926 6,579 Deferred income taxes (511) (7,953) 5,586 Earnings of equity method investee (3,658) (1,536) (1,578) (Gain) loss on sale of fixed assets (165) 185 (98) Share-based compensation expense 5,960 5,888 6,191 Excess tax benefit related to share-based compensation expense (563) (46) (1,289) Gain on sale of Canton Facility, net (30,718) - - Gain on disposal of business and joint venture, net (2,942) - - Gain on disposal of Non-core Products, net - - (33,599) Property, plant and equipment impairment charge - 2,349 - Change in fair value of earn-out contingent consideration 2,065 (3,196) 2,308 Changes in operating assets and liabilities: Accounts receivable, net (17,019) 4,164 (1,353) Inventories, net (51,270) 4,000 (15,653) Prepaid expenses and other assets (5,116) 1,342 (8,898) Accounts payable 16,515 3,642 (6,980) Accrued expenses and other liabilities 13,297 (5,483) (11,906) Net cash (used for) provided by operating activities (36,248) 28,641 24,505 INVESTING ACTIVITIES: Capital expenditures, including intangibles (27,031) (32,462) (39,467) Proceeds from sale of fixed assets 268 127 382 Proceeds from disposal of business, net 1,837 - 34,386 Proceeds from disposal of joint venture, net 20,999 - - Proceeds from sale of Canton Facility, net 35,167 - - Investment in venture capital fund, net (3,199) (1,550) (1,600) Net cash provided by (used for) investing activities 28,041 (33,885) (6,299) 2021 2020 2019
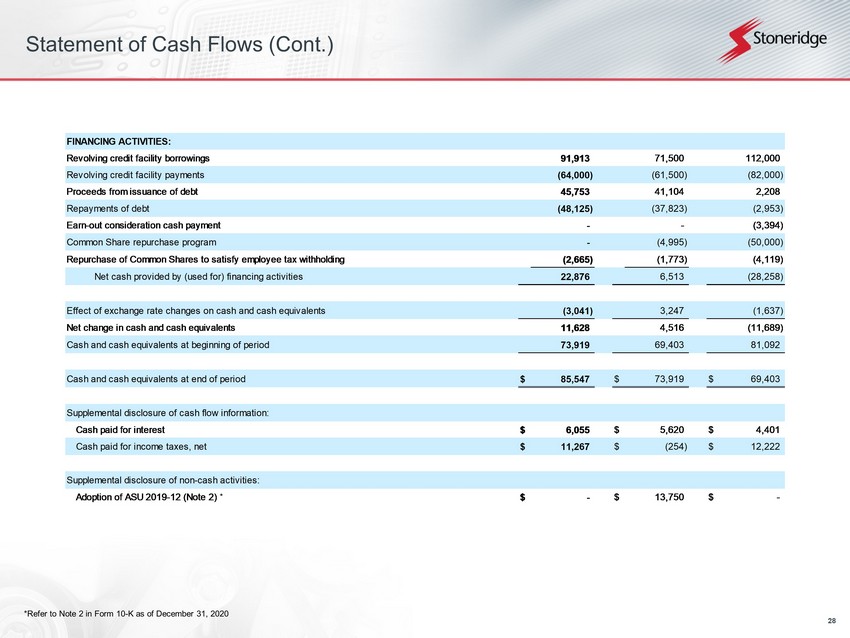
28 *Refer to Note 2 in Form 10 - K as of December 31, 2020 Statement of Cash Flows (Cont.) FINANCING ACTIVITIES: Revolving credit facility borrowings 91,913 71,500 112,000 Revolving credit facility payments (64,000) (61,500) (82,000) Proceeds from issuance of debt 45,753 41,104 2,208 Repayments of debt (48,125) (37,823) (2,953) Earn-out consideration cash payment - - (3,394) Common Share repurchase program - (4,995) (50,000) Repurchase of Common Shares to satisfy employee tax withholding (2,665) (1,773) (4,119) Net cash provided by (used for) financing activities 22,876 6,513 (28,258) Effect of exchange rate changes on cash and cash equivalents (3,041) 3,247 (1,637) Net change in cash and cash equivalents 11,628 4,516 (11,689) Cash and cash equivalents at beginning of period 73,919 69,403 81,092 Cash and cash equivalents at end of period $ 85,547 $ 73,919 $ 69,403 Supplemental disclosure of cash flow information: Cash paid for interest $ 6,055 $ 5,620 $ 4,401 Cash paid for income taxes, net $ 11,267 $ (254) $ 12,222 Supplemental disclosure of non-cash activities: Adoption of ASU 2019-12 (Note 2) $ - $ 13,750 $ - *

29 Reconciliations to US GAAP

30 This document contains information about Stoneridge's financial results which is not presented in accordance with accounting principles generally accepted in the United States ("GAAP"). Such non - GAAP financial measures are reconciled to their closest GAAP financial measures in the appendix of this document. The provision of these non - GAAP financial measures is not intended to indicate that Stoneridge is explicitly or implicitly providing projections on those non - GAAP financial measures, and actual results for such measures are likely to vary from those presented. The reconciliations include all information reasonably available to the Company at the date of this document and the adjustments that management can reasonably predict. Reconciliations to US GAAP
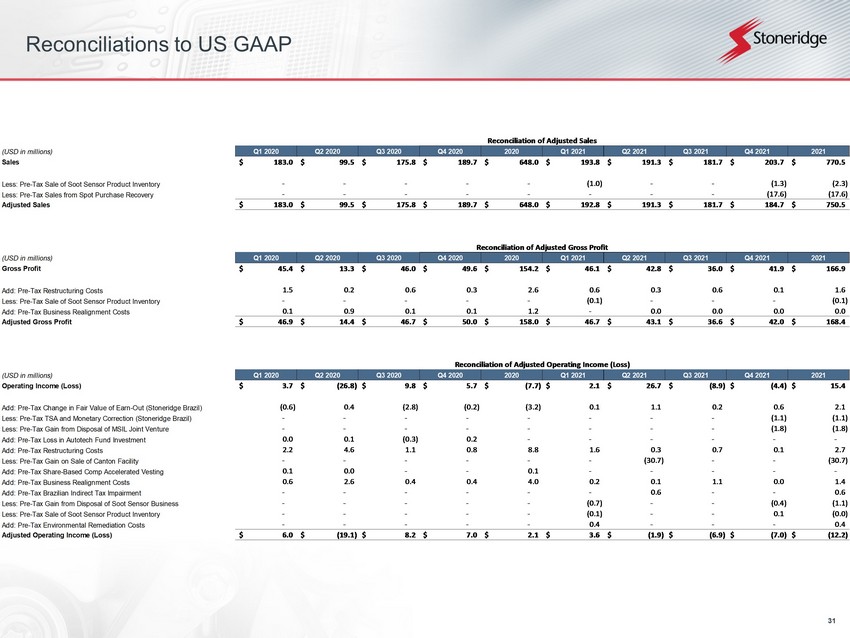
31 Reconciliations to US GAAP Reconciliation of Adjusted Sales (USD in millions) Q1 2020 Q2 2020 Q3 2020 Q4 2020 2020 Q1 2021 Q2 2021 Q3 2021 Q4 2021 2021 Sales 183.0$ 99.5$ 175.8$ 189.7$ 648.0$ 193.8$ 191.3$ 181.7$ 203.7$ 770.5$ Less: Pre-Tax Sale of Soot Sensor Product Inventory - - - - - (1.0) - - (1.3) (2.3) Less: Pre-Tax Sales from Spot Purchase Recovery - - - - - - - - (17.6) (17.6) Adjusted Sales 183.0$ 99.5$ 175.8$ 189.7$ 648.0$ 192.8$ 191.3$ 181.7$ 184.7$ 750.5$ Reconciliation of Adjusted Gross Profit (USD in millions) Q1 2020 Q2 2020 Q3 2020 Q4 2020 2020 Q1 2021 Q2 2021 Q3 2021 Q4 2021 2021 Gross Profit 45.4$ 13.3$ 46.0$ 49.6$ 154.2$ 46.1$ 42.8$ 36.0$ 41.9$ 166.9$ Add: Pre-Tax Restructuring Costs 1.5 0.2 0.6 0.3 2.6 0.6 0.3 0.6 0.1 1.6 Less: Pre-Tax Sale of Soot Sensor Product Inventory - - - - - (0.1) - - - (0.1) Add: Pre-Tax Business Realignment Costs 0.1 0.9 0.1 0.1 1.2 - 0.0 0.0 0.0 0.0 Adjusted Gross Profit 46.9$ 14.4$ 46.7$ 50.0$ 158.0$ 46.7$ 43.1$ 36.6$ 42.0$ 168.4$ Reconciliation of Adjusted Operating Income (Loss) (USD in millions) Q1 2020 Q2 2020 Q3 2020 Q4 2020 2020 Q1 2021 Q2 2021 Q3 2021 Q4 2021 2021 Operating Income (Loss) 3.7$ (26.8)$ 9.8$ 5.7$ (7.7)$ 2.1$ 26.7$ (8.9)$ (4.4)$ 15.4$ Add: Pre-Tax Change in Fair Value of Earn-Out (Stoneridge Brazil) (0.6) 0.4 (2.8) (0.2) (3.2) 0.1 1.1 0.2 0.6 2.1 Less: Pre-Tax TSA and Monetary Correction (Stoneridge Brazil) - - - - - - - - (1.1) (1.1) Less: Pre-Tax Gain from Disposal of MSIL Joint Venture - - - - - - - - (1.8) (1.8) Add: Pre-Tax Loss in Autotech Fund Investment 0.0 0.1 (0.3) 0.2 - - - - - - Add: Pre-Tax Restructuring Costs 2.2 4.6 1.1 0.8 8.8 1.6 0.3 0.7 0.1 2.7 Less: Pre-Tax Gain on Sale of Canton Facility - - - - - - (30.7) - - (30.7) Add: Pre-Tax Share-Based Comp Accelerated Vesting 0.1 0.0 - - 0.1 - - - - - Add: Pre-Tax Business Realignment Costs 0.6 2.6 0.4 0.4 4.0 0.2 0.1 1.1 0.0 1.4 Add: Pre-Tax Brazilian Indirect Tax Impairment - - - - - - 0.6 - - 0.6 Less: Pre-Tax Gain from Disposal of Soot Sensor Business - - - - - (0.7) - - (0.4) (1.1) Less: Pre-Tax Sale of Soot Sensor Product Inventory - - - - - (0.1) - - 0.1 (0.0) Add: Pre-Tax Environmental Remediation Costs - - - - - 0.4 - - - 0.4 Adjusted Operating Income (Loss) 6.0$ (19.1)$ 8.2$ 7.0$ 2.1$ 3.6$ (1.9)$ (6.9)$ (7.0)$ (12.2)$
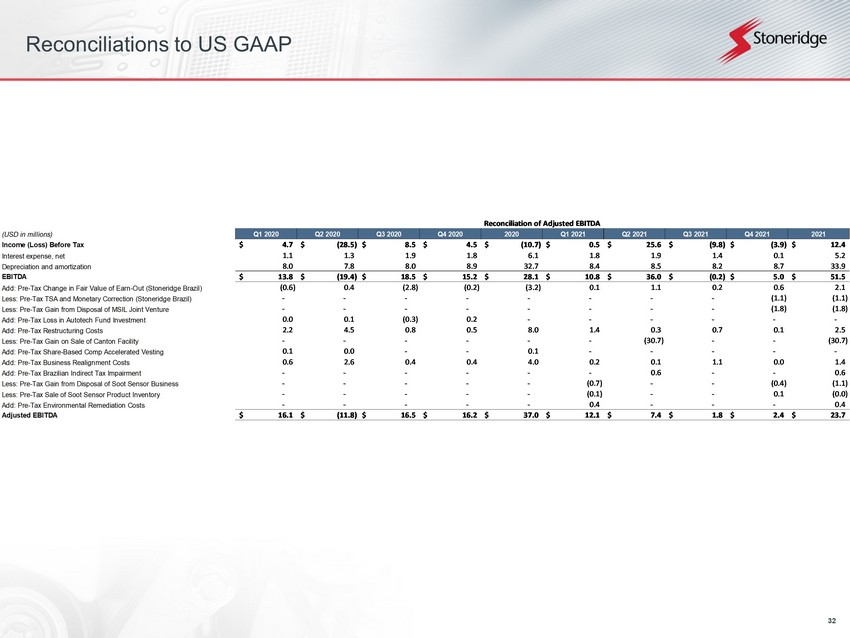
32 Reconciliations to US GAAP Reconciliation of Adjusted EBITDA (USD in millions) Q1 2020 Q2 2020 Q3 2020 Q4 2020 2020 Q1 2021 Q2 2021 Q3 2021 Q4 2021 2021 Income (Loss) Before Tax 4.7$ (28.5)$ 8.5$ 4.5$ (10.7)$ 0.5$ 25.6$ (9.8)$ (3.9)$ 12.4$ Interest expense, net 1.1 1.3 1.9 1.8 6.1 1.8 1.9 1.4 0.1 5.2 Depreciation and amortization 8.0 7.8 8.0 8.9 32.7 8.4 8.5 8.2 8.7 33.9 EBITDA 13.8$ (19.4)$ 18.5$ 15.2$ 28.1$ 10.8$ 36.0$ (0.2)$ 5.0$ 51.5$ Add: Pre-Tax Change in Fair Value of Earn-Out (Stoneridge Brazil) (0.6) 0.4 (2.8) (0.2) (3.2) 0.1 1.1 0.2 0.6 2.1 Less: Pre-Tax TSA and Monetary Correction (Stoneridge Brazil) - - - - - - - - (1.1) (1.1) Less: Pre-Tax Gain from Disposal of MSIL Joint Venture - - - - - - - - (1.8) (1.8) Add: Pre-Tax Loss in Autotech Fund Investment 0.0 0.1 (0.3) 0.2 - - - - - - Add: Pre-Tax Restructuring Costs 2.2 4.5 0.8 0.5 8.0 1.4 0.3 0.7 0.1 2.5 Less: Pre-Tax Gain on Sale of Canton Facility - - - - - - (30.7) - - (30.7) Add: Pre-Tax Share-Based Comp Accelerated Vesting 0.1 0.0 - - 0.1 - - - - - Add: Pre-Tax Business Realignment Costs 0.6 2.6 0.4 0.4 4.0 0.2 0.1 1.1 0.0 1.4 Add: Pre-Tax Brazilian Indirect Tax Impairment - - - - - - 0.6 - - 0.6 Less: Pre-Tax Gain from Disposal of Soot Sensor Business - - - - - (0.7) - - (0.4) (1.1) Less: Pre-Tax Sale of Soot Sensor Product Inventory - - - - - (0.1) - - 0.1 (0.0) Add: Pre-Tax Environmental Remediation Costs - - - - - 0.4 - - - 0.4 Adjusted EBITDA 16.1$ (11.8)$ 16.5$ 16.2$ 37.0$ 12.1$ 7.4$ 1.8$ 2.4$ 23.7$
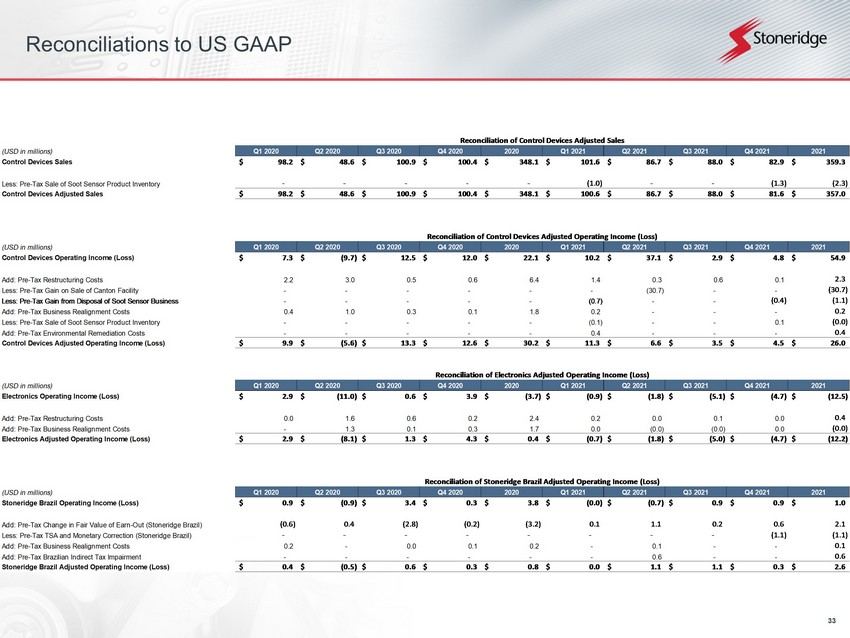
33 Reconciliations to US GAAP Reconciliation of Control Devices Adjusted Sales (USD in millions) Q1 2020 Q2 2020 Q3 2020 Q4 2020 2020 Q1 2021 Q2 2021 Q3 2021 Q4 2021 2021 Control Devices Sales 98.2$ 48.6$ 100.9$ 100.4$ 348.1$ 101.6$ 86.7$ 88.0$ 82.9$ 359.3$ Less: Pre-Tax Sale of Soot Sensor Product Inventory - - - - - (1.0) - - (1.3) (2.3) Control Devices Adjusted Sales 98.2$ 48.6$ 100.9$ 100.4$ 348.1$ 100.6$ 86.7$ 88.0$ 81.6$ 357.0$ Reconciliation of Control Devices Adjusted Operating Income (Loss) (USD in millions) Q1 2020 Q2 2020 Q3 2020 Q4 2020 2020 Q1 2021 Q2 2021 Q3 2021 Q4 2021 2021 Control Devices Operating Income (Loss) 7.3$ (9.7)$ 12.5$ 12.0$ 22.1$ 10.2$ 37.1$ 2.9$ 4.8$ 54.9$ Add: Pre-Tax Restructuring Costs 2.2 3.0 0.5 0.6 6.4 1.4 0.3 0.6 0.1 2.3 Less: Pre-Tax Gain on Sale of Canton Facility - - - - - - (30.7) - - (30.7) Less: Pre-Tax Gain from Disposal of Soot Sensor Business - - - - - (0.7) - - (0.4) (1.1) Add: Pre-Tax Business Realignment Costs 0.4 1.0 0.3 0.1 1.8 0.2 - - - 0.2 Less: Pre-Tax Sale of Soot Sensor Product Inventory - - - - - (0.1) - - 0.1 (0.0) Add: Pre-Tax Environmental Remediation Costs - - - - - 0.4 - - - 0.4 Control Devices Adjusted Operating Income (Loss) 9.9$ (5.6)$ 13.3$ 12.6$ 30.2$ 11.3$ 6.6$ 3.5$ 4.5$ 26.0$ Reconciliation of Electronics Adjusted Operating Income (Loss) (USD in millions) Q1 2020 Q2 2020 Q3 2020 Q4 2020 2020 Q1 2021 Q2 2021 Q3 2021 Q4 2021 2021 Electronics Operating Income (Loss) 2.9$ (11.0)$ 0.6$ 3.9$ (3.7)$ (0.9)$ (1.8)$ (5.1)$ (4.7)$ (12.5)$ Add: Pre-Tax Restructuring Costs 0.0 1.6 0.6 0.2 2.4 0.2 0.0 0.1 0.0 0.4 Add: Pre-Tax Business Realignment Costs - 1.3 0.1 0.3 1.7 0.0 (0.0) (0.0) 0.0 (0.0) Electronics Adjusted Operating Income (Loss) 2.9$ (8.1)$ 1.3$ 4.3$ 0.4$ (0.7)$ (1.8)$ (5.0)$ (4.7)$ (12.2)$ Reconciliation of Stoneridge Brazil Adjusted Operating Income (Loss) (USD in millions) Q1 2020 Q2 2020 Q3 2020 Q4 2020 2020 Q1 2021 Q2 2021 Q3 2021 Q4 2021 2021 Stoneridge Brazil Operating Income (Loss) 0.9$ (0.9)$ 3.4$ 0.3$ 3.8$ (0.0)$ (0.7)$ 0.9$ 0.9$ 1.0$ Add: Pre-Tax Change in Fair Value of Earn-Out (Stoneridge Brazil) (0.6) 0.4 (2.8) (0.2) (3.2) 0.1 1.1 0.2 0.6 2.1 Less: Pre-Tax TSA and Monetary Correction (Stoneridge Brazil) - - - - - - - - (1.1) (1.1) Add: Pre-Tax Business Realignment Costs 0.2 - 0.0 0.1 0.2 - 0.1 - - 0.1 Add: Pre-Tax Brazilian Indirect Tax Impairment - - - - - - 0.6 - - 0.6 Stoneridge Brazil Adjusted Operating Income (Loss) 0.4$ (0.5)$ 0.6$ 0.3$ 0.8$ 0.0$ 1.1$ 1.1$ 0.3$ 2.6$
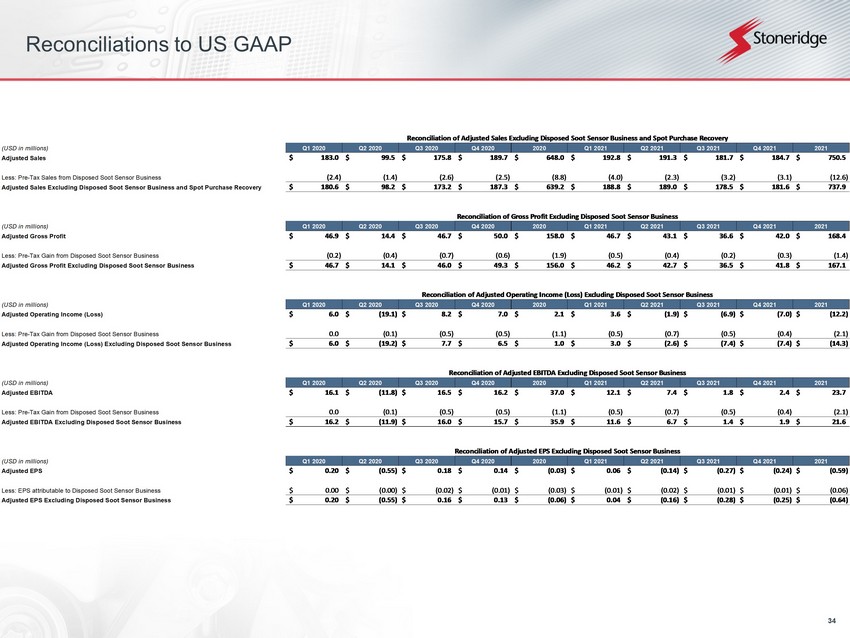
34 Reconciliations to US GAAP Reconciliation of Adjusted Sales Excluding Disposed Soot Sensor Business and Spot Purchase Recovery (USD in millions) Q1 2020 Q2 2020 Q3 2020 Q4 2020 2020 Q1 2021 Q2 2021 Q3 2021 Q4 2021 2021 Adjusted Sales 183.0$ 99.5$ 175.8$ 189.7$ 648.0$ 192.8$ 191.3$ 181.7$ 184.7$ 750.5$ Less: Pre-Tax Sales from Disposed Soot Sensor Business (2.4) (1.4) (2.6) (2.5) (8.8) (4.0) (2.3) (3.2) (3.1) (12.6) Adjusted Sales Excluding Disposed Soot Sensor Business and Spot Purchase Recovery 180.6$ 98.2$ 173.2$ 187.3$ 639.2$ 188.8$ 189.0$ 178.5$ 181.6$ 737.9$ Reconciliation of Gross Profit Excluding Disposed Soot Sensor Business (USD in millions) Q1 2020 Q2 2020 Q3 2020 Q4 2020 2020 Q1 2021 Q2 2021 Q3 2021 Q4 2021 2021 Adjusted Gross Profit 46.9$ 14.4$ 46.7$ 50.0$ 158.0$ 46.7$ 43.1$ 36.6$ 42.0$ 168.4$ Less: Pre-Tax Gain from Disposed Soot Sensor Business (0.2) (0.4) (0.7) (0.6) (1.9) (0.5) (0.4) (0.2) (0.3) (1.4) Adjusted Gross Profit Excluding Disposed Soot Sensor Business 46.7$ 14.1$ 46.0$ 49.3$ 156.0$ 46.2$ 42.7$ 36.5$ 41.8$ 167.1$ Reconciliation of Adjusted Operating Income (Loss) Excluding Disposed Soot Sensor Business (USD in millions) Q1 2020 Q2 2020 Q3 2020 Q4 2020 2020 Q1 2021 Q2 2021 Q3 2021 Q4 2021 2021 Adjusted Operating Income (Loss) 6.0$ (19.1)$ 8.2$ 7.0$ 2.1$ 3.6$ (1.9)$ (6.9)$ (7.0)$ (12.2)$ Less: Pre-Tax Gain from Disposed Soot Sensor Business 0.0 (0.1) (0.5) (0.5) (1.1) (0.5) (0.7) (0.5) (0.4) (2.1) Adjusted Operating Income (Loss) Excluding Disposed Soot Sensor Business 6.0$ (19.2)$ 7.7$ 6.5$ 1.0$ 3.0$ (2.6)$ (7.4)$ (7.4)$ (14.3)$ Reconciliation of Adjusted EBITDA Excluding Disposed Soot Sensor Business (USD in millions) Q1 2020 Q2 2020 Q3 2020 Q4 2020 2020 Q1 2021 Q2 2021 Q3 2021 Q4 2021 2021 Adjusted EBITDA 16.1$ (11.8)$ 16.5$ 16.2$ 37.0$ 12.1$ 7.4$ 1.8$ 2.4$ 23.7$ Less: Pre-Tax Gain from Disposed Soot Sensor Business 0.0 (0.1) (0.5) (0.5) (1.1) (0.5) (0.7) (0.5) (0.4) (2.1) Adjusted EBITDA Excluding Disposed Soot Sensor Business 16.2$ (11.9)$ 16.0$ 15.7$ 35.9$ 11.6$ 6.7$ 1.4$ 1.9$ 21.6$ Reconciliation of Adjusted EPS Excluding Disposed Soot Sensor Business (USD in millions) Q1 2020 Q2 2020 Q3 2020 Q4 2020 2020 Q1 2021 Q2 2021 Q3 2021 Q4 2021 2021 Adjusted EPS 0.20$ (0.55)$ 0.18$ 0.14$ (0.03)$ 0.06$ (0.14)$ (0.27)$ (0.24)$ (0.59)$ Less: EPS attributable to Disposed Soot Sensor Business 0.00$ (0.00)$ (0.02)$ (0.01)$ (0.03)$ (0.01)$ (0.02)$ (0.01)$ (0.01)$ (0.06)$ Adjusted EPS Excluding Disposed Soot Sensor Business 0.20$ (0.55)$ 0.16$ 0.13$ (0.06)$ 0.04$ (0.16)$ (0.28)$ (0.25)$ (0.64)$
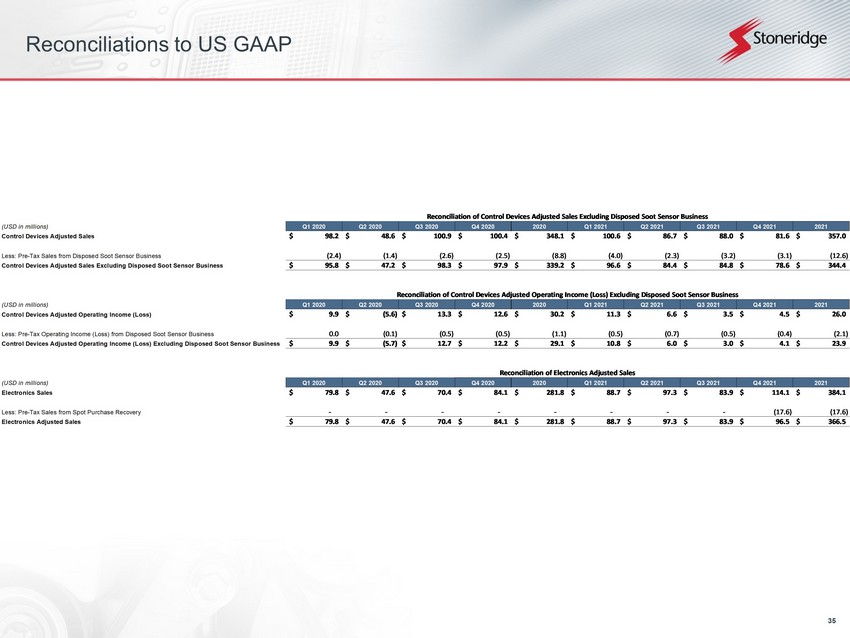
35 Reconciliations to US GAAP Reconciliation of Control Devices Adjusted Sales Excluding Disposed Soot Sensor Business (USD in millions) Q1 2020 Q2 2020 Q3 2020 Q4 2020 2020 Q1 2021 Q2 2021 Q3 2021 Q4 2021 2021 Control Devices Adjusted Sales 98.2$ 48.6$ 100.9$ 100.4$ 348.1$ 100.6$ 86.7$ 88.0$ 81.6$ 357.0$ Less: Pre-Tax Sales from Disposed Soot Sensor Business (2.4) (1.4) (2.6) (2.5) (8.8) (4.0) (2.3) (3.2) (3.1) (12.6) Control Devices Adjusted Sales Excluding Disposed Soot Sensor Business 95.8$ 47.2$ 98.3$ 97.9$ 339.2$ 96.6$ 84.4$ 84.8$ 78.6$ 344.4$ Reconciliation of Control Devices Adjusted Operating Income (Loss) Excluding Disposed Soot Sensor Business (USD in millions) Q1 2020 Q2 2020 Q3 2020 Q4 2020 2020 Q1 2021 Q2 2021 Q3 2021 Q4 2021 2021 Control Devices Adjusted Operating Income (Loss) 9.9$ (5.6)$ 13.3$ 12.6$ 30.2$ 11.3$ 6.6$ 3.5$ 4.5$ 26.0$ Less: Pre-Tax Operating Income (Loss) from Disposed Soot Sensor Business 0.0 (0.1) (0.5) (0.5) (1.1) (0.5) (0.7) (0.5) (0.4) (2.1) Control Devices Adjusted Operating Income (Loss) Excluding Disposed Soot Sensor Business 9.9$ (5.7)$ 12.7$ 12.2$ 29.1$ 10.8$ 6.0$ 3.0$ 4.1$ 23.9$ Reconciliation of Electronics Adjusted Sales (USD in millions) Q1 2020 Q2 2020 Q3 2020 Q4 2020 2020 Q1 2021 Q2 2021 Q3 2021 Q4 2021 2021 Electronics Sales 79.8$ 47.6$ 70.4$ 84.1$ 281.8$ 88.7$ 97.3$ 83.9$ 114.1$ 384.1$ Less: Pre-Tax Sales from Spot Purchase Recovery - - - - - - - - (17.6) (17.6) Electronics Adjusted Sales 79.8$ 47.6$ 70.4$ 84.1$ 281.8$ 88.7$ 97.3$ 83.9$ 96.5$ 366.5$
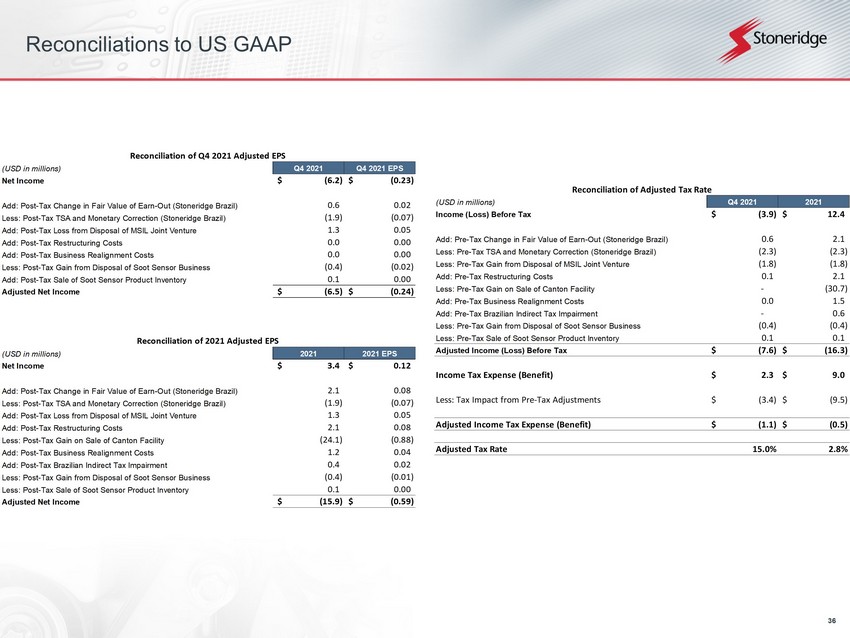
36 Reconciliations to US GAAP Reconciliation of Q4 2021 Adjusted EPS (USD in millions) Q4 2021 Q4 2021 EPS Net Income (6.2)$ (0.23)$ Add: Post-Tax Change in Fair Value of Earn-Out (Stoneridge Brazil) 0.6 0.02 Less: Post-Tax TSA and Monetary Correction (Stoneridge Brazil) (1.9) (0.07) Add: Post-Tax Loss from Disposal of MSIL Joint Venture 1.3 0.05 Add: Post-Tax Restructuring Costs 0.0 0.00 Add: Post-Tax Business Realignment Costs 0.0 0.00 Less: Post-Tax Gain from Disposal of Soot Sensor Business (0.4) (0.02) Add: Post-Tax Sale of Soot Sensor Product Inventory 0.1 0.00 Adjusted Net Income (6.5)$ (0.24)$ Reconciliation of 2021 Adjusted EPS (USD in millions) 2021 2021 EPS Net Income 3.4$ 0.12$ Add: Post-Tax Change in Fair Value of Earn-Out (Stoneridge Brazil) 2.1 0.08 Less: Post-Tax TSA and Monetary Correction (Stoneridge Brazil) (1.9) (0.07) Add: Post-Tax Loss from Disposal of MSIL Joint Venture 1.3 0.05 Add: Post-Tax Restructuring Costs 2.1 0.08 Less: Post-Tax Gain on Sale of Canton Facility (24.1) (0.88) Add: Post-Tax Business Realignment Costs 1.2 0.04 Add: Post-Tax Brazilian Indirect Tax Impairment 0.4 0.02 Less: Post-Tax Gain from Disposal of Soot Sensor Business (0.4) (0.01) Less: Post-Tax Sale of Soot Sensor Product Inventory 0.1 0.00 Adjusted Net Income (15.9)$ (0.59)$ Reconciliation of Adjusted Tax Rate (USD in millions) Q4 2021 2021 Income (Loss) Before Tax (3.9)$ 12.4$ Add: Pre-Tax Change in Fair Value of Earn-Out (Stoneridge Brazil) 0.6 2.1 Less: Pre-Tax TSA and Monetary Correction (Stoneridge Brazil) (2.3) (2.3) Less: Pre-Tax Gain from Disposal of MSIL Joint Venture (1.8) (1.8) Add: Pre-Tax Restructuring Costs 0.1 2.1 Less: Pre-Tax Gain on Sale of Canton Facility - (30.7) Add: Pre-Tax Business Realignment Costs 0.0 1.5 Add: Pre-Tax Brazilian Indirect Tax Impairment - 0.6 Less: Pre-Tax Gain from Disposal of Soot Sensor Business (0.4) (0.4) Less: Pre-Tax Sale of Soot Sensor Product Inventory 0.1 0.1 Adjusted Income (Loss) Before Tax (7.6)$ (16.3)$ Income Tax Expense (Benefit) 2.3$ 9.0$ Less: Tax Impact from Pre-Tax Adjustments (3.4)$ (9.5)$ Adjusted Income Tax Expense (Benefit) (1.1)$ (0.5)$ Adjusted Tax Rate 15.0% 2.8%