| Q3 2022 ResultsNovember 3, 2022 Exhibit 99.2 |

| 2 Forward-Looking StatementsStatements in this presentation that are not historical facts are forward-looking statements, which involve risks and uncertainties that could cause actual events or results to differ materially from those expressed or implied by the statements. Important factors that may cause actual results to differ materially from those in the forward-looking statements include, among other factors, the ability of suppliers to supply Stoneridge with parts and components at competitive prices on a timely basis; fluctuations in the cost and availability of key materials (includingsemiconductors, printed circuit boards, resin, aluminum, steel and copper) and components and our ability to offset cost increases through negotiatedprice increases with our customers or other cost actions; our ability to achieve cost reductions that offset or exceed customer-mandated selling price reductions; global economic trends, competition and geopolitical risks, including impacts from the ongoing conflict between Russia and Ukraine and the related sanctions and other measures, or an escalation of sanctions, tariffs or other trade tensions between the U.S. and China or othercountries; the impact of COVID-19, or other future pandemics, on the global economy, and on our customers, suppliers, employees, business and cash flows; the reduced purchases, loss or bankruptcy of a major customer or supplier; the costs and timing of facility closures, business realignment or similar actions; a significant change in automotive, commercial, off-highway and agricultural vehicle production; competitive market conditions and resulting effects on sales and pricing; our ability to successfully launch/produce products for awarded business; adverse changes in laws, government regulations or market conditions, including tariffs, affecting our products or customers products; labor disruptions at Stoneridges facilities or at any of Stoneridges significant customers or suppliers; the amount of Stoneridges indebtedness and the restrictive covenants contained in the agreements governing its indebtedness, including its revolving credit facility; customer acceptance of new products; capital availability or costs, including changes in interest rates or market perceptions; the occurrence or non-occurrence of circumstances beyond Stoneridges control; and the items described in Risk Factors and other uncertainties or risks discussed in Stoneridges periodic and current reports filed with the Securities and Exchange Commission.Important factors that could cause the performance of the commercial vehicle and automotive industry to differ materially from those in the forward-looking statements include factors such as (1) continued economic instability or poor economic conditions in the United States and global markets, (2) changes in economic conditions, housing prices, foreign currency exchange rates, commodity prices, including shortages ofand increases or volatility in the price of oil, (3) changes in laws and regulations, (4) the state of the credit markets, (5) political stability, (6) international conflicts and (7) the occurrence of force majeure events.These factors should not be construed as exhaustive and should be considered with the other cautionary statements in Stoneridges filings with the Securities and Exchange Commission.Forward-looking statements are not guarantees of future performance; Stoneridges actual results of operations, financial condition and liquidity, and the development of the industry in which Stoneridge operates may differ materially from those described in or suggested by the forward-looking statements contained in this presentation. In addition, even if Stoneridges results of operations, financial condition and liquidity, and the development of the industry in which Stoneridge operates are consistent with the forward-looking statements contained in this presentation, those results or developments may not be indicative of results or developments in subsequent periods.This presentation contains time-sensitive information that reflects managements best analysis only as of the date of this presentation. Any forward-looking statements in this presentation speak only as of the date of this presentation, and Stoneridge undertakes no obligation to update such statements. Comparisons of results for current and any prior periods are not intended to express any future trends or indications of future performance, unless expressed as such, and should only be viewed as historical data.Stoneridge does not undertake any obligation to publicly update or revise any forward-looking statement as a result of new information, future events or otherwise, except as otherwise required by law.Rounding Disclosure: There may be slight immaterial differences between figures represented in our public filings compared to what is shown in this presentation. The differences are the result of rounding due to the representation of values in millions rather than thousands in public filings. |
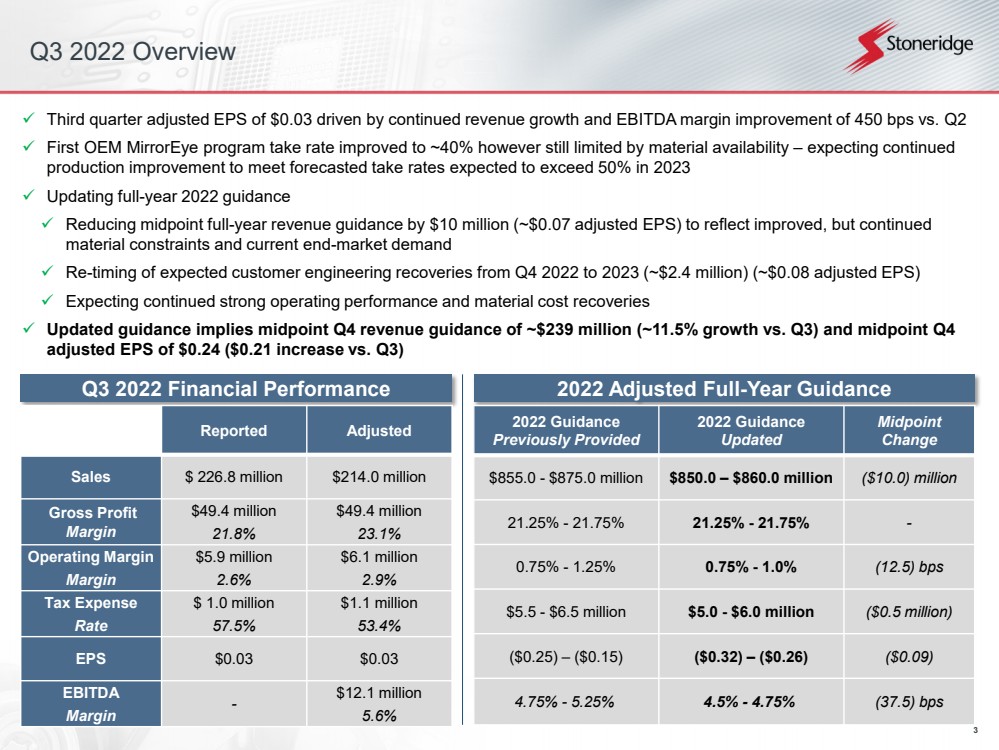
| 3 Q3 2022 OverviewThird quarter adjusted EPS of $0.03 driven by continued revenue growth and EBITDA margin improvement of 450 bps vs. Q2First OEM MirrorEye program take rate improved to ~40% however still limited by material availability expecting continued production improvement to meet forecasted take rates expected to exceed 50% in 2023Updating full-year 2022 guidanceReducing midpoint full-year revenue guidance by $10 million (~$0.07 adjusted EPS)to reflect improved, but continued material constraints and current end-market demandRe-timing of expected customer engineering recoveries from Q4 2022 to 2023 (~$2.4 million) (~$0.08 adjusted EPS)Expecting continued strong operating performance and material cost recoveriesUpdated guidance implies midpoint Q4 revenue guidance of ~$239 million (~11.5% growth vs. Q3) and midpoint Q4 adjusted EPS of $0.24 ($0.21 increase vs. Q3) Q32022FinancialPerformance 2022AdjustedFull-YearGuidance 2022 Guidance Previously Provided2022 Guidance UpdatedMidpoint Change$855.0 -$875.0 million$850.0 $860.0 million($10.0) million21.25% -21.75%21.25% -21.75%-0.75% -1.25%0.75% -1.0%(12.5) bps$5.5 -$6.5 million$5.0 -$6.0 million($0.5 million)($0.25) ($0.15)($0.32) ($0.26)($0.09)4.75% -5.25%4.5% -4.75%(37.5) bps ReportedAdjustedSales$ 226.8 million$214.0 millionGross Profit Margin$49.4 million21.8%$49.4 million23.1%Operating MarginMargin$5.9 million2.6%$6.1 million2.9%Tax ExpenseRate$ 1.0 million57.5%$1.1 million53.4%EPS$0.03$0.03EBITDAMargin-$12.1 million5.6% |
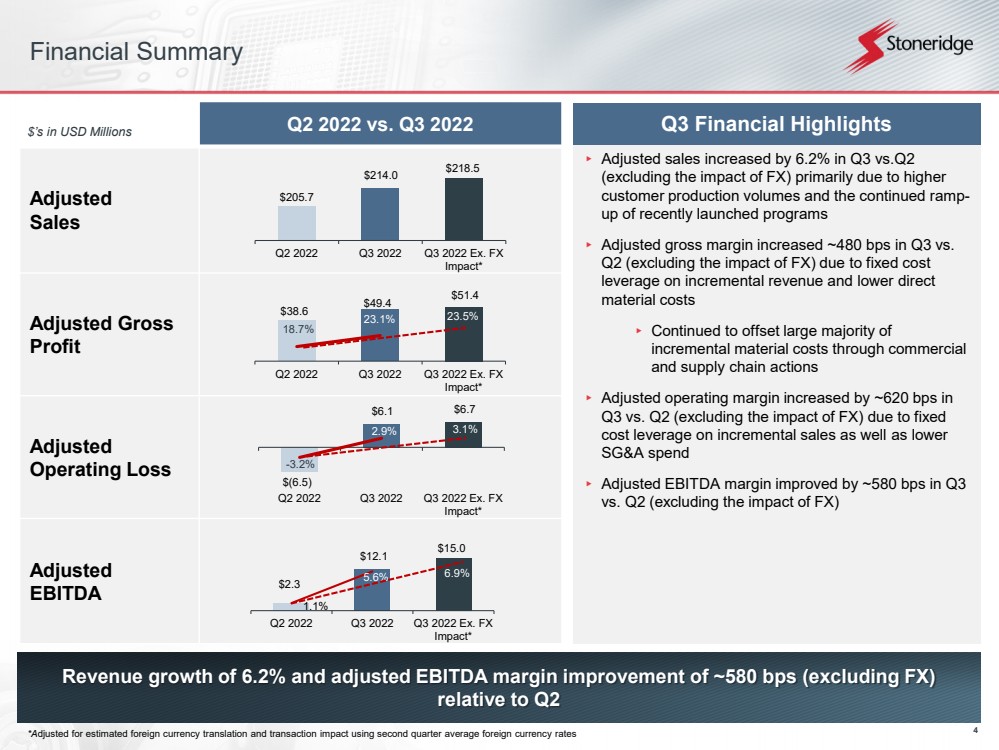
| 4 ▸Adjusted sales increased by 6.2% in Q3 vs.Q2 (excluding the impact of FX) primarily due to higher customer production volumes and the continued ramp-up of recently launched programs ▸Adjusted gross margin increased ~480 bps in Q3 vs. Q2 (excluding the impact of FX) due to fixed cost leverage on incremental revenue and lower direct material costs▸Continued to offset large majority of incremental material costs through commercial and supply chain actions▸Adjusted operating margin increased by ~620 bps in Q3 vs. Q2 (excluding the impact of FX) due to fixed cost leverage on incremental sales as well as lower SG&A spend▸Adjusted EBITDA margin improved by ~580 bps in Q3 vs. Q2 (excluding the impact of FX)Financial Summary Revenue growth of 6.2% and adjusted EBITDA margin improvement of ~580 bps (excluding FX) relative to Q2 Q2 2022 vs. Q3 2022Adjusted SalesAdjustedGross ProfitAdjusted Operating LossAdjusted EBITDA$s in USD Millions Q3FinancialHighlights*Adjusted for estimated foreign currency translation and transaction impact using secondquarter average foreign currency rates $205.7 $214.0 $218.5 Q2 2022Q3 2022Q3 2022 Ex. FXImpact* $38.6 $49.4 $51.4 18.7%23.1%13%23%33%0204060Q2 2022Q3 2022Q3 2022 Ex. FXImpact* 23.5% $2.3 $12.1 $15.0 1.1%5.6%0%2%4%6%8%10%05101520Q2 2022Q3 2022Q3 2022 Ex. FXImpact*6.9% $(6.5)$6.1 $6.7 -3.2%2.9%-12%-2%8%-10-505 10 Q2 2022Q3 2022Q3 2022 Ex. FXImpact* 3.1% |
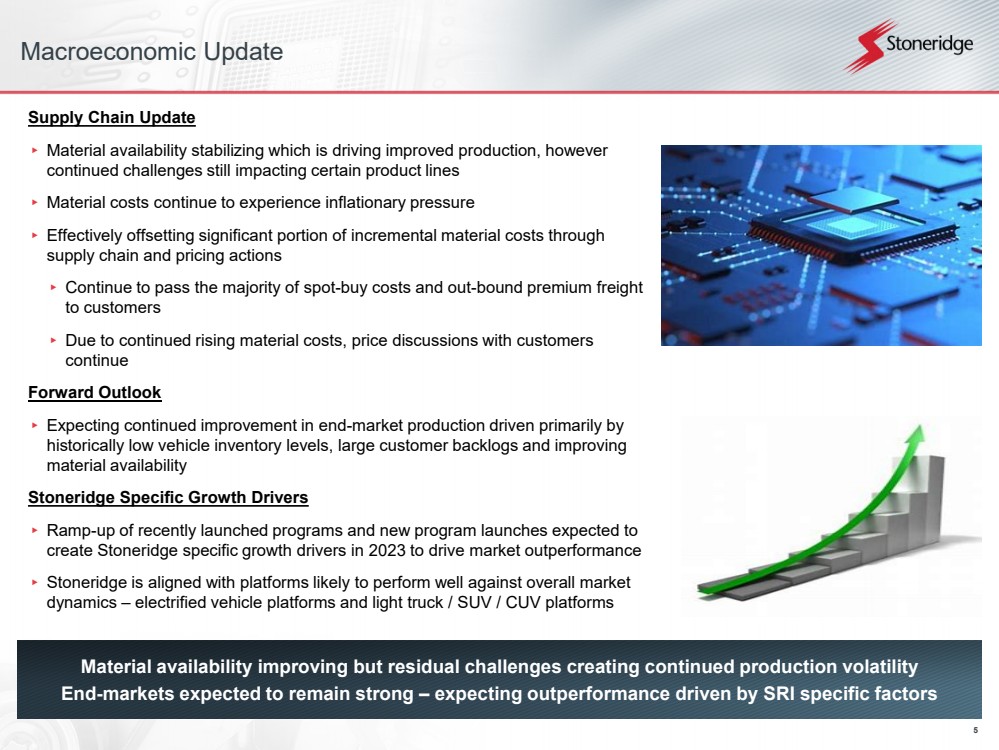
| 5 Macroeconomic Update Supply Chain Update ▸Material availability stabilizing which is driving improved production, however continued challenges still impacting certain product lines▸Material costs continue to experience inflationary pressure▸Effectively offsetting significant portion of incremental material costs through supply chain and pricing actions▸Continue to pass the majority ofspot-buy costs and out-bound premium freight to customers▸Due to continued rising material costs, price discussions with customers continue Forward Outlook ▸Expecting continued improvement in end-market production driven primarily by historically low vehicle inventory levels, large customer backlogs and improving material availability Stoneridge Specific Growth Drivers ▸Ramp-up of recently launched programs and new program launches expected to create Stoneridge specific growth drivers in 2023 to drive market outperformance▸Stoneridge is aligned with platforms likely to perform well against overall market dynamics electrified vehicle platforms and light truck / SUV / CUV platforms Material availability improving but residual challenges creating continued production volatilityEnd-markets expected to remain strong expecting outperformance driven by SRI specific factors |
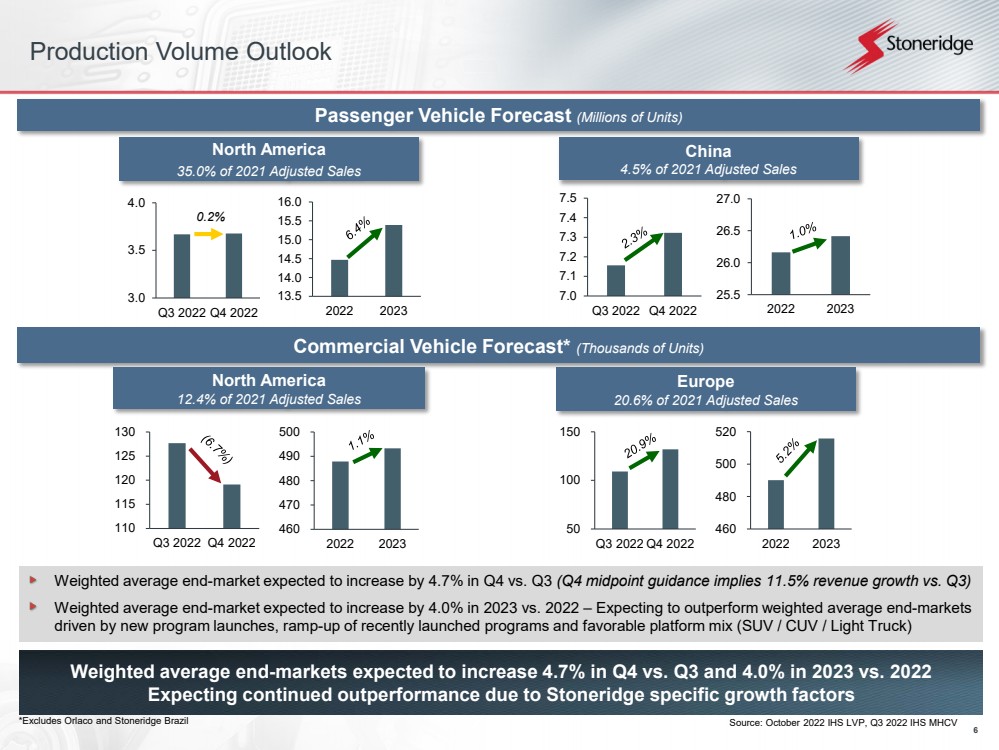
| 6 50100150Q3 2022Q4 2022 110115120125 130 Q3 2022Q4 2022 Weighted average end-market expected to increase by 4.7% in Q4 vs. Q3 (Q4 midpoint guidance implies 11.5% revenue growth vs. Q3) Weighted average end-market expected to increase by 4.0% in 2023 vs. 2022 Expecting to outperform weighted average end-marketsdriven by new program launches, ramp-up of recently launched programs and favorable platform mix (SUV / CUV / Light Truck) Weighted average end-markets expected to increase 4.7% in Q4 vs. Q3 and 4.0% in 2023 vs. 2022 Expecting continued outperformance due to Stoneridge specific growth factorsProduction Volume Outlook PassengerVehicleForecast(MillionsofUnits)*Excludes Orlaco and Stoneridge Brazil CommercialVehicleForecast*(ThousandsofUnits) 46047048049050020222023 North America 12.4% of 2021 Adjusted Sales 46048050052020222023 Europe 20.6% of 2021 Adjusted Sales 13.514.014.515.015.516.020222023 North America35.0% of 2021 Adjusted Sales 25.526.026.5 27.0 20222023 China 4.5% of 2021 Adjusted Sales Source: October 2022 IHS LVP, Q3 2022 IHS MHCV 3.03.54.0 Q3 2022 Q4 2022 0.2% 7.07.17.27.37.47.5Q3 2022Q4 2022 |
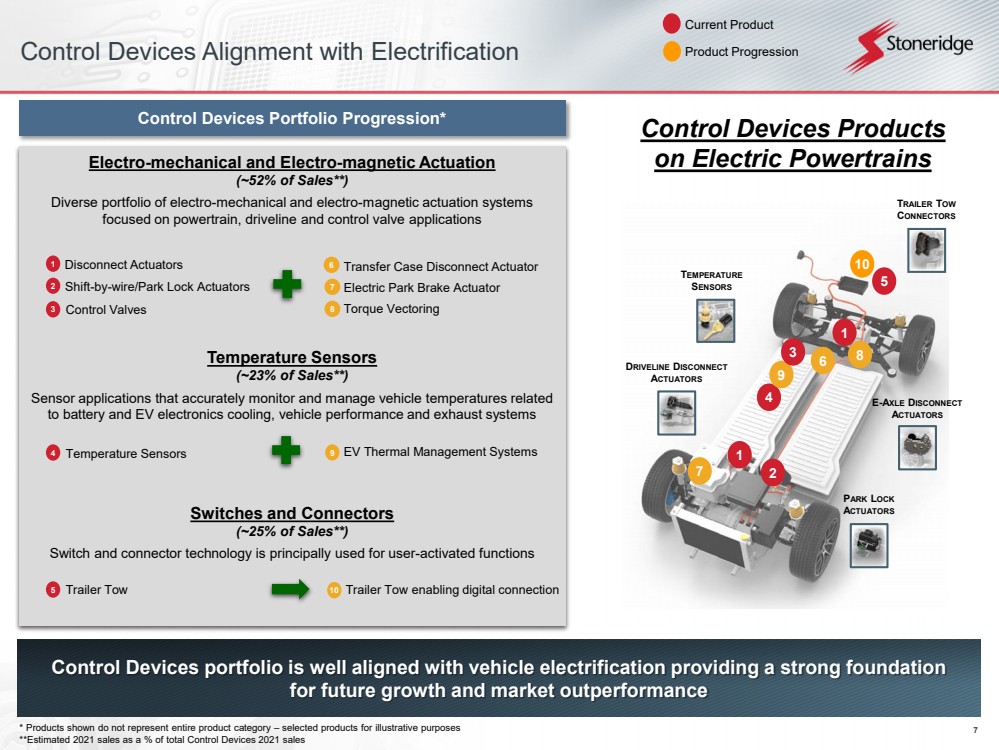
| 7 1 2 7 1 4 9 8 5 3Control Devices Alignment with Electrification Electro-mechanical and Electro-magnetic Actuation (~52% of Sales**)Diverse portfolio of electro-mechanical and electro-magnetic actuationsystems focused on powertrain, driveline and control valve applications Temperature Sensors (~23% of Sales**)Sensor applications that accurately monitor and manage vehicle temperatures related to battery and EV electronics cooling, vehicle performance and exhaust systems Switches and Connectors (~25% of Sales**)Switch and connector technology is principally used for user-activated functions Control Devices Portfolio Progression*Shift-by-wire/Park Lock ActuatorsDisconnect Actuators 1 2Control Valves 3Temperature Sensors 4Trailer Tow 5 10 Control Devices portfolio is well aligned with vehicle electrification providing a strong foundation for future growth and market outperformance 6 7 8Transfer Case Disconnect ActuatorElectric Park Brake ActuatorTorque VectoringEV Thermal Management Systems 9 Trailer Tow enabling digital connection10 DRIVELINEDISCONNECTACTUATORS E-AXLEDISCONNECTACTUATORS PARKLOCKACTUATORSTEMPERATURESENSORS Control Devices Products on Electric Powertrains TRAILERTOWCONNECTORS 6 Current ProductProduct Progression* Products shown do not represent entire product category selected products for illustrative purposes**Estimated 2021 sales as a % of total Control Devices 2021 sales |
| 8 Summary Summary Q3 financial performance driven by strong margin performance on continued revenue growth expectingcontinued revenue growth and margin expansion in Q4 and into 2023Continued success largely offsetting incremental material costs and recovering historical costs materialchallenges improving but expected to remain into 2023Market demand continues to be strong for first OEM MirrorEye program material challenges improvingwith production expected to meet forecasted 50%+ take rates in 2023Weighted average end-markets expected to increase 4.7% in Q4 vs. Q3 and 4.0% in 2023 vs. 2022 expecting continued outperformance due to Stoneridge specific growth factorsControl Devices product portfolio aligned with industry trend to electrification creating another growthplatform for the Company Forward Outlook Updating full-year 2022 guidance to reflect current market conditionsUpdated guidance implies midpoint Q4 revenue guidance of ~$239 million (~11.5% growth vs. Q3) and midpoint Q4 adjusted EPS of $0.24 ($0.21 increase vs. Q3)Expecting continued improvement in weighted average end-markets in 2023. New program launches andramp-up of existing programs expected to drive outperformance of underlying markets. Driving shareholder value by executing on variables within our control, responding to factors that are out of our control and executing on our long - term strategy |
| 9 Financial Update |

| 10 3rdQuarter 2022 Financial Summary 3rdQuarter2022FinancialResults Adjusted sales of $214.0 million, an increase of 4.0% over Q2 2022 Control Devices sales of $89.4 million, an increase of 5.1% over Q2 2022 Electronics adjusted sales of $117.2 million, an increase of 1.8% over Q2 2022 Stoneridge Brazil sales of $13.8 million, an increase of 3.5% compared to Q2 2022 Adjusted operating income of $6.1 million (2.9% adjusted operating margin), an increase of ~600 bps over Q2 2022 Control Devices operating income of $7.5 million (8.4% operating margin), an increase of ~360 bps over Q2 2022 Electronics operating income of $5.4 million (4.6% adjusted operating margin), an increase of ~680 bps over Q2 2022 Stoneridge Brazil adjusted operating income of $1.0 million (7.0% adjusted operating margin), an increase of ~400 bps compared to Q2 2022 2022UpdatedFull-YearGuidance 2022 Guidance Previously Provided2022 Guidance UpdatedMid-point ChangeSales$855.0 $875.0 million$850.0 $860.0 million($10.0) millionAdjusted Gross Margin21.25% -21.75%21.25% -21.75%-Adjusted Operating Margin0.75% -1.25%0.75% -1.0%(12.5) bpsAdjusted Tax Expense$5.5 -$6.5 million$5.0 -$6.0 million($0.5 million)Adjusted EPS($0.25) ($0.15)($0.32) ($0.26)($0.09)Adjusted EBITDA Margin4.75% -5.25%4.5% -4.75%(37.5) bps Updated Guidance Summary Updating full-year 2022 guidance Reducing revenue expectations to reflect improved, but continued material constraints and current end-market demand Expecting unfavorable impact of re-timing of $2.4million of customer engineering recoveries from Q4 2022 to 2023 Expecting continued strong operating performance, including customer recoveries Midpoint Q4 adjusted revenue guidance of ~$239 million (growth of ~11.5% vs. Q3) Midpoint Q4 adjusted EPS guidance of $0.24 (increase of $0.21 vs. Q3) |
| 11 Q3 2022 Key Performance Drivers Operating performance, net material costs and continued focus on cost management resulted in Q3 outperformance vs. prior expectations despite significant non - cash FX headwinds Q3 Operating Performance Favorable material costs and product mix, net of production volatility that drove continued manufacturing inefficiencies, resulted in net favorable operating performance of ~$0.03 in Q3 vs. prior expectations Continued to focus on cost structure aligned with current market conditions and lean operating structure to drive ~$0.03 of outperformance vs. prior expectations in Q3 Recovered ~$0.05 of historical costs in Q3 continuing to pursue current and historical material cost recovery opportunities Q3 Non-operating Impact Significant net FX headwinds created primarily by the revaluation of intercompany loan balances (non-cash) FX~($0.09) Reduced Operating Expenses~$0.03 ~Net Impact of ~$0.11 Net Impact of ~($0.09) Q3OperatingPerformance Q3 Non-Operating ImpactOperatingPerformance~$0.03 Historical MaterialCost Recoveries~$0.05 |
| 12 Control DevicesFinancial Performance With material availability continuing to improve, focus remains on production output and offsetting incremental material costs as necessary through supply chain and pricing actions Control Devices Forward Expectations ▸Focused on production output as material availability continues to improve▸Continue to focus on supply chain strategy and price negotiations with customers to offset continued material inflation as necessary▸Continue to invest in and grow capabilities to meet significant incremental demand on electrified vehicle platform actuation and other advanced technology programs Q2 2022 vs. Q3 2022SalesOperating Income$s in USD Millions Control Devices Q3 Summary Q3 sales increased by 5.1% vs Q2 2022 primarily due to higher production volumes and incremental revenue from actuation program ramp-ups Sales in Q3 2022 include the unfavorable impact of foreign currency of approximately ($0.5) million vs. Q2 2022 Operating margin increased by 360 bps vs. Q2 2022 primarily due to lower material costs driven by favorable sales mix as well as favorable SG&A spend Operating income in Q3 2022 includes unfavorable foreign currency impact of approximately ($0.1) million vs. Q2 2022 *Adjusted for estimated foreign currency translation and transaction impact using secondquarter average foreign currency rates $85.0 $89.4 $89.8 Q2 2022Q3 2022Q3 2022 ExFX Impact* $4.1 $7.5 $7.6 4.8%8.4%2%7%12%17%0246810Q2 2022Q3 2022Q3 2022 ExFX Impact* 8.5% |
| 13 Q2 2022 vs. Q3 2022Adjusted SalesOperating Income (Loss)ElectronicsFinancial Performance Focused on continued margin expansion aligned with strong revenue growth expectations Continued momentum with MirrorEye OEM program launches and retrofit expansions Electronics Forward Expectations ▸Expecting revenue growth to outperform weighted average end-markets driven by new program launches and ramp-up of recently launched programs▸Focus remains on executing on MirrorEye OEM program launches and retrofit expansions▸Focused on efficient cost structure to ensure earnings potential is optimized with significant growth expectations in 2023$s in USD Millions Electronics Q3 Summary Q3 sales increased by 4.7% vs. Q2 2022 (excluding FX) primarily due to higher customer production volumes from continued strong end-market demand and improved material availability Adjusted sales in Q3 2022 include unfavorable foreign currency impact of approximately ($3.3) million vs. Q2 2022 Q3adjusted operating margin improved by 690 bps vs. Q2 2022 (excluding FX) primarily due to lower material costs driven primarily by continued cost recoveries and variable cost control Operating income in Q3 2022 includes unfavorable foreign currency impact of approximately ($0.2) million vs. Q2 2022 *Adjusted for estimated foreign currency translation and transaction impact using secondquarter average foreign currency rates $115.1 $117.2 $120.5 Q2 2022Q3 2022Q3 Ex FXImpact* $(2.5)$5.4 $5.6 -2.2%4.6%-6%-1%4%9%-505 10 Q2 2022Q3 2022Q3 Ex FXImpact* 4.7% |
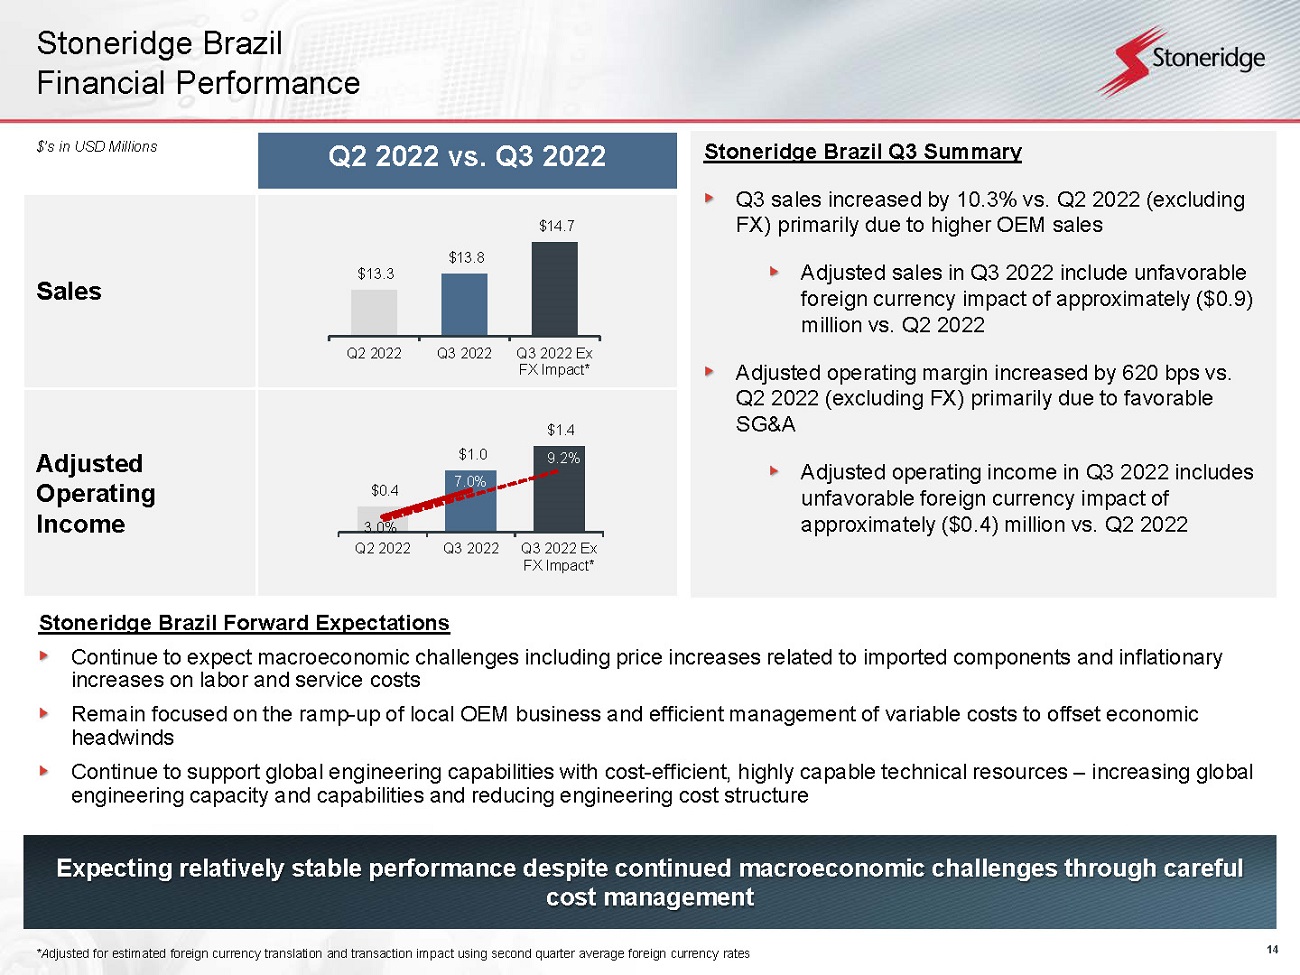
| 14 Q2 2022 vs. Q3 2022SalesAdjusted Operating IncomeStoneridge BrazilFinancial Performance Expecting relatively stable performance despite continued macroeconomic challenges through careful cost management Stoneridge Brazil Forward Expectations Continue to expect macroeconomic challenges including price increases related to imported components and inflationary increases on labor and service costs Remain focused on the ramp-up of local OEM business and efficient management of variable costs to offset economic headwinds Continue to support global engineering capabilities with cost-efficient, highly capable technical resources increasing global engineering capacity and capabilities and reducing engineering cost structure Stoneridge Brazil Q3 Summary Q3 sales increased by 10.3% vs. Q2 2022 (excluding FX) primarily due to higher OEM sales Adjusted sales in Q3 2022 include unfavorable foreign currency impact of approximately ($0.9) million vs. Q2 2022 Adjusted operating income increased by 620 bps vs. Q2 2022 (excluding FX) primarily due to favorable SG&A Operating income in Q3 2022 includes unfavorable foreign currency impact of approximately ($0.4) million vs. Q2 2022 $s in USD Millions*Adjusted for estimated foreign currency translation and transaction impact using second quarter average foreign currency rates $13.3 $13.8 $14.7 Q2 2022Q3 2022Q3 2022 ExFX Impact* $0.4 $1.0 $1.4 3.0%7.0%1%6%11%00.511.5Q2 2022Q3 2022Q3 2022 ExFX Impact* 9.2% |
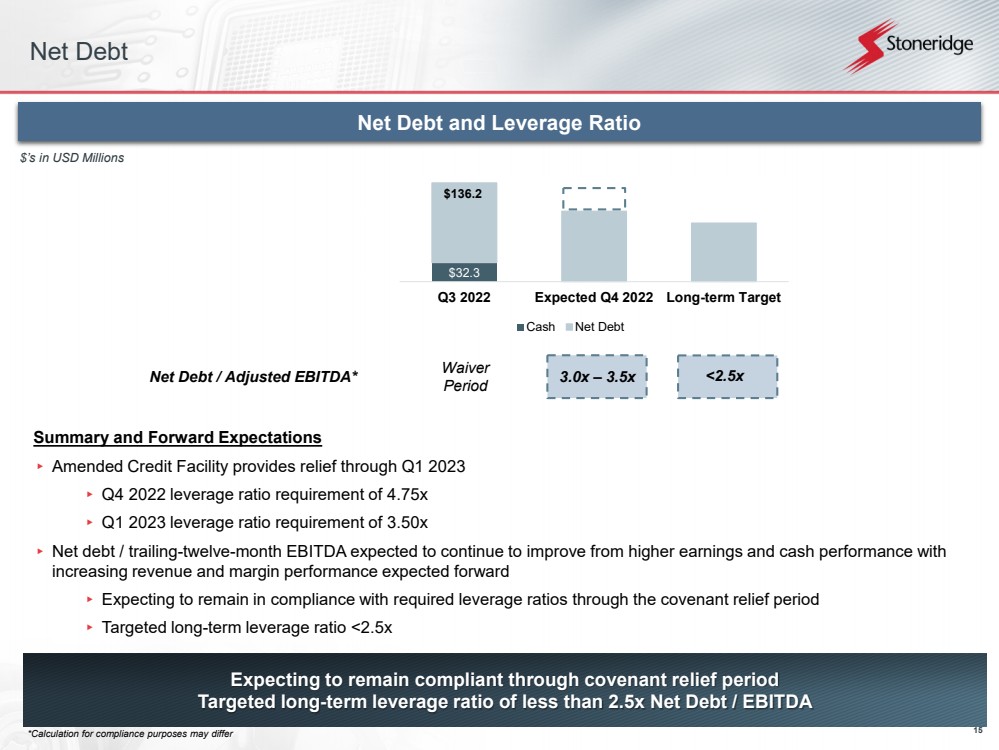
| 15 $32.3$136.2 - 20.0 40.0 60.0 80.0 100.0 120.0 140.0 160.0 180.0Q3 2022Expected Q4 2022Long-term Target Cash Net Debt Expecting to remain compliant through covenant relief period Targeted long - term leverage ratio of less than 2.5x Net Debt / EBITDA Summary and Forward Expectations ▸Amended Credit Facility provides relief through Q1 2023▸Q4 2022 leverage ratio requirement of 4.75x▸Q1 2023 leverage ratio requirement of 3.50x▸Net debt / trailing-twelve-month EBITDA expected to continue to improve from higher earnings and cash performance with increasing revenue and margin performance expected forward▸Expecting to remain in compliance with required leverage ratios through the covenant relief period▸Targeted long-term leverage ratio <2.5x 3.0x 3.5xNet Debt / Adjusted EBITDA* Net Debt and Leverage Ratio$s in USD MillionsNet Debt <2.5xWaiver Period *Calculation for compliance purposes may differ |
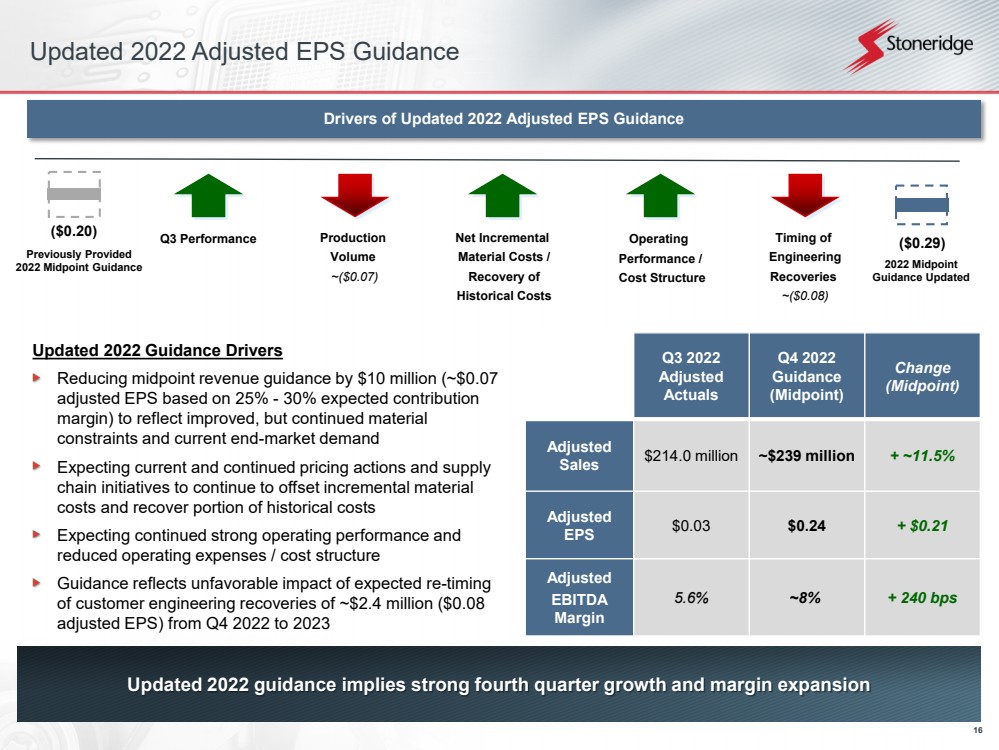
| 16 Updated 2022 Adjusted EPS GuidancePreviously Provided2022 Midpoint Guidance DriversofUpdated2022AdjustedEPSGuidance($0.20)($0.29)2022 MidpointGuidance Updated Updated 2022 guidance implies strong fourth quarter growth and margin expansion Updated 2022 Guidance Drivers Reducing midpoint revenue guidance by $10 million (~$0.07 adjusted EPS based on 25% -30% expected contribution margin) to reflect improved, but continued material constraints and current end-market demand Expecting current and continued pricing actions and supply chain initiatives to continue to offset incremental material costs and recover portion of historical costs Expecting continued strong operating performance and reduced operating expenses / cost structure Guidance reflects unfavorable impact of expected re-timing of customer engineering recoveries of ~$2.4 million ($0.08 adjusted EPS) from Q4 2022 to 2023 Production Volume ~($0.07) Operating Performance /Cost Structure Timing of EngineeringRecoveries ~($0.08) Net IncrementalMaterial Costs /Recovery ofHistorical Costs Q3 Performance Q3 2022 Adjusted ActualsQ4 2022 Guidance (Midpoint)Change (Midpoint)Adjusted Sales$214.0 million~$239 million+ ~11.5%Adjusted EPS$0.03$0.24+ $0.21Adjusted EBITDA Margin5.6%~8%+ 240 bps |
| 17 Summary Q3 2022 Summary ▸Control Devices Sales increased versus Q2 primarily due to higher production volumes and incremental revenue from actuation programs. Continued focus on offsetting incremental material costs with pricing actions and supply chain strategies, while managing controllable costs.▸Electronics Continued strong sales growth during the quarter. Improved financial performance due to lower direct material costs and strong operating performance. Continued strong take rates on first MirrorEye OEM program in Europe. ▸Stoneridge Brazil Macroeconomic challenges continue focus on growing OEM business, maintaining margin profile and supporting global engineering efforts with highly capable, cost-efficient engineering footprint 2022 Outlook and Guidance ▸Reducing previously provided full-year 2022 adjusted revenue guidance to reflect improved, but continued material availability and current end-market demand▸Midpoint full-year adjusted revenue guidance of $855 million ($850 million -$860 million)▸Maintaining full-year 2022 adjusted gross margin considering continued strong operating performance and the expectation that pricing and supply chain actions will continue to offset incremental material costs and recover historical costs▸Midpoint full-year adjusted gross margin guidance of 21.5% (remains unchanged) ▸Reducing full-year 2022 operating and EBITDA margin guidance primarily related to re-timed engineering expenses offset by improved operating performance and non-cash impact of foreign currency on non-operating income/expenses driven by the revaluation of intercompany balances▸Midpoint full-year adjusted operating margin guidance of 0.875% (reduction of 12.5 basis points)▸Midpoint full-year adjusted EBITDA margin guidance of 4.75% (reduction of 37.5 basis points)▸Reducingfull-yearadjusted EPS guidance to a midpoint of ($0.29) (($0.32) -($0.26)) Adapting and responding to improving macroeconomic conditions to maximize financial performance and drive shareholder value |
| 18 Appendix |

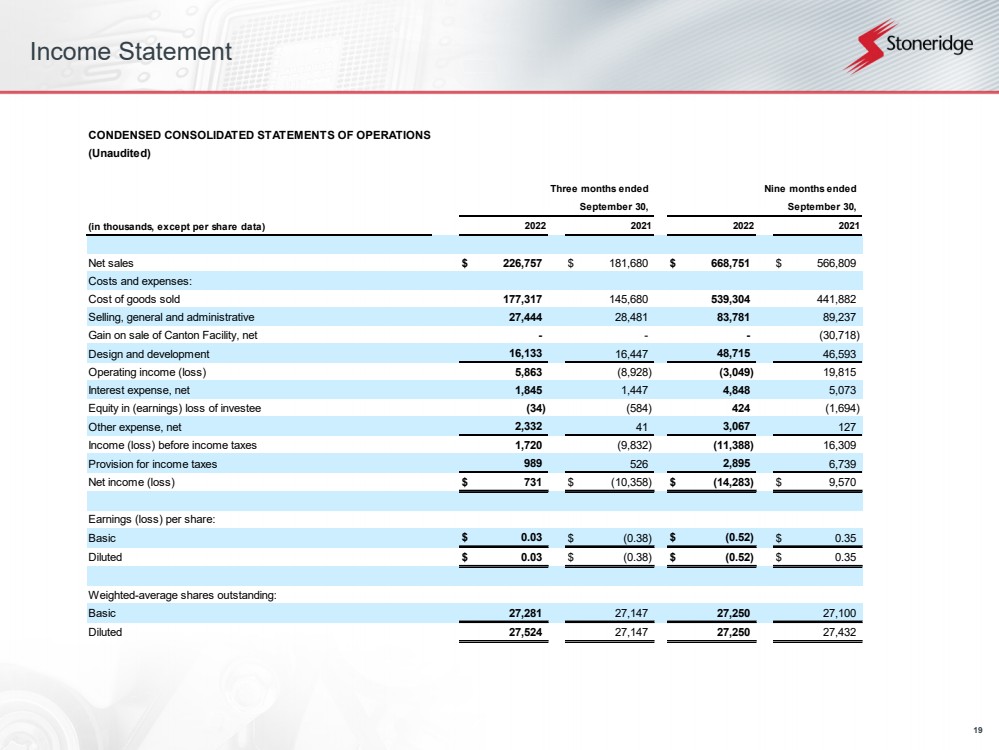
| 19 Income Statement CONDENSED CONSOLIDATED STATEMENTS OF OPERATIONS(Unaudited) (in thousands, except per share data) Net sales$226,757 $181,680 $668,751 $566,809 Costs and expenses: Cost of goods sold177,317 145,680 539,304 441,882 Selling, general and administrative27,444 28,481 83,781 89,237 Gain on sale of Canton Facility, net - - -(30,718) Design and development16,133 16,447 48,715 46,593 Operating income (loss)5,863 (8,928) (3,049) 19,815 Interest expense, net1,845 1,447 4,848 5,073 Equity in (earnings) loss of investee(34) (584) 424 (1,694) Other expense, net2,332 41 3,067 127 Income (loss) before income taxes1,720 (9,832) (11,388) 16,309 Provision for income taxes989 526 2,895 6,739 Net income (loss)$731 $(10,358) $(14,283) $9,570 Earnings (loss) per share: Basic$0.03 $(0.38) $(0.52) $0.35 Diluted$0.03 $(0.38) $(0.52) $0.35 Weighted-average shares outstanding: Basic27,281 27,147 27,250 27,100 Diluted27,524 27,147 27,250 27,432 Three months ended Nine months ended September 30, September 30, 2022 2021 2022 2021 |
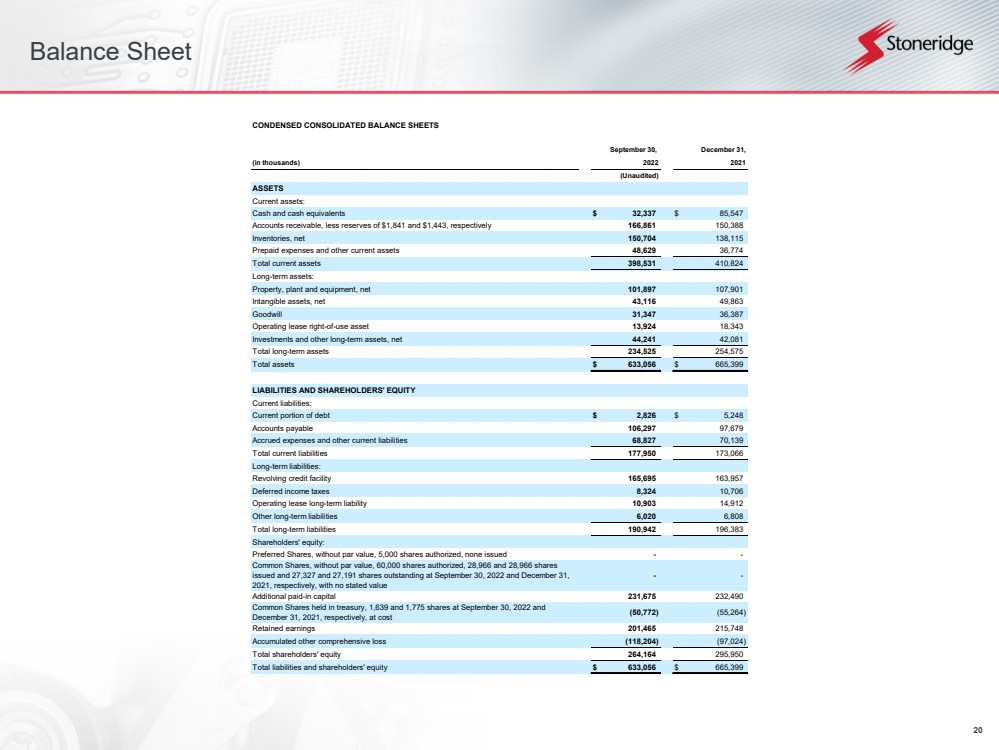
| 20 Balance Sheet CONDENSED CONSOLIDATED BALANCE SHEETS (in thousands) (Unaudited) ASSETS Current assets: Cash and cash equivalents$32,337 $85,547 Accounts receivable, less reserves of $1,841 and $1,443, respectively166,861 150,388 Inventories, net150,704 138,115 Prepaid expenses and other current assets48,629 36,774 Total current assets398,531 410,824 Long-term assets: Property, plant and equipment, net101,897 107,901 Intangible assets, net43,116 49,863 Goodwill31,347 36,387 Operating lease right-of-use asset13,924 18,343 Investments and other long-term assets, net44,241 42,081 Total long-term assets234,525 254,575 Total assets$633,056 $665,399 LIABILITIES AND SHAREHOLDERS' EQUITY Current liabilities: Current portion of debt$2,826 $5,248 Accounts payable106,297 97,679 Accrued expenses and other current liabilities68,827 70,139 Total current liabilities177,950 173,066 Long-term liabilities: Revolving credit facility165,695 163,957 Deferred income taxes8,324 10,706 Operating lease long-term liability10,903 14,912 Other long-term liabilities6,020 6,808 Total long-term liabilities190,942 196,383 Shareholders' equity: Preferred Shares, without par value, 5,000 shares authorized, none issued - - Common Shares, without par value, 60,000 shares authorized, 28,966 and 28,966 shares issued and 27,327 and 27,191 shares outstanding at September 30, 2022 and December 31, 2021, respectively, with no stated value - - Additional paid-in capital231,675 232,490 Common Shares held in treasury, 1,639 and 1,775 shares at September 30, 2022 and December 31, 2021, respectively, at cost (50,772) (55,264) Retained earnings201,465 215,748 Accumulated other comprehensive loss(118,204) (97,024) Total shareholders' equity264,164 295,950 Total liabilities and shareholders' equity$633,056 $665,399 September 30, December 31, 2022 2021 |
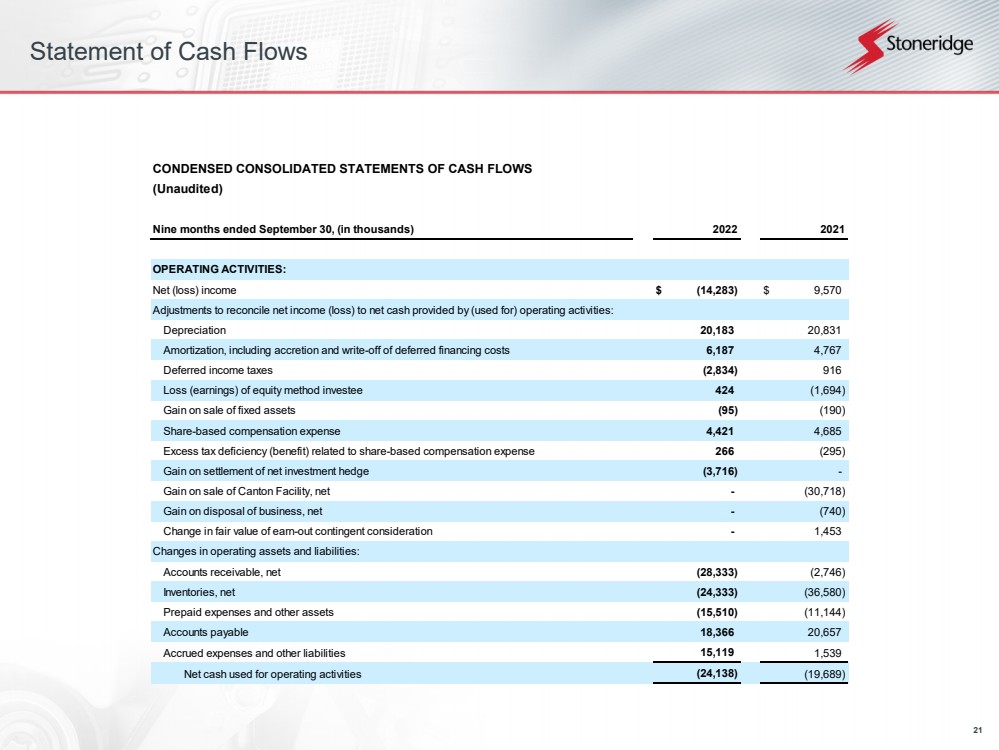
| 21 Statement of Cash Flows CONDENSED CONSOLIDATED STATEMENTS OF CASH FLOWS(Unaudited) Nine months ended September 30, (in thousands) OPERATING ACTIVITIES: Net (loss) income$(14,283) $9,570 Adjustments to reconcile net income (loss) to net cash provided by (used for) operating activities: Depreciation20,183 20,831 Amortization, including accretion and write-off of deferred financing costs 6,187 4,767 Deferred income taxes(2,834) 916 Loss (earnings) of equity method investee424 (1,694) Gain on sale of fixed assets(95) (190) Share-based compensation expense4,421 4,685 Excess tax deficiency (benefit) related to share-based compensation expense266 (295) Gain on settlement of net investment hedge(3,716) - Gain on sale of Canton Facility, net -(30,718) Gain on disposal of business, net -(740) Change in fair value of earn-out contingent consideration -1,453 Changes in operating assets and liabilities: Accounts receivable, net(28,333) (2,746) Inventories, net(24,333) (36,580) Prepaid expenses and other assets(15,510) (11,144) Accounts payable18,366 20,657 Accrued expenses and other liabilities15,119 1,539 Net cash used for operating activities(24,138) (19,689) 2022 2021 |
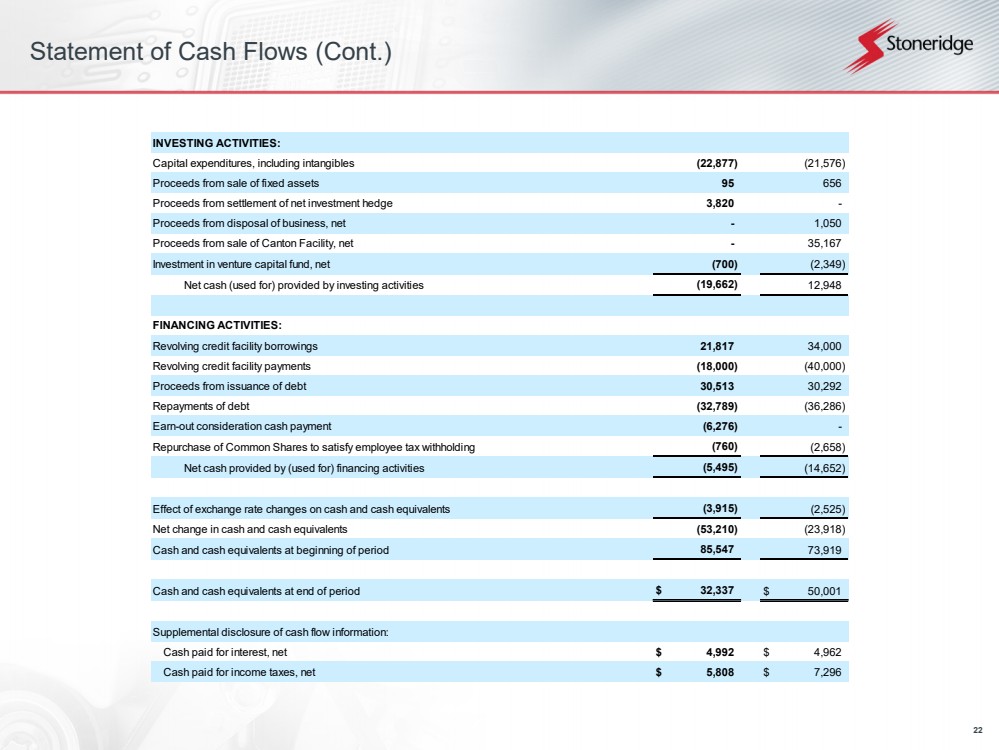
| 22 Statement of Cash Flows (Cont.) INVESTING ACTIVITIES: Capital expenditures, including intangibles(22,877) (21,576) Proceeds from sale of fixed assets95 656 Proceeds from settlement of net investment hedge3,820 - Proceeds from disposal of business, net -1,050 Proceeds from sale of Canton Facility, net -35,167 Investment in venture capital fund, net(700) (2,349) Net cash (used for) provided by investing activities(19,662) 12,948 FINANCING ACTIVITIES: Revolving credit facility borrowings21,817 34,000 Revolving credit facility payments(18,000) (40,000) Proceeds from issuance of debt30,513 30,292 Repayments of debt(32,789) (36,286) Earn-out consideration cash payment(6,276) - Repurchase of Common Shares to satisfy employee tax withholding(760) (2,658) Net cash provided by (used for) financing activities(5,495) (14,652) Effect of exchange rate changes on cash and cash equivalents(3,915) (2,525) Net change in cash and cash equivalents(53,210) (23,918) Cash and cash equivalents at beginning of period85,547 73,919 Cash and cash equivalents at end of period$32,337 $50,001 Supplemental disclosure of cash flow information: Cash paid for interest, net$4,992 $4,962 Cash paid for income taxes, net$5,808 $7,296 |
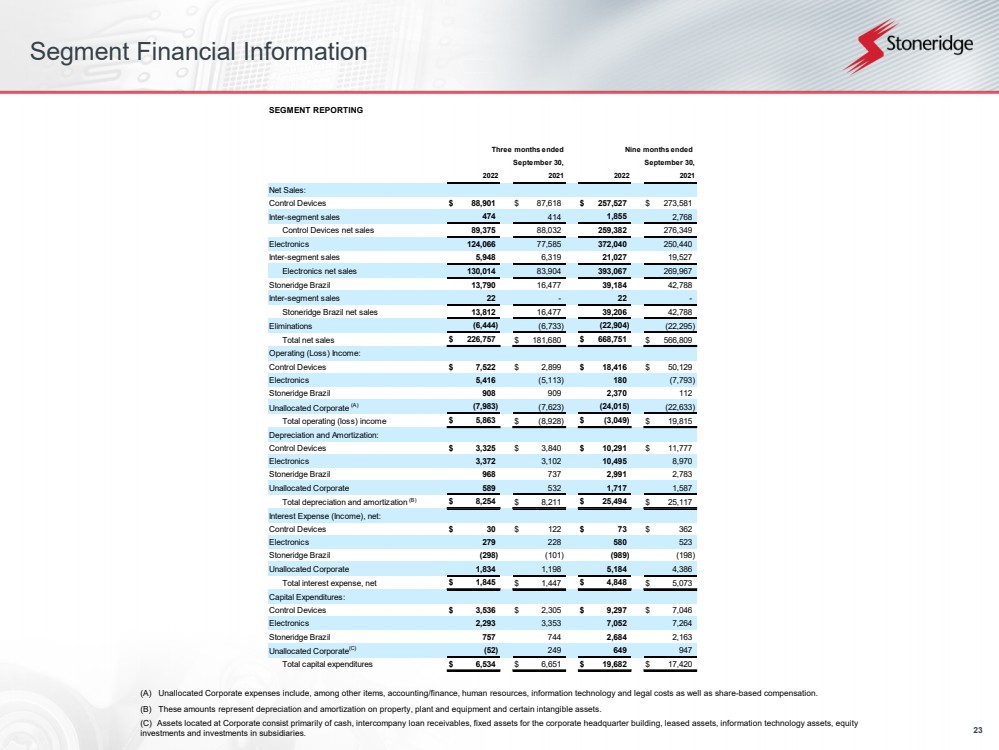
| 23 Segment Financial Information(A)Unallocated Corporate expenses include, among other items, accounting/finance, human resources, information technology and legalcosts as well as share-based compensation.(B)These amounts represent depreciation and amortization on property, plant and equipment and certain intangible assets.(C)Assets located at Corporate consist primarily of cash, intercompany loan receivables, fixed assets for the corporate headquarterbuilding, leased assets, information technology assets, equity investments and investments in subsidiaries. SEGMENT REPORTING Net Sales: Control Devices$88,901 $87,618 $257,527 $273,581 Inter-segment sales474 414 1,855 2,768 Control Devices net sales89,375 88,032 259,382 276,349 Electronics124,066 77,585 372,040 250,440 Inter-segment sales5,948 6,319 21,027 19,527 Electronics net sales130,014 83,904 393,067 269,967 Stoneridge Brazil13,790 16,477 39,184 42,788 Inter-segment sales22 -22 - Stoneridge Brazil net sales13,812 16,477 39,206 42,788 Eliminations(6,444) (6,733) (22,904) (22,295) Total net sales$226,757 $181,680 $668,751 $566,809 Operating (Loss) Income: Control Devices$7,522 $2,899 $18,416 $50,129 Electronics5,416 (5,113) 180 (7,793) Stoneridge Brazil908 909 2,370 112 Unallocated Corporate (A)(7,983) (7,623) (24,015) (22,633) Total operating (loss) income$5,863 $(8,928) $(3,049) $19,815 Depreciation and Amortization: Control Devices$3,325 $3,840 $10,291 $11,777 Electronics3,372 3,102 10,495 8,970 Stoneridge Brazil968 737 2,991 2,783 Unallocated Corporate589 532 1,717 1,587 Total depreciation and amortization (B)$8,254 $8,211 $25,494 $25,117 Interest Expense (Income), net: Control Devices$30 $122 $73 $362 Electronics279 228 580 523 Stoneridge Brazil(298) (101) (989) (198) Unallocated Corporate1,834 1,198 5,184 4,386 Total interest expense, net$1,845 $1,447 $4,848 $5,073 Capital Expenditures: Control Devices$3,536 $2,305 $9,297 $7,046 Electronics2,293 3,353 7,052 7,264 Stoneridge Brazil757 744 2,684 2,163 Unallocated Corporate(C)(52) 249 649 947 Total capital expenditures$6,534 $6,651 $19,682 $17,420 Three months ended Nine months ended September 30, September 30, 2022 2021 2022 2021 |
| 24 Reconciliations to US GAAP |

| 25 Reconciliations to US GAAPThis document contains information about Stoneridge's financial results which is not presented in accordance with accounting principles generally accepted in the United States ("GAAP"). Such non-GAAP financial measures are reconciled to their closest GAAP financial measures in the appendix of this document. The provision of these non-GAAP financial measures is not intended to indicate that Stoneridge is explicitly or implicitly providing projections on those non-GAAP financial measures, and actual results for such measures are likely to vary from those presented. The reconciliations include all information reasonably available to the Company at the date of this document and the adjustments that management can reasonably predict. |
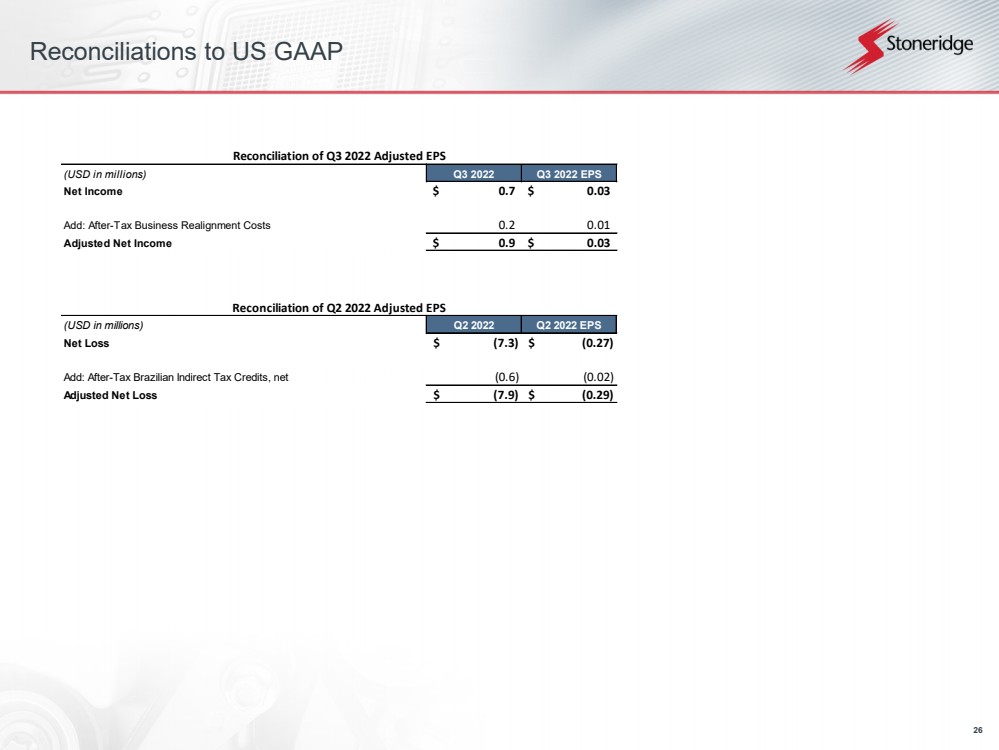
| 26 Reconciliations to US GAAP (USD in millions)Q3 2022Q3 2022 EPSNet Income0.7$ 0.03$ Add: After-Tax Business Realignment Costs0.2 0.01 Adjusted Net Income0.9$ 0.03$ Reconciliation of Q3 2022 Adjusted EPS (USD in millions)Q2 2022Q2 2022 EPSNet Loss(7.3)$ (0.27)$ Add: After-Tax Brazilian Indirect Tax Credits, net(0.6) (0.02) Adjusted Net Loss(7.9)$ (0.29)$ Reconciliation of Q2 2022 Adjusted EPS |
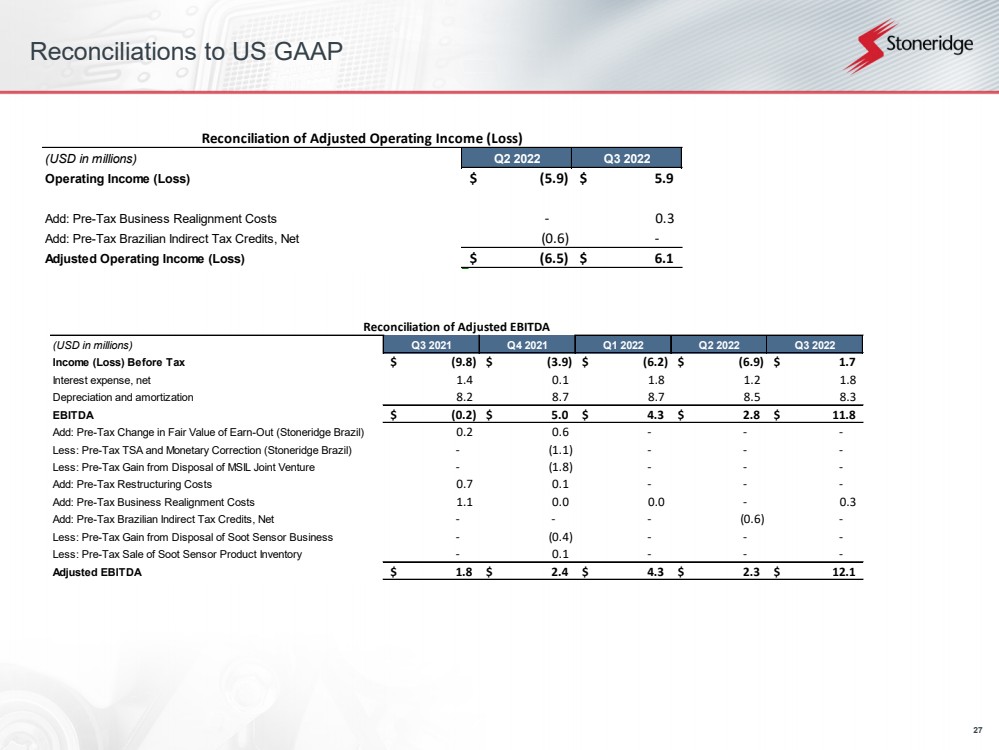
| 27 Reconciliations to US GAAP Reconciliation of Adjusted Operating Income (Loss)(USD in millions)Q2 2022Q3 2022Operating Income (Loss)(5.9)$ 5.9$ Add: Pre-Tax Business Realignment Costs- 0.3 Add: Pre-Tax Brazilian Indirect Tax Credits, Net(0.6) - Adjusted Operating Income (Loss)(6.5)$ 6.1$ Reconciliation of Adjusted EBITDA(USD in millions)Q3 2021Q4 2021Q1 2022Q2 2022Q3 2022Income (Loss) Before Tax(9.8)$ (3.9)$ (6.2)$ (6.9)$ 1.7$ Interest expense, net1.4 0.1 1.8 1.2 1.8 Depreciation and amortization8.2 8.7 8.7 8.5 8.3 EBITDA(0.2)$ 5.0$ 4.3$ 2.8$ 11.8$ Add: Pre-Tax Change in Fair Value of Earn-Out (Stoneridge Brazil)0.2 0.6 - - - Less: Pre-Tax TSA and Monetary Correction (Stoneridge Brazil)- (1.1) - - - Less: Pre-Tax Gain from Disposal of MSIL Joint Venture- (1.8) - - - Add: Pre-Tax Restructuring Costs0.7 0.1 - - - Add: Pre-Tax Business Realignment Costs1.1 0.0 0.0- 0.3 Add: Pre-Tax Brazilian Indirect Tax Credits, Net- - - (0.6) - Less: Pre-Tax Gain from Disposal of Soot Sensor Business- (0.4) - - - Less: Pre-Tax Sale of Soot Sensor Product Inventory- 0.1 - - - Adjusted EBITDA1.8$ 2.4$ 4.3$ 2.3$ 12.1$ |
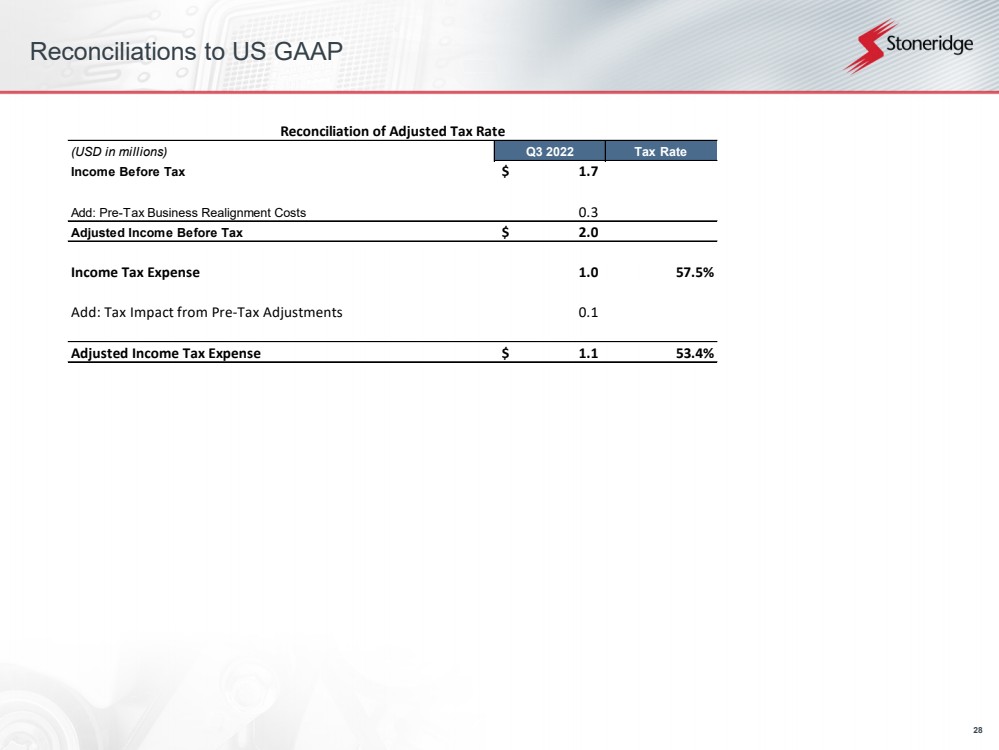
| 28 Reconciliations to US GAAP (USD in millions)Q3 2022Tax RateIncome Before Tax1.7$ Add: Pre-Tax Business Realignment Costs0.3 Adjusted Income Before Tax2.0$ Income Tax Expense1.057.5%Add: Tax Impact from Pre-Tax Adjustments0.1Adjusted Income Tax Expense1.1$ 53.4% Reconciliation of Adjusted Tax Rate |
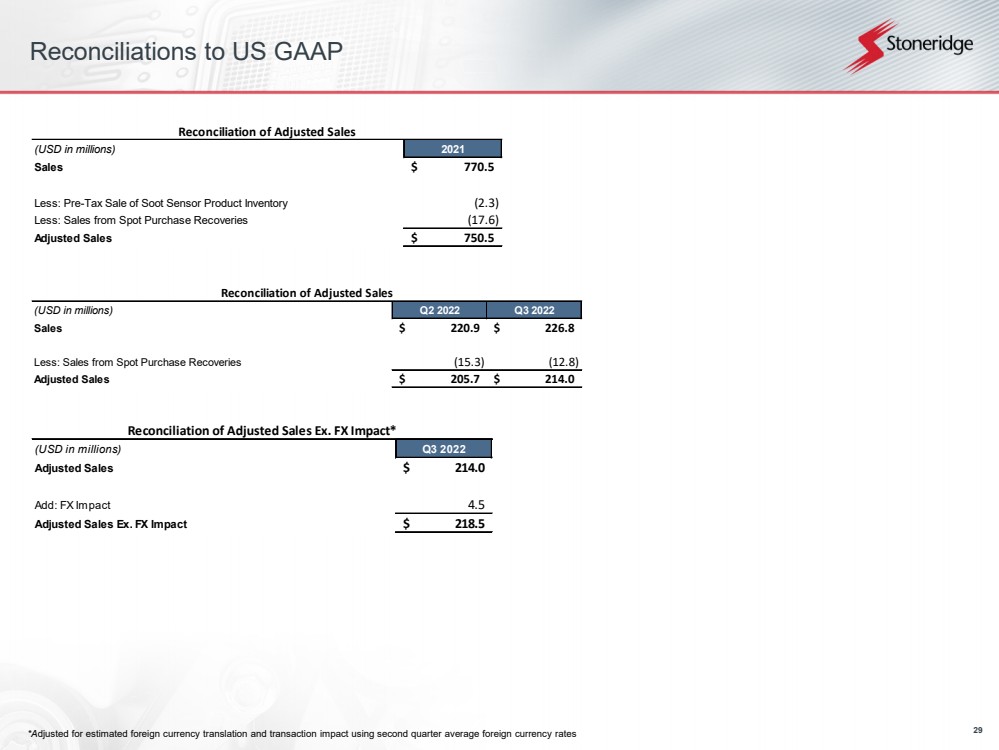
| 29 Reconciliations to US GAAP*Adjusted for estimated foreign currency translation and transaction impact using secondquarter average foreign currency rates Reconciliation of Adjusted Sales Ex. FX Impact*(USD in millions)Q3 2022Adjusted Sales214.0$ Add: FX Impact 4.5 Adjusted Sales Ex. FX Impact218.5$ Reconciliation of Adjusted Sales(USD in millions)2021Sales770.5$ Less: Pre-Tax Sale of Soot Sensor Product Inventory(2.3) Less: Sales from Spot Purchase Recoveries(17.6) Adjusted Sales750.5$ Reconciliation of Adjusted Sales(USD in millions)Q2 2022Q3 2022Sales220.9$ 226.8$ Less: Sales from Spot Purchase Recoveries(15.3) (12.8) Adjusted Sales205.7$ 214.0$ |
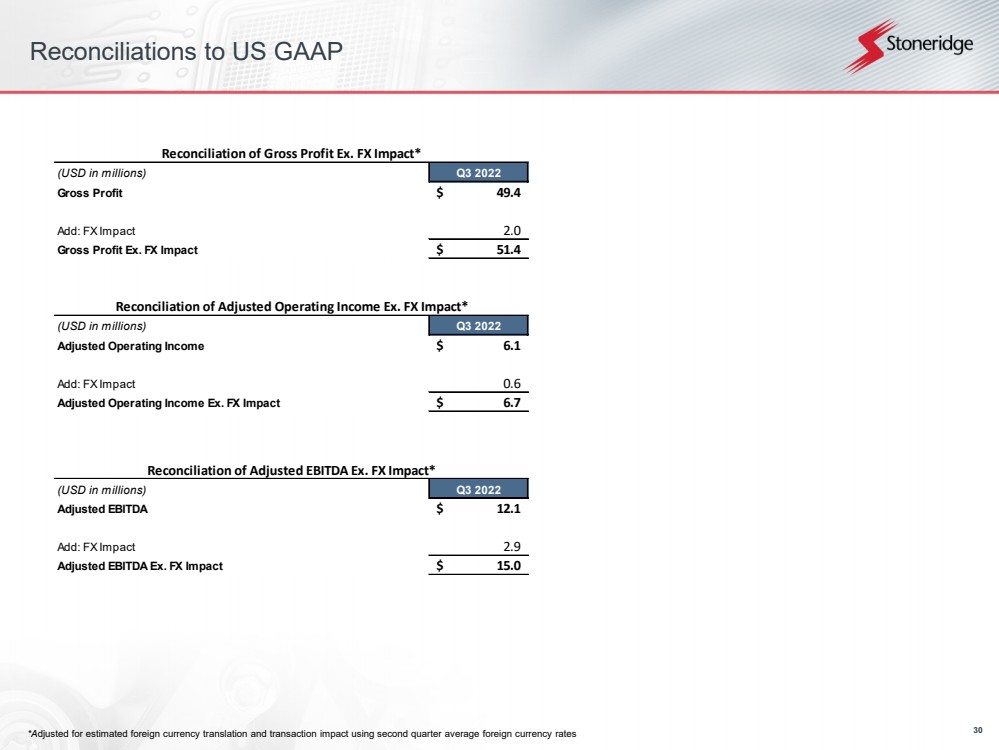
| 30 Reconciliations to US GAAP*Adjusted for estimated foreign currency translation and transaction impact using second quarter average foreign currency rates Reconciliation of Gross Profit Ex. FX Impact*(USD in millions)Q3 2022Gross Profit49.4$ Add: FX Impact2.0 Gross Profit Ex. FX Impact51.4$ Reconciliation of Adjusted Operating Income Ex. FX Impact*(USD in millions)Q3 2022Adjusted Operating Income6.1$ Add: FX Impact 0.6 Adjusted Operating Income Ex. FX Impact6.7$ Reconciliation of Adjusted EBITDA Ex. FX Impact*(USD in millions)Q3 2022Adjusted EBITDA12.1$ Add: FX Impact 2.9 Adjusted EBITDA Ex. FX Impact15.0$ |
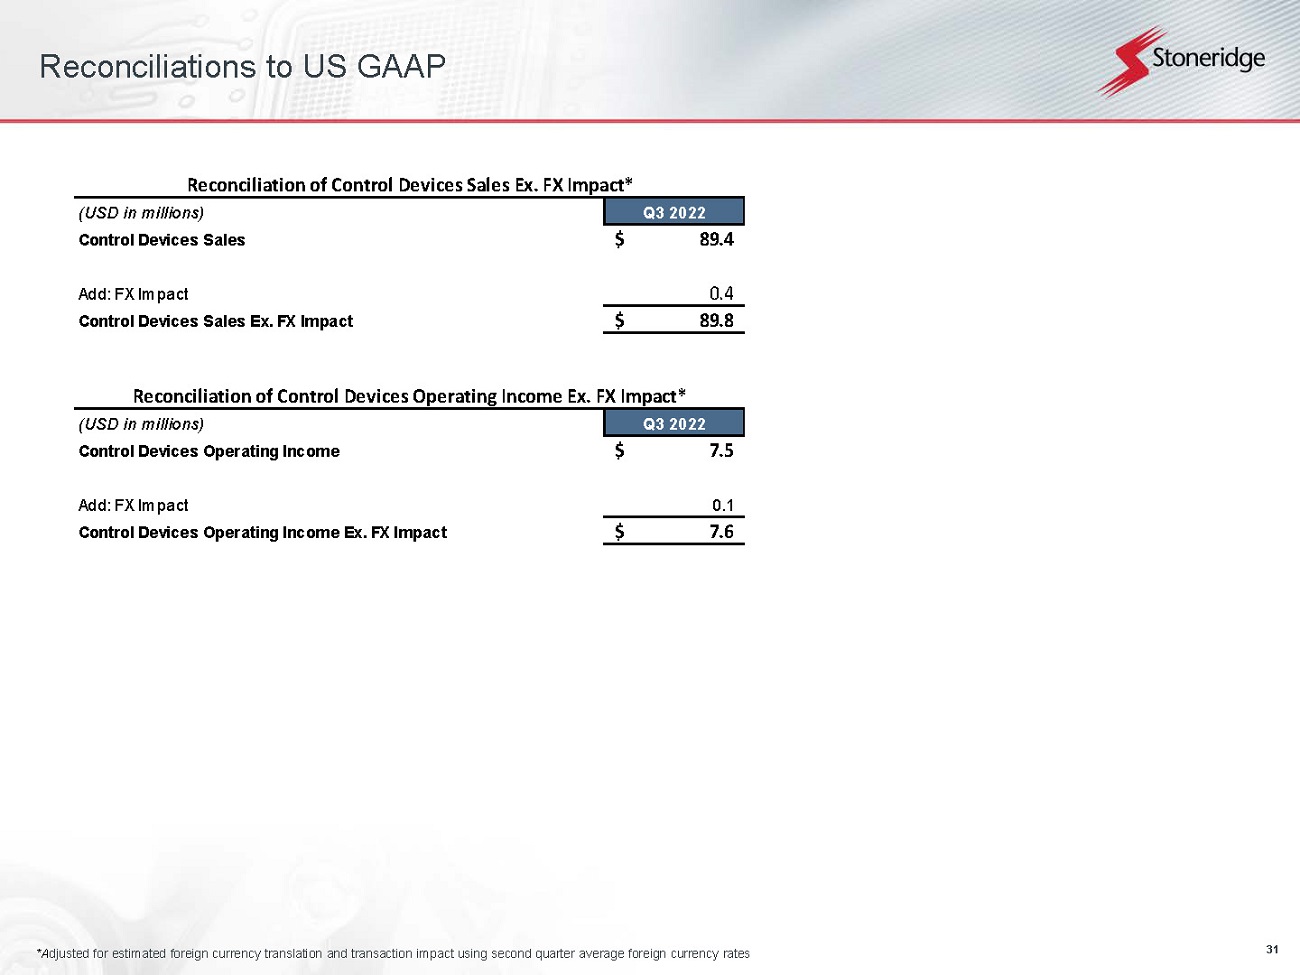
| 31 Reconciliations to US GAAP*Adjusted for estimated foreign currency translation and transaction impact using second quarter average foreign currency rates Reconciliation of Control Devices Sales Ex. FX Impact*(USD in millions)Q3 2022Control Devices Sales89.4$ Add: FX Impact 0.4 Control Devices Sales Ex. FX Impact89.8$ Reconciliation of Control Devices Operating Income Ex. FX Impact*(USD in millions)Q3 2022Control Devices Adjusted Operating Income7.5$ Add: FX Impact 0.1Control Devices Operating Income Ex. FX Impact7.6$ |
| 32 Reconciliations to US GAAP*Adjusted for estimated foreign currency translation and transaction impact using second quarter average foreign currency rates Reconciliation of Electronics Adjusted Sales Ex. FX Impact*(USD in millions)Q3 2022Electronics Adjusted Sales117.2$ Add: FX Impact 3.3 Electronics Adjusted Sales Ex. FX Impact120.5$ Reconciliation of Electronics Operating Income Ex. FX Impact*(USD in millions)Q3 2022Electronics Operating Income 5.4$ Add: FX Impact 0.2 Electronics Operating Income Ex. FX Impact5.6$ Reconciliation of Electronics Adjusted Sales(USD in millions)Q2 2022Q3 2022Electronics Sales130.4$ 130.0$ Less: Sales from Spot Purchase Recoveries(15.3) (12.8) Electronics Adjusted Sales115.1$ 117.2$ |

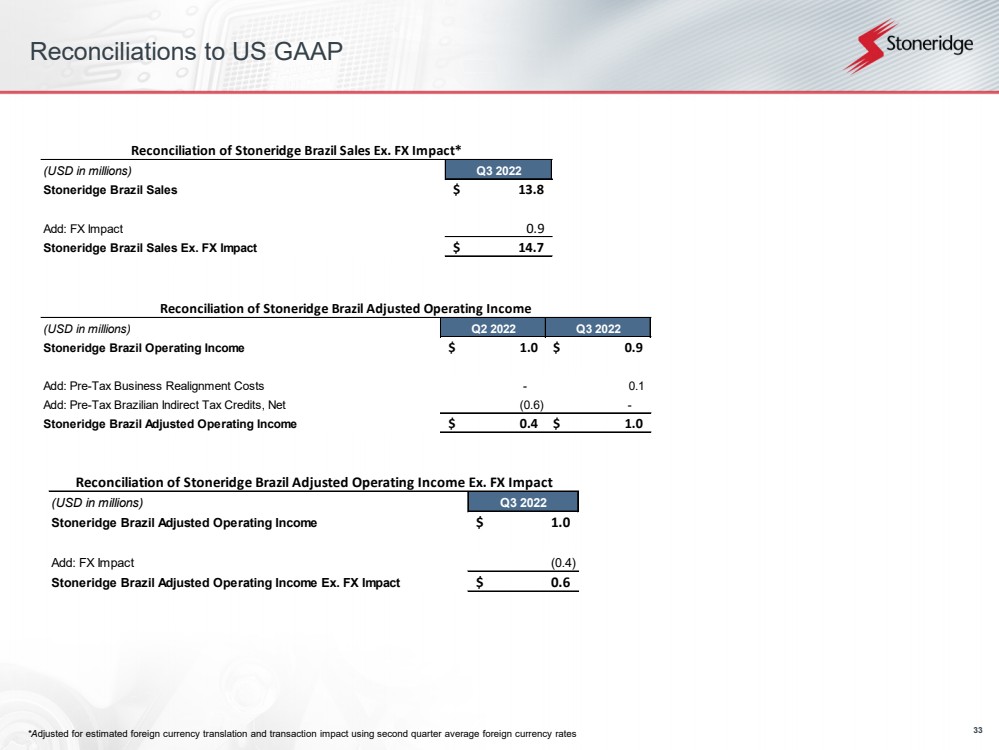
| 33 Reconciliations to US GAAP*Adjusted for estimated foreign currency translation and transaction impact using second quarter average foreign currency rates Reconciliation of Stoneridge Brazil Sales Ex. FX Impact*(USD in millions)Q3 2022Stoneridge Brazil Sales13.8$ Add: FX Impact 0.9 Stoneridge Brazil Sales Ex. FX Impact14.7$ Reconciliation of Stoneridge Brazil Adjusted Operating Income(USD in millions)Q2 2022Q3 2022Stoneridge Brazil Operating Income1.0$ 0.9$ Add: Pre-Tax Business Realignment Costs- 0.1 Add: Pre-Tax Brazilian Indirect Tax Credits, Net(0.6) - Stoneridge Brazil Adjusted Operating Income0.4$ 1.0$ Reconciliation of Stoneridge Brazil Adjusted Operating Income Ex. FX Impact(USD in millions)Q3 2022Stoneridge Brazil Adjusted Operating Income1.0$ Add: FX Impact(0.4) Stoneridge Brazil Adjusted Operating Income Ex. FX Impact0.6$ |