
1 Stoneridge, Inc . Earnings Release Presentation August 9, 2012 Exhibit 99.2
Statements in this presentation that are not historical facts (including, but not limited to, 2012 net sales guidance) are forward - looking statements, which involve risks and uncertainties that could cause actual events or results to differ materially from those expressed or implied by the statements. Important factors that may cause actual results to differ materially from those in the forward - looking statements include, among other factors, the loss or bankruptcy of a major customer; the costs and timing of facility closures, business realignment or similar actions; a significant change in medium - and heavy - duty truck, automotive or agricultural and off - highway vehicle production; our ability to achieve cost reductions that offset or exceed customer - mandated selling price reductions; a significant change in general economic conditions in any of the various countries in which Stoneridge operates; labor disruptions at Stoneridge’s facilities or at any of Stoneridge’s significant customers or suppliers; the ability of suppliers to supply Stoneridge with parts and components at competitive prices on a timely basis; the amount of Stoneridge’s indebtedness and the restrictive covenants contained in the agreements governing its indebtedness, including its asset - based credit facility and senior secured notes; customer acceptance of new products; capital availability or costs, including changes in interest rates or market perceptions; the failure to achieve successful integration of any acquired company or business; the occurrence or non - occurrence of circumstances beyond Stoneridge’s control; and the items described in “Risk Factors” and other uncertainties or risks discussed in Stoneridge’s periodic and current reports filed with the Securities and Exchange Commission. Important factors that could cause the performance of the commercial vehicle and automotive industry to differ materially from those in the forward - looking statements include factors such as (1) continued economic instability or poor economic conditions in the United States and global markets, (2) changes in economic conditions, housing prices, foreign currency exchange rates, commodity prices, including shortages of and increases or volatility in the price of oil, (3) changes in laws and regulations, (4) the state of the credit markets, (5) political stability, (6) international conflicts and (7) the occurrence of force majeure events. Forward Looking Statements

Forward Looking Statements ( con’t ) These factors should not be construed as exhaustive and should be considered with the other cautionary statements in Stoneridge’s filings with the Securities and Exchange Commission. Forward - looking statements are not guarantees of future performance; Stoneridge’s actual results of operations, financial condition and liquidity, and the development of the industry in which Stoneridge operates may differ materially from those described in or suggested by the forward - looking statements contained in this presentation. In addition, even if Stoneridge’s results of operations, financial condition and liquidity, and the development of the industry in which Stoneridge operates are consistent with the forward - looking statements contained in this presentation, those results or developments may not be indicative of results or developments in subsequent periods. This presentation contains time - sensitive information that reflects management’s best analysis only as of the date of this presentation. Any forward - looking statements in this presentation speak only as of the date of this presentation, and Stoneridge undertakes no obligation to update such statements. Comparisons of results for current and any prior periods are not intended to express any future trends or indications of future performance, unless expressed as such, and should only be viewed as historical data. Stoneridge does not undertake any obligation to publicly update or revise any forward - looking statement as a result of new information, future events or otherwise, except as otherwise required by law.
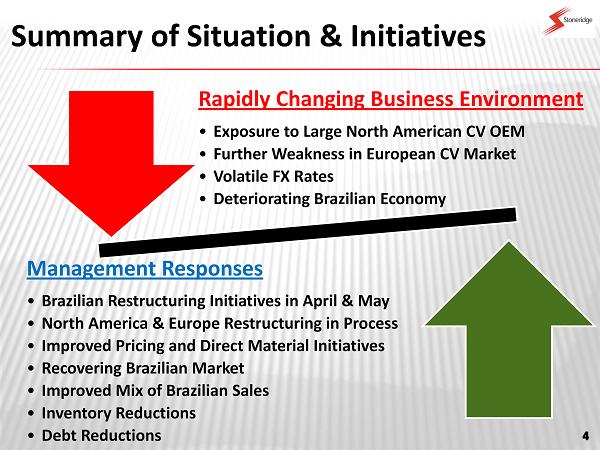
Summary of Situation & Initiatives Rapidly Changing Business Environment • Exposure to Large North American CV OEM • Further Weakness in European CV Market • Volatile FX Rates • Deteriorating Brazilian Economy Management Responses • Brazilian Restructuring Initiatives in April & May • North America & Europe Restructuring in Process • Improved Pricing and Direct Material Initiatives • Recovering Brazilian Market • Improved Mix of Brazilian Sales • Inventory Reductions • Debt Reductions

Sales, Gross Profit, & Op Income – 2Q12 vs 2Q11 38.5 24.8 13.7 18.6 (5.0) 195.8 155.8 40.0 33.4 6.6 (60)% (40)% (20)% 0% 20% 40% 60% 80% 100% Sales COGS Gross Profit SGA Op Income PST Core 2Q11 2Q12 SRI Variance millions SRI Core PST Ops PST PPA SRI $ % Sales 190.4 195.8 38.5 0.0 234.3 43.8 23.0% COGS 152.7 155.8 23.1 1.7 180.6 27.9 18.3% Gross Profit 37.7 40.0 15.4 (1.7) 53.7 15.9 42.3% GP % to Sales 19.8% 20.4% 40.0% 22.9% SGA 30.3 33.4 17.5 1.1 52.0 21.7 71.7% SGA % to Sales 15.9% 17.1% 45.6% 22.2% Op Income 7.4 6.6 (2.2) (2.8) 1.6 (5.8) (78.2%) OI % to Sales 3.9% 3.4% (5.6%) 0.7%
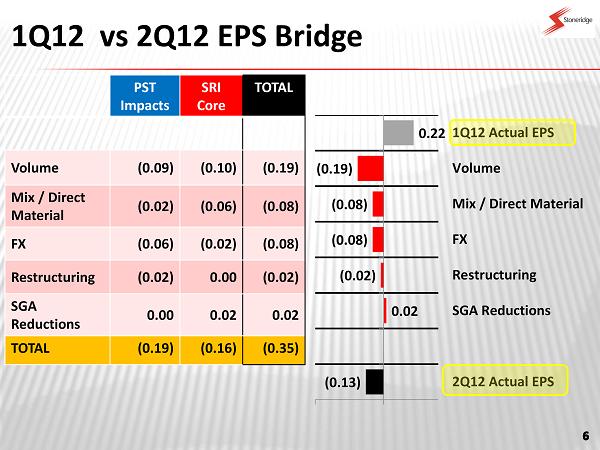
1Q12 vs 2Q12 EPS Bridge PST Impacts SRI Core TOTAL Volume (0.09) (0.10) (0.19) Mix / Direct Material (0.02) (0.06) (0.08) FX (0.06) (0.02) (0.08) Restructuring (0.02) 0.00 (0.02) SGA Reductions 0.00 0.02 0.02 TOTAL (0.19) (0.16) (0.35) (0.13) 0.02 (0.02) (0.08) (0.08) (0.19) 0.22 2Q12 Actual EPS SGA Reductions Restructuring FX Mix / Direct Material Volume 1Q12 Actual EPS
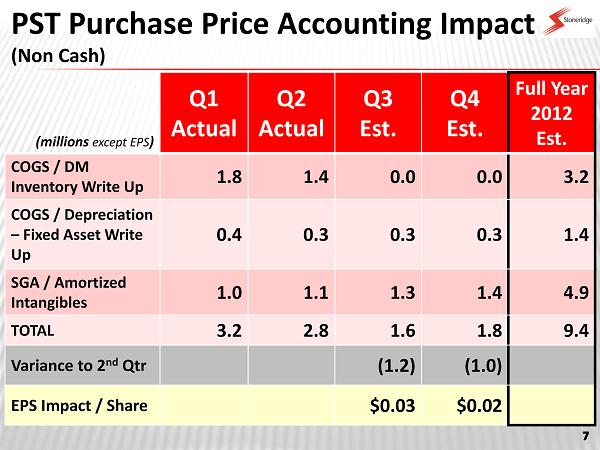
PST Purchase Price Accounting Impact (Non Cash) (millions except EPS ) Q1 Actual Q2 Actual Q3 Est. Q4 Est. Full Year 2012 Est. COGS / DM Inventory Write Up 1.8 1.4 0.0 0.0 3.2 COGS / Depreciation – Fixed Asset Write Up 0.4 0.3 0.3 0.3 1.4 SGA / Amortized Intangibles 1.0 1.1 1.3 1.4 4.9 TOTAL 3.2 2.8 1.6 1.8 9.4 Variance to 2 nd Qtr (1.2) (1.0) EPS Impact / Share $0.03 $0.02

SRI / PST / Purchase Accounting Impact millions First Quarter 2012 Second Quarter 2012 1H12 SRI Core PST PST PPA TOTAL SRI Core PST PST PPA TOTAL SRI Core PST PST PPA TOTAL Sales 208.6 53.7 0.0 262.3 195.7 38.5 0.0 234.2 404.3 92.2 0.0 496.5 Gross Margin 44.5 22.8 (2.2) 65.1 40.0 15.4 (1.7) 53.7 84.5 38.2 (3.9) 118.8 Gross Margin % 21.3% 42.5% 24.8% 20.4% 40.0% 22.9% 20.9% 41.5% 23.9% Op Income 11.5 3.6 (3.2) 11.9 6.6 (2.2) (2.8) 1.6 18.1 1.4 (6.0) 13.5 Op Income % 5.5% 6.6% 4.5% 3.4% (5.3)% 0.7% 4.5% 1.7% 2.7%
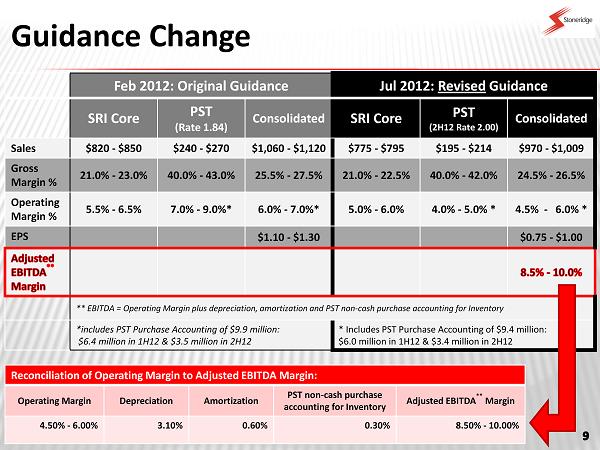
Guidance Change Feb 2012: Original Guidance Jul 2012: Revised Guidance SRI Core PST (Rate 1.84) Consolidated SRI Core PST (2H12 Rate 2.00) Consolidated Sales $820 - $850 $240 - $270 $1,060 - $1,120 $775 - $795 $195 - $214 $970 - $1,009 Gross Margin % 21.0% - 23.0% 40.0% - 43.0% 25.5% - 27.5% 21.0% - 22.5% 40.0% - 42.0% 24.5% - 26.5% Operating Margin % 5.5% - 6.5% 7.0% - 9.0%* 6.0% - 7.0%* 5.0% - 6.0% 4.0% - 5.0% * 4.5% - 6.0% * EPS $1.10 - $1.30 $0.75 - $1.00 ** EBITDA = Operating Margin plus depreciation, amortization and PST non - cash purchase accounting for Inventory *includes PST Purchase Accounting of $9.9 million: $6.4 million in 1H12 & $3.5 million in 2H12 * Includes PST Purchase Accounting of $9.4 million: $6.0 million in 1H12 & $3.4 million in 2H12 Reconciliation of Operating Margin to Adjusted EBITDA Margin: Operating Margin Depreciation Amortization PST non - cash purchase accounting for Inventory Adjusted EBITDA ** Margin 4.50% - 6.00% 3.10% 0.60% 0.30% 8.50% - 10.00%
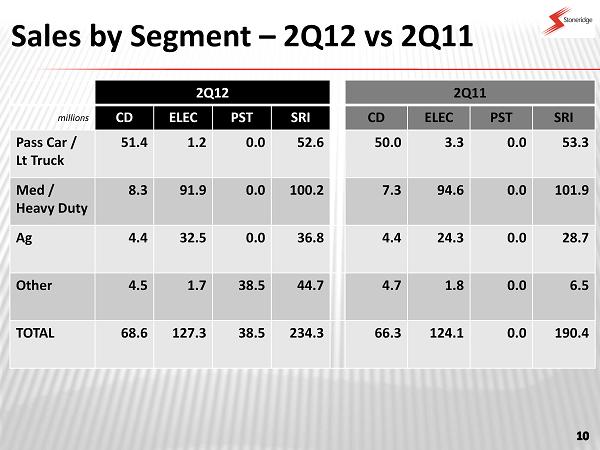
Sales by Segment – 2Q12 vs 2Q11 2Q12 2Q11 millions CD ELEC PST SRI CD ELEC PST SRI Pass Car / Lt Truck 51.4 1.2 0.0 52.6 50.0 3.3 0.0 53.3 Med / Heavy Duty 8.3 91.9 0.0 100.2 7.3 94.6 0.0 101.9 Ag 4.4 32.5 0.0 36.8 4.4 24.3 0.0 28.7 Other 4.5 1.7 38.5 44.7 4.7 1.8 0.0 6.5 TOTAL 68.6 127.3 38.5 234.3 66.3 124.1 0.0 190.4
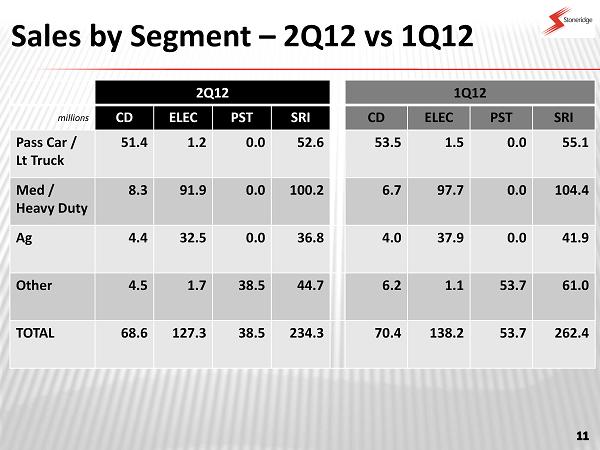
Sales by Segment – 2Q12 vs 1Q12 2Q12 1Q12 millions CD ELEC PST SRI CD ELEC PST SRI Pass Car / Lt Truck 51.4 1.2 0.0 52.6 53.5 1.5 0.0 55.1 Med / Heavy Duty 8.3 91.9 0.0 100.2 6.7 97.7 0.0 104.4 Ag 4.4 32.5 0.0 36.8 4.0 37.9 0.0 41.9 Other 4.5 1.7 38.5 44.7 6.2 1.1 53.7 61.0 TOTAL 68.6 127.3 38.5 234.3 70.4 138.2 53.7 262.4

Restructuring Costs / Benefits millions 1Q12 2Q12 3Q12 4Q12 FY 2012 NA Wiring Cost 0.0 0.0 (0.7) 0.0 (0.7) Benefit 0.0 0.0 0.7 1.1 1.8 NA / European Instrumentation Cost 0.0 0.0 (0.3) 0.0 (0.3) Benefit 0.0 0.0 0.0 0.4 0.4 PST Cost (0.3) (1.3) 0.0 0.0 (1.6) Benefit 0.0 0.0 2.2 2.2 4.4 TOTAL Cost (0.3) (1.3) (1.0) 0.0 (2.6) Benefit 0.0 0.0 2.9 3.7 6.6 Total Cost Benefit (0.3) (1.3) 1.9 3.7 4.0
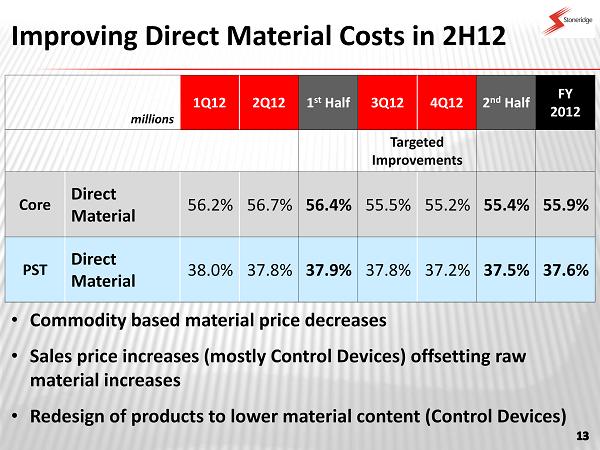
Improving Direct Material Costs in 2H12 millions 1Q12 2Q12 1 st Half 3Q12 4Q12 2 nd Half FY 2012 Targeted Improvements Core Direct Material 56.2% 56.7% 56.4% 55.5% 55.2% 55.4% 55.9% PST Direct Material 38.0% 37.8% 37.9% 37.8% 37.2% 37.5% 37.6% • Commodity based material price decreases • Sales price increases (mostly Control Devices) offsetting raw material increases • Redesign of products to lower material content (Control Devices)
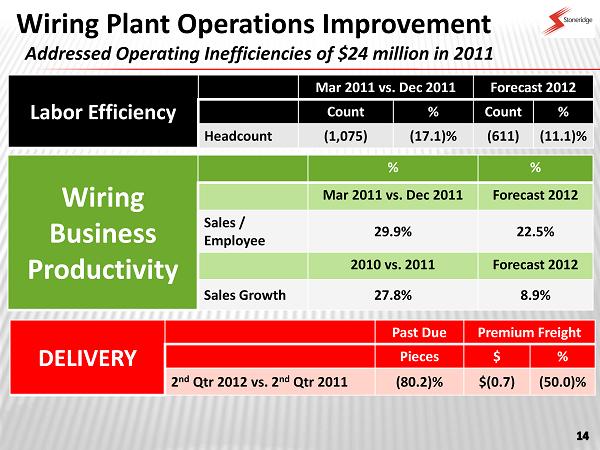
Wiring Plant Operations Improvement Addressed Operating Inefficiencies of $24 million in 2011 DELIVERY Past Due Premium Freight Pieces $ % 2 nd Qtr 2012 vs. 2 nd Qtr 2011 (80.2)% $(0.7) (50.0)% Labor Efficiency Mar 2011 vs. Dec 2011 Forecast 2012 Count % Count % Headcount (1,075) (17.1)% (611) (11.1)% Wiring Business Productivity % % Mar 2011 vs. Dec 2011 Forecast 2012 Sales / Employee 29.9% 22.5% 2010 vs. 2011 Forecast 2012 Sales Growth 27.8% 8.9%

13,126 14,938 2011 2012 Thousands North American Light Vehicle Production Source: IHS July 2012 3,381 3,124 3,182 3,439 3,973 3,971 3,437 3,556 (7.6)% 1.9% 8.1% 15.5% (0.1)% (13.4)% 3.5% Q1 2011 Q2 2011 Q3 2011 Q4 2011 Q1 2012 Q2 2012 Q3 2012 Q4 2012 Thousands Auto Qtr vs Qtr % ∆ ↑ 13.8% Guidance derived from customers EDI demand and adjusted for known production estimate changes
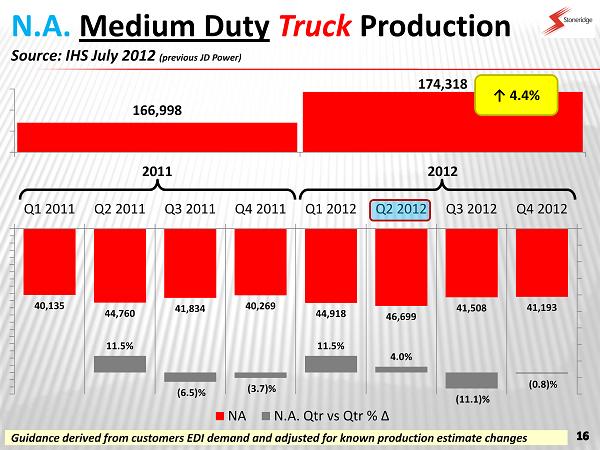
166,998 174,318 2011 2012 N.A. Medium Duty Truck Production Source: IHS July 2012 (previous JD Power) 40,135 44,760 41,834 40,269 44,918 46,699 41,508 41,193 11.5% (6.5)% (3.7)% 11.5% 4.0% (11.1)% (0.8)% Q1 2011 Q2 2011 Q3 2011 Q4 2011 Q1 2012 Q2 2012 Q3 2012 Q4 2012 NA N.A. Qtr vs Qtr % ∆ ↑ 4.4% Guidance derived from customers EDI demand and adjusted for known production estimate changes

255,488 299,347 2011 2012 N.A. Heavy Duty Truck Production Source: IHS July 2012 (previous JD Power) 51,501 60,569 68,482 74,936 76,012 75,511 74,013 73,811 17.6% 13.1% 9.4% 1.4% (0.7)% (2.0)% (0.3)% Q1 2011 Q2 2011 Q3 2011 Q4 2011 Q1 2012 Q2 2012 Q3 2012 Q4 2012 NA N.A. Qtr vs Qtr % ∆ ↑ 17.2% Guidance derived from customers EDI demand and adjusted for known production estimate changes
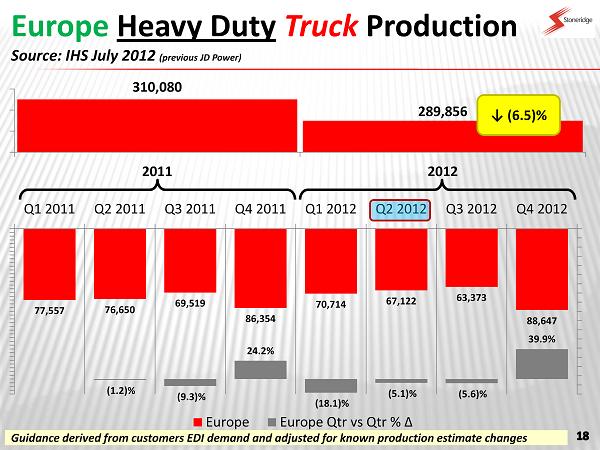
310,080 289,856 2011 2012 Europe Heavy Duty Truck Production Source: IHS July 2012 (previous JD Power) 77,557 76,650 69,519 86,354 70,714 67,122 63,373 88,647 (1.2)% (9.3)% 24.2% (18.1)% (5.1)% (5.6)% 39.9% Q1 2011 Q2 2011 Q3 2011 Q4 2011 Q1 2012 Q2 2012 Q3 2012 Q4 2012 Europe Europe Qtr vs Qtr % ∆ ↓ (6.5)% Guidance derived from customers EDI demand and adjusted for known production estimate changes
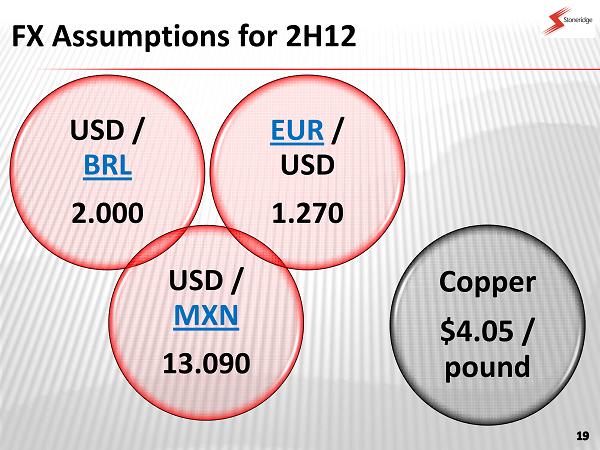
FX Assumptions for 2H12 USD / BRL 2.000 USD / MXN 13.090 EUR / USD 1.270 Copper $4.05 / pound
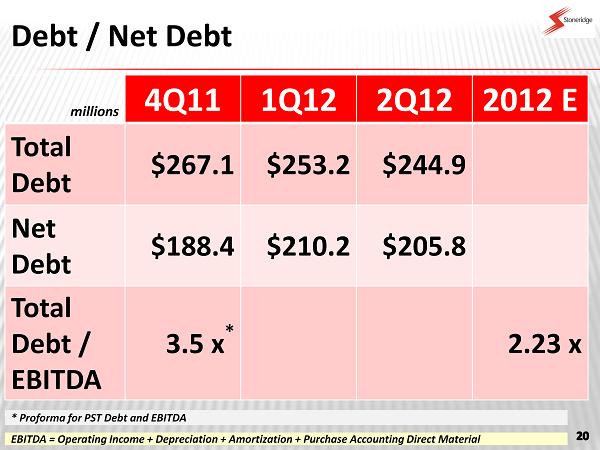
Debt / Net Debt millions 4Q11 1Q12 2Q12 2012 E Total Debt $267.1 $253.2 $244.9 Net Debt $188.4 $210.2 $205.8 Total Debt / EBITDA 3.5 x * 2.23 x EBITDA = Operating Income + Depreciation + Amortization + Purchase Accounting Direct Material * Proforma for PST Debt and EBITDA