
HIGHER LEVEL PERFORMANCE Third - Quarter 2016 Results October 27, 2016 Exhibit 99.2

2 Forward - Looking Statements Statements in this presentation that are not historical facts are forward - looking statements, which involve risks and uncertaint ies that could cause actual events or results to differ materially from those expressed or implied by the statements. Important factors that ma y cause actual results to differ materially from those in the forward - looking statements include, among other factors, the loss or bankruptcy o f a major customer; the costs and timing of facility closures, business realignment or similar actions; a significant change in medium - an d heavy - duty truck, automotive or agricultural and off - highway vehicle production; our ability to achieve cost reductions that offset or exce ed customer - mandated selling price reductions; a significant change in general economic conditions in any of the various countries in whi ch Stoneridge operates; labor disruptions at Stoneridge’s facilities or at any of Stoneridge’s significant customers or suppliers; the ability of suppliers to supply Stoneridge with parts and components at competitive prices on a timely basis; the amount of Stoneridge’s indebtedness and the restrictive covenants contained in the agreements governing its indebtedness, including its asset - based credit facility and seni or secured notes; customer acceptance of new products; capital availability or costs, including changes in interest rates or market perc ept ions; the failure to achieve successful integration of any acquired company or business; the occurrence or non - occurrence of circumstances beyond Stoneridge’s control; and the items described in “Risk Factors” and other uncertainties or risks discussed in Stoneridge’s periodic and current reports filed with the Securities and Exchange Commission. Important factors that could cause the performance of the commercial vehicle and automotive industry to differ materially fro m t hose in the forward - looking statements include factors such as (1) continued economic instability or poor economic conditions in the United States and global markets, (2) changes in economic conditions, housing prices, foreign currency exchange rates, commodity prices, includ ing shortages of and increases or volatility in the price of oil, (3) changes in laws and regulations, (4) the state of the credi t m arkets, (5) political stability, (6) international conflicts and (7) the occurrence of force majeure events. These factors should not be construed as exhaustive and should be considered with the other cautionary statements in Stoneridge’s filings with the Securities and Exchange Commission. Forward - looking statements are not guarantees of future performance; Stoneridge’s actual results of operations, financial condition and liquidity, and the development of the industry in which Stoneridge operates may differ materially from those described in or suggested by the forward - looking statements contained in this presentation. In addition, even if Stoneridge’s results of operations, financial condition and liquidity, and the development of the industry in which Stoneridge operates are consistent with the forward - looking statements contained in this presentation, those results or developments may not be indicative of results or developments in subsequent periods. This presentation contains time - sensitive information that reflects management’s best analysis only as of the date of this prese ntation. Any forward - looking statements in this presentation speak only as of the date of this presentation, and Stoneridge undertakes no obligation to update such statements. Comparisons of results for current and any prior periods are not intended to express any future tren ds or indications of future performance, unless expressed as such, and should only be viewed as historical data. Stoneridge does not undertake any obligation to publicly update or revise any forward - looking statement as a result of new information, future events or otherwise, except as otherwise required by law. Rounding Disclosure : There may be slight immaterial differences between figures represented in our public filings compared to what is shown in this presentation. The differences are the a result of rounding due to the representation of values in millions rat her than thousands in public filings. The information in this document belongs to Stoneridge , Inc. or its subsidiaries and may be confidential. This document and information in it may not be copied, reproduced, revealed or appropriated, either in whole or in part, with out the prior written consent of Stoneridge , Inc.

3 • Sales of $174 million and $523 million, respectively • Net Income of $10 million and $29 million • Diluted Earnings per share from continuing operations (“EPS”) of $0.36 and $1.03 • Strong balance sheet – Cash of $51 million; debt of $105 million – Debt / Adjusted EBITDA from continuing Ops of 1.6X Reaffirmed All Items Except Sales Sales Updated $690 - $700M Gross Margin 26.0% - 28.5% Operating Margin 6.0% - 7.3% Earnings per Share $1.25 - $1.40 EBITDA 9.5% - 11.3% Delivered Strong Q3 and YTD Results FY 2016 Guidance Third - Quarter 2016 Earnings
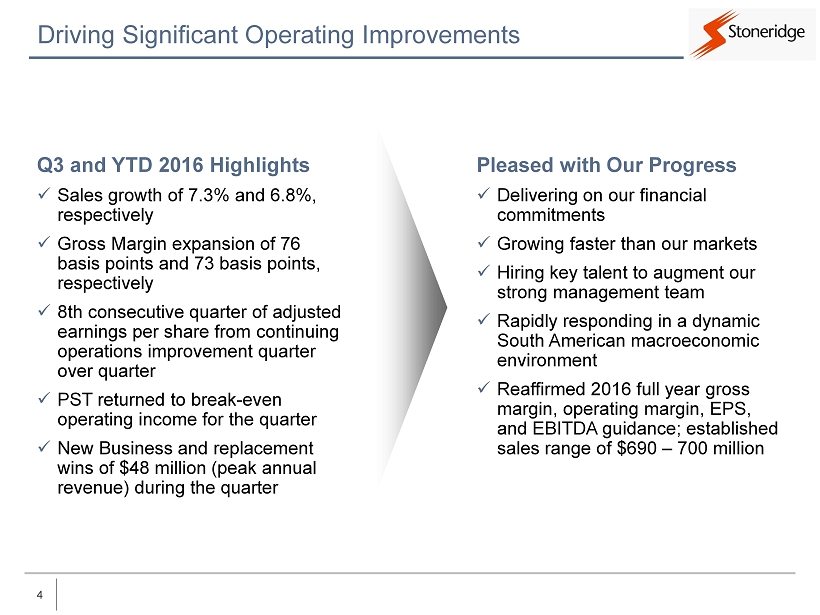
4 Driving Significant Operating Improvements Pleased with Our Progress x Delivering on our financial commitments x Growing faster than our markets x Hiring key talent to augment our strong management team x Rapidly responding in a dynamic South American macroeconomic environment x Reaffirmed 2016 full year gross margin, operating margin, EPS, and EBITDA guidance; established sales range of $ 690 – 700 million Q3 and YTD 2016 Highlights x Sales growth of 7.3% and 6.8 %, respectively x Gross Margin expansion of 76 basis points and 73 basis points, respectively x 8th consecutive quarter of adjusted earnings per share from continuing operations improvement quarter over quarter x PST returned to break - even operating income for the quarter x New Business and replacement wins of $48 million (peak annual revenue) during the quarter

5 Q3 and YTD 2016 Key Financial Metrics Q3 2016 YTD 2016 (Dollars in Millions) Sales $0.27 $0.36 Q3 2015 Q3 2016 Operating Income and % Margin Earnings per Share $162 $174 Q3 2015 Q3 2016 $8.9 $11.8 5.5% 6.8% Q3 2015 Q3 2016 Sales $0.61 $1.03 YTD 2015 YTD 2016 Operating Income and % Margin Earnings per Share $490 $523 YTD 2015 YTD 2016 $19.5 $33.9 4.0% 6.5% YTD 2015 YTD 2016

6 Management Team Quickly Responded and PST Returned to Positive Operating Results During the Quarter Situation Overview • PST was facing tremendous difficulties in 2015 and early 2016 – Dramatic recession in Brazil – Weak activity in the vehicle market – Increasing cost base due to unfavorable currency movements and high interest rates • The management team quickly responded – Overtime reduction of 99% Reduced active part numbers by 17% Payroll reduction of 13% Headcount elimination of 14% • The net impact of the actions above have resulted in a 23% reduction in the break - even production level and positive operating income during the third quarter for PST PST Sales ($0.60) $0.03 Q3 2015 Q3 2016 PST Gross Profit and % Margin PST Operating Income $24.3 $22.3 Q3 2015 Q3 2016 $9.0 $9.2 37.0% 41.1% Q3 2015 Q3 2016 (Dollars in Millions) Lowering Cost at PST in Response to Market Demand

7 Winning with Our Customers Sales Continue to Grow Faster than Our Underlying Markets New and Replacement Business • Total peak annual revenue awards of $48 million during the quarter – $27 million replacement business – $21 million new business awards • New business awards ( peak annual revenue) – $9 million soot sensor for European passenger can application – $6 million front axle disconnect actuation for a large North American tier one OEM – $3 million instrument cluster award for European commercial vehicle OEM
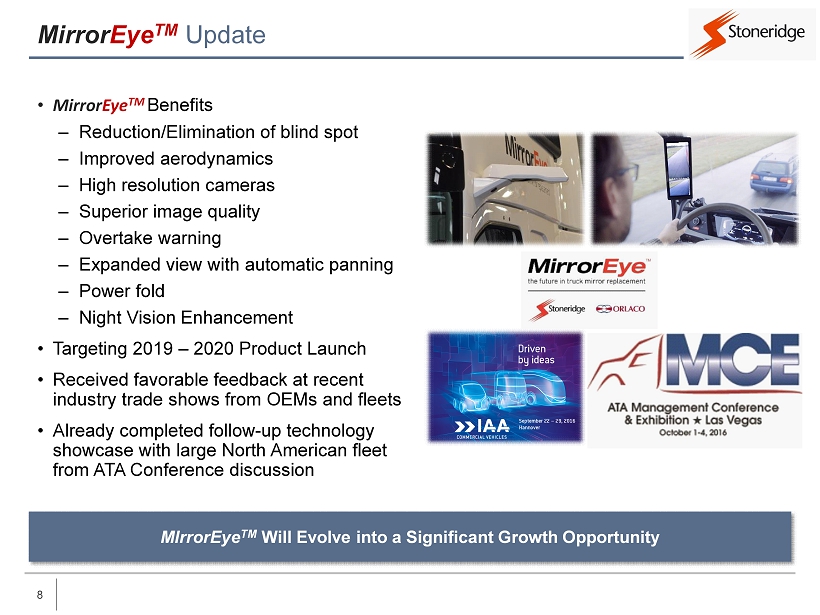
8 Mirror Eye TM Update MIrrorEye TM Wil l Evolve into a Significant Growth Opportunity • Mirror Eye TM Benefits – Reduction/Elimination of blind spot – Improved aerodynamics – High resolution cameras – Superior image quality – Overtake warning – Expanded view with automatic panning – Power fold – Night Vision Enhancement • Targeting 2019 – 2020 Product Launch • Received favorable feedback at recent industry trade shows from OEMs and fleets • Already completed follow - up technology showcase with large North American fleet from ATA Conference discussion

9 Market Segments Driving Growth We are Focused on Growth Markets Intelligence 8% CAGR Stoneridge Sales Growth 2016 2017 2018 2019 2020 2015 Safety & Security 7% CAGR Emissions 16% CAGR Fuel Economy 5% CAGR Source: December 2015 IHS, 2015 LMCA, ACT Research, Company Data.

10 Relocation of Stoneridge Corporate Headquarters On Schedule and on Budget to Be Complete by Year - End • State of the art facility in Novi, Michigan – Transition to be completed in 4 th quarter – Consolidate corporate functions and North American sales organization • New location will facilitate: – Stronger customer relationships – Improved partnership with suppliers – More collaboration with industry technology developers – Attraction and retention of industry talent as we prepare our company for future growth

11 Q3 2016 Summary Delivering on our commitments Quickly responding to our markets Winning with our customers Positioning our company for continued strong growth Building our talent Continue to Drive Shareholder Value Through Strong Operating Results, New Business Wins, Talent, and Focused M&A Opportunities

HIGHER LEVEL PERFORMANCE Financial Update October 27, 2016

13 Significant Improvement in Key Financial Metrics (Dollars in Millions) All Key Operating Metrics Significantly Improved Year - Over - Year Q3 2015 Q3 2016 2016 vs. 2015 Sales $162.1 $173.8 Gross Profit Margin 27.9% 28.6% Operating Earnings $8.9 $11.8 Operating Margin 5.5% 6.8% EPS $0.27 $0.36 +7.2% +76 bps +33% +126 bps +33%

14 Sales by Segment – Q3 2016 vs. Q3 2015 19.2% Growth in Control Devices Segment – Driven by Passenger Car / Light Truck Sales (Dollars in Millions) $87.0 $50.7 $24.3 $162.1 $103.7 $47.8 $22.3 $173.8 Control Devices Electronics PST (Brazil) Consolidated Stoneridge Q3 2015 Sales Q3 2016 Sales Q3 2015 Q3 2016 Q3 2015 Q3 2016 Q3 2015 Q3 2016 Q3 2015 Q3 2016 Pass Car / Light Truck $71.0 $90.1 $0.4 $0.3 $ – $ – $71.4 $90.4 Medium / HD Truck 9.0 7.4 47.6 46.0 – – 56.6 53.4 Agricultural 4.1 3.4 – – – – 4.1 3.4 PST / Other 3.0 2.8 2.7 1.5 24.3 22.3 30.0 26.6 Total $87.0 $103.7 $50.7 $47.8 $24.3 $22.3 $162.1 $173.8

15 Diverse Sales Profile – Q3 2016 Diversified Sales Based on End Markets, Regions and Products (Dollars in Millions) PassCar / Light Truck 49% Commercial Vehicle 36% PST 11% Ag / Other 4% North America 62% Europe / Asia 25% South America 13% Control Devices 60% Electronics 27% PST 13% $174 Million Note: Does not include revenue from India joint venture. Served Market Business Segment Region

16 Adjusted Sales – Q3 2016 vs. Q3 2015 Currency Unfavorably Impacted Our Electronics Segment in Q3 and Benefitted PST (Dollars in Millions) $87.0 $50.7 $24.3 $162.1 $103.7 $47.8 $22.3 $173.8 Control Devices Electronics Segment PST Segment Consolidated Sales Q3 2015 Q3 2016 $87.0 $50.7 $24.3 $162.1 $103.7 $49.0 $20.3 $173.0 Control Devices Electronics Segment PST Segment Consolidated Sales Q3 2015 Q3 2016 Sales (as Reported) Adjusted Sales (Constant FX)

17 Continuing EPS – Q3 2016 vs. Q3 2015 $0.09 Improvement in Q3 2016 EPS vs. Q3 2015 – 33% Year - over - Year Increase $0.27 $0.36 Q3 2015 Q3 2016 EPS Q3 2016 vs. 2015 EPS Y/Y Drivers * Includes currency impacts. SRI (ex. PST) PST (Brazil) Total SRI Volume * $0.13 ($0.02) $0.11 HQ Relocation (0.02) – (0.02) DM Cost (0.03) 0.04 0.01 SG&A / OH * (0.06) 0.02 (0.04) FX Debt 0.03 (0.02) 0.01 CD Warranty (0.03) – (0.03) Tax / Other 0.03 (0.01) 0.02 PST DL – (0.01) (0.01) COPQ 0.04 – 0.04 2016 B/(W) 2015 $0.09 $0.00 $0.09
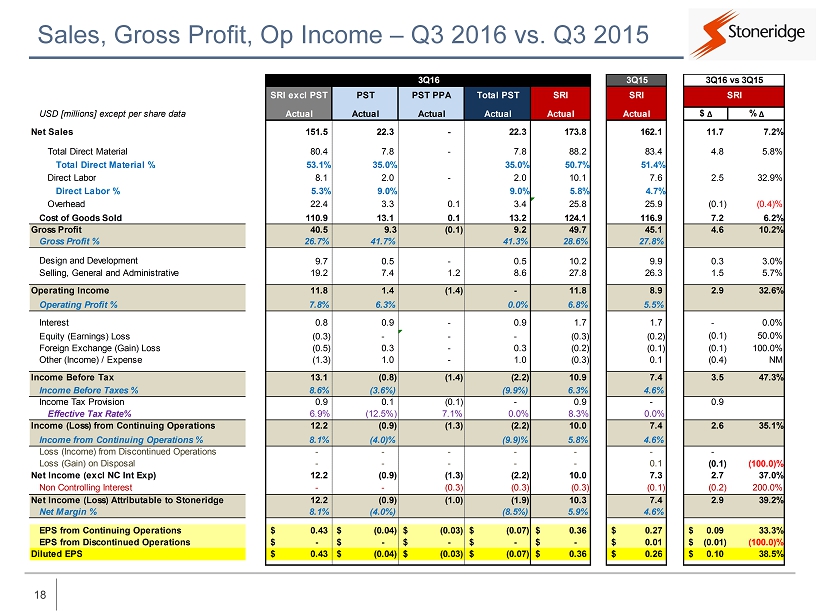
18 Sales, Gross Profit, Op Income – Q3 2016 vs. Q3 2015 3Q16 3Q15 3Q16 vs 3Q15 SRI excl PST PST PST PPA Total PST SRI SRI SRI USD [millions] except per share data Actual Actual Actual Actual Actual Actual $ Δ % Δ Net Sales 151.5 22.3 - 22.3 173.8 162.1 11.7 7.2% Total Direct Material 80.4 7.8 - 7.8 88.2 83.4 4.8 5.8% Total Direct Material % 53.1% 35.0% 35.0% 50.7% 51.4% Direct Labor 8.1 2.0 - 2.0 10.1 7.6 2.5 32.9% Direct Labor % 5.3% 9.0% 9.0% 5.8% 4.7% Overhead 22.4 3.3 0.1 3.4 25.8 25.9 (0.1) (0.4)% Cost of Goods Sold 110.9 13.1 0.1 13.2 124.1 116.9 7.2 6.2% Gross Profit 40.5 9.3 (0.1) 9.2 49.7 45.1 4.6 10.2% Gross Profit % 26.7% 41.7% 41.3% 28.6% 27.8% Design and Development 9.7 0.5 - 0.5 10.2 9.9 0.3 3.0% Selling, General and Administrative 19.2 7.4 1.2 8.6 27.8 26.3 1.5 5.7% Operating Income 11.8 1.4 (1.4) - 11.8 8.9 2.9 32.6% Operating Profit % 7.8% 6.3% 0.0% 6.8% 5.5% Interest 0.8 0.9 - 0.9 1.7 1.7 - 0.0% Equity (Earnings) Loss (0.3) - - - (0.3) (0.2) (0.1) 50.0% Foreign Exchange (Gain) Loss (0.5) 0.3 - 0.3 (0.2) (0.1) (0.1) 100.0% Other (Income) / Expense (1.3) 1.0 - 1.0 (0.3) 0.1 (0.4) NM Income Before Tax 13.1 (0.8) (1.4) (2.2) 10.9 7.4 3.5 47.3% Income Before Taxes % 8.6% (3.6%) (9.9%) 6.3% 4.6% Income Tax Provision 0.9 0.1 (0.1) - 0.9 - 0.9 Effective Tax Rate% 6.9% (12.5%) 7.1% 0.0% 8.3% 0.0% Income (Loss) from Continuing Operations 12.2 (0.9) (1.3) (2.2) 10.0 7.4 2.6 35.1% Income from Continuing Operations % 8.1% (4.0)% (9.9)% 5.8% 4.6% Loss (Income) from Discontinued Operations - - - - - - - Loss (Gain) on Disposal - - - - - 0.1 (0.1) (100.0)% Net Income (excl NC Int Exp) 12.2 (0.9) (1.3) (2.2) 10.0 7.3 2.7 37.0% Non Controlling Interest - - (0.3) (0.3) (0.3) (0.1) (0.2) 200.0% Net Income (Loss) Attributable to Stoneridge 12.2 (0.9) (1.0) (1.9) 10.3 7.4 2.9 39.2% Net Margin % 8.1% (4.0%) (8.5%) 5.9% 4.6% EPS from Continuing Operations 0.43$ (0.04)$ (0.03)$ (0.07)$ 0.36$ 0.27$ 0.09$ 33.3% EPS from Discontinued Operations -$ -$ -$ -$ -$ 0.01$ (0.01)$ (100.0)% Diluted EPS 0.43$ (0.04)$ (0.03)$ (0.07)$ 0.36$ 0.26$ 0.10$ 38.5%

19 Sales by Segment – Q3 2016 vs. Q2 2016 Q3 2016 Sales Lower than Q2 2016, Largely Driven by Lower North American OE Production (Dollars in Millions) $108.9 $57.8 $20.2 $186.9 $103.7 $47.8 $22.3 $173.8 Control Devices Electronics PST (Brazil) Consolidated Stoneridge Q2 2016 Sales Q3 2016 Sales Q2 2016 Q3 2016 Q2 2016 Q3 2016 Q2 2016 Q3 2016 Q2 2016 Q3 2016 Pass Car / Light Truck $91.8 $90.1 $0.4 $0.3 $ – $ – $92.2 $90.4 Medium / HD Truck 11.9 7.4 55.0 46.0 – – 66.9 53.4 Agricultural 2.0 3.4 – – – – 2.0 3.4 PST / Other 3.2 2.8 2.4 1.5 20.2 22.3 25.8 26.6 Total $108.9 $103.7 $57.8 $47.8 $20.2 $22.3 $186.9 $173.8
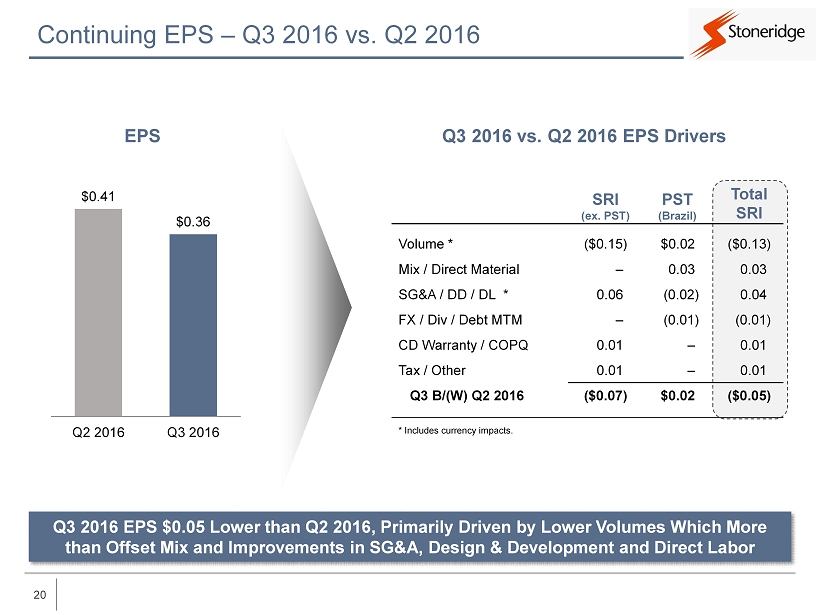
20 Continuing EPS – Q3 2016 vs. Q2 2016 Q3 2016 EPS $0.05 Lower than Q2 2016, Primarily Driven by Lower Volumes Which More than Offset Mix and Improvements in SG&A, Design & Development and Direct Labor $0.41 $0.36 Q2 2016 Q3 2016 EPS SRI (ex. PST) PST (Brazil) Total SRI Volume * ($0.15) $0.02 ($0.13) Mix / Direct Material – 0.03 0.03 SG&A / DD / DL * 0.06 (0.02) 0.04 FX / Div / Debt MTM – (0.01) (0.01) CD Warranty / COPQ 0.01 – 0.01 Tax / Other 0.01 – 0.01 Q3 B/(W) Q2 2016 ($0.07) $0.02 ($0.05) Q3 2016 vs. Q2 2016 EPS Drivers * Includes currency impacts.

21 Debt / Net Debt Capital Structure Debt and Leverage Levels Significant De - risking of Balance Sheet in Recent Years – Debt / EBITDA of 1.6x Today vs. 4.1x in 2012 (Dollars in Millions) 9/30/16 U.S. Debt Revolver Capacity $300 Amount Drawn (87) Net Availability $213 Brazil Debt Gov’t Incentive Debt $9 Other Debt 9 Total Brazil Debt $18 $157 $134 $87 $64 $73 $66 $55 $201 $197 $130 $118 $121 $121 $105 2012 2013 2014 2015 Q1 2016 Q2 2016 Q3 2016 Total Debt Net Debt SRI Total Debt / Net Debt Leverage* 4.1x 2.8x 2.5x 2.3x 2.2x 2.0x 1.6x $10 $17 $19 $7 $8 $11 $9 $14 $5 $10 $11 $13 $10 $9 $24 $22 $29 $18 $21 $21 $18 2012 2013 2014 2015 Q1 2016 Q2 2016 Q3 2016 Gov't Incentive Debt Other Debt Brazil Debt * Debt Leverage: Continuing Operations excluding PST PPA. 2014 : Adjusted to exclude GW Impairment & Debt Extinguishment. 2015 : Adjusted to exclude GW Impairment& Non - Cash Restricted Stock for CEO Retirement.

22 2016 Full - Year Guidance Revising 2016 Full - Year Sales Guidance – Reaffirming All Other Key Metrics Prior Guidance * Updated Guidance * Sales Updated $705 - $715M $690 - $700M Gross Margin 26.0% - 28.5% 26.0% - 28.5% Operating Margin 6.0% - 7.3% 6.0% - 7.3% EPS / Adjusted EPS ** $1.25 - $1.40 $1.25 - $1.40 EBITDA 9.5% - 11.3% 9.5% - 11.3% FX Rates Prior Guidance Updated Guidance USD / BRL 3.40 3.40 USD / MXN 17.80 18.35 EUR / USD 1.12 1.14 USD / SEK 8.25 8.32 * Assumes no reversal of U.S. Deferred Tax Valuation Allowance. ** Assumes $0.31 adjusted EPS in 1Q16 and $0.41 as reported EPS in 2Q16.

23 Continue to drive shareholder value x Deliver on our commitments x Execute growth opportunities (soot sensor, MirrorEye TM ) x Quickly respond to changing market conditions x Continue to generate operating leverage on growing revenue base x Grow faster than our respective markets x Strategic M&A opportunities Positioned to Deliver Profitable Growth for Our Shareholders Closing Thoughts

HIGHER LEVEL PERFORMANCE Appendix October 27, 2016

25 PST Purchase Price Accounting Expense (Non Cash) (millions) 1Q 2Q 3Q 4Q Full Year 2015 1Q16 2Q16 3Q16 COGS / Depreciation – Fixed Asset Write Up $0.2 $0.2 $0.1 $0.1 $0.6 $0.1 $0.1 $0.1 SGA / Amortized Intangibles $0.9 $0.9 $0.8 $0.7 $3.3 $0.7 $0.8 $1.2 TOTAL $1.1 $1.1 $0.9 $0.8 $3.9 $0.8 $0.9 $1.3 1Q 2Q 3Q 4Q 2015 1Q 2Q 3Q Impact on Op Margin (0.68)% (0.67)% (0.56)% (0.52)% (0.60)% (0.49)% (0.48)% (0.75)% Impact on Diluted EPS $(0.02) $(0.02) $(0.02) $(0.01) $(0.07) $(0.02) $(0.02) $(0.03)

[ ] 26 www.stoneridge.com