
Second - Quarter 2019 Results August 1, 2019 Exhibit 99.2

2 Forward - Looking Statements Statements in this presentation that are not historical facts are forward - looking statements, which involve risks and uncertaint ies that could cause actual events or results to differ materially from those expressed or implied by the statements. Important factors that ma y cause actual results to differ materially from those in the forward - looking statements include, among other factors, the loss or bankruptcy o f a major customer; the costs and timing of facility closures, business realignment or similar actions; a significant change in commerc ial vehicle, automotive, agricultural and off - highway vehicle production; our ability to achieve cost reductions that offset or exceed custom er - mandated selling price reductions; a significant change in general economic conditions in any of the various countries in which Stoner idg e operates; labor disruptions at Stoneridge’s facilities or at any of Stoneridge’s significant customers or suppliers; the ability of sup pli ers to supply Stoneridge with parts and components at competitive prices on a timely basis; the amount of Stoneridge’s indebtedness and the re strictive covenants contained in the agreements governing its indebtedness, including its revolving credit facility; customer acceptanc e o f new products; capital availability or costs, including changes in interest rates or market perceptions; the failure to achieve su cce ssful integration of any acquired company or business; the occurrence or non - occurrence of circumstances beyond Stoneridge’s control; and the items described in “Risk Factors” and other uncertainties or risks discussed in Stoneridge’s periodic and current reports filed wit h t he Securities and Exchange Commission. Important factors that could cause the performance of the commercial vehicle and automotive industry to differ materially fro m t hose in the forward - looking statements include factors such as (1) continued economic instability or poor economic conditions in the United States and global markets, (2) changes in economic conditions, housing prices, foreign currency exchange rates, commodity prices, includ ing shortages of and increases or volatility in the price of oil, (3) changes in laws and regulations, (4) the state of the credit markets, (5 ) political stability, (6) international conflicts and (7) the occurrence of force majeure events. These factors should not be construed as exhaustive and should be considered with the other cautionary statements in Stonerid ge’ s filings with the Securities and Exchange Commission. Forward - looking statements are not guarantees of future performance; Stoneridge’s actual results of operations, financial condit ion and liquidity, and the development of the industry in which Stoneridge operates may differ materially from those described in or sug gested by the forward - looking statements contained in this presentation. In addition, even if Stoneridge’s results of operations, financial co ndition and liquidity, and the development of the industry in which Stoneridge operates are consistent with the forward - looking statements c ontained in this presentation, those results or developments may not be indicative of results or developments in subsequent periods. This presentation contains time - sensitive information that reflects management’s best analysis only as of the date of this prese ntation. Any forward - looking statements in this presentation speak only as of the date of this presentation, and Stoneridge undertakes no obl igation to update such statements. Comparisons of results for current and any prior periods are not intended to express any future tren ds or indications of future performance, unless expressed as such, and should only be viewed as historical data. Stoneridge does not undertake any obligation to publicly update or revise any forward - looking statement as a result of new infor mation, future events or otherwise, except as otherwise required by law. Rounding Disclosure: There may be slight immaterial differences between figures represented in our public filings compared t o w hat is shown in this presentation. The differences are the a result of rounding due to the representation of values in millions rat her than thousands in public filings.

3 Overview of Achievements x Awarded additional transmission actuation programs (Park - by - Wire and Shift - by - Wire) x Total of $ 48 million Park - by - Wire and $21 million Shift - by - Wire (peak annual revenue) programs start of production 2019 and beyond x Awarded additional OEM driver information system program and infotainment program in Brazil x Additional $10.5 million peak annual revenue programs starting early to mid - 2020 x Successfully transitioned and launched new facility in China x Expecting sales in China to approximately double from 2018 to 2020 x Executed Accelerated Share Repurchase Program to buy back ~5% of outstanding shares* Overview of Q 2 2019 Q 2 2019 Financial Performance 2019 Adjusted Full - Year Guidance Reported Adjusted Sales $222.2 million $218.1 million Gross Profit (%) $56.8 million (25.6%) $57.8 million (26.5%) Operating Income (%) $49.2 million (22.1%) $11.9 million (5.5%) Tax Rate 18.6% 14.5% EPS $1.41 $0.36 EBITDA (%) -- $20.2 million (9.3%) 2019 1 st Half Results 2019 Guidance Change to Midpoint Guidance Adj. Sales $436.4 million $830 - $850 million $7.5 million Adj. Gross Margin 27.5% 28.5% - 30.0% 50 bps Adj. Operating Margin 6.4% 6.75% - 7.5% 50 bps Adj. Tax Rate 17.0% 17.5% - 22.5% 250 bps Adj. EPS $0.80 $1.60 - $1.72 $0.035 Adj. EBITDA Margin 10.1% 10.5% - 11.5% 50 bps *As of the date of execution of the Accelerated Share Repurchase Program (May 7, 2019)

4 2 nd Quarter 2019 Quarterly Financial Comparison Remain focused on continuous improvement initiatives and overcoming externalities to drive sustainable, profitable growth Quarterly Comparison* Adjusted Sales Adjusted Gross Profit Adjusted Operating Income Adjusted EBITDA $’s in USD Millions *Excluding estimated impact of recently divested switches and connectors product lines **Based upon June IHS and Q2 LMC data and Company sales data ▸ Excluding the impact of currency and ramp - down of legacy Shift - by - Wire, core portfolio grew 3.2% vs. weighted end - markets contraction of ~(0.5%)** ▸ Margin aligned with 1st half expectations ▸ Macroeconomic headwinds continue to dampen operating performance • Currency – ($1.7) million operating income impact Q2 ‘19 vs Q2 ‘18 • Electronic component allocations and premiums – ($1.3) million operating income impact Q2 ‘19 vs Q2 ’18 • Tariffs – ($1.1) million operating income impact Q2 ‘19 vs Q2 ’18 • Incremental tariffs in the quarter had an insignificant impact Q 2 Financial Highlights $209.4 $209.0 $170.0 $190.0 $210.0 $230.0 Q2 2018 Q2 2019 $64.1 $57.8 30.6% 27.7% $40.0 $50.0 $60.0 $70.0 Q2 2018 Q2 2019 20.0% 25.0% 30.0% 35.0% 40.0% $17.8 $11.9 8.5% 5.7% $5.0 $10.0 $15.0 $20.0 Q2 2018 Q2 2019 0.0% 2.0% 4.0% 6.0% 8.0% 10.0% 12.0% 14.0% 16.0% 18.0% 20.0% $25.8 $20.2 12.3% 9.7% $5.0 $15.0 $25.0 Q2 2018 Q2 2019 0.0% 5.0% 10.0% 15.0% 20.0%

5 2019 Keys to Success We remain on - track to achieve our 2019 goals as well as our long - term financial targets (approximately $1 billion in revenue and 15.5%+ EBITDA margin in 2021) CONTROL DEVICES PST ELETRÔNICA ELECTRONICS ▸ Drive operational efficiency ▸ Grow core product portfolio ▸ Complete review of strategic alternatives of non - core switches and connectors business ▸ Manage exit of Canton, MA facility ▸ Drive advanced technology development ▸ Capture MirrorEye TM retrofit opportunities ▸ Complete review of strategic alternatives of non - core products ▸ Grow local OEM capabilities ▸ Maintain efficient, flexible cost structure to respond to macroeconomic conditions ▸ Leverage low - cost, existing engineering capabilities globally Status x 30 bps improvement in adjusted operating margin Q1 2019 to Q2 2019, excluding divested product lines x Excluding Shift - by - Wire, base portfolio grew 7.1% in the trailing twelve month period x Divestiture transition remains on - track x Anticipating close of Canton facility late - 2019 / early - 2020 x Additional awards this quarter brings total awarded OEM programs in Brazil to approximately $20 million peak annual revenue x Awarded programs announced this quarter starting production early to mid - 2020 x MirrorEye TM retrofit program delayed 1 - 2 quarters due to ongoing process and product refinements as we ramp - up to meet expected demand x Review of strategic alternatives for non - core products expected to be complete this year 2019 Keys to Success

6 Transmission Actuation Total Park - by - Wire awards of approximately $48 million in peak annual revenue Total new Shift - by - Wire awards of $21 million in peak annual revenue ▸ Awarded Park - by - Wire Extension and Expansion • Awarded extension and expansion of existing Park - by - Wire program • Generation I start of production 2019 (previously announced) • Generation II start of production 2022 (new award) • Total program peak annual revenue expected to be $43 million • Previously awarded program focused on electrified vehicles in China – approximately $5 million peak annual revenue • Total Park - by - Wire awards of approximately $48 million peak annual revenue ▸ Shift - by - Wire Award • Awarded new program manufactured in China for the European market, with a 2021 start of production (pending) • $8 million peak annual revenue • Considering previously announced Shift - by - Wire award in China, total Shift - by - Wire awards in China of $21 million peak annual revenue launching 2021 New Awards Park - by - Wire Expansion and extension of existing program. SOP 2022. Total program peak annual revenue of $43 million. Shift - by - Wire New program award. SOP 2021, $8 million peak annual revenue. (Pending)

7 MirrorEye TM Executing rollout of retrofit programs Anticipate OEM sourcing decisions in the short - term ▸ Retrofit Rollout • Retrofit rollout delayed 1 - 2 quarters due to ongoing process and product refinements as we ramp - up to meet expected demand • No expected impact on market opportunity ▸ OEM Awards • Anticipate sourcing decision from one OEM in the short - term • Additional OEM sourcing decisions expected by the end of 2019 or early 2020 ▸ Adjacent Market Opportunities • European bus OEM evaluating system for bus applications in Europe

8 PST OEM Expansion Our ability to provide OEM solutions in Brazil will continue to drive growth opportunities for PST ▸ New Awards • Award from global OEM for driver information system program in Brazil • $5.5 million peak annual revenue • Start of production mid - 2020 • Awarded program from global OEM to manufacture infotainment systems for local market (pending) • $5 million peak annual revenue • SOP Early - 2020 ▸ Current Status of OEM Programs in Brazil • New awards represent $10.5 million of peak annual revenue with start of production in 2020 • Previously announced awards with estimated $9.4 million of peak annual revenue with start of production in 2022 ▸ Total awards of ~$20 million peak annual revenue will drive stability and growth for PST • Trailing twelve - month revenue of $73.2 million for PST – OEM awards will drive significant growth for the segment New Awards Driver Information Systems (OEM Brazil) $5.5 million peak annual revenue, SOP Mid - 2020 Infotainment (OEM Brazil) $5 million peak annual revenue, SOP Early - 2020 (Pending) Total New Awards - $10.5 million, SOP 2020

9 Summary ▸ Financial performance in the quarter driven by strong top - line performance and margin inline with our expectations ▸ Transmission actuation strategy driving success with $69 million peak annual revenue of new awards launching 2019 – 2022 in strategically significant regions and with new customers ▸ Retrofit rollout delayed 1 - 2 quarters due to ongoing process and product refinements as we ramp - up to meet expected demand • Expecting OEM sourcing decision in the short - term and additional decisions late - 2019 or early - 2020 ▸ PST OEM strategy driving growth opportunities for the segment • Additional $10.5 million peak annual revenue awards Driving shareholder value through strong financial performance and a well - defined long - term strategy

10 Financial Update

11 2 nd Quarter 2019 Financial Summary Excluding divested product lines, adjusted sales of $209.0 million, a decrease of $0.4 million over Q2 2018 Excluding divested product lines, Control Devices adjusted sales of $102.9 million, an increase of 2% over Q2 2018 Electronics sales of $101.9 million, an increase of 2% over Q2 2018 PST sales of $16.6 million, a decrease of 18% over Q2 2018 Excluding divested product lines, adjusted operating income of $11.9 million (5.7% adjusted operating margin) a decrease of 33% over Q2 2018 Excluding divested product lines, Control Devices adjusted operating income of $12.9 million (12.5% adjusted operating margin), a decrease of 14% over Q2 2018 Electronics adjusted operating income of $7.7 million (7.5% adjusted operating margin), a decrease of 11% over Q2 2018 PST adjusted operating income of $0.4 million (2.4% adjusted operating margin), a decrease of 69% over Q2 2018 2019 Adjusted Full - Year Guidance 2019 Q2 Results 2019 1 st Half Results 2019 Guidance Change to Midpoint Guidance Adj. Sales $218.1 million $436.4 million $830 - $850 million $7.5 million Adj. Gross Margin 26.5% 27.5% 28.5% - 30.0% 50 bps Adj. Operating Margin 5.5% 6.4% 6.75% - 7.5% 50 bps Adj. Tax Rate 14.5% 17.0% 17.5% - 22.5% 250 bps Adj. EPS $0.36 $0.80 $1.60 - $1.72 $0.035 Adj. EBITDA Margin 9.3% 10.1% 10.5% - 11.5% 50 bps 2 nd Quarter 2019 Financial Results

12 Control Devices Financial Performance Continued growth in core products offsetting expected declines in legacy Shift - by - Wire Improvement in operating margin expected to continue through 2019 Control Devices Overview * Continued ramp - down of legacy Shift - by - Wire programs reduced revenue by $5.5 million in Q2 and $29.8 million in the trailing twelve month (TTM) period. Excluding legacy Shift - by - Wire, the base portfolio grew by 7.1% in Q2 and over the TTM period driven by continued growth in emissions sensor products. Tariff related expenses reduced operating income by approximately $0.9 million in Q2 relative to Q2 2018 30 bps of operating margin improvement relative to Q1 2019 due to continued reduced quality related expenses and improved operational efficiency *Excluding estimated impact of recently divested switches and connectors product lines Q2 2018 vs Q2 2019* Q1 2019 vs Q2 2019* Trailing Twelve Months* Adjusted Sales Adjusted Operating Income $’s in USD Millions $101.2 $102.9 $50.0 $70.0 $90.0 $110.0 $130.0 Q2 2018 Q2 2019 $15.0 $12.9 14.8% 12.5% $0.0 $5.0 $10.0 $15.0 $20.0 Q2 2018 Q2 2019 10.0% 12.0% 14.0% 16.0% 18.0% 20.0% $100.9 $102.9 $50.0 $70.0 $90.0 $110.0 $130.0 Q1 2019 Q2 2019 $12.3 $12.9 12.2% 12.5% $0.0 $5.0 $10.0 $15.0 $20.0 Q1 2019 Q2 2019 8.0% 10.0% 12.0% 14.0% 16.0% 18.0% 20.0% $403.3 $402.1 $25.0 $125.0 $225.0 $325.0 $425.0 TTM Q2 2018 TTM Q2 2019 $60.4 $49.9 15.0% 12.4% $0.0 $20.0 $40.0 $60.0 TTM Q2 2018 TTM Q2 2019 0.0% 10.0% 20.0% 30.0% 40.0%
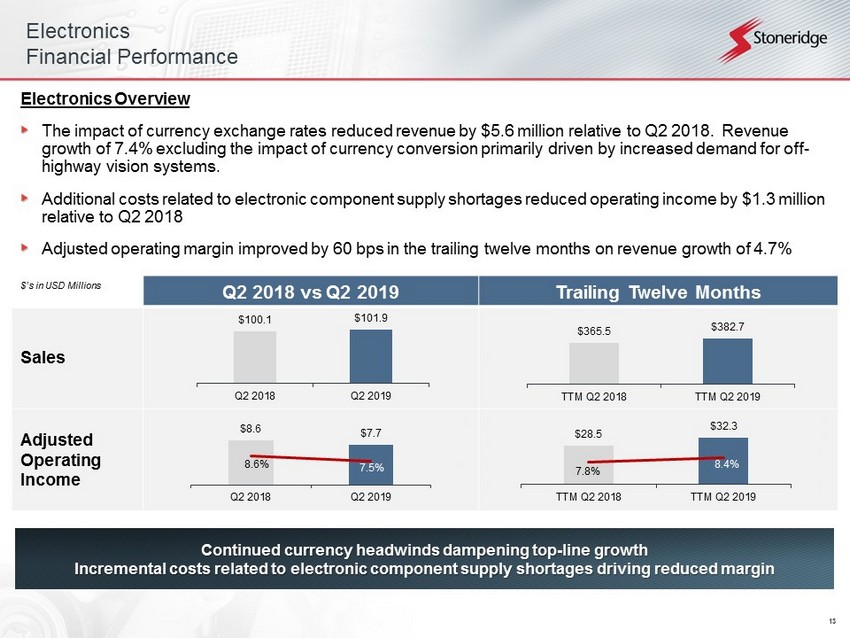
13 Electronics Financial Performance Continued currency headwinds dampening top - line growth Incremental costs related to electronic component supply shortages driving reduced margin Q2 2018 vs Q2 2019 Trailing Twelve Months Sales Adjusted Operating Income $’s in USD Millions Electronics Overview The impact of currency exchange rates reduced revenue by $5.6 million relative to Q2 2018. Revenue growth of 7.4% excluding the impact of currency conversion primarily driven by increased demand for off - highway vision systems. Additional costs related to electronic component supply shortages reduced operating income by $1.3 million relative to Q2 2018 Adjusted operating margin improved by 60 bps in the trailing twelve months on revenue growth of 4.7% $365.5 $382.7 $200.0 $300.0 $400.0 TTM Q2 2018 TTM Q2 2019 $8.6 $7.7 8.6% 7.5% $0.0 $5.0 $10.0 Q2 2018 Q2 2019 3.0% 5.0% 7.0% 9.0% 11.0% 13.0% 15.0% $100.1 $101.9 $50.0 $70.0 $90.0 $110.0 Q2 2018 Q2 2019 $28.5 $32.3 7.8% 8.4% $10.0 $20.0 $30.0 $40.0 TTM Q2 2018 TTM Q2 2019 5.0% 7.0% 9.0% 11.0% 13.0%
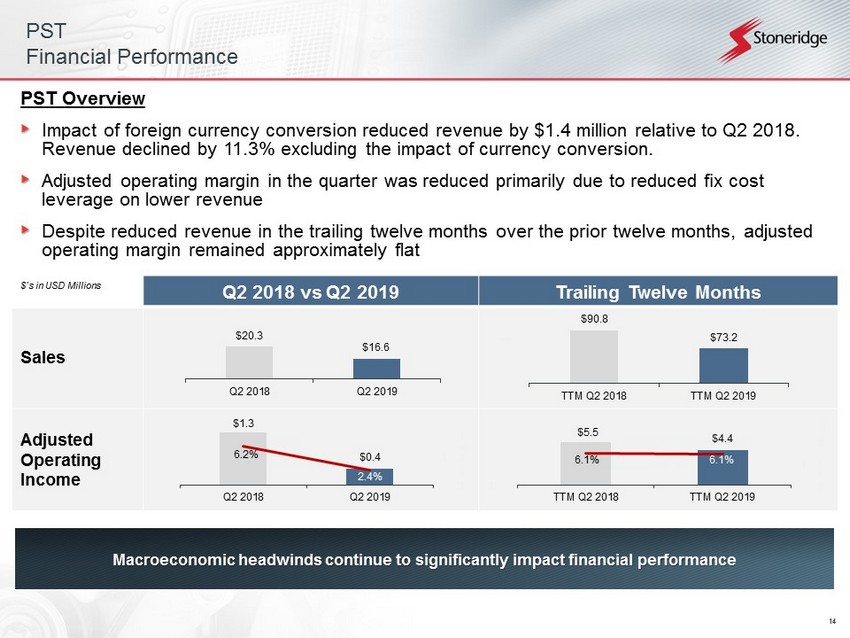
14 PST Financial Performance Macroeconomic headwinds continue to significantly impact financial performance Q2 2018 vs Q2 2019 Trailing Twelve Months Sales Adjusted Operating Income $’s in USD Millions PST Overview Impact of foreign currency conversion reduced revenue by $1.4 million relative to Q2 2018. Revenue declined by 11.3% excluding the impact of currency conversion. Adjusted operating margin in the quarter was reduced primarily due to reduced fix cost leverage on lower revenue Despite reduced revenue in the trailing twelve months over the prior twelve months, adjusted operating margin remained approximately flat $20.3 $16.6 $10.0 $15.0 $20.0 $25.0 $30.0 Q2 2018 Q2 2019 $1.3 $0.4 6.2% 2.4% $0.0 $0.5 $1.0 $1.5 Q2 2018 Q2 2019 0.0% 2.0% 4.0% 6.0% 8.0% 10.0% $90.8 $73.2 $40.0 $60.0 $80.0 $100.0 TTM Q2 2018 TTM Q2 2019 $5.5 $4.4 6.1% 6.1% $0.0 $2.0 $4.0 $6.0 $8.0 TTM Q2 2018 TTM Q2 2019 0.0% 2.0% 4.0% 6.0% 8.0% 10.0% 12.0%
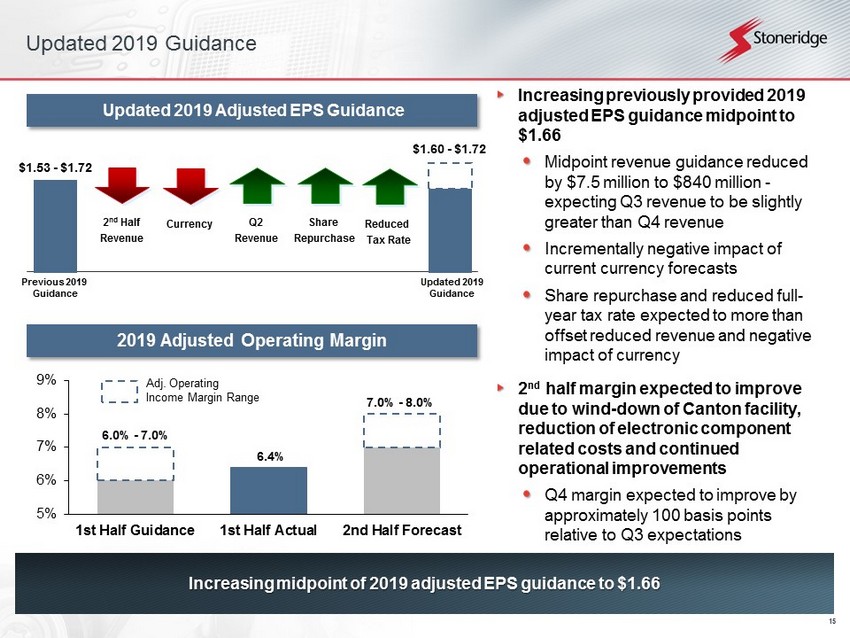
15 Updated 2019 Guidance Increasing midpoint of 2019 adjusted EPS guidance to $1.66 Increasing previously provided 2019 adjusted EPS guidance midpoint to $1.66 Midpoint revenue guidance reduced by $7.5 million to $840 million - expecting Q3 revenue to be slightly greater than Q4 revenue Incrementally negative impact of current currency forecasts Share repurchase and reduced full - year tax rate expected to more than offset reduced revenue and negative impact of currency 2 nd half margin expected to improve due to wind - down of Canton facility, reduction of electronic component related costs and continued operational improvements Q4 margin expected to improve by approximately 100 basis points relative to Q3 expectations Previous 2019 Guidance Updated 2019 Adjusted EPS Guidance Share Repurchase 2 nd Half Revenue $1.60 - $1.72 Updated 2019 Guidance Reduced Tax Rate Currency $1.53 - $1.72 5% 6% 7% 8% 9% 1st Half Guidance 1st Half Actual 2nd Half Forecast 7.0% - 8.0% 6.0% - 7.0% Adj. Operating Income Margin Range 6.4% 2019 Adjusted Operating Margin Q2 Revenue
16 Summary 2019 Q2 Summary ▸ Control Devices – Excluding Shift - by - Wire and divested product lines, adjusted sales increased by 7.1% over Q2 2018. Adjusted operating margin increased by 30 basis points over Q1 2019. ▸ Electronics – Continued strong revenue growth partially offset by unfavorable currency impact. Adjusted operating margin improvement of 60 basis points over trailing twelve month period. ▸ PST – Macroeconomic conditions, including unfavorable currency, impacting top - line. Continued focus on operational performance and offsetting external factors. Trailing twelve month adjusted operating margin remains stable. 2019 Outlook and Guidance ▸ Increasing midpoint of adjusted EPS guidance to $1.66 • Favorable impact of accelerated share repurchase program and reduced midpoint tax rate guidance more than offsetting reduced revenue and unfavorable currency impact • Reducing guided revenue midpoint by $7.5 million to $840 million • Primarily due to timing of MirrorEye retrofit rollout and expected unfavorable currency impact for the remainder of the year, partially offset by stronger than expected 2 nd quarter performance Driving shareholder value through strong financial performance and a well - defined long - term strategy

17 Appendix
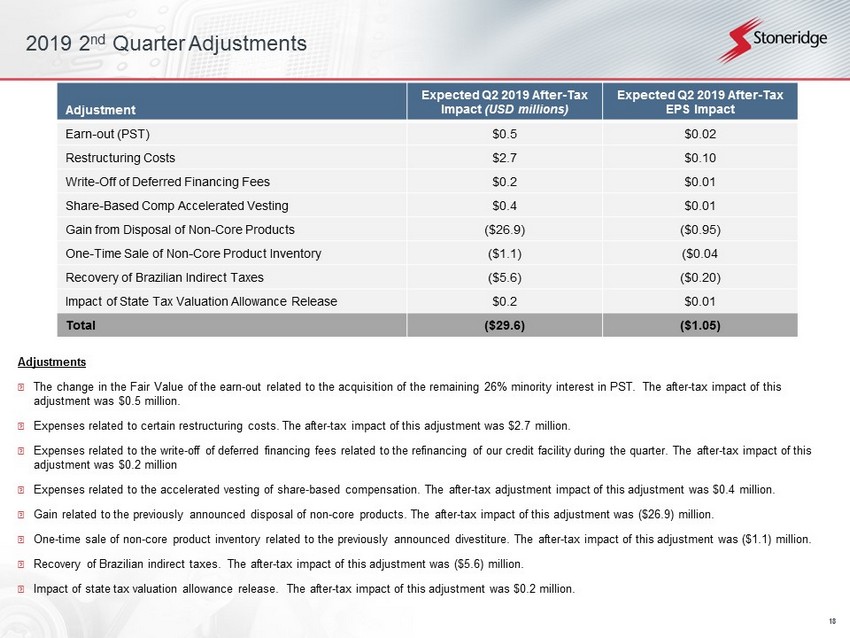
18 2019 2 nd Quarter Adjustments Adjustments ▸ The change in the Fair Value of the earn - out related to the acquisition of the remaining 26% minority interest in PST. The afte r - tax impact of this adjustment was $0.5 million. ▸ Expenses related to certain restructuring costs. The after - tax impact of this adjustment was $2.7 million. ▸ Expenses related to the write - off of deferred financing fees related to the refinancing of our credit facility during the quarte r. The after - tax impact of this adjustment was $0.2 million ▸ Expenses related to the accelerated vesting of share - based compensation. The after - tax adjustment impact of this adjustment was $0.4 million. ▸ Gain related to the previously announced disposal of non - core products. The after - tax impact of this adjustment was ($26.9) mill ion. ▸ One - time sale of non - core product inventory related to the previously announced divestiture. The after - tax impact of this adjust ment was ($1.1) million. ▸ Recovery of Brazilian indirect taxes. The after - tax impact of this adjustment was ($5.6) million. ▸ Impact of state tax valuation allowance release. The after - tax impact of this adjustment was $0.2 million. Adjustment Expected Q2 2019 After - Tax Impact (USD millions) Expected Q2 2019 After - Tax EPS Impact Earn - out (PST) $0.5 $0.02 Restructuring Costs $2.7 $0.10 Write - Off of Deferred Financing Fees $0.2 $0.01 Share - Based Comp Accelerated Vesting $0.4 $0.01 Gain from Disposal of Non - Core Products ($26.9) ($0.95) One - Time Sale of Non - Core Product Inventory ($1.1) ($0.04 Recovery of Brazilian Indirect Taxes ($5.6) ($0.20) Impact of State Tax Valuation Allowance Release $0.2 $0.01 Total ($29.6) ($1.05)
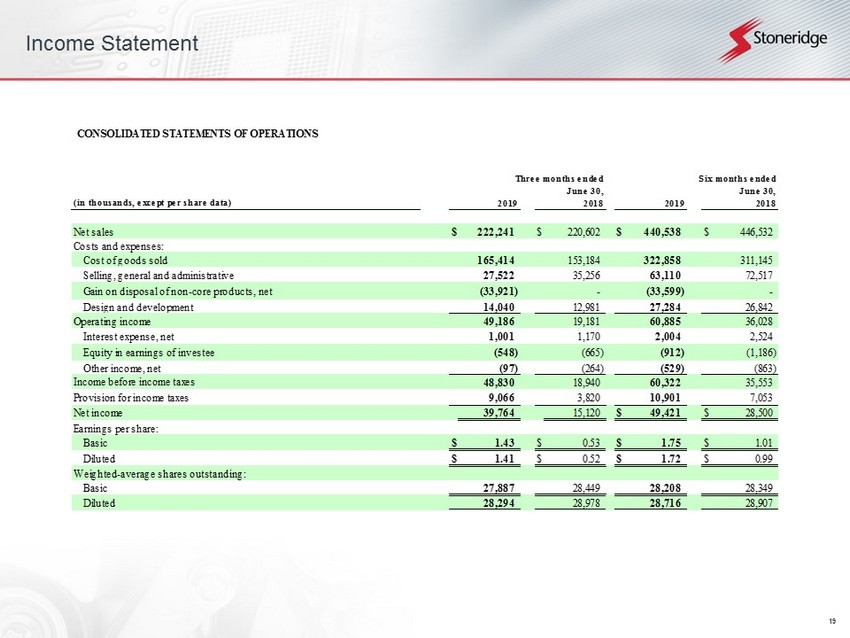
19 Income Statement (in thousands, except per share data) Net sales $ 222,241 $ 220,602 $ 440,538 $ 446,532 Costs and expenses: Cost of goods sold 165,414 153,184 322,858 311,145 Selling, general and administrative 27,522 35,256 63,110 72,517 Gain on disposal of non-core products, net (33,921) - (33,599) - Design and development 14,040 12,981 27,284 26,842 Operating income 49,186 19,181 60,885 36,028 Interest expense, net 1,001 1,170 2,004 2,524 Equity in earnings of investee (548) (665) (912) (1,186) Other income, net (97) (264) (529) (863) 48,830 18,940 60,322 35,553 9,066 3,820 10,901 7,053 Net income 39,764 15,120 $ 49,421 $ 28,500 Earnings per share: Basic $ 1.43 $ 0.53 $ 1.75 $ 1.01 Diluted $ 1.41 $ 0.52 $ 1.72 $ 0.99 Weighted-average shares outstanding: Basic 27,887 28,449 28,208 28,349 Diluted 28,294 28,978 28,716 28,907 Three months ended June 30, 2019 2018 CONSOLIDATED STATEMENTS OF OPERATIONS Income before income taxes Provision for income taxes 2019 2018 June 30, Six months ended

20 Segment Financial Information Net Sales: Control Devices $ 114,067 $ 109,956 $ 224,186 $ 225,313 Inter-segment sales 2,078 2,481 3,939 4,662 Control Devices net sales 116,145 112,437 228,125 229,975 Electronics 91,560 90,313 182,406 180,341 Inter-segment sales 10,325 9,771 19,047 20,243 Electronics net sales 101,885 100,084 201,453 200,584 PST 16,614 20,333 33,946 40,878 Inter-segment sales - - 6 2 PST net sales 16,614 20,333 33,952 40,880 Eliminations (12,403) (12,252) (22,992) (24,907) Total net sales $ 222,241 $ 220,602 $ 440,538 $ 446,532 Operating Income (Loss): Control Devices $ 44,367 $ 17,160 $ 56,315 $ 35,039 Electronics 7,555 8,276 16,586 16,156 PST 6,414 735 7,084 885 Unallocated Corporate (9,150) (6,990) (19,100) (16,052) Total operating income $ 49,186 $ 19,181 $ 60,885 $ 36,028 Depreciation and Amortization: Control Devices $ 3,197 $ 2,897 $ 6,291 $ 5,692 Electronics 2,510 2,252 4,907 4,543 PST 1,695 1,740 3,220 4,245 Unallocated Corporate 216 199 429 396 Total depreciation and amortization $ 7,618 $ 7,088 $ 14,847 $ 14,876 Interest (Income) Expense, net: Control Devices $ 195 $ 18 $ 377 $ 37 Electronics 63 23 119 57 PST (59) 194 49 532 Unallocated Corporate 802 935 1,459 1,898 Total interest expense, net $ 1,001 $ 1,170 $ 2,004 $ 2,524 Capital Expenditures: Control Devices $ 4,042 $ 3,312 $ 7,534 $ 9,058 Electronics 3,356 1,394 7,094 4,167 PST 805 696 1,624 1,955 Unallocated Corporate 592 938 1,227 1,665 Total capital expenditures $ 8,795 $ 6,340 $ 17,479 $ 16,845 2019 20182019 2018 June 30, Three months ended Six months ended June 30,

21 Balance Sheet CONSOLIDATED BALANCE SHEETS (in thousands) (Unaudited) ASSETS Current assets: Cash and cash equivalents $ 51,503 $ 81,092 Accounts receivable, less reserves of $1,592 and $1,243, respectively 151,687 139,076 Inventories, net 100,751 79,278 Prepaid expenses and other current assets 32,148 20,731 Total current assets 336,089 320,177 Long-term assets: Property, plant and equipment, net 116,954 112,213 Intangible assets, net 58,890 62,032 Goodwill 36,377 36,717 Operating lease right-of-use asset 18,970 - Investments and other long-term assets, net 28,767 28,380 Total long-term assets 259,958 239,342 Total assets $ 596,047 $ 559,519 LIABILITIES AND SHAREHOLDERS' EQUITY Current liabilities: Current portion of debt $ 869 $ 1,533 Accounts payable 100,659 87,894 Accrued expenses and other current liabilities 61,987 57,880 Total current liabilities 163,515 147,307 Long-term liabilities: Revolving credit facility 103,500 96,000 Long-term debt, net 732 983 Deferred income taxes 15,042 14,895 Operating lease long-term liability 14,565 - Other long-term liabilities 17,194 17,068 Total long-term liabilities 151,033 128,946 Shareholders' equity: Preferred Shares, without par value, 5,000 shares authorized, none issued - - Common Shares, without par value, 60,000 shares authorized, 28,966 and 28,966 shares issued and 27,367 and 28,488 shares outstanding at June 30, 2019 and December 31, 2018, respectively, with no stated value - - Additional paid-in capital 223,831 231,647 Common Shares held in treasury, 1,599 and 478 shares at June 30, 2019 and December 31, 2018, respectively, at cost (50,689) (8,880) Retained earnings 195,672 146,251 Accumulated other comprehensive loss (87,315) (85,752) Total shareholders' equity 281,499 283,266 Total liabilities and shareholders' equity $ 596,047 $ 559,519 2018 December 31, 2019 June 30,
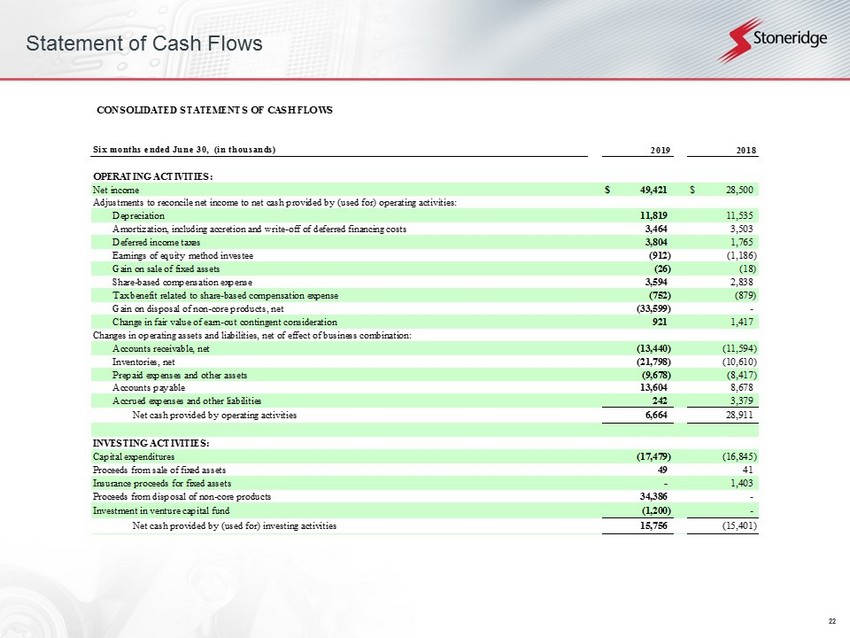
22 Statement of Cash Flows CONSOLIDATED STATEMENTS OF CASH FLOWS Six months ended June 30, (in thousands) OPERATING ACTIVITIES: Net income $ 49,421 $ 28,500 Adjustments to reconcile net income to net cash provided by (used for) operating activities: Depreciation 11,819 11,535 Amortization, including accretion and write-off of deferred financing costs 3,464 3,503 Deferred income taxes 3,804 1,765 Earnings of equity method investee (912) (1,186) Gain on sale of fixed assets (26) (18) Share-based compensation expense 3,594 2,838 Tax benefit related to share-based compensation expense (752) (879) Gain on disposal of non-core products, net (33,599) - Change in fair value of earn-out contingent consideration 921 1,417 Changes in operating assets and liabilities, net of effect of business combination: Accounts receivable, net (13,440) (11,594) Inventories, net (21,798) (10,610) Prepaid expenses and other assets (9,678) (8,417) Accounts payable 13,604 8,678 Accrued expenses and other liabilities 242 3,379 Net cash provided by operating activities 6,664 28,911 INVESTING ACTIVITIES: Capital expenditures (17,479) (16,845) Proceeds from sale of fixed assets 49 41 Insurance proceeds for fixed assets - 1,403 Proceeds from disposal of non-core products 34,386 - Investment in venture capital fund (1,200) - Net cash provided by (used for) investing activities 15,756 (15,401) 2019 2018
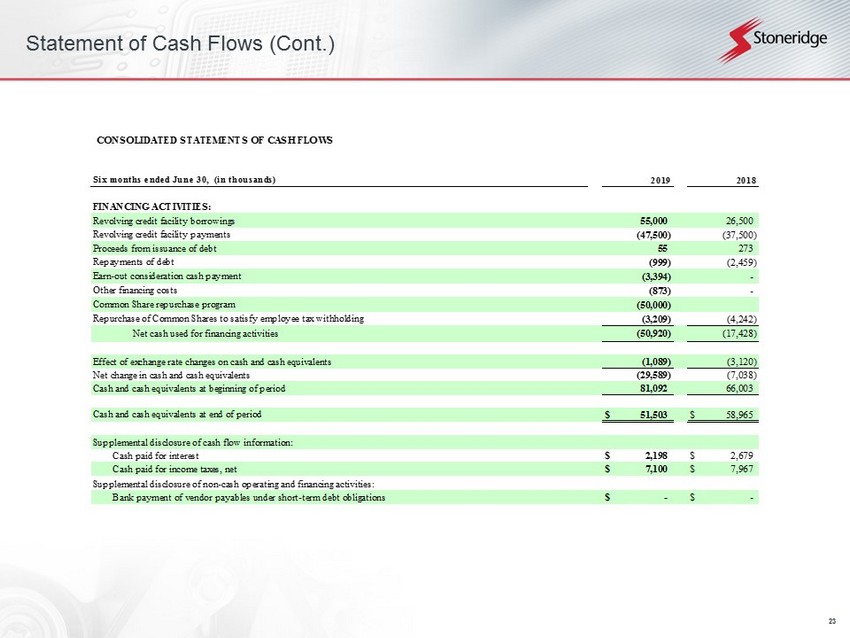
23 Statement of Cash Flows (Cont.) CONSOLIDATED STATEMENTS OF CASH FLOWS Six months ended June 30, (in thousands) FINANCING ACTIVITIES: Revolving credit facility borrowings 55,000 26,500 Revolving credit facility payments (47,500) (37,500) Proceeds from issuance of debt 55 273 Repayments of debt (999) (2,459) Earn-out consideration cash payment (3,394) - Other financing costs (873) - Common Share repurchase program (50,000) Repurchase of Common Shares to satisfy employee tax withholding (3,209) (4,242) Net cash used for financing activities (50,920) (17,428) Effect of exchange rate changes on cash and cash equivalents (1,089) (3,120) Net change in cash and cash equivalents (29,589) (7,038) Cash and cash equivalents at beginning of period 81,092 66,003 Cash and cash equivalents at end of period $ 51,503 $ 58,965 Supplemental disclosure of cash flow information: Cash paid for interest $ 2,198 $ 2,679 Cash paid for income taxes, net $ 7,100 $ 7,967 Supplemental disclosure of non-cash operating and financing activities: Bank payment of vendor payables under short-term debt obligations $ - $ - 2019 2018

24 Reconciliations to US GAAP
25 Reconciliations to US GAAP This document contains information about Stoneridge's financial results which is not presented in accordance with accounting principles generally accepted in the United States ("GAAP"). Such non - GAAP financial measures are reconciled to their closest GAAP financial measures in the appendix of this document. The provision of these non - GAAP financial measures is not intended to indicate that Stoneridge is explicitly or implicitly providing projections on those non - GAAP financial measures, and actual results for such measures are likely to vary from those presented. The reconciliations include all information reasonably available to the Company at the date of this document and the adjustments that management can reasonably predict.
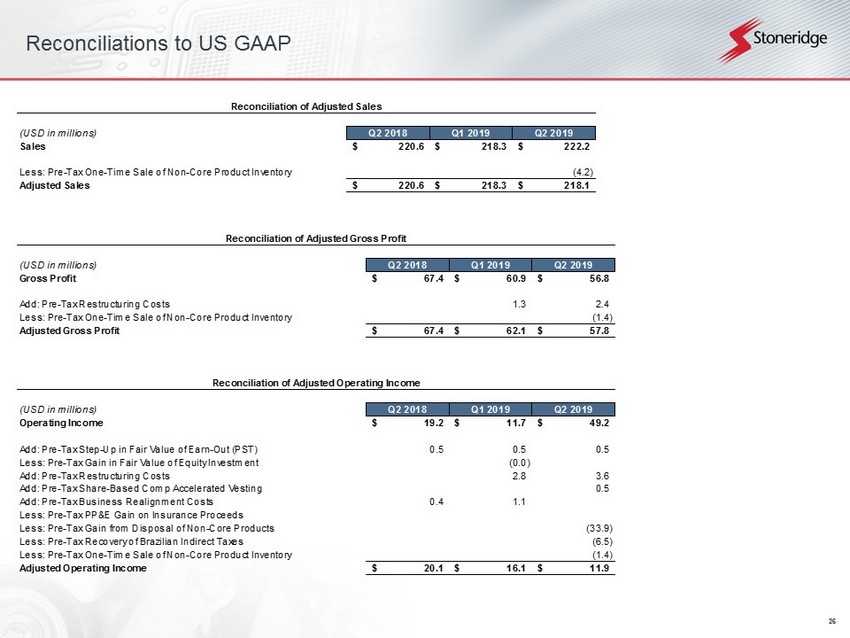
26 Reconciliations to US GAAP (USD in millions) Q2 2018 Q1 2019 Q2 2019 Sales 220.6$ 218.3$ 222.2$ Less: Pre-Tax One-Time Sale of Non-Core Product Inventory (4.2) Adjusted Sales 220.6$ 218.3$ 218.1$ Reconciliation of Adjusted Sales (USD in millions) Q2 2018 Q1 2019 Q2 2019 Gross Profit 67.4$ 60.9$ 56.8$ Add: Pre-Tax Restructuring Costs 1.3 2.4 Less: Pre-Tax One-Time Sale of Non-Core Product Inventory (1.4) Adjusted Gross Profit 67.4$ 62.1$ 57.8$ Reconciliation of Adjusted Gross Profit (USD in millions) Q2 2018 Q1 2019 Q2 2019 Operating Income 19.2$ 11.7$ 49.2$ Add: Pre-Tax Step-Up in Fair Value of Earn-Out (PST) 0.5 0.5 0.5 Less: Pre-Tax Gain in Fair Value of Equity Investment (0.0) Add: Pre-Tax Restructuring Costs 2.8 3.6 Add: Pre-Tax Share-Based Comp Accelerated Vesting 0.5 Add: Pre-Tax Business Realignment Costs 0.4 1.1 Less: Pre-Tax PP&E Gain on Insurance Proceeds Less: Pre-Tax Gain from Disposal of Non-Core Products (33.9) Less: Pre-Tax Recovery of Brazilian Indirect Taxes (6.5) Less: Pre-Tax One-Time Sale of Non-Core Product Inventory (1.4) Adjusted Operating Income 20.1$ 16.1$ 11.9$ Reconciliation of Adjusted Operating Income
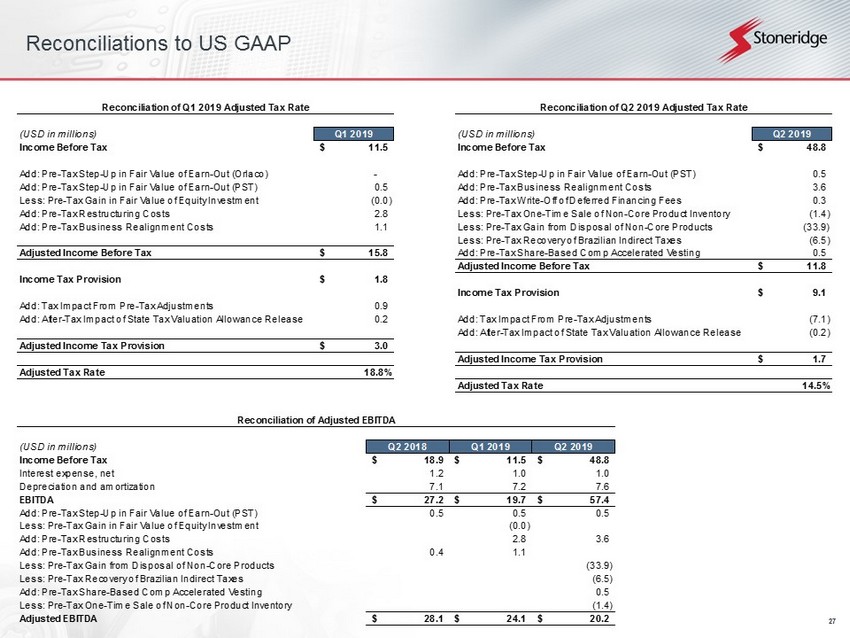
27 Reconciliations to US GAAP (USD in millions) Q1 2019 Income Before Tax 11.5$ Add: Pre-Tax Step-Up in Fair Value of Earn-Out (Orlaco) - Add: Pre-Tax Step-Up in Fair Value of Earn-Out (PST) 0.5 Less: Pre-Tax Gain in Fair Value of Equity Investment (0.0) Add: Pre-Tax Restructuring Costs 2.8 Add: Pre-Tax Business Realignment Costs 1.1 Adjusted Income Before Tax 15.8$ Income Tax Provision 1.8$ Add: Tax Impact From Pre-Tax Adjustments 0.9 Add: After-Tax Impact of State Tax Valuation Allowance Release 0.2 Adjusted Income Tax Provision 3.0$ Adjusted Tax Rate 18.8% Reconciliation of Q1 2019 Adjusted Tax Rate (USD in millions) Q2 2019 Income Before Tax 48.8$ Add: Pre-Tax Step-Up in Fair Value of Earn-Out (PST) 0.5 Add: Pre-Tax Business Realignment Costs 3.6 Add: Pre-Tax Write-Off of Deferred Financing Fees 0.3 Less: Pre-Tax One-Time Sale of Non-Core Product Inventory (1.4) Less: Pre-Tax Gain from Disposal of Non-Core Products (33.9) Less: Pre-Tax Recovery of Brazilian Indirect Taxes (6.5) Add: Pre-Tax Share-Based Comp Accelerated Vesting 0.5 Adjusted Income Before Tax 11.8$ Income Tax Provision 9.1$ Add: Tax Impact From Pre-Tax Adjustments (7.1) Add: After-Tax Impact of State Tax Valuation Allowance Release (0.2) Adjusted Income Tax Provision 1.7$ Adjusted Tax Rate 14.5% Reconciliation of Q2 2019 Adjusted Tax Rate (USD in millions) Q2 2018 Q1 2019 Q2 2019 Income Before Tax 18.9$ 11.5$ 48.8$ Interest expense, net 1.2 1.0 1.0 Depreciation and amortization 7.1 7.2 7.6 EBITDA 27.2$ 19.7$ 57.4$ Add: Pre-Tax Step-Up in Fair Value of Earn-Out (PST) 0.5 0.5 0.5 Less: Pre-Tax Gain in Fair Value of Equity Investment (0.0) Add: Pre-Tax Restructuring Costs 2.8 3.6 Add: Pre-Tax Business Realignment Costs 0.4 1.1 Less: Pre-Tax Gain from Disposal of Non-Core Products (33.9) Less: Pre-Tax Recovery of Brazilian Indirect Taxes (6.5) Add: Pre-Tax Share-Based Comp Accelerated Vesting 0.5 Less: Pre-Tax One-Time Sale of Non-Core Product Inventory (1.4) Adjusted EBITDA 28.1$ 24.1$ 20.2$ Reconciliation of Adjusted EBITDA

28 Reconciliations to US GAAP (USD in millions) Q1 2019 Q1 2019 EPS Net Income 9.7$ 0.33$ Add: After-Tax Step-Up in Fair Value of Earn-Out (PST) 0.5 0.02 Less: After-Tax Gain in Fair Value of Equity Investment (0.0) (0.00) Add: After-Tax Restructuring Costs 2.1 0.07 Less: After-Tax Impact of State Tax Valuation Allowance Release (0.2) (0.01) Add: After-Tax Business Realignment Costs 0.9 0.03 Adjusted Net Income 12.9$ 0.44$ Reconciliation of Q1 2019 Adjusted EPS (USD in millions) Q2 2019 Q2 2019 EPS Net Income 39.8$ 1.41$ Add: After-Tax Step-Up in Fair Value of Earn-Out (PST) 0.5 0.02 Add: After-Tax Restructuring Costs 2.7 0.10 Add: After-Tax Write-Off of Deferred Financing Fees 0.2 0.01 Add: After-Tax Share-Based Comp Accelerated Vesting 0.4 0.01 Add: After-Tax Impact of State Tax Valuation Allowance Release 0.2 0.01 Less: After-Tax Gain from Disposal of Non-Core Products (26.9) (0.95) Less: After-Tax One-Time Sale of Non-Core Product Inventory (1.1) (0.04) Less: After-Tax Recovery of Brazilian Indirect Taxes (5.6) (0.20) Adjusted Net Income 10.1$ 0.36$ Reconciliation of Q2 2019 Adjusted EPS

29 Reconciliations to US GAAP (USD in millions) Q2 2018 Q2 2019 Adjusted Sales 220.6$ 218.1$ Less: Pre-Tax Impact from Disposed Non-Core Products (11.2) (9.1) Adjusted Sales Excluding Disposed Non-Core Products 209.4$ 209.0$ Reconciliation of Adjusted Sales Excluding Disposed Non-Core Products (USD in millions) Q2 2018 Q2 2019 Adjusted Gross Profit 67.4$ 57.8$ Less: Pre-Tax Impact from Disposed Non-Core Products (3.3) - Adjusted Gross Profit Excluding Disposed Non-Core Products 64.1$ 57.8$ Reconciliation of Adjusted Gross Profit Excluding Disposed Non-Core Products (USD in millions) Q2 2018 Q2 2019 Adjusted Operating Income 20.1$ 11.9$ Less: Pre-Tax Impact from Disposed Non-Core Products (2.3) - Adjusted Operating Income Excluding Disposed Non-Core Products 17.8$ 11.9$ Reconciliation of Adjusted Operating Income Excluding Disposed Non-Core Products (USD in millions) Q2 2018 Q2 2019 Adjusted EBITDA 28.1$ 20.2$ Less: Pre-Tax Impact from Disposed Non-Core Products (2.3) - Adjusted EBITDA Excluding Disposed Non-Core Products 25.8$ 20.2$ Reconciliation of Adjusted EBITDA Excluding Disposed Non-Core Products

30 Reconciliations to US GAAP (USD in millions) Q3 2017 Q4 2017 Q1 2018 Q2 2018 TTM Q2 2018 Q3 2018 Q4 2018 Q1 2019 Q2 2019 TTM Q2 2019 Adjusted Operating Income 16.2$ 17.3$ 17.9$ 17.3$ 68.7$ 16.3$ 12.9$ 14.7$ 12.9$ 56.7$ Less: Pre-Tax Gain from Disposed Non-Core Products (1.7) (1.9) (2.4) (2.3) (8.3) (2.3) (2.0) (2.4) - (6.8) Adjusted Operating Income Excluding Disposed Non-Core Products 14.6$ 15.4$ 15.5$ 15.0$ 60.4$ 14.0$ 10.8$ 12.3$ 12.9$ 49.9$ Reconciliation of Control Devices Adjusted Operating Income Excluding Disposed Non-Core Products (USD in millions) Q3 2017 Q4 2017 Q1 2018 Q2 2018 TTM Q2 2018 Q3 2018 Q4 2018 Q1 2019 Q2 2019 TTM Q2 2019 Control Devices Sales 108.0$ 109.6$ 117.5$ 112.4$ 447.5$ 110.0$ 109.7$ 112.0$ 116.1$ 447.8$ Less: Pre-Tax One-Time Sale of Non-Core Product Inventory - - - - - - - - (4.2) (4.2) Adjusted Control Devices Sales 108.0$ 109.6$ 117.5$ 112.4$ 447.5$ 110.0$ 109.7$ 112.0$ 112.0$ 443.6$ Reconciliation of Control Devices Adjusted Sales (USD in millions) Q3 2017 Q4 2017 Q1 2018 Q2 2018 TTM Q2 2018 Q3 2018 Q4 2018 Q1 2019 Q2 2019 TTM Q2 2019 Adjusted Control Devices Sales 108.0$ 109.6$ 117.5$ 112.4$ 447.5$ 110.0$ 109.7$ 112.0$ 112.0$ 443.6$ Less: Pre-Tax Impact from Disposed Non-Core Products (10.9) (10.2) (11.9) (11.2) (44.2) (11.1) (10.3) (11.1) (9.1) (41.6) Adjusted Control Devices Sales Excluding Disposed Non-Core Products 97.1$ 99.4$ 105.7$ 101.2$ 403.3$ 98.9$ 99.4$ 100.9$ 102.9$ 402.1$ Reconciliation of Control Devices Adjusted Sales Excluding Disposed Non-Core Products (USD in millions) Q3 2017 Q4 2017 Q1 2018 Q2 2018 TTM Q2 2018 Q3 2018 Q4 2018 Q1 2019 Q2 2019 TTM Q2 2019 Control Devices Operating Income 16.2$ 17.3$ 17.9$ 17.2$ 68.6$ 16.3$ 12.9$ 11.9$ 44.4$ 85.5$ Add: Pre-Tax Restructuring Costs 2.2 3.5 5.7 Less: Pre-Tax Gain from Disposal of Non-Core Products (33.6) (33.6) Less: Pre-Tax One-Time Sale of Non-Core Product Inventory (1.4) (1.4) Add: Pre-Tax Business Realignment Costs 0.1 0.1 0.5 0.5 Control Devices Adjusted Operating Income 16.2$ 17.3$ 17.9$ 17.3$ 68.7$ 16.3$ 12.9$ 14.7$ 12.9$ 56.7$ Reconciliation of Control Devices Adjusted Operating Income

31 Reconciliations to US GAAP (USD in millions) Q3 2017 Q4 2017 Q1 2018 Q2 2018 TTM Q2 2018 Q3 2018 Q4 2018 Q1 2019 Q2 2019 TTM Q2 2019 Electronics Operating Income 4.9$ 4.9$ 7.9$ 8.3$ 25.9$ 9.0$ 3.1$ 9.0$ 7.6$ 28.7$ Add: Pre-Tax Step-Up in Fair Value of Earn-Out (Orlaco) 1.8 0.9 0.4 3.1 Add: Pre-Tax Restructuring Costs 0.2 0.1 0.2 Add: Pre-Tax Business Realignment Costs 1.2 0.3 1.4 (0.1) 3.4 3.4 Less: Pre-Tax PP&E Gain on Insurance Proceeds (1.9) (1.9) Electronics Adjusted Operating Income 6.7$ 5.0$ 8.2$ 8.6$ 28.5$ 8.9$ 6.5$ 9.2$ 7.7$ 32.3$ Reconciliation of Electronics Adjusted Operating Income (USD in millions) Q3 2017 Q4 2017 Q1 2018 Q2 2018 TTM Q2 2018 Q3 2018 Q4 2018 Q1 2019 Q2 2019 TTM Q2 2019 PST Operating Income 1.0$ (0.1)$ 0.2$ 0.7$ 1.8$ 0.7$ 3.4$ 0.7$ 6.4$ 11.2$ Add: Pre-Tax Step-Up in Fair Value of Earn-Out (PST) 0.5 1.9 0.5 0.5 3.4 0.5 (1.7) 0.5 0.5 (0.3) Less: Pre-Tax Recovery of Brazilian Indirect Taxes (6.5) (6.5) Add: Pre-Tax Business Realignment Costs 0.2 0.2 PST Adjusted Operating Income 1.5$ 1.9$ 0.9$ 1.3$ 5.5$ 1.2$ 1.7$ 1.1$ 0.4$ 4.4$ Reconciliation of PST Adjusted Operating Income