 Eastman’s Acquisition of Solutia: Strengthening a Top-Tier Specialty Chemical Company January 27, 2012 Exhibit 99.2 |
 Forward-Looking Statements This communication includes forward-looking statements subject to the safe harbor provisions of the federal securities laws. Forward-looking statements include, but are not limited to, statements regarding Eastman’s current expectations regarding the timing of completion of the proposed acquisition, the expected benefits of the proposed acquisition, integration plans and expected synergies therefrom, and Eastman’s anticipated future financial and operating performance and results, including estimates for general economic conditions and growth. Such expectations are based upon certain preliminary information, internal estimates, and management assumptions, expectations, and plans, and are subject to a number of risks and uncertainties inherent in projecting future conditions, events, and results. Actual results could differ materially from expectations expressed in the forward-looking statements if one or more of the underlying assumptions or expectations prove to be inaccurate or are unrealized. Important factors that could cause actual results to differ materially from such expectations are and will be detailed in the company’s filings with the Securities and Exchange Commission (“SEC”), including the Quarterly Report on Form 10-Q for the quarter ended September 30, 2011 that has been filed with the SEC, as well as the Annual Report on Form 10-K for the fiscal year ended December 31, 2011 and the proxy statement/prospectus that will be included in the Registration Statement on Form S-4 that Eastman will file with the SEC in connection with the proposed acquisition. Filings made by Eastman are available when filed with the SEC, on the Eastman web site at www.eastman.com in the Investors, SEC Information section. Additional Information and Where to Find it Eastman will file with the SEC a registration statement on Form S-4 that will include a proxy statement of Solutia and a prospectus of Eastman relating to Eastman’s proposed acquisition of Solutia. WE URGE INVESTORS AND SECURITY HOLDERS TO READ THE REGISTRATION STATEMENT AND PROXY STATEMENT/PROSPECTUS AND ANY OTHER RELEVANT DOCUMENTS WHEN THEY BECOME AVAILABLE, BECAUSE THEY WILL CONTAIN IMPORTANT INFORMATION about Eastman, Solutia, and the proposed acquisition. Investors and security holders will be able to obtain these materials (when they are available) and other documents filed with the SEC free of charge at the SEC’s website, www.sec.gov. In addition, copies of the registration statement and proxy statement/prospectus (when they become available) may be obtained free of charge by accessing Eastman’s website at www.eastman.com by clicking on the “Investors” link and then clicking on the “SEC Information” link or by writing Eastman at P.O. Box 431, Kingsport, Tennessee 37662, Attention: Investor Relations. Security holders may also read and copy any reports, statements and other information filed by Eastman with the SEC, at the SEC public reference room at 100 F Street, N.E., Washington D.C. 20549. Please call the SEC at 1-800-SEC-0330 or visit the SEC’s website for further information on its public reference room. 2 |
 3 Non-GAAP Financial Measures Certain Eastman financial measures referenced in this presentation are non-GAAP financial measures (earnings per share, operating earnings, and cash-flow from operating activities) that exclude asset impairments and restructuring charges and early debt extinguishment costs. A reconciliation to the most directly comparable GAAP financial measures and other associated disclosures, including a description of the asset impairments and restructuring charges and early debt extinguishment costs are available in our fourth- quarter and full-year financial results news release and the tables accompanying the news release available at www.investors.eastman.com. Participants in the Solicitation Eastman, Solutia, and certain of their respective directors, executive officers and other persons may be deemed to be participants in the solicitation of proxies in respect of the proposed acquisition. Information regarding Eastman’s directors and executive officers is available in Eastman’s proxy statement filed with the SEC on March 24, 2011 in connection with its 2011 annual meeting of stockholders, and information regarding Solutia’s directors and executive officers is available in Solutia’s proxy statement filed with the SEC on March 4, 2011 in connection with its 2011 annual meeting of stockholders. Other information regarding persons who may be deemed participants in the proxy solicitation and a description of their direct and indirect interests, by security holdings or otherwise, will be contained in the registration statement and proxy statement/prospectus and other relevant materials to be filed with the SEC when they become available. Non-Solicitation This communication does not constitute an offer to sell or the solicitation of an offer to buy any securities, nor shall there be any sale of securities in any jurisdiction in which such offer, solicitation, or sale would be unlawful prior to registration or qualification under the securities laws of any such jurisdiction. |
 Agenda Review of 4Q / FY 2011 Eastman results Transaction overview Strategic rationale Solutia overview and strategic fit Financial summary and EPS forecast update Summary 4 |
 4Q11 financial results – Corporate ($ in millions, except EPS) 4Q11 4Q10 Change Sales revenue $1,723 $1,463 18 % Volume effect 5 % Price effect 11 % Product mix effect 2 % Exchange rate effect -- % Operating earnings $163 $187 EPS from continuing operations $0.71 $0.70 Sales revenue increased due to: • Selling prices 11% • Sales volume 5% Operating earnings declined primarily in the Specialty Plastics and PCI segments 5 5 in response to higher raw material and energy costs primarily in PCI |
 Full-year 2011 financial results – Corporate 6 ($ in millions, except EPS) FY11 FY10 Change Sales revenue $7,178 $5,842 23 % Volume effect 7 % Price effect 14 % Product mix effect 2 % Exchange rate effect -- % Operating earnings $1,013 $891 EPS from continuing operations $4.56 $3.48 Sales revenue increased due to: • Selling prices 14% • Sales volume 7% of a previously idled olefins cracking unit, and strengthened end-use demand primarily for CASPI segment products in response to higher raw material and energy costs primarily due to growth in PCI plasticizer product lines, the restart Operating earnings increased primarily due to higher selling prices more than offsetting higher raw material and energy costs and higher sales volume |
 Eastman to acquire Solutia Transaction overview 7 Purchase price and transaction value Each Solutia share exchanged for $22.00 in cash and 0.12 share of Eastman stock ~80% cash and ~20% stock consideration $4.7 billion Total Enterprise Value • Includes $3.4 billion equity value plus net assumed Solutia debt of $1.3 billion Value of $27.65 for each Solutia share • 42% premium to the January 26, 2012 closing price of Solutia’s common stock 9.0 times 2011 EBITDA (1) Financial impact Expected to be immediately accretive to Eastman earnings, excluding acquisition-related costs and charges Cost synergies of approximately $100 million identified and expected to be achieved by year-end 2013 Significant tax benefit from utilization of Solutia NOLs Eastman free cash flow (2) over next 2 years expected to be ~$1 billion Attractive return on capital Closing conditions Solutia stockholder approval Receipt of regulatory approvals Other customary closing conditions Timing Closing expected in mid-2012 (1) Solutia EBITDA defined as net income attributable to Solutia plus loss from discontinued operations, income tax expense, interest expense, loss on debt extinguishment or modification, depreciation and amortization, events affecting comparability, non-cash share-based compensation expense and Primary Accelerators and Nylon cost overhang all as reported by Solutia. (2) Free cash flow defined as expected cash from operations minus expected capital expenditures and dividends. |
 Eastman’s strategic focus Solutia acquisition consistent with all criteria 8 Growing core businesses Bias toward emerging markets Focus on sustainable businesses Use JVA to execute our strategy • Complementary and adjacent key end markets (auto, architectural, etc.) • Combination of technology and business capabilities drive significant opportunities • ~25% of Eastman pro forma 2011 revenue was in Asia Pacific (>$2 billion) • Leverages trend of growing middle class buying premium products • Building more manufacturing capacity in Asia Pacific to meet growth • Focus includes renewable resources and product safety • Expands portfolio of sustainable products (energy efficiency and safety) |
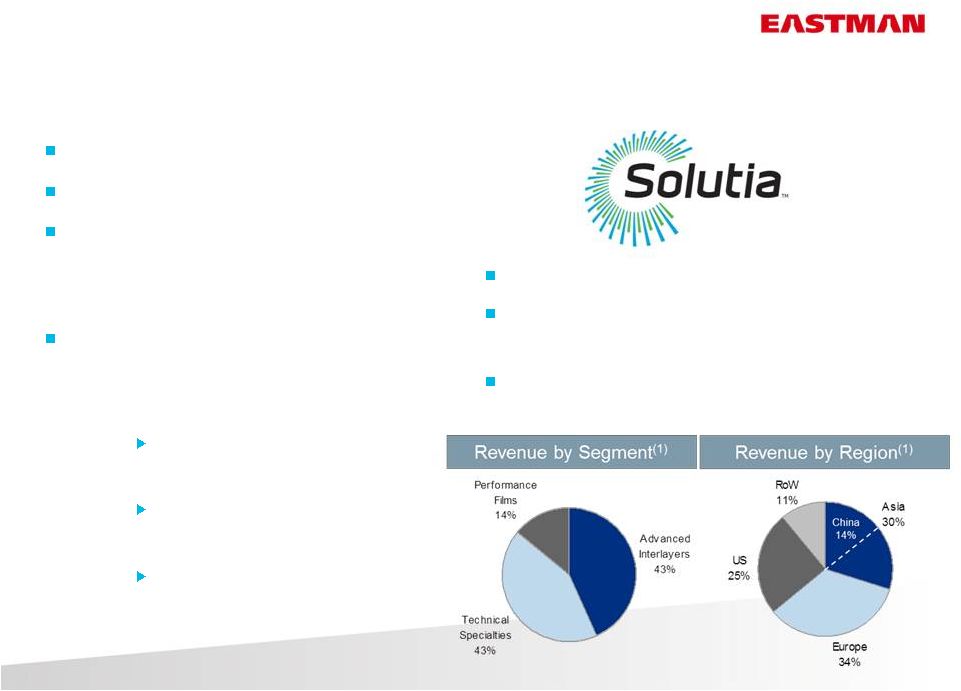 Solutia: Global leader in Specialty Chemicals and Performance Materials 9 Headquartered in St. Louis, MO 3,400 employees 24 manufacturing facilities, >30 technical centers and sales offices worldwide Operates three business segments: • Advanced Interlayers Market leader in Saflex™ • Performance Films Market leader in Llumar™ • Technical Specialties Market leader in Crystex™ NYSE: SOA 2011 revenue of $2.1 billion and EBITDA of $0.5 billion Attractive 2011 EBITDA margin of ~25% (1) Source: Solutia public filings and December 2011 Investor Day presentation |
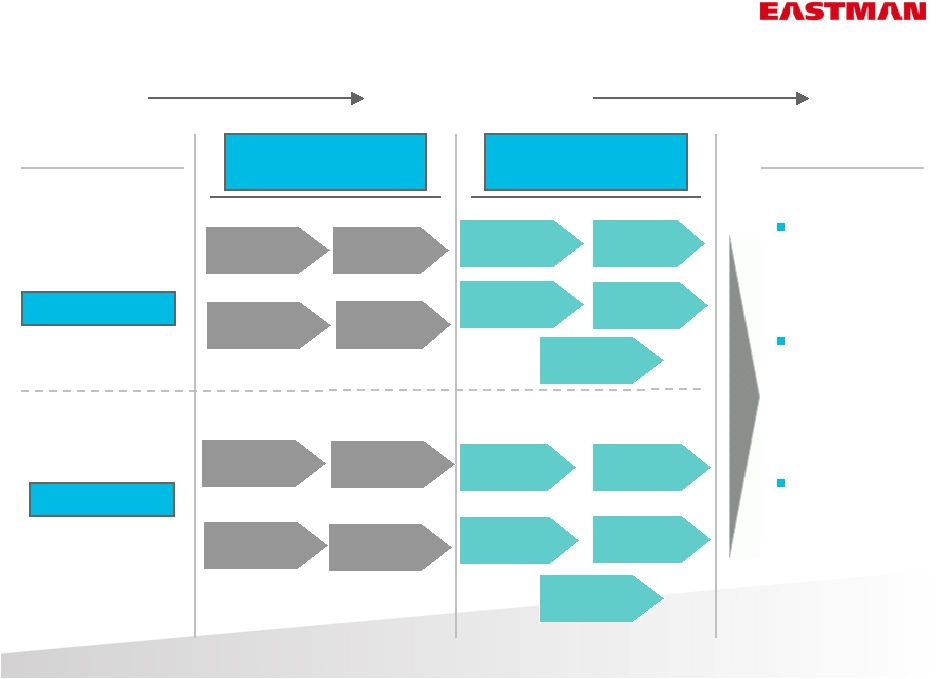 10 Solutia Eastman Exited Commodity and Non-Core Businesses Key Investments in High Margin, Specialty Focused Businesses 2001 2012 Beaumont, TX Gasification Project CASPI Under- performing Lines Polyethylene PET Nylon Acrylic Fibers Ingredients Pharma Dequest UK & Korea Filter Tow Expansion Hercules Adhesives Sterling Chemicals Genovique Specialties Southwall Flexsys EVA / Solar Saflex Expansion Suzhou & Kuantan Investments Strategic Improvement Tritan™ Copolyester Expansion Strategic actions improved portfolios Market- leading, competitive positions in key products Focus on superior financial performance Combining two strong companies |
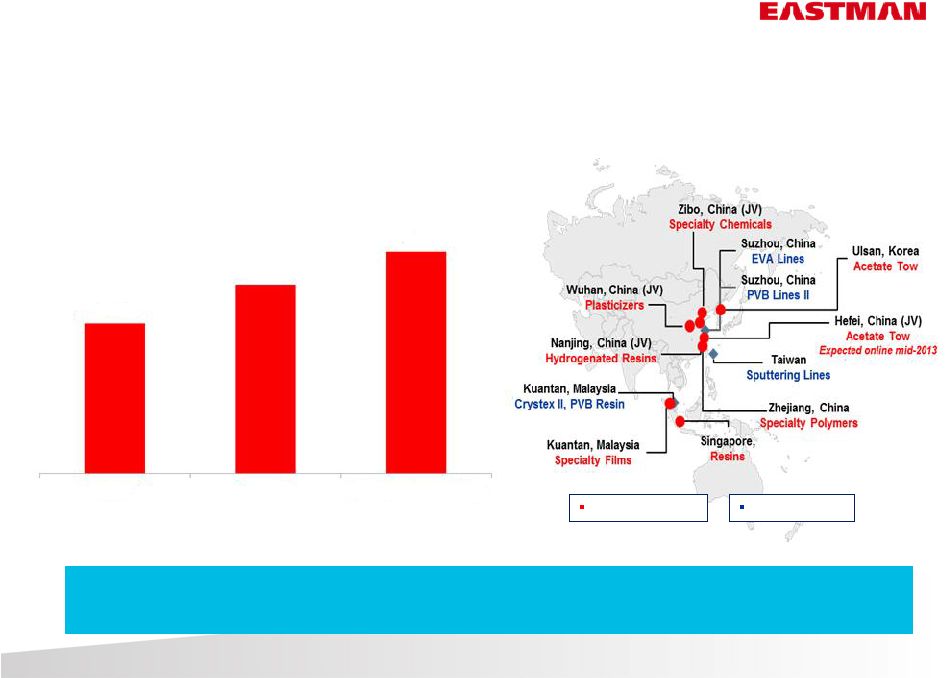 Solutia acquisition accelerates Eastman’s growth investment in Asia Pacific 11 Source: Eastman and Solutia Growing Presence in Asia-Pacific % of Total Revenue Eastman Asia Pacific revenue expected to grow from ~$1.7 billion in 2011 to >$3 billion in 2015 and higher than corporate EBITDA margins Eastman Site Solutia Site 19% 23% 28% 2008 2011 2015E post acquisition |
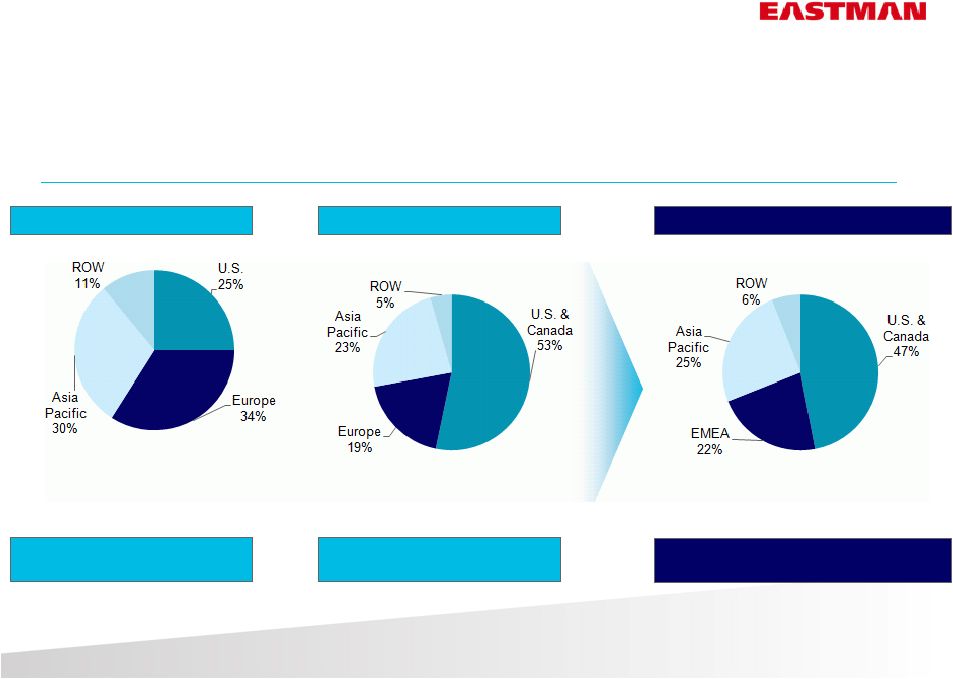 Eastman pro forma 2011 revenue by geography Geographic diversity remains a source of strength 12 Solutia Eastman pro forma Eastman Solutia 2011 revenue: $2 billion Eastman 2011 revenue: $7 billion Eastman pro forma 2011 revenue: $9 billion 2011 revenue by geography Source: Eastman public filings and Solutia’s December 2011 Investor Day presentation |
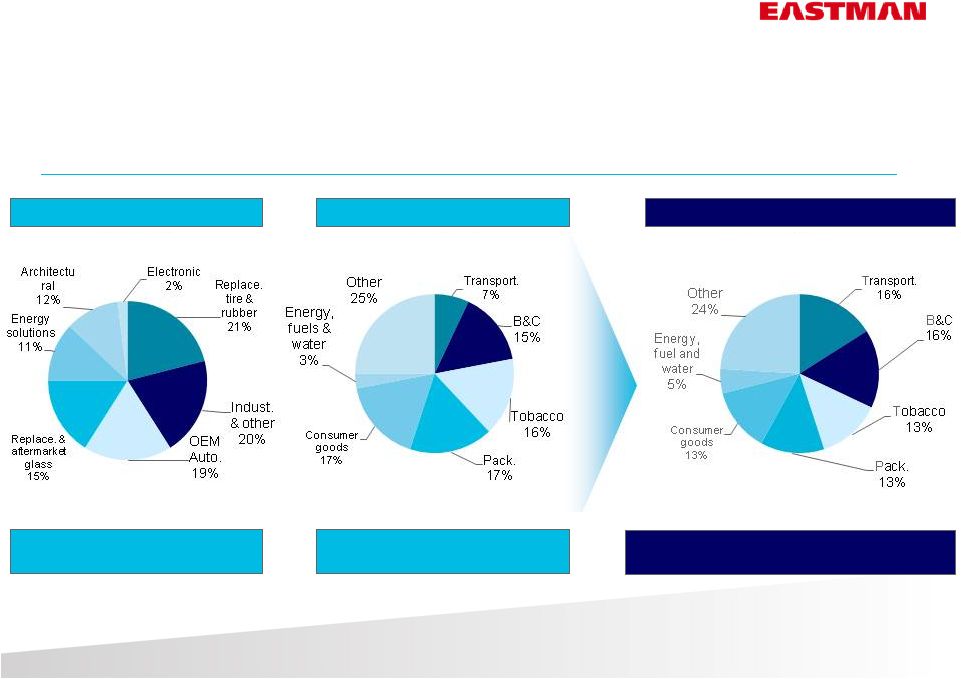 Eastman pro forma 2011 revenue by end-market End-market diversity remains a source of strength 13 Solutia Eastman pro forma Eastman Solutia 2011 revenue: $2 billion Eastman 2011 revenue: $7 billion Eastman pro forma 2011 revenue: $9 billion 2011 revenue by end-market Source: Eastman public filings and Solutia’s December 2011 Investor Day presentation |
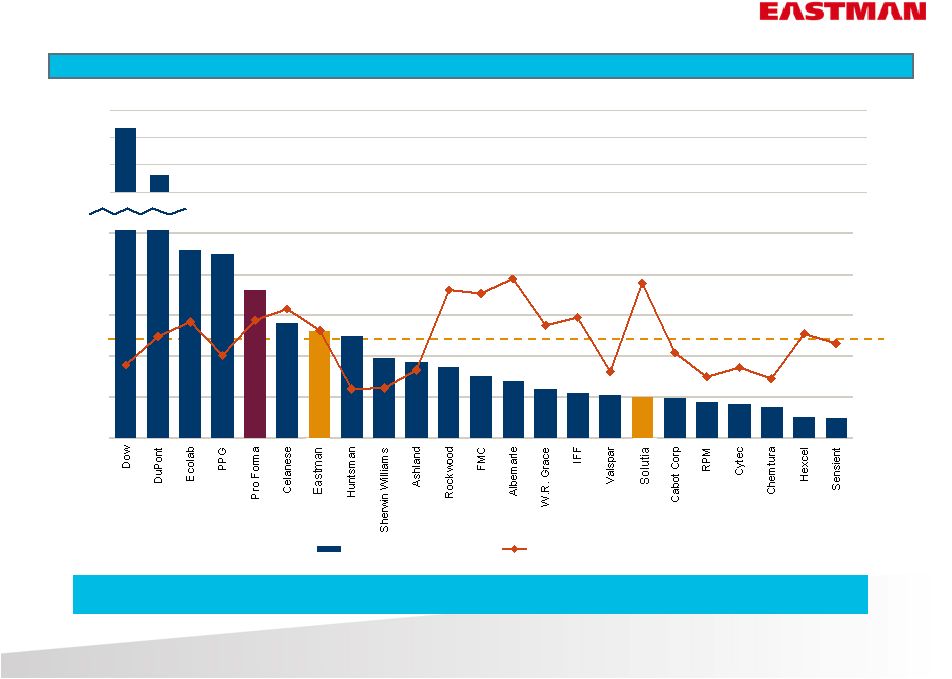 $6,000 $7,000 $8,000 $9,000 EBITDA 2011E EBITDA Margin Top-tier Specialty Chemical Company 14 Source: IBES consensus estimates, for all other than Eastman, Solutia, and Pro Forma; Eastman and Solutia from public filings Mean peer Margin 17.1% 2011 EBITDA and EBITDA Margins 2011 Eastman pro forma EBITDA $1.8 billion with ~20% EBITDA margin $0 $500 $1,000 $1,500 $2,000 $2,500 5% 10% 15% 20% 25% 30% EBITDA EBITDA Margin |
 Attractive capital structure Benefits from low cost interest environment 15 Expect new debt financing will be composed of low-interest term loan and public debt Bridge facility financing commitments in place from Citi and Barclays Eastman pro forma Debt / EBITDA ratio expected at closing of ~2.8 Eastman pro forma expected to generate ~$1 billion of free cash flow over next two years • Expected cash flows and synergies to allow Eastman to delever quickly Revolving facility of $750 million to remain undrawn at closing Committed to maintaining current annual dividend rate of $1.04 per share Eastman is committed to maintaining an investment grade credit rating Cash from Solutia and Eastman $ 600 New debt financing $3,500 Eastman equity issued to Solutia stockholders $ 700 $ in millions |
 16 Achievable cost and tax synergies as well as potential revenue opportunities Track record from previous acquisitions and divestitures gives us confidence in ability to realize synergies ~$100 million identified • Reduction of corporate costs • Raw material and procurement savings • Improved manufacturing and supply chain processes Leveraging technology from both companies Leveraging complementary business capabilities Leveraging key end- market overlap Cost synergies Tax synergies Revenue synergies ~$1.5 billion of NOL benefits Eastman expects to utilize over next 15 years, half in next 3 years ~$150 million Foreign Tax Credits that Eastman expects to utilize over next 10 years Geographic profile and entity structure expected to enable Eastman to reduce effective tax rate |
 Clear path to completion Solutia stockholder approval Receipt of necessary regulatory approvals Completion of standard and customary closing conditions • No financing contingency • Termination fee of $102 million 17 Expected to close by mid-2012 |
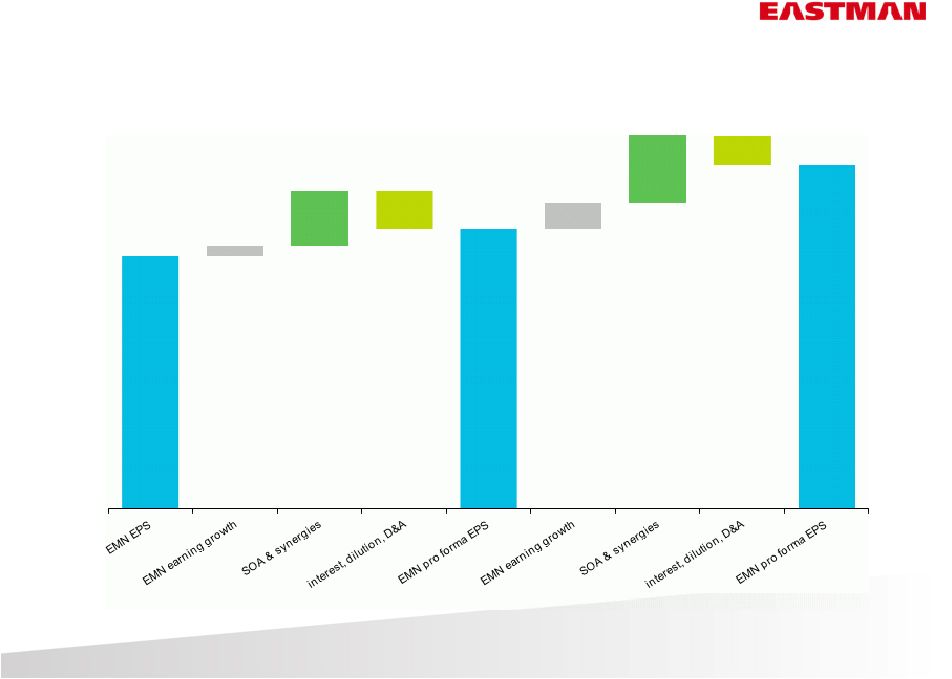 Acquisition expected to result in strong 2013 EPS growth Note: earnings per share estimates exclude acquisition related costs and charges 2011 $/share $4.56 ~$5.00 >$6.00 2011 18 2012E 2013E |
 Eastman + Solutia = A compelling value Complementary and adjacent key end-markets Combination of technology and business capabilities drive significant opportunities Expands presence in emerging markets, particularly Asia Pacific Clearly defined, executable cost and tax synergies Committed to investment grade credit rating Attractive return on capital Expect significant EPS accretion 19 |
 Appendix |
 4 th -Quarter and Full-Year 2011 Financial Results |
 2011 accomplishments 22 Second consecutive year of increased earnings per share and operating earnings for Eastman and for each of the four businesses Sales revenue increased 23% Continued progress on growth initiatives • Acquired Sterling Chemicals, Scandiflex, and Dynaloy • Completed capacity expansions for Regalite TM adhesives and first phase of CHDM monomer for copolyesters • Broke ground on acetate tow joint venture with China National Tobacco Corporation Free cash flow $142 million Returned cash to stockholders with dividend increases and share repurchases Note: Free cash flow is defined as cash from operations less capital expenditures and dividends, excluding the tax payment for the gain on the sale of the PET business completed first quarter 2011. |
 Update on 2011 outlook statements 23 4Q11 EPS expected to be higher than 4Q10 EPS of $0.70 Full-year 2011 EPS expected to be approximately $4.62 Expect 2011 free cash flow to be between $175 - $200 million Expect to make 2-3 acquisitions in 2011 Allocation of capital will continue to be disciplined 23 |
 Financial results – CASPI ($ in millions) 4Q11 4Q10 Change FY11 FY10 Change Sales revenue $425 $379 12 % $1,844 $1,574 17 % Volume effect 3 % 5 % Price effect 10 % 13 % Product mix effect -- % (1 %) Exchange rate effect (1 %) -- % Operating earnings $52 $53 $331 $299 4Q11 operating earnings relatively flat FY11 operating earnings increased primarily due to higher selling prices, higher sales volume, and the benefits from cracking propane, which more than offset higher raw material and energy costs Expect 2012 operating earnings to be approximately $350 million 1 1 Does not include projected results from Solutia businesses 24 |
 Financial results – Fibers ($ in millions) 4Q11 4Q10 Change FY11 FY10 Change Sales revenue $324 $300 8 % $1,279 $1,142 12 % Volume effect 1 % 3 % Price effect 5 % 4 % Product mix effect 2 % 5 % Exchange rate effect -- % -- % Operating earnings $80 $78 $346 $326 4Q11 operating earnings increased primarily due to higher acetate tow sales volume FY11 operating earnings increased primarily due to higher acetate tow sales volume and higher selling prices more than offsetting higher raw material and energy costs Expect 2012 operating earnings to be slightly higher than 2011 1 1 Does not include projected results from Solutia businesses 25 |
 Financial results – PCI 26 ($ in millions) 4Q11 4Q10 Change FY11 FY10 Change Sales revenue $697 $526 33 % $2,860 $2,083 37 % Volume effect 15 % 14 % Price effect 14 % 19 % Product mix effect 4 % 4 % Exchange rate effect -- % -- % Operating earnings $42 $51 $296 $231 4Q11 operating earnings declined as higher selling prices were more than offset by higher raw material and energy costs, particularly in Asia Pacific and Europe FY11 operating earnings increased, particularly in North America, primarily due to higher selling prices, higher sales volume, and the increased benefits from cracking propane to produce low-cost propylene, which more than offset higher raw material and energy costs Expect 2012 operating earnings to be approximately $320 million 1 1 Does not include projected results from Solutia businesses |
 Financial results – Specialty Plastics 27 ($ in millions) 4Q11 4Q10 Change FY11 FY10 Change Sales revenue $277 $258 7 % $1,195 $1,043 15 % Volume effect (9 %) (2 %) Price effect 14 % 16 % Product mix effect 2 % 1 % Exchange rate effect -- % -- % Operating earnings $9 $24 $105 $93 4Q11 operating earnings declined due to lower sales volume and lower capacity utilization due to weakened demand for copolyester product lines and inventory management during and after planned maintenance shutdowns FY11 operating earnings increased primarily due to higher selling prices more than offsetting higher raw material and energy costs and the positive impact of Tritan™ copolyester growth initiative Expect 2012 operating earnings to be approximately $120 million 1 1 Does not include projected results from Solutia businesses |
 4 th -Quarter and Full-Year 2011 Financial Results Curt Espeland, Sr. VP and CFO |
 Full-year 2011 financial highlights 29 Cash from operations of $625 million • $735 excluding impact of tax payment on the sale of the PET business • Working capital increased by $280 million Capital expenditures $457 million Generated $142 million of free cash flow Note: Free cash flow is defined as cash from operations less capital expenditures and dividends, excluding the tax payment for the gain on the sale of the PET business completed first quarter 2011. |
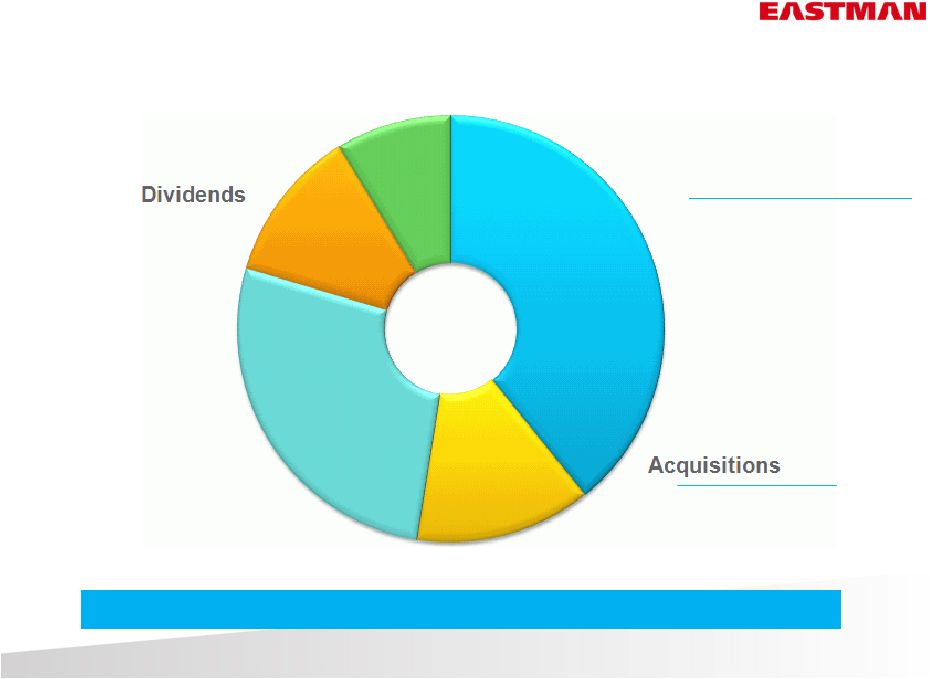 Balanced capital allocation in 2011 30 Supporting earnings growth and returning cash to stockholders Sterling Chemicals Scandiflex Dynaloy Capital expenditures Tritan™ copolyester expansion CHDM monomer expansion CTA expansion Regalite™ expansion 2-EH expansion Share repurchases U.S. pension contributions $457 m $316 m $102 m $136 m $156 m |
 4 th -Quarter and Full- Year 2011 Financial Results Jim Rogers, President and CEO Curt Espeland, Senior Vice President and CFO January 27, 2012 |