![]() Q4 2014 EARNINGS REVIEW February 24, 2015 Exhibit 99.2 |
![]() 2 FORWARD-LOOKING STATEMENTS This presentation contains “forward-looking statements” within the meaning of the Private Securities Litigation Reform Act of 1995. These statements relate to future events, are not historical facts and are based on our current expectations and assumptions regarding our business, the economy and other future conditions. These statements can generally be identified by lead-in words such as “believe”, “expect”, “anticipate”, “intend”, “plan”, “foresee”, “may” ,”will” and other similar words. Statements that describe our Company’s objectives, plans or goals are also forward-looking statements. Examples of such forward- looking information we may be discussing in this presentation include, without limitation, anticipated 2014 industry new vehicle sales volume, the implementation of growth and operating strategies, including acquisitions of dealerships and properties, the development of open points and stand-alone pre-owned stores, the return of capital to shareholders , anticipated future success and impacts from the implementation of our strategic initiatives and earnings per share expectations. You are cautioned that these forward-looking statements are not guarantees of future performance, involve risks and uncertainties and actual results may differ materially from those projected in the forward-looking statements as a result of various factors. These risks and uncertainties include, among other things, (a) economic conditions in the markets in which we operate, (b) the success of our operational strategies, (c) our relationships with the automobile manufacturers, (d) new and pre-owned vehicle sales volume, and (e) earnings expectations for the year ended December 31, 2014. These risks and uncertainties, as well as additional factors that could affect our forward-looking statements, are described in our Form 10-K for the year ending December 31, 2013. These forward-looking statements, risks, uncertainties and additional factors speak only as of the date of this presentation. We undertake no obligation to update any such statements. |
![]() CONTENT • STRATEGIC FOCUS • FINANCIAL RESULTS • OPERATIONS REVIEW • SUMMARY AND OUTLOOK 3 |
![]() 4 STRATEGIC FOCUS 1. Growth • One Sonic-One Experience • EchoPark ® • Acquisitions & Open Points 2. Own Our Properties 3. Return Capital to Shareholders |
![]() STRATEGIC FOCUS ONE SONIC-ONE EXPERIENCE 5 • Goals – 1 Associate, 1 Price, 1 Hour – Improve Transparency; Increase Trust – Operational Efficiencies • Pilot Stores Underway • 24 Month Implementation Result - Increase Market Share and Customer Retention |
![]() 6 STRATEGIC FOCUS ONE SONIC-ONE EXPERIENCE (cont’d) Speed Up the Transaction No Negotiation Reduce Paperwork Electronic Signature One Associate One Guest Technology Driven Training Supported Reduce Headcount Through Attrition Creates Significant Cost Savings Create Trust & Transparency Increased CSI, ASI and Market Share Brand the Retail Stores Increased Market Share & Margins Creates More of a Specialty Retail Experience Apple, Starbucks, etc. |
![]() 7 STRATEGIC FOCUS EchoPark ® • Hub Opened November 3 • 2 Neighborhood Stores Opened in January 2015 • Expect at least 2 more in 2015 |
![]() 8 STRATEGIC FOCUS ACQUISITIONS & OPEN POINTS • Purchased Four Franchises: Jaguar (Q1), Nissan (Q3), Chevy and Land Rover (Q4) during 2014 – Estimated Annual Revenues of $156 million • Open Points – Mercedes Benz in Dallas Market – Audi in Pensacola Market – Nissan in TN Market – Exploring Opportunities in Other Markets |
![]() 9 STRATEGIC FOCUS OWN OUR PROPERTIES 2007 2008 2011 2012 2013 2014 Proj. - 2017 0% 12% 18% 23% 31% 36% 49% |
![]() 10 STRATEGIC FOCUS RETURN CAPITAL TO SHAREHOLDERS • Unused Authorization of Approximately $ 79 million • Quarterly Dividend of $0.025 Per Share Shares (in thousands) Average Price / Share $ (in millions) 2014 Activity 2,256 $ 23.51 $ 53.0 |
![]() Q4 & FY 2014 FINANCIAL REVIEW |
![]() ADJUSTED Q4 & FY 2014 RESULTS B/(W) than Q4 2013 B/(W) than 2013 (amounts in millions, except per share data) Q4 2014 $ % 2014 $ % Revenue $ 2,352 $ 36 1.6% $ 9,197 $ 354 4.0% Gross Profit $ 349 $ 10 2.9% $ 1,366 $ 64 4.9% Operating Profit (1) $ 70 $ 1 1.4% $ 235 ($ 10) (4.1%) Interest & Other (1) ($ 17) $ 1 7.4% ($ 72) $ 5 6.1% Continuing Ops: Profit (after tax) (1) $ 33 ($3) (8.5%) $ 100 ($ 8) (7.7%) Diluted EPS (1) $ 0.63 ($ 0.04) (6.0%) $ 1.90 ($ 0.13) (6.0%) SG&A as % of Gross (1) 75.5% (30 bps) 78.6% (150 bps) Discontinued Ops Profit/(Loss) (after tax) ($ 1) $ 1 ($2 ) $ 1 12 (1) – Amounts are adjusted. See appendix for reconciliation of adjusted amounts to GAAP amounts |
![]() 13 (amounts in millions, except per share date) Q4 2014 Q4 2013 Pre-Tax EPS Pre-Tax EPS Reported EPS $ 0.52 $ 0.55 Storm Damage $ 1.5 $ 0.03 $ 0.0 $ 0.00 Gain on Disposal ($ 0.2) ($ 0.00) $ 0.0 $ 0.00 Impairment $ 6.4 $ 0.08 $ 9.9 $ 0.12 Adjusted EPS $ 0.63 $ 0.67 EchoPark $ 7.1 $ 0.08 $ 2.2 $ 0.03 Comparable EPS $ 0.71 $ 0.70 EPS WALK– Q4 |
![]() EPS WALK– FY 2014 14 (amounts in millions, except per share date) 2014 2013 Pre-Tax EPS Pre-Tax EPS Reported EPS $ 1.87 $ 1.59 Storm Damage $ 4.0 $ 0.05 $ 0.0 $ 0.00 Legal $ 1.1 $0.01 $ 0.0 $ 0.00 Gain on Disposal ($ 10.7) ($ 0.11) $ 0.0 $ 0.00 Impairment $ 6.6 $ 0.08 $ 9.9 $ 0.11 Debt Refi $ 0.0 $ 0.00 $ 29.0 $ 0.33 Adjusted EPS $ 1.90 $ 2.03 EchoPark® $ 15.7 $ 0.18 $ 5.5 $ 0.07 Comparable EPS $ 2.08 $ 2.10 |
![]() ECHOPARK – Q4 & FY 2014 RESULTS 15 (amounts in millions, except per share data) Q4 2014 B/(W) than Q4 2013 FY 2014 B/(W) than FY 2013 Revenue $ 5.4 $ 5.4 $ 5.4 $ 5.4 Gross Profit $ 0.5 $ 0.5 $ 0.5 $ 0.5 Operating Profit ($ 7.0) ($ 4.8) ($ 15.6) ($ 10.1) Interest & Other ($0.1 ) ($ 0.1) ($ 0.1) ($ 0.1) Pre-tax Profit (Loss) ($ 7.1) ($ 4.9) ($ 15.7) ($ 10.2) |
![]() ADJUSTED SG&A TO GROSS 16 75.5% 75.2% Note: See Appendix for reconciliation to GAAP amounts 78.6% 77.1% Q4 2014 Q4 2013 FY 2014 FY 2013 4.4% 4.5% 4.2% 4.3% 44.6% 44.7% 46.8% 46.2% 7.6% 7.5% 7.8% 8.1% 18.9% 18.5% 19.8% 18.5% Advertising Comp Rent & Related Other |
![]() SG&A TO GROSS WALK – Q4 17 Note: See Appendix for reconciliation to GAAP amounts Q4 2014 Adjusted Less: EchoPark Less: OSOE Less: Centralization Q4 2014 Adj for Initiatives 75.5% (1.9%) (1.1%) (0.3%) 72.2% 210 bps Better than Q4 2013 of 74.3% |
![]() SG&A TO GROSS WALK – FY 2014 18 Note: See Appendix for reconciliation to GAAP amounts FY 2014 Adjusted Less: EchoPark Less: OSOE Less: Centralization FY 2014 Adj for Initiatives 78.6% (1.1%) (0.8%) (0.2%) 76.5% |
![]() STRATEGIC INITIATIVE INVESTMENTS 19 (in millions) 2014 Estimated 2015 EchoPark® $ 15.7 $ 13.3 One Sonic-One Experience $ 10.4 $ 10.0 Centralization of Business Office $ 2.1 $ 5.0 |
![]() CAPITAL SPEND (amounts in millions) YTD 2014 Estimated 2015 Real Estate & Facility Related $ 124.3 $159.1 All Other Cap Ex 39.6 42.0 Subtotal $ 163.9 $ 201.1 Less: Mortgage Funding (44.4) (100.6) Total Cash Used – Cap Ex $ 119.5 $ 100.5 Note – Spending excludes the effect of franchise acquisitions. 20 |
![]() LIQUIDITY (amounts in millions) Q4 2014 Q4 2013 Cash $ 4.2 $3.0 Revolver Availability 165.4 126.0 Used floor plan availability 22.6 27.1 Floor plan deposit balance 57.5 65.0 Total $ 249.7 $221.1 21 |
![]() DEBT COVENANTS Covenant Actual Q4 2014 Liquidity Ratio >= 1.05 1.20 Fixed Charge Coverage Ratio >= 1.20 1.61 Total Lease Adjusted Leverage Ratio <= 5.50 4.12 Compliant with all Covenants 22 |
![]() OPERATIONS REVIEW |
![]() NEW VEHICLE RETAIL SAME STORE Q4 2014 Q4 2013 B/(W) Volume 34,371 32,756 4.9% Selling Price $ 38,571 $ 38,287 0.7% Gross Margin % 5.9% 6.4% (50 bps) GPU $ 2,269 $ 2,435 ($ 166) Gross Profit $ 78 million $ 80 million (2.2%) SAAR (includes fleet) 16.8 million 15.6 million 7.2% 24 |
![]() 25 Q4 REVENUE MIX Industry Growth Ford (0.7%) GM (includes Cadillac) 8.7% Chrysler 21.0% Honda 3.3% Toyota 7.4% Nissan 7.1% MB 0.8% BMW 6.7% Lexus 9.2% Audi 16.9% Ford, 7.1% GM (includes Cadillac), 7.8% Chrysler, 0.0% Honda, 22.3% Toyota, 14.0% Nissan, 0.0% Other Import, 6.1% MB, 8.5% BMW, 19.1% Lexus, 5.0% Audi, 3.6% Other Luxury, 6.5% |
![]() Q4 2014 vs. Q4 2013 NEW VEHICLE - BRAND 18.7% 8.0% 2.3% 7.0% 5.4% 22.5% 4.8% 13.8% 4.0% % Sonic Unit Sales BMW MB Cadillac Ford GM Honda Lexus Toyota Audi 21% (1%) (12%) (5%) 10% 7% 2% 5% 16% 7% 1% (13%) (1%) 10% 3% 9% 7% 17% Sonic Industry 26 |
![]() USED VEHICLE RETAIL SAME STORE Q4 2014 Q4 2013 B/(W) Retail Volume 25,784 25,322 1.8% Used Retail GPU $ 1,433 $ 1,353 $ 80 Used to New 0.75 : 1 0.77 : 1 (0.02) Vehicles / store / month (all stores) 88 86 2 27 |
![]() FIXED OPS SAME STORE 28 QTD YOY Gross Profit Change Breakdown: Q4 2014 B/(W) than 2013 (amounts in millions) $ % Revenue $ 318.0 $ 11.9 3.9% Gross Profit $ 153.7 $ 6.5 4.4% • Customer Pay Up 0.1% • Whsl. Parts Up 1.6% • Internal & Sublet Up 8.1% • Warranty Up 12.1% |
![]() OSOE |
![]() 30 OSOE • Low turnover as a result of the changes • January is our first full month and share is reacting positively • We are easily doing deals in less than an hour if that is a guest wish • Customer feedback is fantastic • Our training is excellent • We are attracting a new type of employee • New CRM tool and Showroom technology is working properly and a competitive advantage • Competition is reacting to our moves – pricing and advertising • F&I continues to improve • Marketing begins in February for the Charlotte Market • No plans to move to next market until Charlotte share and profit goals are met • Website performance issues (resolved) • SEO/SEM performance issues (improving) • BDC / GEC conversion (improving) • Pricing tool is not complete (new car – 90 days out) • Inventory purchase tool not complete (new car - 6 months out) EARLY OBSERVATIONS OPPORTUNITIES |
![]() 31 OSOE – MARKET SHARE Market Share is Stabilizing 17.8% 14.4% 13.2% 12.9% 14.2% 13.1% 14.6% 18.0% 20.8% 15.8% 16.0% 15.1% 15.8% 10.0% 12.0% 14.0% 16.0% 18.0% 20.0% 22.0% Jan-14 Feb-14 Mar-14 Apr-14 May-14 Jun-14 Jul-14 Aug-14 Sep-14 Oct-14 Nov-14 Dec-14 Jan-15 Town & Country Toyota • October 2014 - T&C Toyota Soft Open • November 2014 – First Full Month for Toyota • December 2014 – Other Charlotte Stores Soft Open • January 2015 – First Full Month for Other Charlotte Stores |
![]() 32 OSOE – MARKET SHARE 20.6% 17.7% 19.5% 18.3% 17.0% 16.9% 13.9% 18.5% 17.3% 12.3% 16.0% 13.3% 15.9% 10.0% 15.0% 20.0% 25.0% 30.0% Jan-14 Feb-14 Mar-14 Apr-14 May-14 Jun-14 Jul-14 Aug-14 Sep-14 Oct-14 Nov-14 Dec-14 Jan-15 Town & Country Ford 18.5% 20.1% 15.9% 18.5% 20.1% 16.3% 17.0% 15.4% 16.3% 14.9% 12.4% 14.5% 16.9% 10.0% 15.0% 20.0% 25.0% 30.0% Jan-14 Feb-14 Mar-14 Apr-14 May-14 Jun-14 Jul-14 Aug-14 Sep-14 Oct-14 Nov-14 Dec-14 Jan-15 Fort Mill Ford |
![]() 33 OSOE – MARKET SHARE 42.5% 41.1% 40.7% 51.1% 30.0% 44.4% 43.5% 46.6% 40.5% 50.6% 40.5% 31.7% 42.6% 30.0% 35.0% 40.0% 45.0% 50.0% 55.0% Jan-14 Feb-14 Mar-14 Apr-14 May-14 Jun-14 Jul-14 Aug-14 Sep-14 Oct-14 Nov-14 Dec-14 Jan-15 Infiniti of South Charlotte 35.7% 32.5% 47.5% 41.7% 38.7% 36.7% 40.4% 40.0% 37.1% 45.7% 32.2% 26.5% 41.3% 20.0% 25.0% 30.0% 35.0% 40.0% 45.0% 50.0% 55.0% 60.0% Jan-14 Feb-14 Mar-14 Apr-14 May-14 Jun-14 Jul-14 Aug-14 Sep-14 Oct-14 Nov-14 Dec-14 Jan-15 Cadillac of South Charlotte |
![]() EchoPark ® |
![]() 35 EARLY OBSERVATIONS • Very low to no turnover • Fantastic guest experience – take a look at the testimonials from Yelp, Yahoo, Google – that’s what we are looking for! • Reconditioning levels are very high • F&I performance ahead of projection with no F&I office • EchoPark SIMS - Excellent inventory management system (buying, intercompany movement) – performance is above expectations with no inventory issues • Appraisal process – is fantastic and a favorite of our guests • Volume has started off very well • Store technology is strong and improving OPPORTUNITIES • Website performance issues (not resolved) • Same as OSOE Stores; working to resolve but website performance is not acceptable and will be resolved in the coming weeks • SEO/SEM performance issues (plan being implemented) • Weather has been a big issue – held up openings of 2 locations • Pricing system – delayed completion will start 3/1/15 EchoPark® |
![]() 36 EchoPark® Openings: Hub – 11/3/2014 Centennial – 12/26/2015 Highlands Ranch – 1/26/2015 0 82 126 150 0 0 35 6 0 20 40 60 80 100 120 140 160 Unit Volume HUB Centennial Highlands Ranch |
![]() SUMMARY |
![]() Continued to grow the top-line in each revenue category achieving record results The franchised dealership landscape supported our operating initiatives Significant milestones / achievements in 2014 • Opening of EchoPark ® • Rollout of One Sonic-One Experience • Gained ground on owning properties – now at 36% • Returned $82.8 million to shareholders through share repurchases and dividends SUMMARY 38 |
![]() 2015 PLAN 2015 Plan Expect new car industry volume to be between 16.5M to 17.0M units We will continue to increase pre-owned volume in the mid- single digits Expect fixed operations to grow at mid-single digits Costs related to EchoPark ® , One Sonic-One Experience, and centralization to continue 2015 Continued Ops EPS Guidance: • New Car Franchise Business $2.01 - $2.11 • Effect of EchoPark ® ($0.16) • Total Sonic $1.85 - $1.95 39 |
![]() |
![]() Appendix 41 |
![]() NON-GAAP RECONCILIATIONS 42 Fourth Quarter Ended Year Ended 2014 2013 2014 2013 SG&A Reconciliation: As Reported 264,402 $ 254,647 $ 1,067,433 $ 1,003,125 $ Pre-tax Adjustments: Fire and severe storm damage (961) - (3,965) - Legal and other (575) - (1,105) - Gain on disposal of franchises 254 - 10,743 - Total pre-tax adjustments (1,282) - 5,673 - Adjusted SG&A 263,120 $ 254,647 $ 1,073,106 $ 1,003,125 $ SG&A as % of Gross Reconciliation: As Reported 75.9% 75.2% 78.1% 77.1% Pre-tax Adjustments: Fire and severe storm damage (0.3%) 0.0% (0.2%) 0.0% Legal and other (0.2%) 0.0% (0.1%) 0.0% Gain on disposal of franchises 0.1% 0.0% 0.8% 0.0% Total pre-tax adjustments (0.4%) 0.0% 0.5% 0.0% Adjusted SG&A as % of Gross 75.5% 75.2% 78.6% 77.1% December 31, (In thousands) This release contains certain non-GAAP financial measures (the "Adjusted" amounts) as defined under SEC rules, such as, but not limited to, adjusted income from continuing operations and related earnings per share data. The Company has reconciled these measures to the most directly comparable GAAP measures (the "Reported" amounts) in the release. The Company believes that these non-GAAP financial measures improve the transparency of the Company’s disclosure by providing period-to-period comparability of the Company’s results from operations. December 31, (In thousands) |
![]() 43 NON-GAAP RECONCILIATIONS Fourth Quarter Ended Year Ended 2014 2013 2014 2013 Operating Profit Reconciliation: As Reported 62,470 $ 59,264 $ 233,613 $ 234,603 $ Pre-tax Adjustments: Fire and severe storm damage 961 - 3,965 - Legal and other 575 - 1,105 - Impairment charges 6,379 9,873 6,586 9,872 Gain on disposal of franchises (254) - (10,743) - Total pre-tax adjustments 7,661 9,873 913 9,872 Adjusted Operating Profit 70,131 $ 69,137 $ 234,526 $ 244,475 $ Profit from Continuing Operations (after-tax) Reconciliation: As Reported 26,957 $ 29,562 $ 98,559 $ 84,678 $ After-tax Adjustments: Fire and severe storm damage 594 - 2,683 - Legal and other 355 - 749 - Impairment charges 3,943 6,022 4,459 6,022 Gain on disposal of franchises (157) - (7,273) - Permanent tax difference from disposals 853 - 853 - Debt Refinancing - - - 17,704 Total after-tax adjustments 5,588 6,022 1,471 23,726 Adjusted Profit from Continuing Operations (after-tax) 32,545 $ 35,584 $ 100,030 $ 108,404 $ December 31, (In thousands) December 31, (In thousands) |
![]() NON-GAAP RECONCILIATIONS 44 Fourth Quarter Ended December 31, 2014 Income (Loss) Income (Loss) From Continuing From Discontinued Operations Average Net Income (Loss) Weighted Per Per Per Average Share Share Share Shares Amount Amount Amount Amount Amount Amount (In thousands, except per share amounts) Reported: Earnings (loss) and shares . . . . . . . . . . . . . . . . . . 51,272 26,957 $ (831) $ 26,126 $ Effect of participating securities: Non-vested restricted stock and stock units . . . . . . . . . . . . . . . . . . . . . . . (86) - (86) Basic earnings (loss) and shares . . . . . . . . . . . . . 51,272 26,871 $ 0.52 $ (831) $ (0.01) $ 26,040 $ 0.51 $ Effect of dilutive securities: Stock compensation plans . . . . . . . . . . . . . . . . 562 Diluted earnings (loss) and shares (1) . . . . . . . . .. 51,834 26,871 $ 0.52 $ (831) $ (0.02) $ 26,040 $ 0.50 $ Adjustments (net of tax): Fire and severe storm damage . . . . . . . . . . . . . . . 594 $ 0.01 $ - $ - $ 594 $ 0.01 $ Legal and other. . . . . . . . . . . . . . . . . . . . . . . . . . .. 355 - - - 355 - Impairment charges. . . . . . . . . . . . . . . . . . . . . . . 3,943 0.08 - - 3,943 0.08 Gain on disposal of franchises . . . . . . . . . . . . . . (157) - - - (157) - Permanent tax difference from disposals . . . . . . 853 0.02 - 853 0.02 Total adjustments . . . . . . . . . . . . . . . . . . . . . . 5,588 $ 0.11 $ - $ - $ 5,588 $ 0.11 $ Adjusted: Earnings (loss) and Diluted earnings (loss) per share . . . . . . . . . . . 32,545 $ 0.63 $ (831) $ (0.02) $ 31,714 $ 0.61 $ (1) Expenses attributable to the EchoPark® initiative were $0.08 per fully diluted share in the fourth quarter of 2014. Fourth Quarter Ended December 31, 2013 Income (Loss) Income (Loss) From Continuing From Discontinued Operations Operations Net Income (Loss) Weighted Per Per Per Average Share Share Share Shares Amount Amount Amount Amount Amount Amount (In thousands, except per share amounts) Reported: Earnings (loss) and shares . . . . . . . . . . . . . . . . . . 52,492 29,562 $ (1,478) $ 28,084 $ Effect of participating securities: Non-vested restricted stock and stock units . . . . . . . . . . . . . . . . . . . . . . . (208) - (208) Basic earnings (loss) and shares . . . . . . . . . . . . . 52,492 29,354 $ 0.56 $ (1,478) $ (0.03) $ 27,876 $ 0.53 $ Effect of dilutive securities: Stock compensation plans . . . . . . . . . . . . . . . . 482 Diluted earnings (loss) and shares (2). . . . . . . .. . 52,974 29,354 $ 0.55 $ (1,478) $ (0.02) $ 27,876 $ 0.53 $ Adjustments (net of tax): Impairment Charges . . . . . . . . . . . . . . . . . . . . . . 6,022 $ 0.11 $ - $ - $ 6,022 $ 0.11 $ Effect of two-class method & rounding . . . . . . . - 0.01 - (0.01) - - Total adjustments . . . . . . . . . . . . . . . . . . . . . . 6,022 $ 0.12 $ - $ (0.01) $ 6,022 $ 0.11 $ Adjusted: Earnings (loss) and Diluted earnings (loss) per share . . . . . . . . . . . 35,584 $ 0.67 $ (1,478) $ (0.03) $ 34,106 $ 0.64 $ (2) Expenses attributable to the EchoPark® initiative were $0.03 per fully diluted share in the fourth quarter of 2013. |
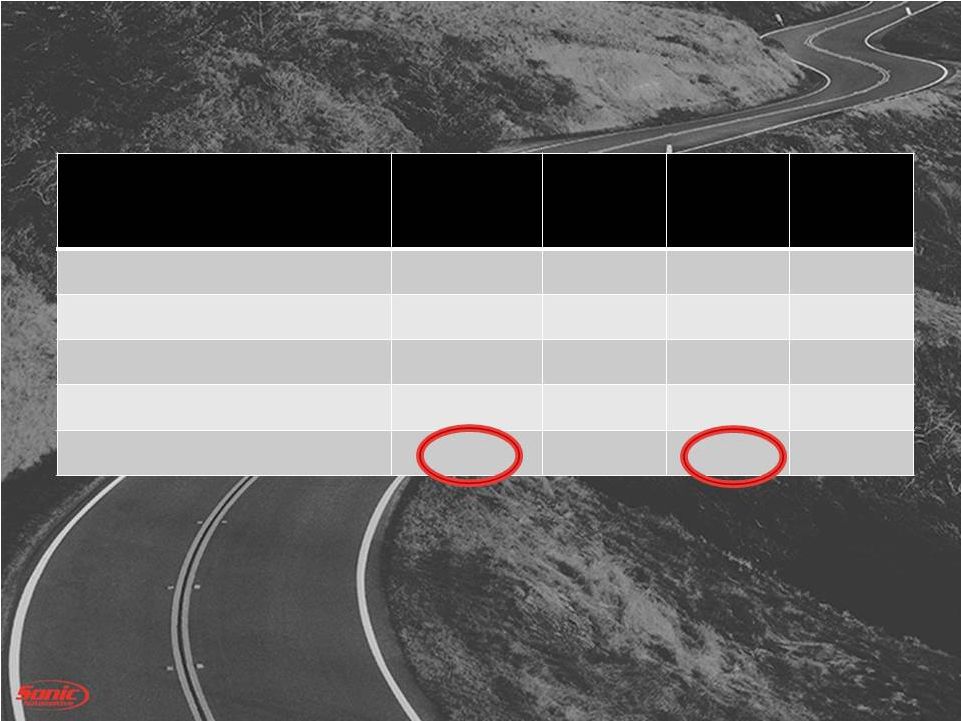
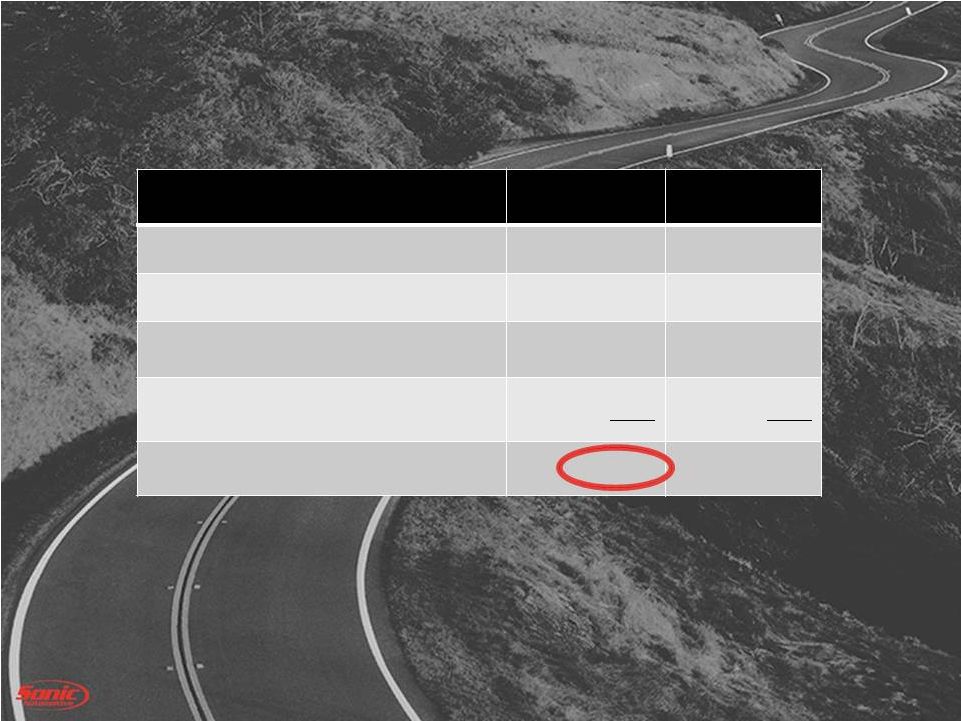
![]() 45 NON-GAAP RECONCILIATIONS Year Ended December 31, 2014 Income (Loss) Income (Loss) From Continuing From Discontinued Operations Operations Net Income (Loss) Weighted Per Per Per Average Share Share Share Shares Amount Amount Amount Amount Amount Amount (In thousands, except per share amounts) Reported: Earnings (loss) and shares . . . . . . . . . . . . . . . . . . 52,065 98,559 $ (1,342) $ 97,217 $ Effect of participating securities: Non-vested restricted stock and stock units . . . . . . . . . . . . . . . . . . . . . . . (311) - (311) Basic earnings (loss) and shares . . . . . . . . . . . . . 52,065 98,248 $ 1.89 $ (1,342) $ (0.03) $ 96,906 $ 1.86 $ Effect of dilutive securities: Contingently convertible debt (5.0% Convertible Notes) . . . . . . . . . . . - - - - Stock compensation plans . . . . . .. . . . . . . . . . . 498 Diluted earnings (loss) and shares (3). . . . . . . . . 52,563 98,248 $ 1.87 $ (1,342) $ (0.03) $ 96,906 $ 1.84 $ Adjustments (net of tax): Fire and severe storm damage . . . . . . . . . . . . . . . 2,685 $ 0.05 $ - $ - $ 2,685 $ 0.05 $ Legal and other. . . . . . . . . . . . . . . . . . . . . . . . . . .. 749 0.01 - - 749 0.01 Impairment charges. . . . . . . . . . . . . . . . . . . . . . . 4,459 0.08 - - 4,459 0.08 Gain on disposal of franchises . . . . . . . . . . . . . . (7,273) (0.14) - - (7,273) (0.14) Permanent tax difference from disposals . . . . . . 853 0.02 - - 853 0.02 Lease exit adjustments . . . . . . . . . . . . . . . . . . . . - - (844) (0.02) (844) (0.02) Effect of two-class method & rounding . . . . . . . - 0.01 - 0.01 - 0.02 Total adjustments . . . . . . . . . . . . . . . . . . . . . . 1,473 $ 0.03 $ (844) $ (0.01) $ 629 $ 0.02 $ Adjusted: Earnings (loss) and Diluted earnings (loss) per share . . . . . . . . . . . 100,032 $ 1.90 $ (2,186) $ (0.04) $ 97,846 $ 1.86 $ (3) Expenses attributable to the EchoPark® initiative were $0.18 per fully diluted share in the year ended December 31, 2014. Year Ended December 31, 2013 Income (Loss) Income (Loss) From Continuing From Discontinued Operations Operations Net Income (Loss) Weighted Per Per Per Average Share Share Share Shares Amount Amount Amount Amount Amount Amount (In thousands, except per share amounts) Reported: Earnings (loss) and shares . . . . . . . . . . . . . . . . . . 52,556 84,678 $ (3,060) $ 81,618 $ Effect of participating securities: Non-vested restricted stock and stock units . . . . . . . . . . . . . . . . . . . . . . . (601) - (601) Basic earnings (loss) and shares . . . . . . . . . . . . . 52,556 84,077 $ 1.60 $ (3,060) $ (0.06) $ 81,017 $ 1.54 $ Effect of dilutive securities: Stock compensation plans . . . . . . . . . . . . . . . . 385 Diluted earnings (loss) and shares (4) . . . . . . . . .. 52,941 84,077 $ 1.59 $ (3,060) $ (0.06) $ 81,017 $ 1.53 $ Adjustments (net of tax): Impairment Charges . . . . . . . . . . . . . . . . . . . . . . 6,022 $ 0.11 $ - $ - $ 6,022 $ 0.11 $ Double-carry interest & refinancing . . . . . . . . . . 17,704 0.33 - - 17,704 0.33 Debt extinguishment charges . . . . . . . . . . . . . . . . - - - - - - Effect of two-class method & rounding . . . . . . . - - - 0.01 - 0.01 Total adjustments . . . . . . . . . . . . . . . . . . . . . . 23,726 $ 0.44 $ - $ 0.01 $ 23,726 $ 0.45 $ Adjusted: Earnings (loss) and Diluted earnings (loss) per share . . . . . . . . . . . 108,404 $ 2.03 $ (3,060) $ (0.05) $ 105,344 $ 1.98 $ (4) Expenses attributable to the EchoPark® initiative were $0.07 per fully diluted share in the year ended December 31, 2014. |
![]() |