 Q1 2015 EARNINGS REVIEW April 21, 2015 Exhibit 99.2 |
   2 FORWARD-LOOKING STATEMENTS This presentation contains “forward-looking statements” within the meaning of the Private Securities Litigation Reform Act of 1995. These statements relate to future events, are not historical facts and are based on our current expectations and assumptions regarding our business, the economy and other future conditions. These statements can generally be identified by lead-in words such as “believe”, “expect”, “anticipate”, “intend”, “plan”, “foresee”, “may” ,”will” and other similar words. Statements that describe our Company’s objectives, plans or goals are also forward-looking statements. Examples of such forward- looking information we may be discussing in this presentation include, without limitation, anticipated 2015 industry new vehicle sales volume, the implementation of growth and operating strategies, including acquisitions of dealerships and properties, the development of open points and stand-alone pre-owned stores, the return of capital to shareholders , anticipated future success and impacts from the implementation of our strategic initiatives and earnings per share expectations. You are cautioned that these forward-looking statements are not guarantees of future performance, involve risks and uncertainties and actual results may differ materially from those projected in the forward-looking statements as a result of various factors. These risks and uncertainties include, among other things, (a) economic conditions in the markets in which we operate, (b) the success of our operational strategies, (c) our relationships with the automobile manufacturers, (d) new and pre-owned vehicle sales volume, and (e) earnings expectations for the year ending December 31, 2015. These risks and uncertainties, as well as additional factors that could affect our forward-looking statements, are described in our Form 10-K for the year ended December 31, 2014. These forward-looking statements, risks, uncertainties and additional factors speak only as of the date of this presentation. We undertake no obligation to update any such statements. |
 CONTENT • STRATEGIC FOCUS • FINANCIAL RESULTS • OPERATIONS REVIEW • SUMMARY AND OUTLOOK 3 |
 4 STRATEGIC FOCUS 1. Growth • One Sonic-One Experience • EchoPark ® • Acquisitions & Open Points 2. Own Our Properties 3. Return Capital to Shareholders |
 STRATEGIC FOCUS ONE SONIC-ONE EXPERIENCE (OSOE) 5 • Goals • Pilot Stores Underway • 36 Month Implementation • Charlotte Market Rollout in Progress Result - Increase Market Share and Customer Retention 1 Associate, 1 Price, 1 Hour Improve Transparency; Increase Trust Operational Efficiencies |
 6 STRATEGIC FOCUS EchoPark ® • Hub Opened November 3 • 2 Neighborhood Stores Opened in January 2015 • Expect at least 1 more in 2015 and another in 2016 |
 7 STRATEGIC FOCUS ACQUISITIONS & OPEN POINTS • Open Points Mercedes Benz in Dallas Market Operational in 2016 Audi in Pensacola Market Operational in 2016 Nissan in TN Market Operational in late 2016 / early 2017 • Exploring Acquisition and Open Point Opportunities in Other Markets |
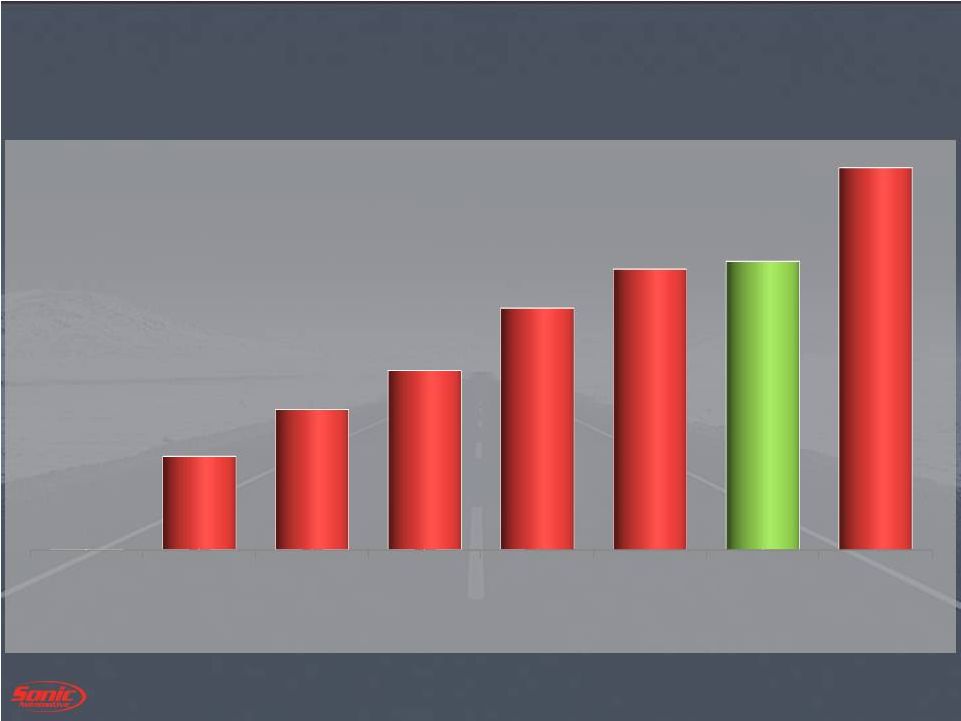 8 STRATEGIC FOCUS OWN OUR PROPERTIES 2007 2008 2011 2012 2013 2014 Q1 2015 Proj. - 2017 0% 12% 18% 23% 31% 36% 37% 49% |
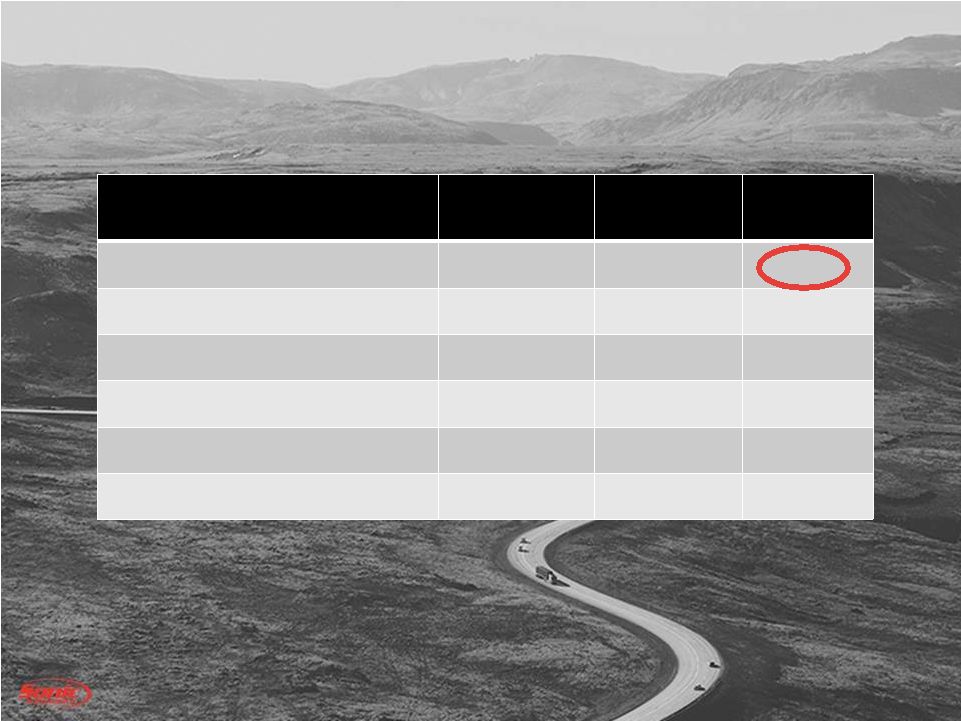
 9 STRATEGIC FOCUS RETURN CAPITAL TO SHAREHOLDERS • Unused Authorization of Approximately $ 68 million • Quarterly Dividend of $0.025 Per Share Shares (in thousands) Average Price / Share $ (in millions) 2015 Activity 447 $ 24.89 $ 11.1 |
 Q1 2015 FINANCIAL REVIEW |
 Q1 2015 FINANCIAL REVIEW FRANCHISE DEALERSHIPS |
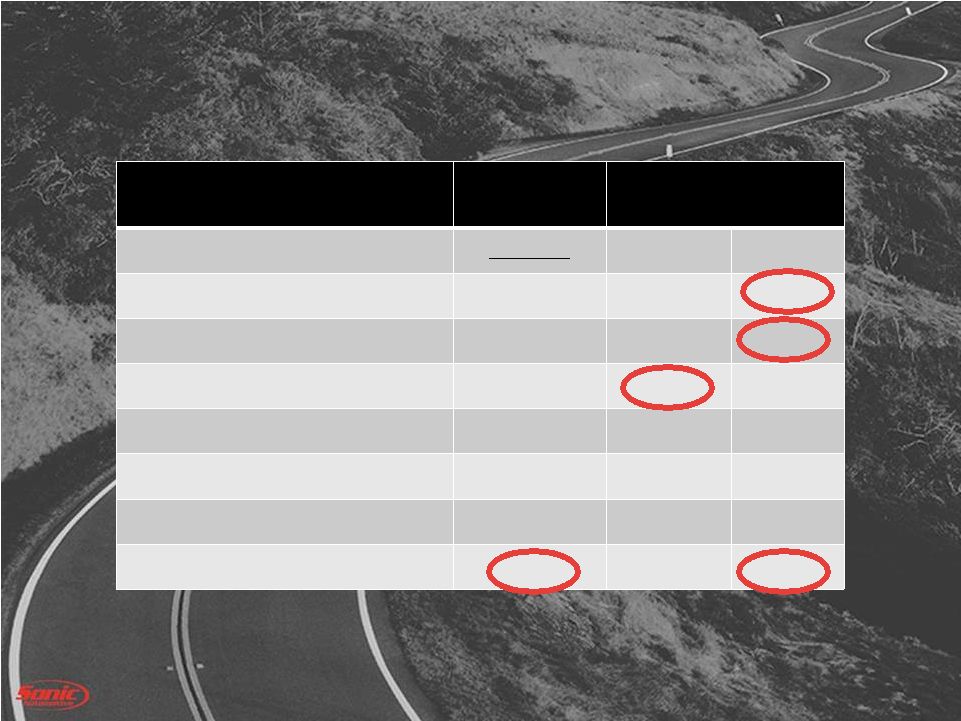 ADJUSTED FRANCHISED OPERATIONS B/(W) than Q1 2014 (amounts in millions, except per share data) Q1 2015 $ % Revenue $ 2,220 $ 83 3.9% Gross Profit $ 333 $ 4 1.3% SG&A as % of Gross (1) 79.2% 50 bps Operating Profit (1) $ 54 $ 1 2.2% Interest & Other $ 18 $ 1 3.4% Pretax (1) $ 36 $ 2 5.2% Diluted EPS (1) $ 0.43 $ .03 7.5% 12 Note – Continuing operations includes results of sold stores after March 31, 2014. (1) – Amounts are adjusted. See appendix for reconciliation of adjusted amounts to GAAP amounts |
 FRANCHISED SG&A TO GROSS WALK – Q1 13 210 bps Better than Q1 2014 of 79.7% (1) – Amounts are adjusted. See appendix for reconciliation of adjusted amounts to GAAP amounts Q1 2015 Adjusted (1) Less: OSOE Less: Centralization Initiatives 79.2% (1.1%) (0.5%) 77.6% Q1 2015 Adj for |
 Q1 2015 FINANCIAL REVIEW ECHOPARK ® |
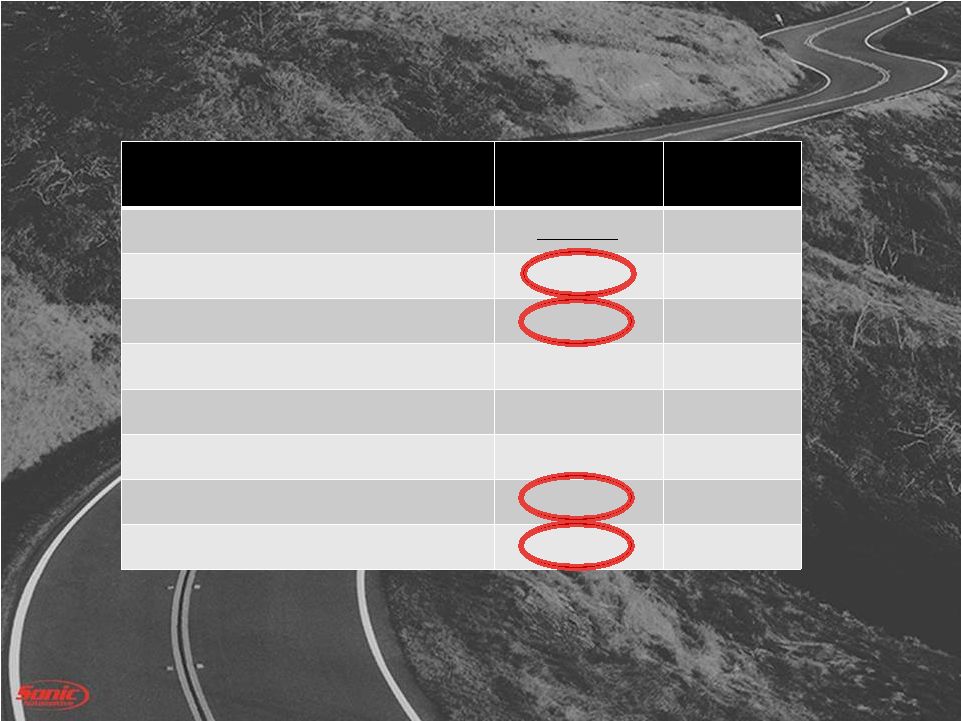 ECHOPARK ® Q1 RESULTS 15 B/(W) than Q1 2014 (amounts in millions, except per share data) Q1 2015 $ Revenue $ 15.7 $ 15.7 Gross Profit $ 1.8 $ 1.8 Operating Profit (1) ($ 4.8) ($ 3.1) Interest & Other ($ 0.1) ($ 0.1) Pre-tax Profit (Loss) (1) ($ 4.9) ($ 3.2) Store Level (retail units) 660 n/a Diluted EPS (1) ($ 0.06) ($0.04) (1) – Amounts are adjusted. See appendix for reconciliation of adjusted amounts to GAAP amounts |
 Q1 2015 FINANCIAL REVIEW TOTAL ENTERPRISE |
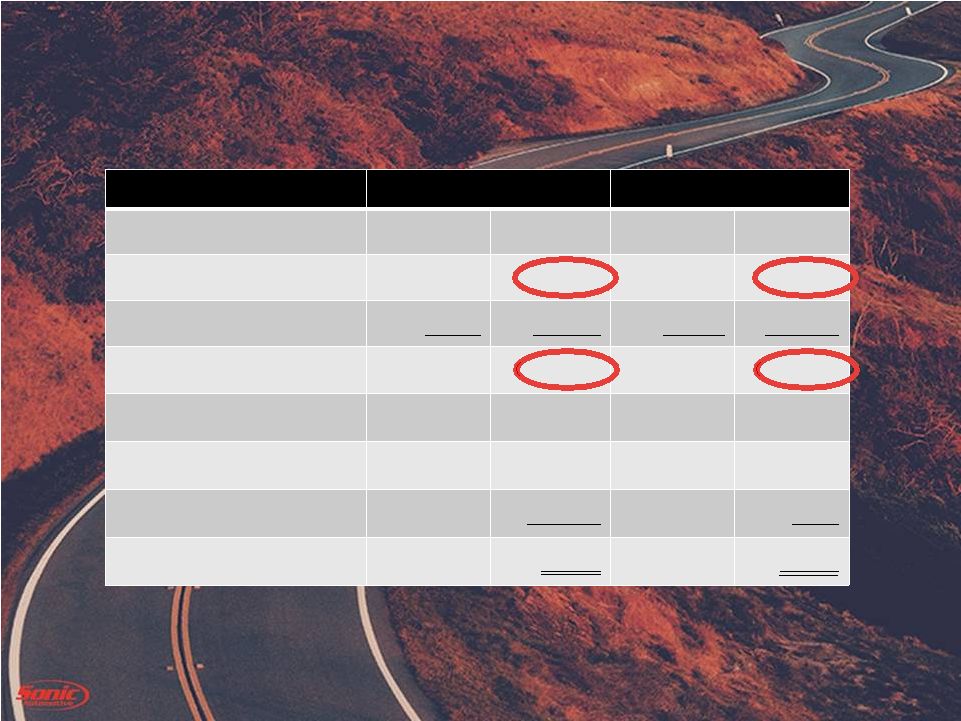
 ADJUSTED TOTAL Q1 2015 RESULTS B/(W) than Q1 2014 (amounts in millions, except per share data) Q1 2015 $ % Revenue $ 2,236 $ 99 4.6% Gross Profit $ 335 $ 6 1.8% Operating Profit (1) $ 49 ($ 2) (3.8%) Interest & Other $ 18 $ 1 2.7% Continuing Ops: Profit (after tax) (1) $ 19 ($ 1) (5.9%) Diluted EPS (1) $ 0.37 ($ 0.01) (2.6%) SG&A as % of Gross (1) 80.6% (40 bps) Discontinued Ops Profit/(Loss) (after tax) ($ 0.4) $ 0.2 17 Note – Continuing operations includes results of sold stores after March 31, 2014. (1) – Amounts are adjusted. See appendix for reconciliation of adjusted amounts to GAAP amounts |
 TOTAL REVENUE & GROSS PROFIT Q1 2015 B/(W) than Q1 2014 (amounts in millions) Q1 2015 $ % New Retail Revenue $ 1,190 $ 78 7.0% Used Retail Revenue $ 594 $ 34 6.1% Fixed Operations Revenue $ 323 $ 4 1.4% F&I Revenue $ 75 $ 5 7.2% Total Revenue $ 2,236 $ 99 4.6% New Retail Gross $ 63 ($ 2) (3.6%) Used Retail Gross $ 41 $ 0 0.4% Fixed Operations Gross $ 156 $ 4 2.8% F&I Gross $ 75 $ 5 7.2% Total Gross $ 335 $ 6 1.8% 18 (1) – Amounts are adjusted. See appendix for reconciliation of adjusted amounts to GAAP amounts |
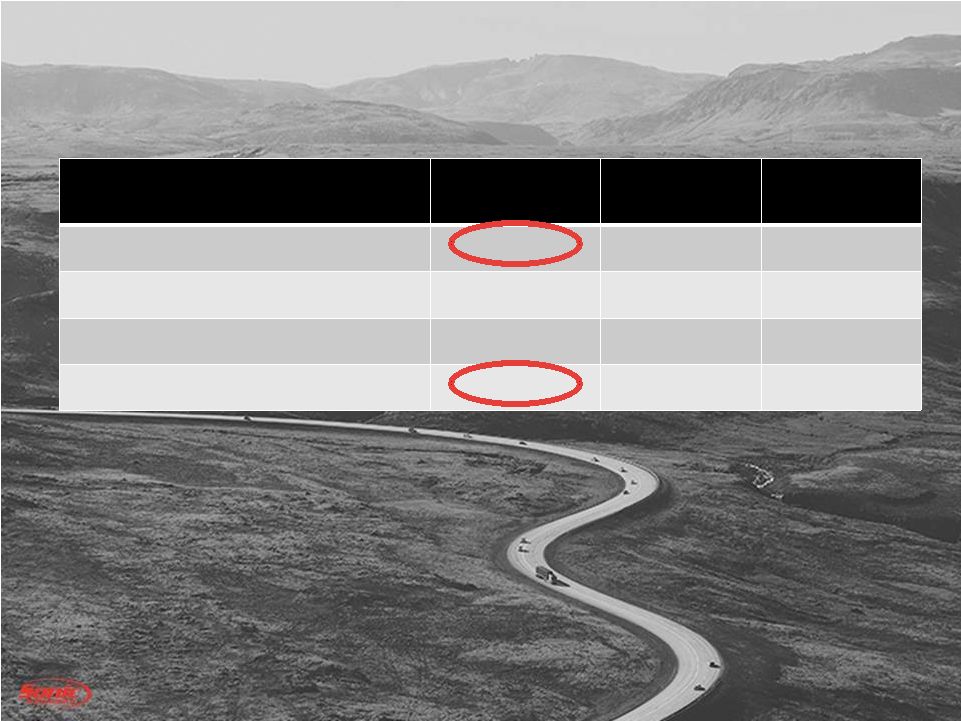
 ADJUSTED TOTAL SG&A TO GROSS 19 80.6% 80.2% Note – 2015 amounts are adjusted. See appendix for reconciliation of adjusted amounts to GAAP amounts Q1 2015 Q1 2014 4.6% 4.3% 48.1% 47.8% 5.4% 5.6% 22.5% 22.5% Advertising Comp Rent Other |
 ADJUSTED AND GAAP EPS SUMMARY 20 (amounts in millions, except per share date) Q1 2015 Q1 2014 Pre-Tax EPS Pre-Tax EPS Adjusted Franchised EPS $35.7 $ 0.43 $ 34.0 $0.40 Adjusted EchoPark® EPS ($4.9) ($0.06) ($ 1.7) ($ 0.02) Adjusted Total EPS $ 30.8 $ 0.37 $32.2 $ 0.38 Adjustments: Impairment ($ 6.2) ($ 0.07) $ 0.0 $ 0.0 Other ($ 1.1) ($ 0.02) $ 0.0 $ 0.0 GAAP EPS $ 0.28 $ 0.38 |
 CAPITAL SPEND (amounts in millions) YTD Q1 2015 Estimated 2015 Real Estate & Facility Related $ 37.2 $200.9 All Other Cap Ex 9.7 46.3 Subtotal $ 46.9 $ 247.2 Less: Mortgage Funding (25.6) (87.1) Total Cash Used – Cap Ex $ 21.3 $ 160.1 Note – Spending excludes the effect of franchise acquisitions. 21 |
 LIQUIDITY (amounts in millions) Q1 2015 Q4 2014 Cash $4.0 $ 4.2 Revolver Availability 161.1 165.6 Used floor plan availability 21.6 22.6 Floor plan deposit balance 56.0 57.5 Total $242.7 $ 249.9 22 |
 DEBT COVENANTS Covenant Actual Q1 2015 Liquidity Ratio >= 1.05 1.21 Fixed Charge Coverage Ratio >= 1.20 1.64 Total Lease Adjusted Leverage Ratio <= 5.50 4.16 Compliant with all Covenants 23 |
 OPERATIONS REVIEW |
 NEW VEHICLE RETAIL SAME STORE Q1 2015 Q1 2014 B/(W) Volume 30,981 28,980 6.9% Selling Price $ 38,028 $ 37,120 2.4% Gross Margin % 5.3% 5.9% (60 bps) GPU $ 2,018 $ 2,199 ($ 182) Gross Profit $ 63 million $ 64 million (1.9%) SAAR (includes fleet) 16.6 million 15.6 million 6.4% 25 |
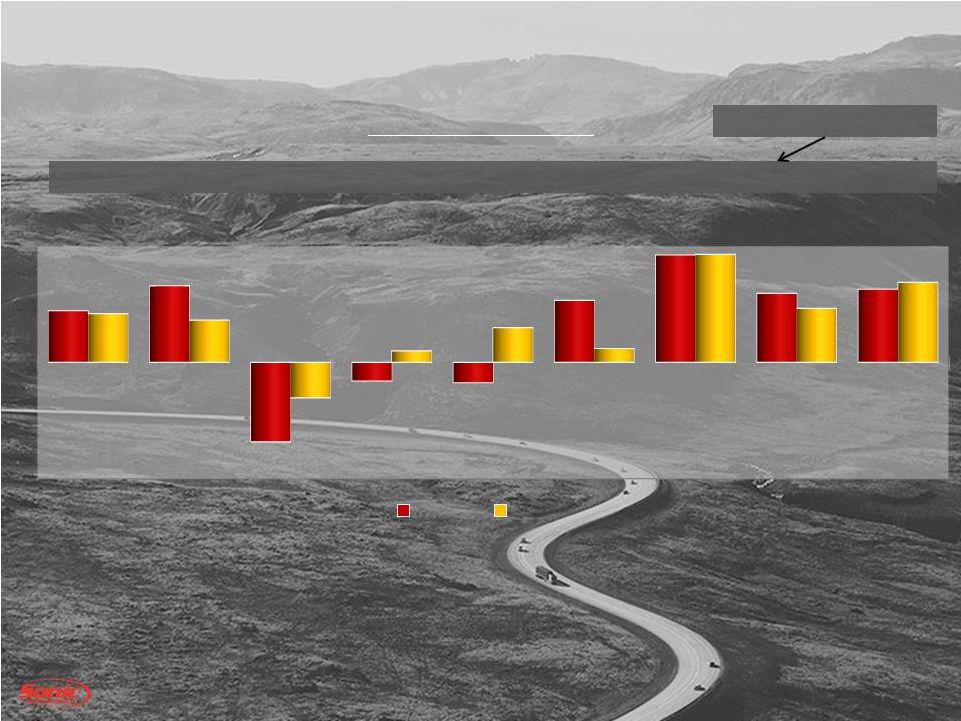 26 Q1 2015 vs. Q1 2014 (1) (1) – Industry includes fleet – Sonic does not NEW VEHICLE - BRAND 15.4% 6.9% 2.3% 6.9% 5.2% 24.8% 5.0% 15.3% 3.6% % Sonic Unit Sales BMW MB Cadillac Ford GM Honda Lexus Toyota Audi 9% 13% (14%) (3%) (4%) 11% 19% 12% 13% 8% 7% (6%) 2% 6% 2% 19% 9% 14% Sonic Industry |
 USED VEHICLE RETAIL SAME STORE 27 Q1 2015 Q1 2014 B/(W) Retail Volume 27,079 26,601 1.8% Used Retail GPU $ 1,478 $ 1,477 $ 1 Used to New 0.87:1.00 0.92:1.00 (0.04) Vehicles / store / month (97 stores) 93 91 2 |
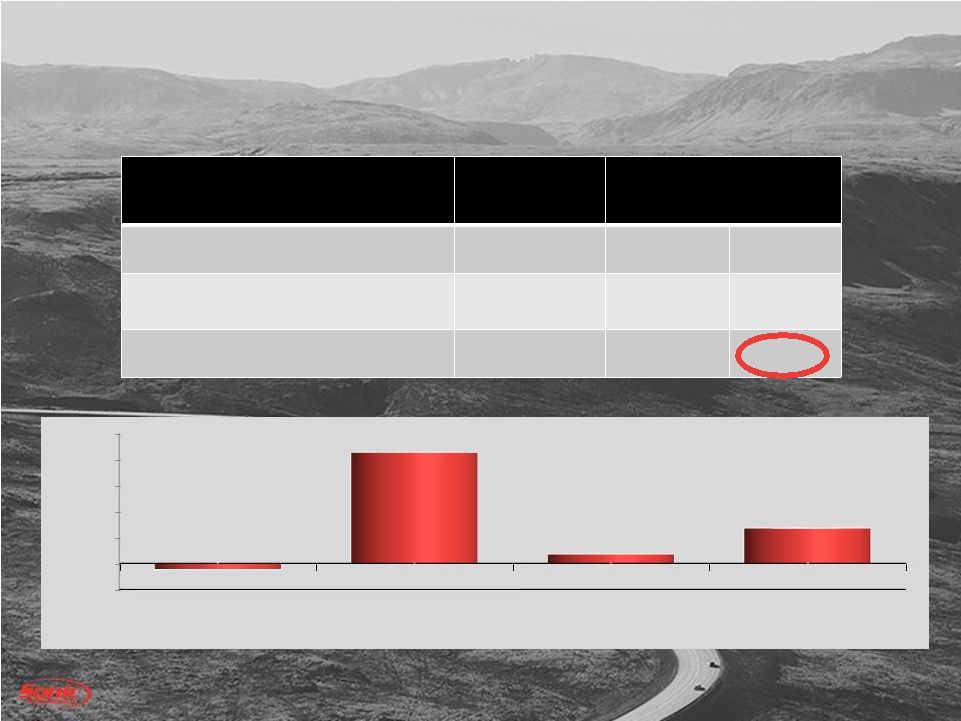 FIXED OPS SAME STORE Q1 2015 B/(W) than 2014 (amounts in millions) $ % Revenue $ 318 $ 10 3.2% Gross Profit $ 154 $ 7 4.9% 28 (5.0%) 0.0% 5.0% 10.0% 15.0% 20.0% 25.0% Customer Pay Warranty Wholesale Parts Internal & Sublet (1.2%) 21.4% 1.8% 6.8% YOY Gross % Change |
 OSOE |
 30 OSOE – TOWN & COUNTRY TOYOTA NEW RETAIL UNITS 155 140 198 156 177 246 251 182 167 182 153 200 257 100 120 140 160 180 200 220 240 260 280 Mar-14 Apr-14 May-14 Jun-14 Jul-14 Aug-14 Sep-14 Oct-14 Nov-14 Dec-14 Jan-15 Feb-15 Mar-15 13.2% 12.9% 14.2% 13.1% 14.6% 18.0% 20.8% 15.8% 16.0% 15.1% 15.8% 22.0% 20.5% 10.0% 12.0% 14.0% 16.0% 18.0% 20.0% 22.0% 24.0% Mar-14 Apr-14 May-14 Jun-14 Jul-14 Aug-14 Sep-14 Oct-14 Nov-14 Dec-14 Jan-15 Feb-15 Mar-15 MARKET SHARE |
 31 OSOE – TOWN & COUNTRY FORD NEW RETAIL UNITS MARKET SHARE 135 113 138 121 108 141 108 73 93 108 100 83 121 70 80 90 100 110 120 130 140 150 Mar-14 Apr-14 May-14 Jun-14 Jul-14 Aug-14 Sep-14 Oct-14 Nov-14 Dec-14 Jan-15 Feb-15 Mar-15 19.5% 18.3% 17.0% 16.9% 13.9% 18.5% 17.3% 12.3% 16.0% 13.3% 15.9% 15.7% 15.2% 10.0% 15.0% 20.0% 25.0% 30.0% Mar-14 Apr-14 May-14 Jun-14 Jul-14 Aug-14 Sep-14 Oct-14 Nov-14 Dec-14 Jan-15 Feb-15 Mar-15 |
 32 OSOE – FORT MILL FORD NEW RETAIL UNITS 110 121 156 116 133 124 94 86 77 114 108 84 111 50 70 90 110 130 150 170 Mar-14 Apr-14 May-14 Jun-14 Jul-14 Aug-14 Sep-14 Oct-14 Nov-14 Dec-14 Jan-15 Feb-15 Mar-14 15.9% 18.5% 20.1% 16.3% 17.0% 15.4% 16.3% 14.9% 12.4% 14.5% 16.9% 14.8% 14.6% 10.0% 12.0% 14.0% 16.0% 18.0% 20.0% 22.0% 24.0% Mar-14 Apr-14 May-14 Jun-14 Jul-14 Aug-14 Sep-14 Oct-14 Nov-14 Dec-14 Jan-15 Feb-15 Mar-15 MARKET SHARE |
 33 OSOE – INFINITI OF CHARLOTTE NEW RETAIL UNITS 40.7% 51.1% 30.0% 44.4% 43.5% 46.6% 40.5% 50.6% 40.5% 31.7% 42.6% 46.8% 49.5% 30.0% 35.0% 40.0% 45.0% 50.0% 55.0% Mar-14 Apr-14 May-14 Jun-14 Jul-14 Aug-14 Sep-14 Oct-14 Nov-14 Dec-14 Jan-15 Feb-15 Mar-15 37 45 30 34 31 30 36 40 30 34 30 35 53 25 30 35 40 45 50 55 Mar-14 Apr-14 May-14 Jun-14 Jul-14 Aug-14 Sep-14 Oct-14 Nov-14 Dec-14 Jan-15 Feb-15 Mar-15 MARKET SHARE |
 34 OSOE – CADILLAC OF SOUTH CHARLOTTE NEW RETAIL UNITS 47.5% 41.7% 38.7% 36.7% 40.4% 40.0% 37.1% 45.7% 32.2% 26.5% 41.3% 38.0% 38.8% 20.0% 25.0% 30.0% 35.0% 40.0% 45.0% 50.0% 55.0% 60.0% Mar-14 Apr-14 May-14 Jun-14 Jul -14 Aug-14 Sep-14 Oct-14 Nov-14 Dec-14 Jan-15 Feb-15 Mar-15 MARKET SHARE 38 40 42 32 39 46 34 39 23 39 32 28 35 20 25 30 35 40 45 50 Mar-14 Apr-14 May-14 Jun-14 Jul-14 Aug-14 Sep-14 Oct-14 Nov-14 Dec-14 Jan-15 Feb-15 Mar-15 |
 35 OSOE – NEXT STEPS 1. We are still working on the pricing tool (in particular with Ford) we are a few months away from completion Drivers of the slowdown are “man” hours available and new technology opportunities – simply put this is a first of its kind and we are close to breaking the code 2. CRM/Desk/F&I and Appraisal system is a major success in the stores all technologies are running at 100% 3. Operations team is requesting us to develop a two part rollout of the technology from OSOE less the pricing (until pricing tool is 100% operational) Beginning in Q2 we would start the rollout of the CRM and the Desk tool Followed by a rollout out of the F&I and Appraisal tools (3 months later per location) 4. A rollout plan of the technology is under development |
 EchoPark ® |
 37 EchoPark ® Openings: 122 183 185 292 6 34 31 69 0 6 19 35 143 135 188 0 50 100 150 200 250 300 350 Dec-14 Jan-15 Feb-15 Mar-15 Unit Volume Total Centennial Highlands Ranch HUB Hub – 11/3/2014 Centennial – 12/26/2015 Highlands Ranch – 1/23/2015 |
 Growth experienced in each revenue category achieving record results Gaining expense leverage in the franchised dealership segment including OSOE expenses Expect open points to drive future growth Continued share repurchases with excess capital Monitoring capital requirements as 2017 lease maturities approach SUMMARY 38 |
 |
 Appendix 40 |
 NON-GAAP RECONCILIATIONS 41 Consolidated Franchised Dealerships EchoPark® Three Months Ended Three Months Ended Three Months Ended March 31, March 31, March 31, 2015 2014 2015 2014 2015 2014 (In millions) SG&A Reconciliation: As Reported . . . . . . . . . . . . . . . . . . . . . . . . . . . . . . .. . . . . . . 270.9 $ 264.0 $ 265.0 $ 262.3 $ 5.9 $ 1.7 $ Pre-tax Adjustments: Severance and other . . . . . . . . . . . . . . . . .. . . . . . . . . . . . (1.1) - (1.1) - - - Total pre-tax adjustments . . . . . . . . . . . . . . . . . . . . . (1.1) - (1.1) - - - Adjusted SG&A . . . . . . . . . . . . . . . . . . . . . . . . . . . . . . . . . 269.8 $ 264.0 $ 263.9 $ 262.3 $ 5.9 $ 1.7 $ SG&A as % of Gross Reconciliation: As Reported . . . . . . . . . . . . . . . . . . . .. . . . . . . . . . . . . . . . . . 80.9% 80.2% 79.5% 79.7% NM NM Pre-tax Adjustments: Severance and other . . . . . . . . . . . . . . . . . . . . . . . . . . .. . (0.3%) 0.0% (0.3%) 0.0% NM NM Total pre-tax adjustments . . . . . . . . . . . . . . . . . . . . .. (0.3%) 0.0% (0.3%) 0.0% NM NM Adjusted SG&A as % of Gross . . . . . . . . . . . . . . . . . . . . .. . 80.6% 80.2% 79.2% 79.7% NM NM NM = Not meaningful This release contains certain non-GAAP financial measures (the "Adjusted" amounts) as defined under SEC rules, such as, but not limited to, adjusted income from continuing operations and related earnings per share data. The Company has reconciled these measures to the most directly comparable GAAP measures (the "Reported" amounts) in the release. The Company believes that these non-GAAP financial measures improve the transparency of the Company’s disclosure by providing period-to-period comparability of the Company’s results from operations. |
 42 NON-GAAP RECONCILIATIONS Consolidated Franchised Dealerships EchoPark® Three Months Ended Three Months Ended Three Months Ended March 31, March 31, March 31, 2015 2014 2015 2014 2015 2014 (In millions) Operating Profit Reconciliation: As Reported . . . . . . . . . . . . . . . . . . . . . . . . . . . . . . .. . . . . . . 41.5 $ 50.6 $ 47.7 $ 52.3 $ (6.2) $ (1.7) $ Pre-tax Adjustments: Severance and other . . . . . . . . . . . . . . . . . . . . . . . . . . .. . 1.1 - 1.1 - - - Impairment charges . . .. . . . . . . . . . . . . . . . . . . . . . . . . . . 6.2 - 4.8 - 1.4 - Total pre-tax adjustments . . . . . . . . . . . . . . . . . . . . . 7.3 - 5.9 �� - 1.4 - Adjusted Operating Profit . . . . . . . . . . . . . . . . . . . . . . . . . . 48.8 $ 50.6 $ 53.6 $ 52.3 $ (4.8) $ (1.7) $ Pre-tax Profit from Continuing Operations Reconciliation: As Reported . . . . . . . . . . . . . .. . . . . . . . . . . . . . . . . . . . . . . . 23.5 $ 32.2 $ 29.8 $ 33.9 $ (6.3) $ (1.7) $ Pre-tax Adjustments: Severance and other . . . . . . . . . . . . . . . . . . . . . . . . . . .. . 1.1 - 1.1 - - - Impairment charges . . .. . . . . . . . . . . . . . . . . . . . . . . . . . . 6.2 - 4.8 - 1.4 - Total after-tax adjustments . . . . . . . . . . . . . . . . . . . . 7.3 - 5.9 - 1.4 - Adjusted Profit from Continuing Operations (after-tax) . . . 30.8 $ 32.2 $ 35.7 $ 33.9 $ (4.9) $ (1.7) $ Profit from Continuing Operations (after-tax) Reconciliation: As Reported . . . . . . . . . . . .. . . . . . . . . . . . . . . . . . . . . . . . . . 14.4 $ 20.0 $ After-tax Adjustments: Severance and other . . . . . . . . . . . . . . . . . . . . . . . . . . .. . 0.6 - Impairment charges . . .. . . . . . . . . . . . . . . . . . . . . . . . . . . 3.8 - Total after-tax adjustments . . . . . . . . . . . . . . . . . . . . 4.4 - Adjusted Profit from Continuing Operations (after-tax) . . . 18.8 $ 20.0 $ |
 NON-GAAP RECONCILIATIONS 43 Three Months Ended March 31, 2015 Income (Loss) Income (Loss) From Continuing From Discontinued Operations Average Net Income (Loss) Weighted Per Per Per Average Share Share Share Shares Amount Amount Amount Amount Amount Amount (In millions, except per share amounts) Reported: Earnings (loss) and shares . . . . . . . . . . . . . . . 50.9 14.4 $ (0.4) $ 14.0 $ Effect of participating securities: Non-vested restricted stock and stock units . . . . . . . . . . . . . . . . . . . . - - - Basic earnings (loss) and shares . . . . . . . . . . 50.9 14.4 $ 0.28 $ (0.4) $ (0.01) $ 14.0 $ 0.27 $ Effect of dilutive securities: Stock compensation plans . . . . . . . . . . . . . 0.5 Diluted earnings (loss) and shares . . . . . .. . . . 51.4 14.4 $ 0.28 $ (0.4) $ (0.01) $ 14.0 $ 0.27 $ Adjustments (net of tax): Impairment charges . . . . . . . . . . . . . . . . . . . . 3.8 $ 0.07 $ - $ - $ 3.8 $ 0.07 $ Other. . . . . . . . . . . . . . . . . . . . . . . . . . . . . . . 0.6 0.02 - - 0.6 0.02 Total adjustments . . . . . . . . . . . . . . . . . . . 4.4 $ 0.09 $ - $ - $ 4.4 $ 0.09 $ Adjusted: Earnings (loss) and Diluted earnings (loss) per share (1) . . . . . 18.8 $ 0.37 $ (0.4) $ (0.01) $ 18.4 $ 0.36 $ (1) Expenses attributable to the EchoPark® initiative were $0.06 per fully diluted share in the three months ended March 31, 2015. |
 44 NON-GAAP RECONCILIATIONS Three Months Ended March 31, 2014 Income (Loss) Income (Loss) From Continuing From Discontinued Operations Operations Net Income (Loss) Weighted Per Per Per Average Share Share Share Shares Amount Amount Amount Amount Amount Amount (In millions, except per share amounts) Reported: Earnings (loss) and shares . . . . . . . . . . . . . . . 52.4 20.0 $ (0.6) $ 19.4 $ Effect of participating securities: Non-vested restricted stock and stock units . . . . . . . . . . . . . . . . . . . . (0.1) - (0.1) Basic earnings (loss) and shares . . . . . . . . . . 52.4 19.9 $ 0.38 $ (0.6) $ (0.01) $ 19.3 $ 0.37 $ Effect of dilutive securities: Stock compensation plans . . . . . . . . . . . . . 0.5 Diluted earnings (loss) and shares (2). .. . . . . 52.9 19.9 $ 0.38 $ (0.6) $ (0.02) $ 19.3 $ 0.36 $ (2) Expenses attributable to the EchoPark® initiative were $0.02 per fully diluted share in the three months ended March 31, 2014. |
 |