
High-Bandwidth Connectivity Solutions
AboveNet, Inc.
Fourth Quarter 2009
Earnings Conference Call
March 10, 2010
Bill LaPerch, President & CEO
Joe Ciavarella, SVP & CFO

2
Statements made in this presentation that are not historical in nature constitute forward-looking statements
within the meaning of the Safe Harbor Provisions of the Private Securities Litigation Reform Act of 1995.
We cannot assure you that the future results expressed or implied by the forward-looking statements will
be achieved. Such statements are based on the current expectations and beliefs of the management of
AboveNet, Inc. and are subject to a number of risks and uncertainties that could cause actual results to
differ materially from the future results expressed or implied by such forward-looking statements. These
risks and uncertainties include, but are not limited to, the Company's financial and operating prospects,
current economic trends and recessionary pressures, future opportunities, the Company's exposure to the
financial services industry and strength of competition and pricing. The Company's business could be
materially adversely affected and the trading price of the Company's common stock could decline if these
risks and uncertainties develop into actual events. The Company cautions you not to place undue reliance
on these forward-looking statements, which speak only as of their respective dates. The Company
undertakes no obligation to publicly update or revise forward-looking statements to reflect events or
circumstances after the date of this presentation or to reflect the occurrence of unanticipated events. A
more detailed discussion of factors that may affect the Company's business or future financial results is
included in the Company's SEC filings, including, but not limited to, those described in "Risk Factors" and
"Management's Discussion and Analysis of Financial Condition and Results of Operations" in the
Company's Annual Report on Form 10-K for the year ended December 31, 2008 and in the Company's
Quarterly Report on Form 10-Q for the quarter ended September 30, 2009. We discuss certain non-GAAP
financial measures in this presentation and provide the GAAP financial measures that correspond to such
non-GAAP measures, as well as the reconciliation between the two.
Safe Harbor Statement
3
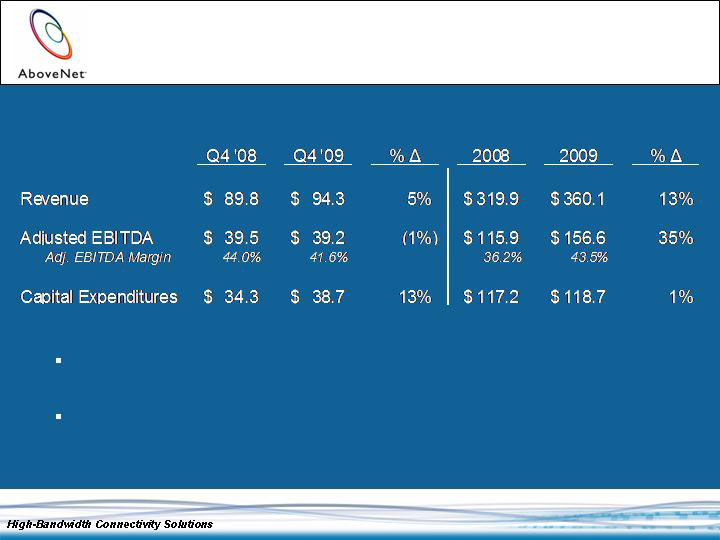
Q4 2009 Highlights
Excluding termination revenue of $8.7M in Q4 2008
and $0.9M in Q4 2009, growth was 15%
Excluding termination revenue of $15.4M in 2008 and
$3.9M in 2009, growth was 17%
$/M
4
Q4 2009 Highlights
Revenue from new customers during the quarter came primarily
from the financial, energy, and healthcare sectors
Continue to see trend of smaller deals ($10k MRC and under)
Grew our team of sales professionals by approximately 15% from
the end of September 2009 through January 2010
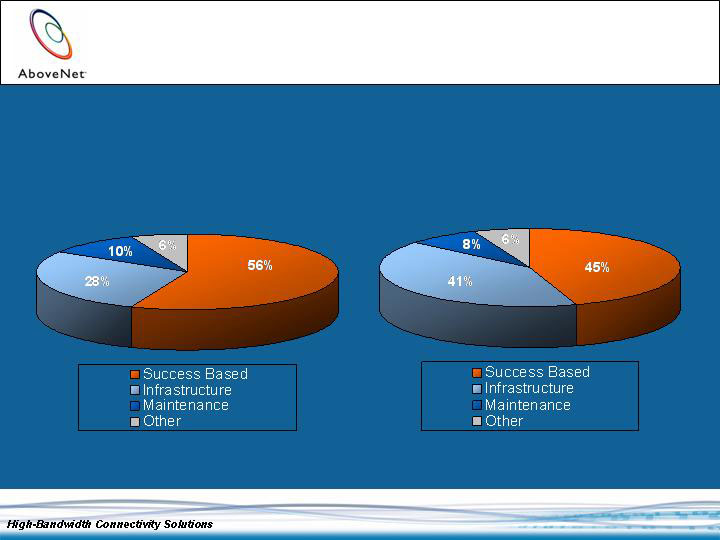
Q4 net contract activity (in $’s) improved over Q3, but 2009
remained lower than 2008
2009 new order activity roughly in line with last year
2009 terminations and downgrades are up over last year, but Q4
returned to levels experienced in first half of 2009, following a
particularly challenging Q3, which included large customer
network optimizations

5
Includes Contract Termination Revenue of $8.7, $0.3, $0.9, respectively
Q4 2009 Highlights
$/M
All periods adjusted for two-for-one stock split delivered 09/03/09
$/M
Q4 ’09 includes $183.0M of non-cash tax benefits
6
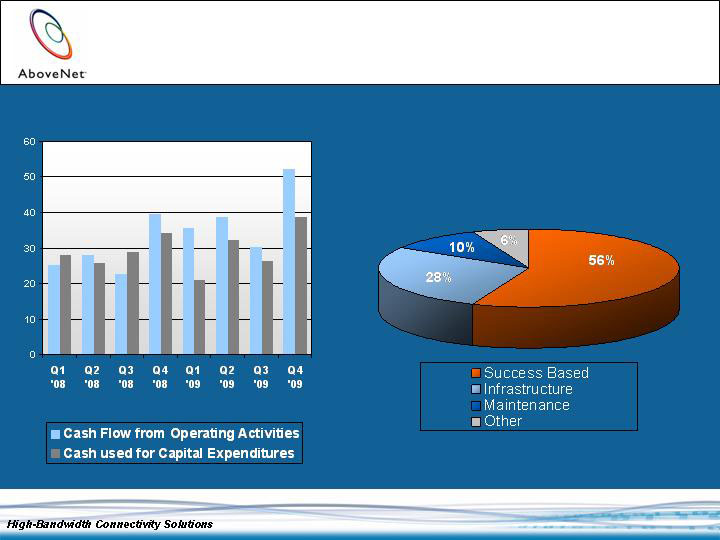
Cash Flow from Operating Activities and Capex
$/M
Capital Expenditure Components
December 31, 2009 YTD

High-Bandwidth Connectivity Solutions
Financial Review
8
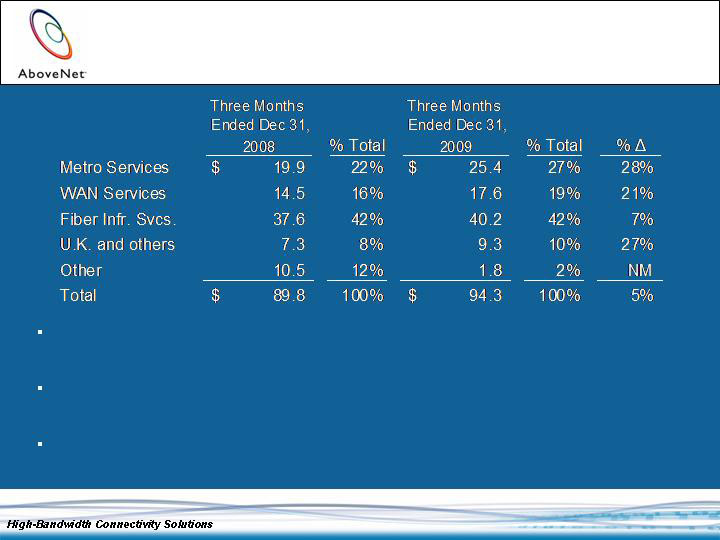
Q4 2009 Revenue –
Year-over-Year Comparison
$/M
Domestic Metro and WAN revenue increased from 38% to 46% of total
revenue between Q4 2008 and Q4 2009
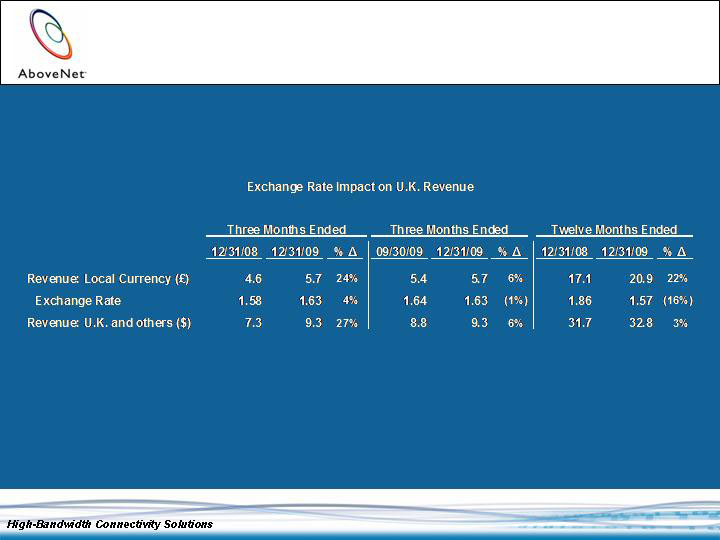
Revenue from U.K. operations grew 24% in local currency and was aided by a
4% strengthening of the British Pound
Other includes Contract Termination Revenue of $8.7M in Q4 2008 vs. $0.9M
in Q4 2009. Adjusting for Contract Termination Revenue, growth was 15%

9
$/M
Revenue from Fiber Infrastructure Services decreased primarily as a result
of terminations and downgrades
Modification of accounting for installation fees negatively impacted Q4
revenue by approximately $1M, or 1%
Revenue from U.K. operations grew 6% in local currency
Q4 2009 Revenue –
Sequential Quarter Comparison

10
Q4 2009 Highlights
Costs of Revenue increased over Q4 2008 primarily a result of increased co-location and third party
network costs
Q4 2009 includes $183.0M of non-cash tax benefits
13% increase in Capex over Q4 2008 primarily a result of sparing program initiated in Q4 2009
* Diluted EPS adjusted for two-for-one stock split delivered 09/03/09
$/M, except EPS

11
Future Scheduled Secured Credit
Facility Repayments
$57.3 million term loan outstanding
$27 million revolver ($26 million available)
2007 2008 2009
Cash/cash equivalents $45.8 $87.1 $165.3
Debt $ 1.8 $37.6 $ 58.6
(1)
$/M (for period ended)
$/M (at period ended)
$/M
(1)
Includes capital lease obligation and senior secured credit
facility in 2008 and 2009
Financial Strength
Secured Credit Facility
Cash Flow
Balance Sheet
2010 2011 2012 2013
$ 7.6 $ 7.6 $ 9.4 $32.7
2007 2008 2009
CF from Operating Act. $69.7 $116.1 $157.2
Capital Expenditures $90.8 $117.2 $118.7
CF from Financing Act. ($5.4) $42.6 $38.9
(2)
(2)
Per Consolidated Statements of Cash Flows
December 31,
December 31,

12
Strong financial results in 2009, particularly given economic conditions
Business conditions remain challenging
Well positioned product suite
Annualized 2009 terminations and downgrades impact 2010 growth
Net new MRR down approximately 20% from 2008 to 2009
2010 Revenue forecast at $395M to $400M
Forecast excludes Contract Termination Revenue
Forecast includes modification of accounting for installation payments
Expect FY 2010 Adjusted EBITDA Margin roughly in line with 2009
actual Adjusted EBITDA margin
2010 Capital Expenditures forecast of $150M to $160M
Includes growth opportunities under analysis
Small impact to 2010 margin
2010 Outlook
13
Capital Expenditure Components
2010 Forecast
2009 Actual
14
Delivery of high-bandwidth
solutions is a core
competency
Dimensions define
elements necessary for
success
High-bandwidth markets
are key to future growth
Existing markets will
continue to expand
New markets offer
significant opportunity in
the long term
Strategic Direction
Internet
Hub Cities
Presence of Data
Intensive Verticals
Large Concentration
of Enterprise
Customers
High Density
of Data Centers
Dimensions
Overview
15
Top 25 Global Markets
1.
New York
2.
Tokyo
3.
London
4.
Washington D.C.
5.
Los Angeles
6.
Chicago
7.
San Francisco
8.
Paris
9.
Toronto
10.
Seoul
11.
Philadelphia
12.
Madrid
13.
Frankfurt
14.
Boston
15.
Hong Kong
16.
Dallas
17.
Amsterdam
18.
Singapore
19.
Atlanta
20.
Miami
21.
Sydney
22.
Milan
23.
Dublin
24.
Houston
25.
Osaka
Commissioned by AboveNet
Analyze global market data
Rank top cities using
AboveNet’s four dimensions
for success
AboveNet has metro
networks in 11 of the top 25
markets
Target markets based on
alignment with capabilities
Source: Ovum, 2010
Top 25 Global Markets
Ovum Study
Existing Market
Potential Market

16
Proactive approach
Extend networks
Build past high value
enterprises
Optimize network paths
Bring new data centers
on-net
Existing Market Growth Initiatives
Investment Approach
Approved investments
in the following cities
Chicago
New York
Washington D.C.
Los Angeles
Boston
Seattle
San Francisco
Markets
17
New Market Growth Initiatives
Markets
Under assessment
Toronto
Miami
Amsterdam
Paris
Frankfurt
Measured approach
Establish initial market
presence
Additional investment
predicated on success
Feedback from existing
customers is important
Investment Approach

High-Bandwidth Connectivity Solutions
Thank You

High-Bandwidth Connectivity Solutions
Appendix
20
$/B
Source: Hoovers (D&B), 2010
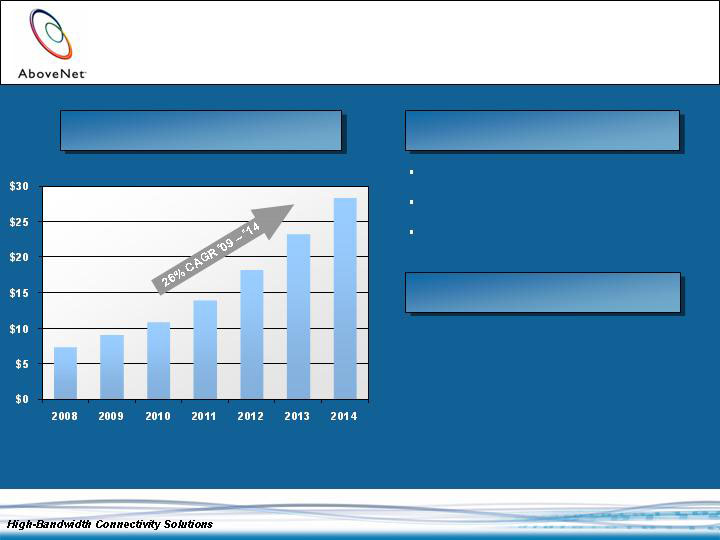
Enterprise Market Trends
Global 100+ Mbps Ethernet
Services
Key Points
Key Enterprise Markets*
1.
New York
2.
Paris
3.
Tokyo
4.
Los Angeles
5.
Chicago
6.
London
7.
Washington D.C.
8.
Dallas
9.
Philadelphia
10.
San Francisco
Source: Ovum data, 2009
* Concentration of enterprises with 300+
employees; excludes China
Enterprise bandwidth growing
Ethernet services are the focus
100+ Mbps Ethernet services is a
proxy for addressable market
21
Source: Jefferies, 2009
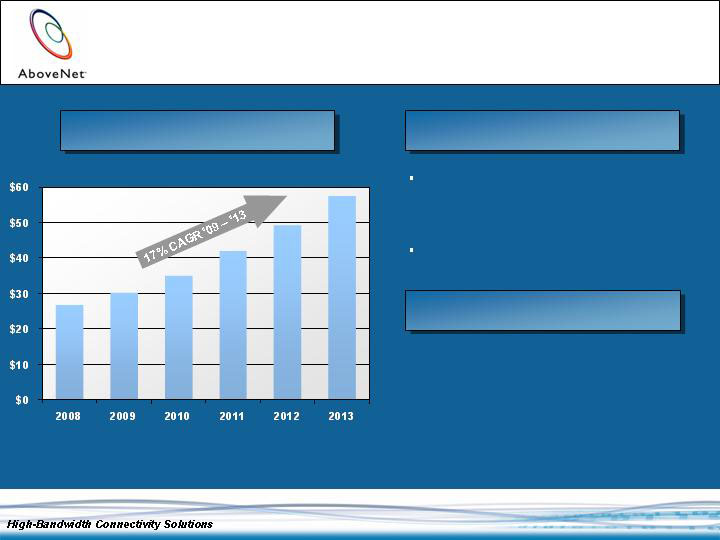
Data Center Trends
Global Data Center Services
Growth
Key Points
Largest Data Center Markets
Source: Telegeography, 2009
1.
New York
2.
San Francisco
3.
Los Angeles
4.
Dallas
5.
Tokyo
6.
Washington D.C.
7.
London
8.
Atlanta
9.
Chicago
10.
Frankfurt
$/B
Carrier neutral data centers are
very important bandwidth
locations
Private data centers also provide
opportunity
22
Source: Cisco, 2009
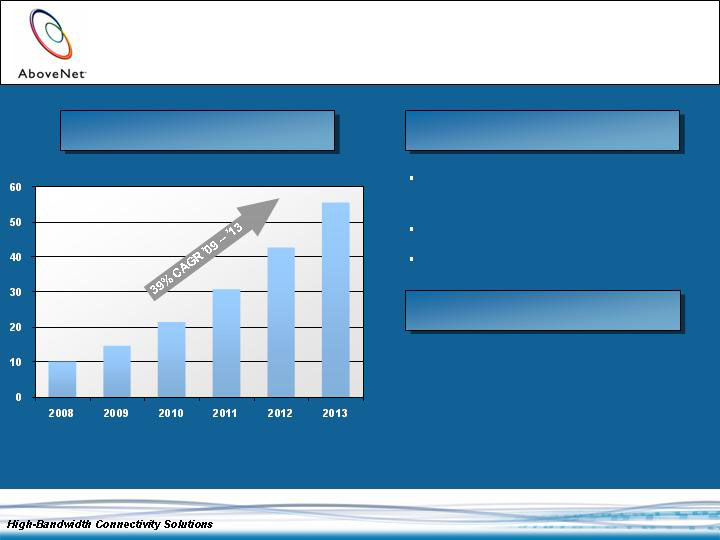
Internet Trends
Global IP Traffic Growth
Key Points
Internet Hub Cities
Source: Telegeography, 2008
US
1.
New York
2.
Washington D.C.
3.
Los Angeles
4.
San Francisco
5.
Miami
Europe
1.
London
2.
Paris
3.
Frankfurt
4.
Amsterdam
5.
Stockholm
PB/Mo
Internet hub cities drive significant
bandwidth need
IP traffic growth is strong
Pricing remains under pressure
23
Source: Ovum, 2008
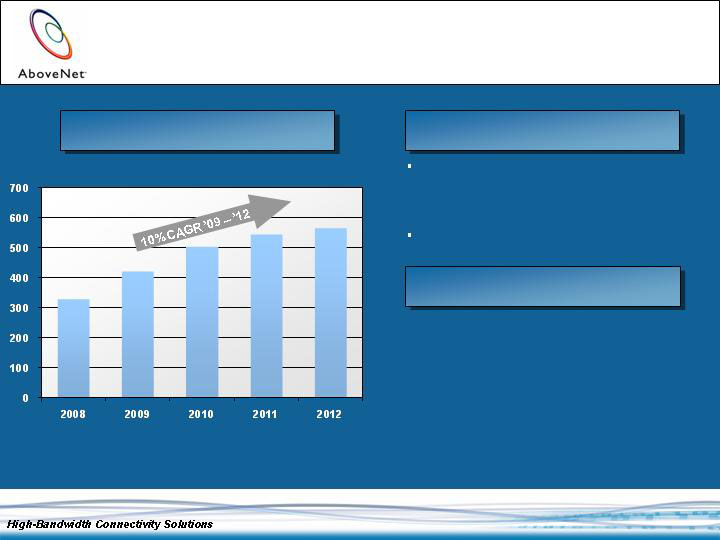
Data Intensive Verticals
Social Networking Growth
Key Points
Markets with Important
Verticals*
Source: Hoovers (D&B), 2010
1.
New York
2.
Tokyo
3.
Los Angeles
4.
Washington D.C.
5.
Chicago
6.
London
7.
San Francisco
8.
Boston
9.
Dallas
10.
Philadelphia
* Concentration of enterprises with 100+ employees in
key verticals (e.g. finance, media and social networking)
Millions of Users
Verticals such as Finance, Media
and social networking tend to have
specialized needs
Flexibility of AboveNet solutions
cater to these needs

24
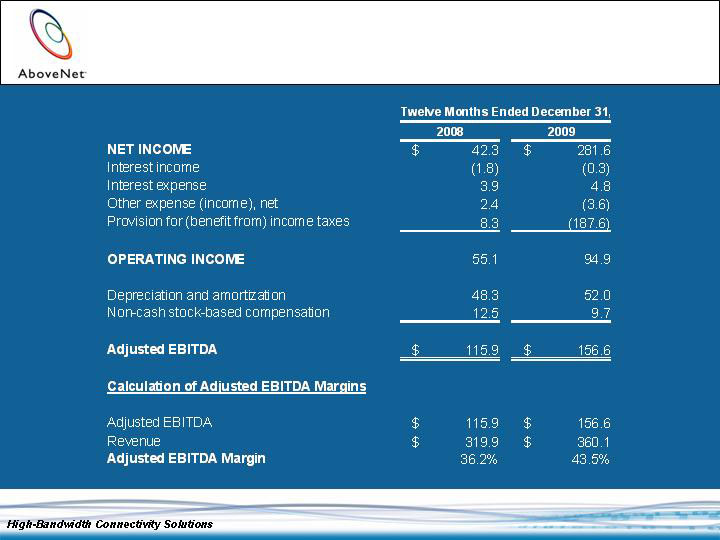
Adjusted EBITDA is defined as net income before provision for
(benefit from) income taxes, other income/expense, interest
income/expense, gain on reversal of foreign currency translation
adjustments from liquidation of subsidiaries, income/loss from
discontinued operations, gain/loss on asset dispositions,
depreciation and amortization, and non-cash stock-based
compensation
Adjusted EBITDA Margin is defined as Adjusted EBITDA divided by
revenue
Revenue, Net of Contract Termination Revenue is defined as
Revenue minus Contract Termination Revenue
Revenue: Local Currency is defined as Revenue from U.K. and
others multiplied by the period average exchange rate between the
functional currency of the foreign subsidiaries and our functional
currency, the U.S. dollar
Reconciliation of Non-GAAP
Financial Measures
25
Reconciliation of Non-GAAP
Financial Measures (Cont’d)
$/M
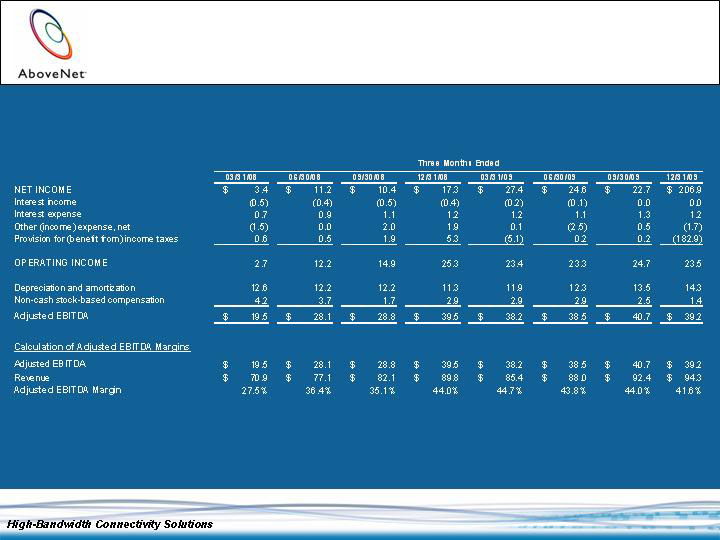
26
Reconciliation of Non-GAAP
Financial Measures (Cont’d)
$/M

27
Reconciliation of Non-GAAP
Financial Measures (Cont’d)
$/M
28
Reconciliation of Non-GAAP
Financial Measures (Cont’d)
(in millions)
Note: The percentage changes are calculated based on the detailed amounts and may differ slightly from
percentages calculated based on rounded amounts in the table above.