
High-Bandwidth Connectivity Solutions
AboveNet, Inc.
Second Quarter 2010
Earnings Conference Call
August 6, 2010
Bill LaPerch, President & CEO
Joe Ciavarella, SVP & CFO

2
Statements made in this presentation that are not historical in nature constitute forward-looking statements
within the meaning of the Safe Harbor Provisions of the Private Securities Litigation Reform Act of 1995.
We cannot assure you that the future results expressed or implied by the forward-looking statements will
be achieved. Such statements are based on the current expectations and beliefs of the management of
AboveNet, Inc. and are subject to a number of risks and uncertainties that could cause actual results to
differ materially from the future results expressed or implied by such forward-looking statements. These
risks and uncertainties include, but are not limited to, the Company's financial and operating prospects,
current economic trends, future opportunities, the Company's exposure to the financial services industry
and strength of competition and pricing. The Company's business could be materially adversely affected
and the trading price of the Company's common stock could decline if these risks and uncertainties
develop into actual events. The Company cautions you not to place undue reliance on these forward-
looking statements, which speak only as of their respective dates. The Company undertakes no obligation
to publicly update or revise forward-looking statements to reflect events or circumstances after the date of
this presentation or to reflect the occurrence of unanticipated events. A more detailed discussion of
factors that may affect the Company's business and future financial results is included in the Company’s
SEC filings, including, but not limited to, those described in “Risk Factors” and "Management's Discussion
and Analysis of Financial Condition and Results of Operations" in the Company's Annual Report on Form
10-K for the year ended December 31, 2009 and in the Company's subsequently filed Quarterly Report(s)
on Form 10-Q. We discuss certain non-GAAP financial measures in this presentation and provide the
GAAP financial measures that correspond to such non-GAAP measures, as well as the reconciliati
on between the two.
Safe Harbor Statement
3
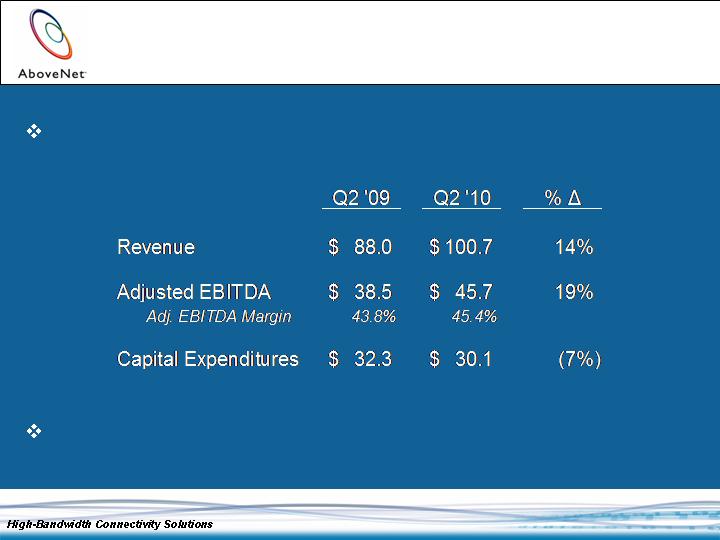
Q2 2010 Highlights
First $100 million revenue quarter
$/M
It was a great quarter

4
Q2 2010 Highlights
Company continues to execute
Customer demand remains steady, signed a few large WDM deals
Net Revenue Attrition in line with business plan
Average MRR for new orders declined slightly
Customer deal provided catalyst to invest in previously inactive
Denver market. Expect to have Denver operational by year end
Launched Core Wave services in select markets
Metro optical core networks based at key data centers
Continued evolution of delivery methodology and service choice
Significant progress toward implementation of growth
initiatives
Capital expenditures will increase during the second half of year

5
Growth Initiatives – New Markets
Expect to be operational in Paris, Frankfurt, and Amsterdam by
year end
ROADM-based metro optical networks in London, Paris,
Frankfurt and Amsterdam
Scalable, next-generation European long haul network to connect
the markets together
Ability to offer services into 32 data centers in Europe
Sales effort to begin in the fourth quarter
Connected Miami to our domestic long haul network
Toronto – expect regulatory ruling by end of the third quarter
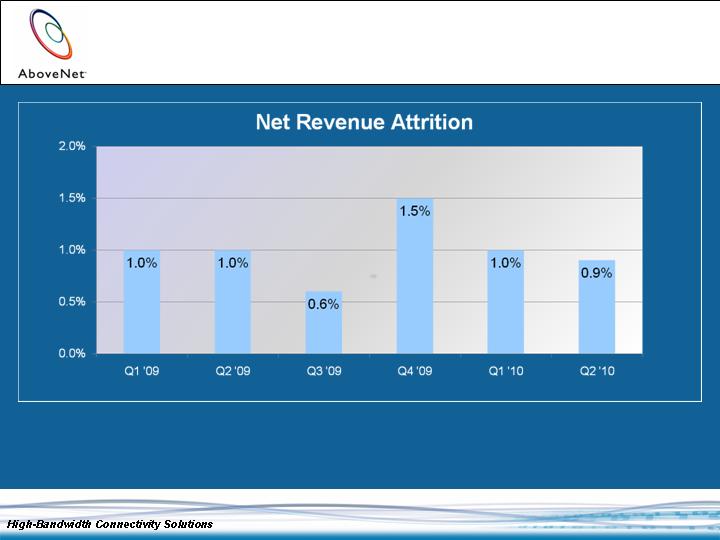
Net Revenue Attrition
6
Net Revenue Attrition: the reduction in monthly recurring revenue (MRR) for customers with net
decreases in MRR in the quarter (as a result of terminations, price declines and other decreases, which
are offset by any increases) divided by total revenue for the quarter (excluding contract termination
revenue).
7
Includes Contract Termination Revenue of $0.8, $1.0, $0.6, respectively
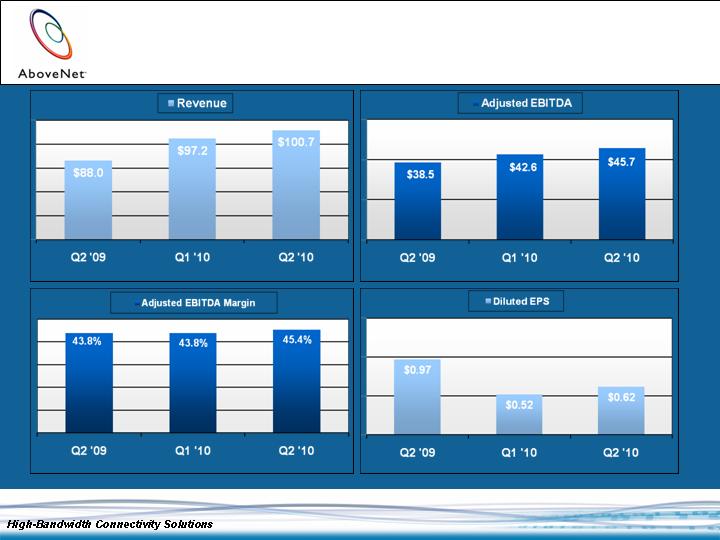
Q2 2010 Highlights
$/M
All periods adjusted for two-for-one stock split effective 09/03/09
$/M
Q1 and Q2 ’10 include income tax provisions that are
substantially non-cash.
8
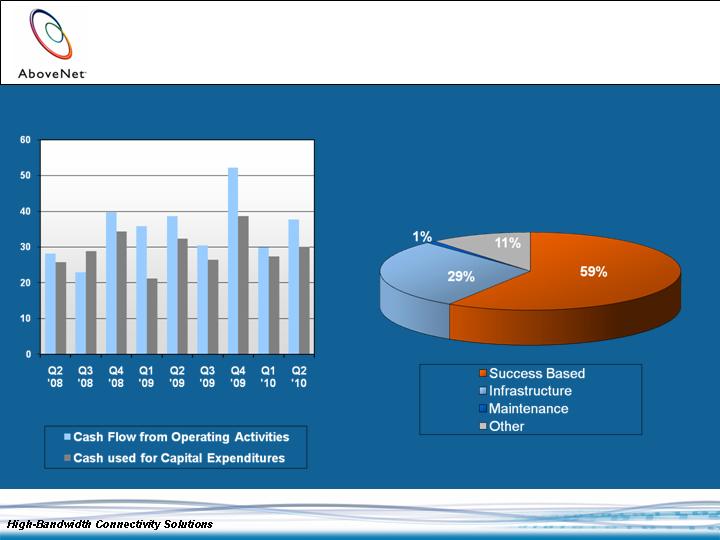
Cash Flow from Operating Activities and Capex
$/M
Capital Expenditure Components
June 30, 2010 YTD

High-Bandwidth Connectivity Solutions
Financial Review
10
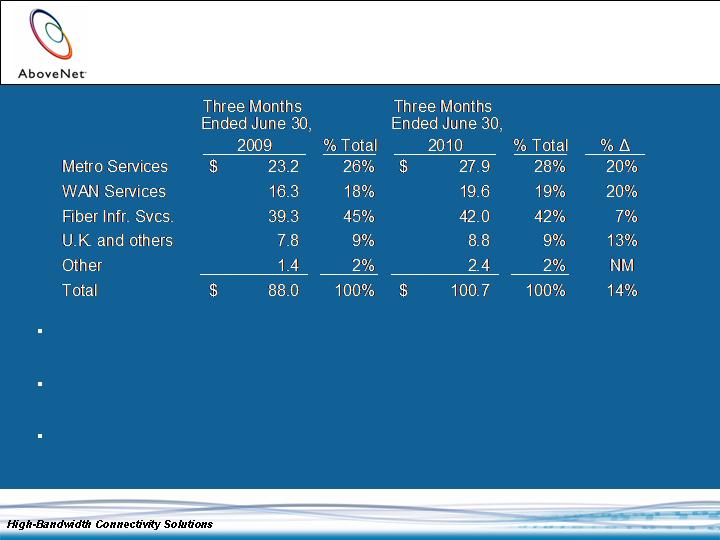
Q2 2010 Revenue –
Year-over-Year Comparison
$/M
Domestic Metro and WAN revenue increased from 44% to 47% of total revenue
between Q2 2009 and Q2 2010
Revenue from U.K. operations increased 20% in local currency, which was offset
by a 4% impact due to weakening of the British Pound
Contract Termination Revenue was $0.8M in Q2 2009 vs. $0.6M in Q2 2010.
Adjusting for Contract Termination Revenue, increase was 15%
11
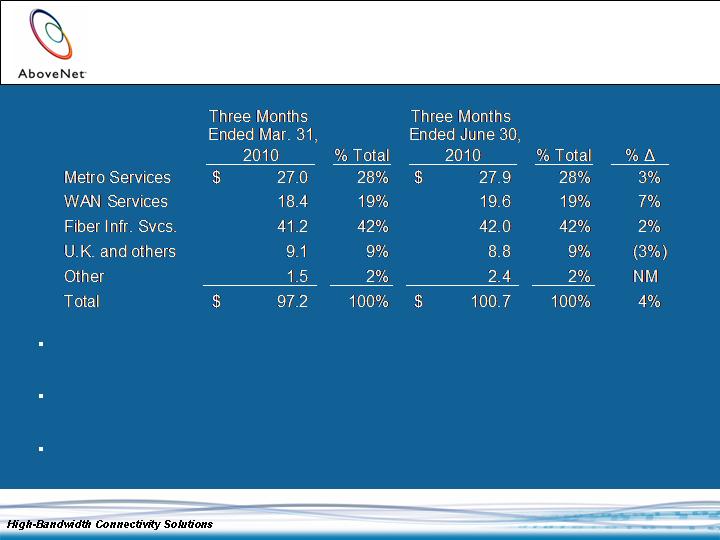
$/M
Domestic Metro and WAN Services accounted for majority of revenue increase
over Q1 2010
Revenue from U.K. operations increased 3% in local currency, which was offset
by a 6% impact due to weakening of the British Pound
Contract Termination Revenue was $1.0M in Q1 2010 vs. $0.6M in Q2 2010
Q2 2010 Revenue –
Sequential Quarter Comparison

12
Q2 2010 Highlights
Costs of Revenue increased over Q2 2009 primarily a result of increased co-location and expenses associated with
re-billable equipment sales to customers
Net Income and Diluted EPS for Q2 2009, Q1 2010 and Q2 2010 include income tax provisions of $0.2M, $9.6M and
$11.1M, respectively. In Q1 and Q2 2010, these income tax provisions are substantially non-cash
* Diluted EPS adjusted for two-for-one stock split effective 09/03/09
$/M, except EPS

13
Future Scheduled Secured Credit
Facility Repayments (as of 6/30/10)
$53.6 million term loan outstanding
$27 million revolver ($26 million available)
2008 2009 2010
Cash/cash equivalents $87.1 $165.3 $173.0
Debt(1)
$37.6 $58.6 $54.9
$/M (for period ended)
$/M (at period ended)
$/M
(1)
Includes capital lease obligation and senior secured credit
facility
Financial Strength
Secured Credit Facility
Cash Flow
Balance Sheet
2010 2011 2012 2013
$ 3.9 $ 7.6 $ 9.4 $32.7
2008 2009 2010
CF from Operating Act. $116.1 $157.2 $67.7
Capital Expenditures (2) $117.2 $118.7 $57.5
CF from Financing Act. $42.6 $38.9 ($2.2)
(2)
Per Consolidated Statements of Cash Flows
December 31,
December 31,
June 30,
June 30,

14
Business continues to perform well
Revenue guidance raised to $400M - $410M from $395M - $400M
Macroeconomic conditions remain uncertain; keeping Net Revenue
Attrition assumption at 1%
Revised revenue guidance includes Contract Termination Revenue for
full year
FY 2010 Adjusted EBITDA Margin expectations:
Roughly in line, to slightly above, 2009 actual Adjusted EBITDA margin
2010 Capital Expenditures forecast of $150M to $160M unchanged
Growth initiatives contribute to increased second half capital spend
2010 Outlook

High-Bandwidth Connectivity Solutions
Thank You

High-Bandwidth Connectivity Solutions
Appendix

17
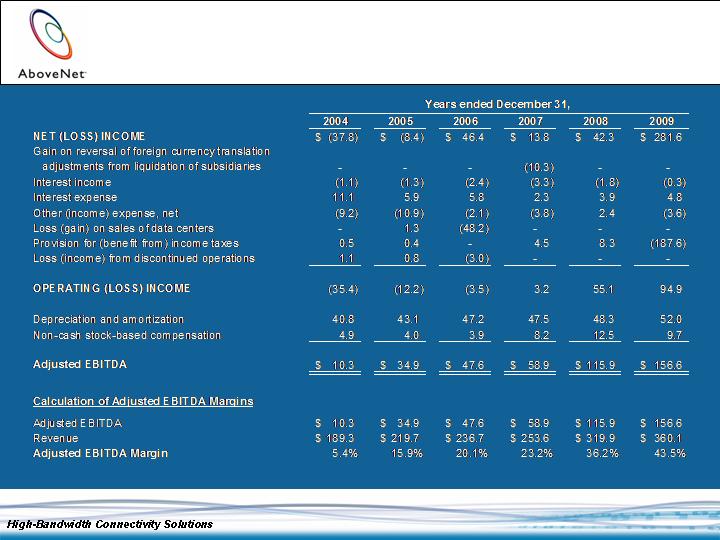
Adjusted EBITDA is defined as net income before provision for
(benefit from) income taxes, other income/expense, interest
income/expense, gain on reversal of foreign currency translation
adjustments from liquidation of subsidiaries, income/loss from
discontinued operations, gain/loss on asset dispositions,
depreciation and amortization, and non-cash stock-based
compensation
Adjusted EBITDA Margin is defined as Adjusted EBITDA divided by
revenue
Revenue, Net of Contract Termination Revenue is defined as
Revenue minus Contract Termination Revenue
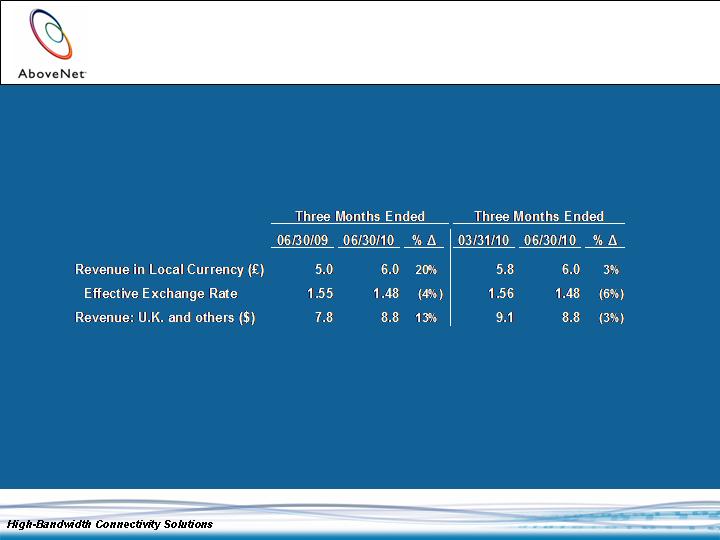
Revenue in Local Currency is defined as Revenue from U.K. and
others in the respective functional currency. This amount is
multiplied by the period average exchange rate between such local
functional currency and our functional currency, the U.S. dollar, to
derive Revenue: UK and others ($)
Reconciliation of Non-GAAP
Financial Measures
18
Reconciliation of Non-GAAP
Financial Measures (Cont’d)

19
Reconciliation of Non-GAAP
Financial Measures (Cont’d)
$/M

20
Reconciliation of Non-GAAP
Financial Measures (Cont’d)
$/M
21
Reconciliation of Non-GAAP
Financial Measures (Cont’d)
(in millions)
Note: The percentage changes are calculated based on the detailed amounts and may differ slightly from
percentages calculated based on rounded amounts in the table above.

Reconciliation of Non-GAAP
Financial Measures (Cont’d)
AboveNet’s management believes that adjusted or modified EBITDA and its related margin are measures of
operating performance that are commonly reported and widely used by analysts, investors, and other interested
parties in the telecommunications industry because they eliminate many differences in financial, capitalization,
and tax structures, as well as certain non-cash and non-operating charges to earnings. AboveNet’s
management currently uses Adjusted EBITDA and Adjusted EBITDA Margin for these purposes. AboveNet’s
management believes that Adjusted EBITDA and Adjusted EBITDA Margin trends can be used as indicators of
whether the Company’s operations are able to produce sufficient operating cash flow to fund working capital
needs, service debt obligations and fund capital expenditures.
Adjusted EBITDA is also used by the Company for other purposes, including, management’s assessment of
ongoing operations and as a measure for performance-based compensation. However, the definition of
adjusted EBITDA for other purposes may differ from the definition of Adjusted EBITDA used herein. For
example, for 2009 and 2010 the definition of adjusted EBITDA in the Company’s incentive cash bonus plan
excludes certain customer termination fees. Additionally, Adjusted EBITDA as used in this press release may
not be calculated identically to similarly titled measures reported by other companies.
The Company also reviews revenue, net of contract termination revenue as well as revenue in local currency.
Revenue, net of contract termination revenue shows the change in the Company’s recurring revenue from
period to period excluding the impact of non-recurring contract termination revenue. Revenue in local currency
shows the changes of foreign subsidiary revenue without the impact of currency fluctuations. Management
believes these non-GAAP metrics provide helpful insight into revenue trends.
22