AboveNet, Inc. First Quarter 2011 Earnings Conference Call May 5, 2011 Bill LaPerch, President & CEO Joe Ciavarella, SVP & CFO High Bandwidth Connectivity Solutions High Bandwidth Connectivity Solutions
Safe Harbor Statement Statements made in this presentation that are not historical in nature constitute forward -looking statements within the meaning of the Safe Harbor Provisions of the Private Securities Litigation Reform Act of 1995. We cannot assure you that the future results expressed or implied by the forward -looking statements will be achieved . Such statements are based on the current expectations and beliefs of the management of AboveNet, Inc. and are subject to a number of risks and uncertainties that could cause actual results to differ materially from the future results expressed or implied by such forward -looking statements . These risks and uncertainties include, but are not limited to, industry competition, pricing and macro-economic conditions and the Company's financial and operating prospects . The Company's business could be materially adversely affected and the trading price of the Company's common stock could decline if these risks and uncertainties develop into actual events. The Company cautions you not to place undue reliance on these forward -looking statements, which speak only as of their respective dates. The Company undertakes no obligation to publicly update or revise forward -looking statements to reflect events or circumstances after the date of this presentation or to reflect the occurrence of unanticipated events. A more detailed discussion of factors that may affect the Company's business and future financial results is included in the Company’s SEC filings, including, but not limited to, those described in “Risk Factors” and "Management's Discussion and Analysis of Financial Condition and Results of Operations" in the Company's Annual Report on Form 10-K for the year ended December 31, 2010 and in the Company's subsequently filed Quarterly Report(s) on Form 10-Q. We discuss certain non-GAAP financial measures in this presentation and provide the GAAP financial measures that correspond to such non-GAAP measures, as well as the reconciliation between the two. High Bandwidth Connectivity Solutions 2
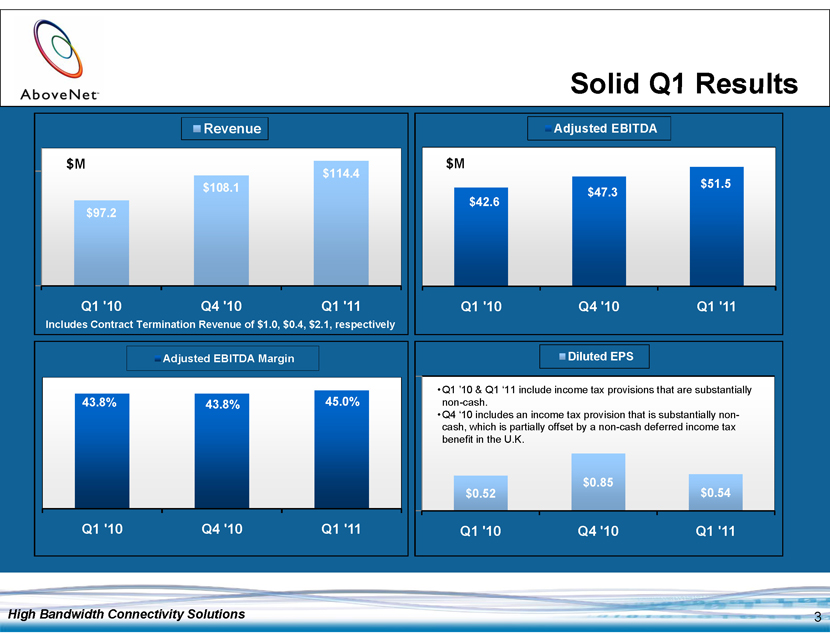
High Bandwidth Connectivity Solutions 3 Solid Q1 Results Revenue Adjusted EBITDA $M $M $114.4 $108.1 $51.5 $47.3 $42.6 $97.2 Q1 '10 Q4 '10 Q1 '11 Q1 '10 Q4 '10 Q1 '11 Includes Contract Termination Revenue of $1.0, $0.4, $2.1, respectively Adjusted EBITDA Margin Diluted EPS •Q1 ’10 & Q1 ‘11 include income tax provisions that are substantially 43.8% 43.8% 45.0% non-cash. •Q4 ‘10 includes an income tax provision that is substantially non-cash, which is partially offset by a non-cash deferred income tax benefit in the U.K. $0.85 $0.52 $0.54 Q1 '10 Q4 '10 Q1 '11 Q1 '10 Q4 '10 Q1 '11
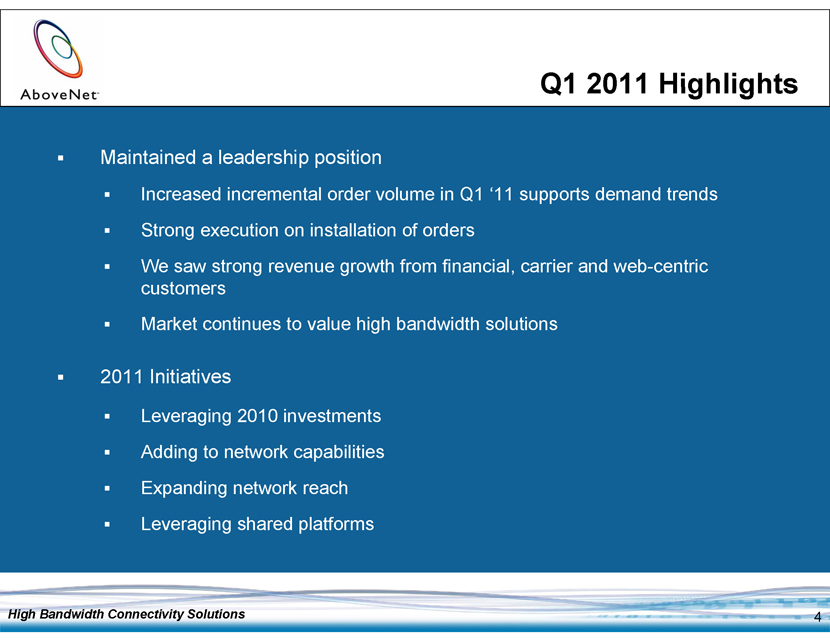
Q1 2011 Highlights § Maintained a leadershi p position § Increased incremental order volume in Q1 ‘11 supports demand trends§ Strong execution on installation of orders§ We saw strong revenue growth from financial, carrier and web-centric customers § Market continues to value high bandwidth solutions § 2011 Initiatives § Leveraging 2010 investments§ Adding to network capabilities§ Expanding network reach§ Leveraging shared platforms High Bandwidth Connectivity Solutions 4
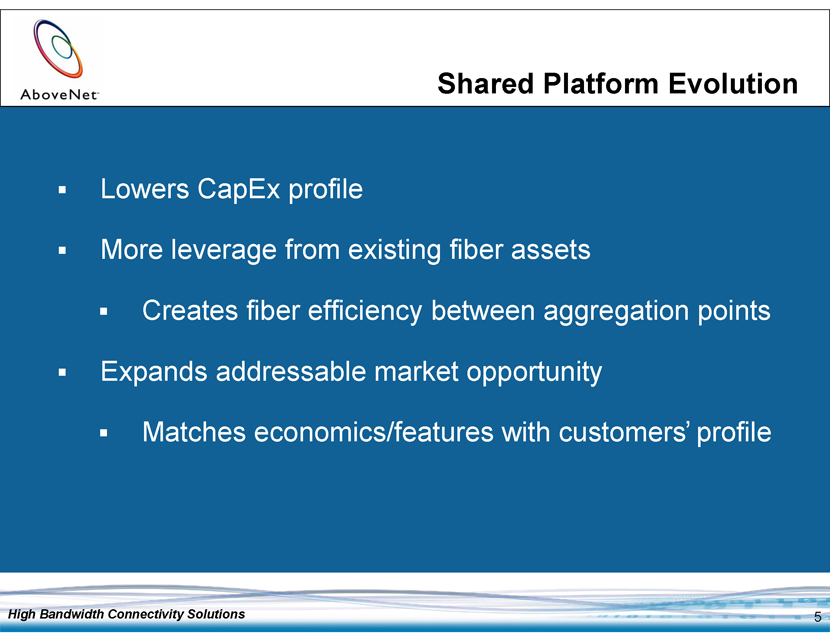
Shared Platform Evolution § Lowers CapEx profile § More leverage from existing fiber assets § Creates fiber efficienc y between aggregation points § Expands addressable market opportunity § Matches economics/features with customers profile High Bandwidth Connectivity Solutions 5
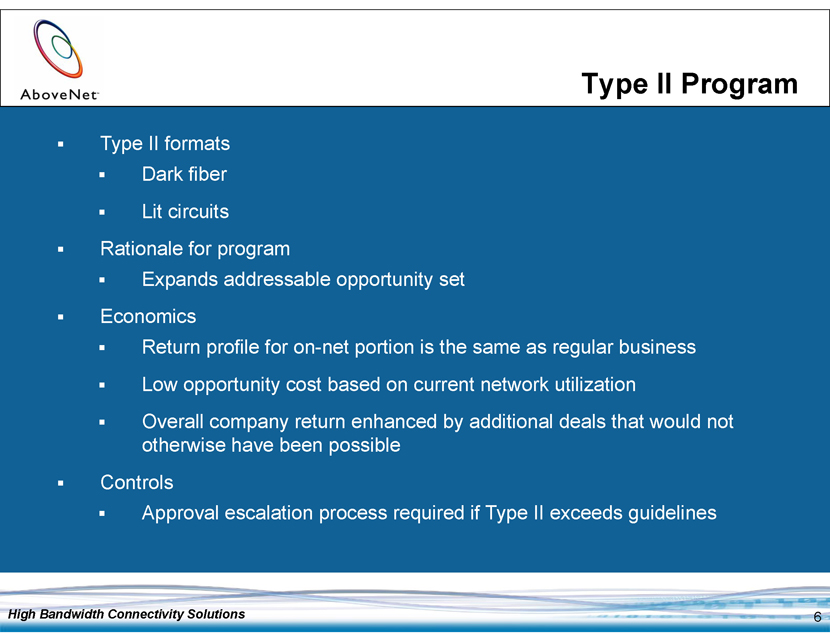
Type II Program § Type II formats§ Dark fiber§ Lit circuits§ Rationale for program § Expands addressable opportunity set § Economics § Return profile for on-net portion is the same as regular business§ Low opportunity cost based on current network utilization § Overall company return enhanced by additional deals that would not otherwise have been possible§ Controls§ Approval escalation process required if Type II exceeds guidelines High Bandwidth Connectivity Solutions 6
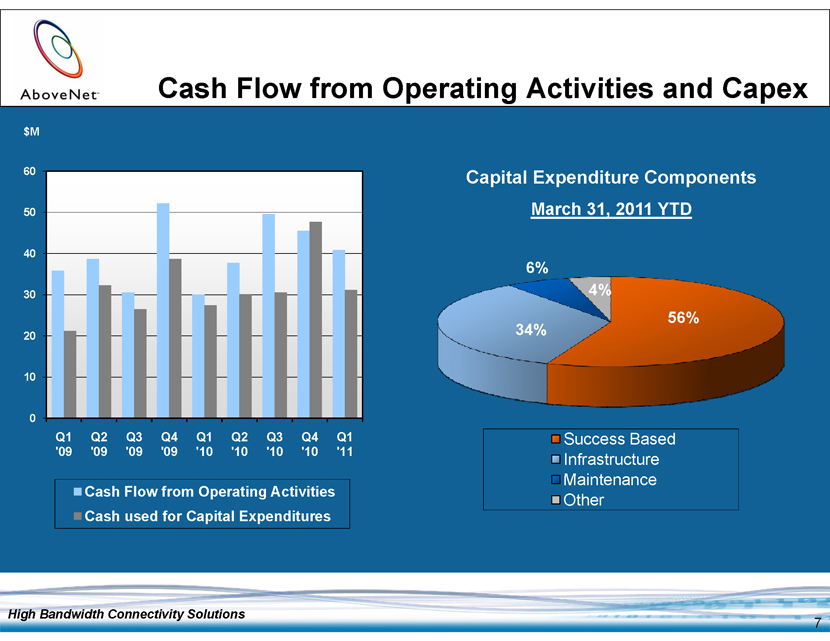
Cash Flow from Operating Activities and Capex $M 60 Capital Expenditure Components 50 March 31, 2011 YTD 40 6% 30 4% 56% 20 34% 10 0 Q1 Q2 Q3 Q4 Q1 Q2 Q3 Q4 Q1 Success Based '09 '09 '09 '09 '10 '10 '10 '10 '11 Infrastructure Maintenance Cash Flow from Operating Activities Other Cash used for Capital Expenditures High Bandwidth Connectivity Solutions 7
Financial Review High Bandwidth Connectivity Solutions High Bandwidth Connectivity Solutions
Q1 2011 Revenue –Year -over -Year Comparison $M Three Months Three Months Ended Mar 31, Ended Mar 31, 2010 % Total 2011 % Total % Metro Services $ 27.0 28% $ 31.4 28% 16% WAN Services 18.4 19% 22.6 20% 23% Fiber Infr. Svcs. 41.2 42% 45.1 39% 9% U.K. and others 9.1 9% 10.6 9% 16% Other 1.5 2% 4.7 4% NM Total $ 97.2 100% $ 114.4 100% 18% § Domestic Metro and WAN revenue increased slightly as a percent of total revenue between Q1 2010 and Q1 2011 § Revenue from U.K. operations increased 14% in local currency § Contract Termination Revenue was $1.0M in Q1 2010 vs. $2.1M in Q1 2011 High Bandwidth Connectivity Solutions 9
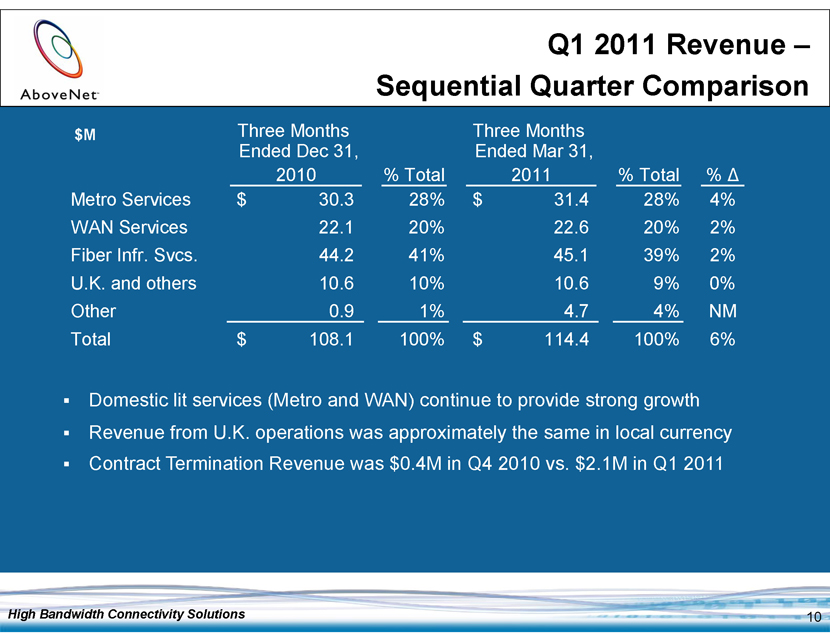
Q1 2011 Revenue –Sequential Quarter Comparison $M Three Months Three Months Ended Dec 31, Ended Mar 31, 2010 % Total 2011 % Total % Metro Services $ 30.3 28% $ 31.4 28% 4% WAN Services 22.1 20% 22.6 20% 2% Fiber Infr. Svcs. 44.2 41% 45.1 39% 2% U.K. and others 10.6 10% 10.6 9% 0% Other 0.9 1% 4.7 4% NM Total $ 108.1 100% $ 114.4 100% 6% § Domestic lit services (Metro and WAN) continue to provide strong growth § Revenue from U.K. operations was approximately the same in local currency§ Contract Termination Revenue was $0.4M in Q4 2010 vs. $2.1M in Q1 2011 High Bandwidth Connectivity Solutions 10

Q1 2011 Highlights $M, except EPS Three Months Ended Three Months Ended Mar 31, Mar, 31 Dec 31, Mar 31, 2010 2011 % 2010 2011 % Revenue $ 97.2 $ 114.4 18% $ 108.1 $ 114.4 6% Costs of Revenue 33.1 40.2 21% 39.9 40.2 1% SG&A 23.6 29.8 26% 26.9 29.8 11% Adj. EBITDA $ 42.6 $ 51.5 21% $ 47.3 $ 51.5 9% Adj. EBITDA Margin 43.8% 45.0% 43.8% 45.0% Net Income $ 13.6 $ 14.5 7% $ 22.3 $ 14.5 NM Diluted EPS 0.52 0.54 4% 0.85 0.54 NM Capital Expenditures $ 27.4 $ 31.1 14% $ 47.7 $ 31.1 (35%) § Costs of Revenue increased over Q1 2010 due to payroll-related expenses, third party network costs, amounts re-billed to customers for equipment sales and repairs and maintenance charges § Costs of Revenue increased sequentially due substantially to the same factors above, but Q4 2010 also included impairment charges of $1.6M § SG&A increased over Q1 2010 and sequentially primarily because of an increase in non-cash stock-based compensation expense, sales commissions, third party commissions and professional fees§ The Q4 2010 income tax provision was partially offset by a non-cash deferred income tax benefit in the U.K. of $7.3M. The income tax provisions and benefits in all quarters are substantially non-cash High Bandwidth Connectivity Solutions 11
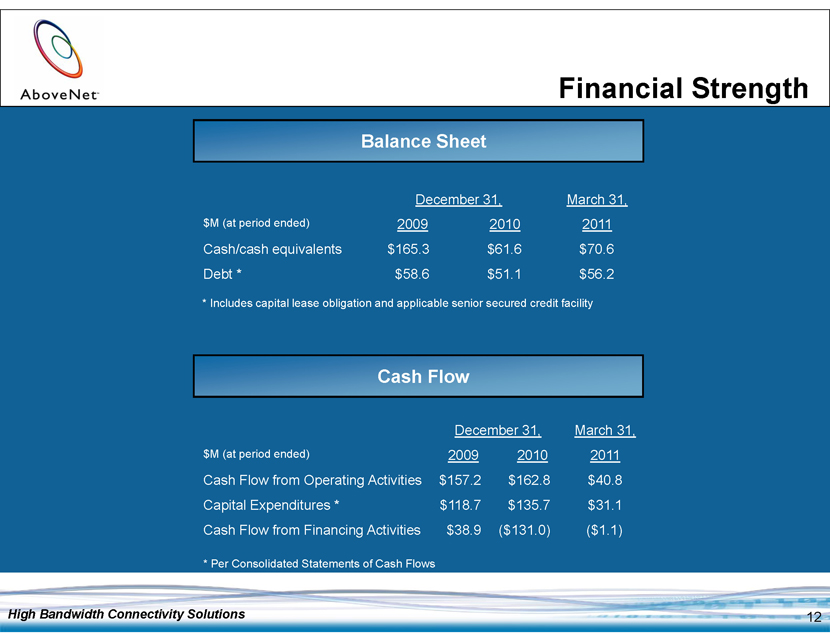
December 31, March 31, $M (at period ended) 2009 2010 2011 Cash/cash equivalents $165.3 $61.6 $70.6 Debt * $58.6 $51.1 $56.2 * Includes capital lease obligation and applicable senior secured credit facility Cash Flow December 31, March 31, $M (at period ended) 2009 2010 2011 Cash Flow from Operating Activities $157.2 $162.8 $40.8 Capital Expenditures * $118.7 $135.7 $31.1 Cash Flow from Financing Activities $38.9 ($131.0) ($1.1) * Per Consolidated Statements of Cash Flows High Bandwidth Connectivity Solutions 12 Financial Strength Balance Sheet
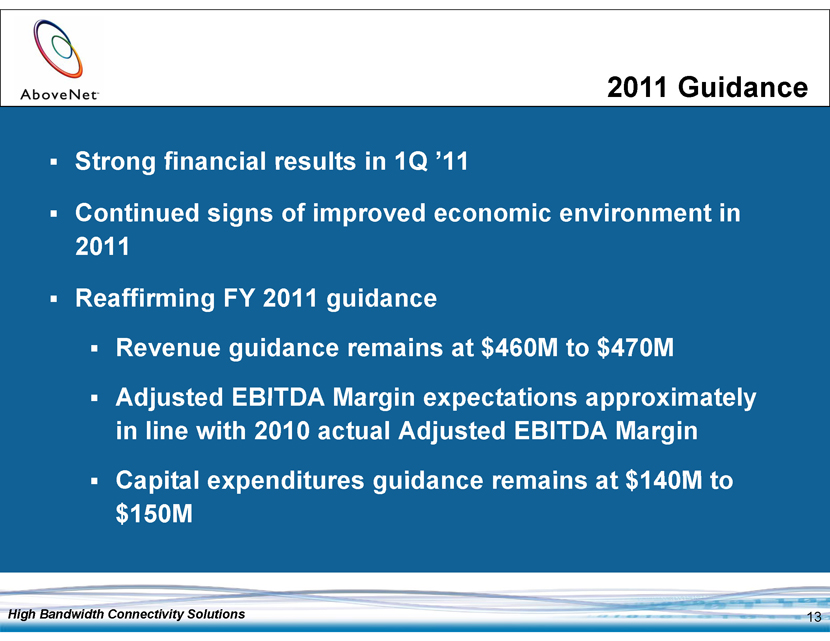
2011 Guidance §Strong financial results in 1Q ’11 §Continued signs of improved economic environment in 2011 §Reaffirming FY 2011 guidance §Revenue guidance remains at $460M to $470M§Adjusted EBITDA Margin expectations approximately in line with 2010 actual Adjusted EBITDA Margin§Capital expenditures guidance remains at $140M to $150M High Bandwidth Connectivity Solutions 13
Appendix High Bandwidth Connectivity Solutions High Bandwidth Connectivity Solutions
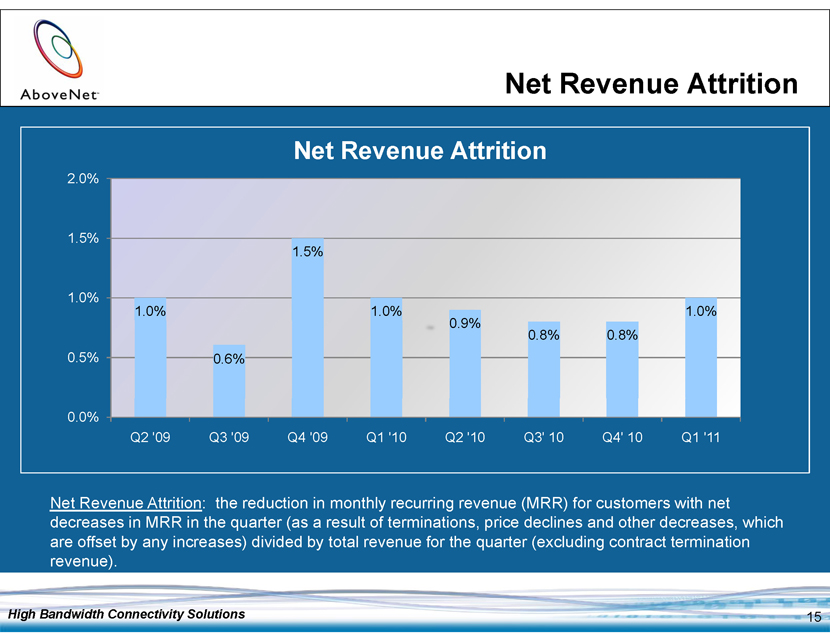
Net Revenue Attrition Net Revenue Attrition 2.0% 1.5% 1.5% 1.0% 1.0% 1.0% 1.0% 0.9% 0.8% 0.8% 0.5% 0.6% 0.0% Q2 '09 Q3 '09 Q4 '09 Q1 '10 Q2 '10 Q3' 10 Q4' 10 Q1 '11 Net Revenue Attrition: the reduction in monthly recurring revenue (MRR) for customers with net decreases in MRR in the quarter (as a result of terminations, price declines and other decreases, which are offset by any increases) divided by total revenue for the quarter (excluding contract termination revenue) . High Bandwidth Connectivity Solutions 15
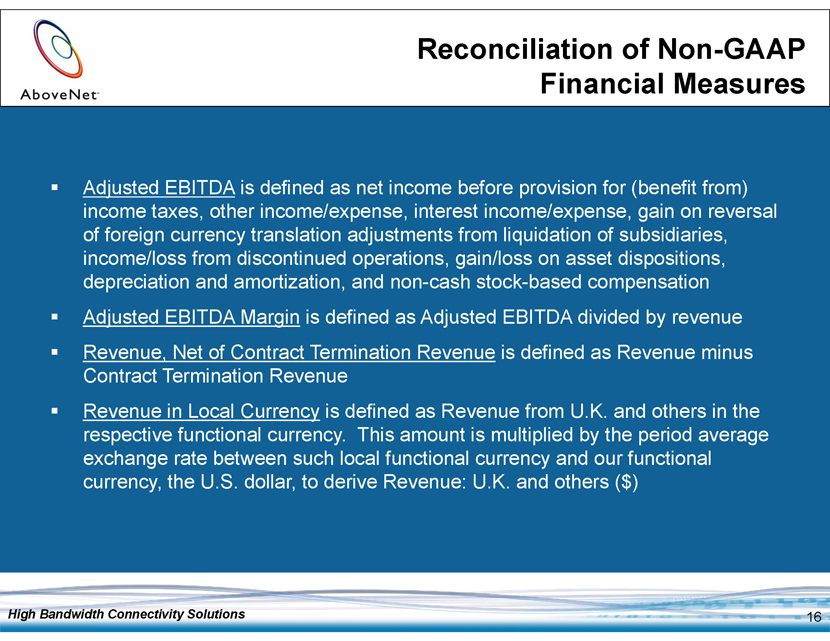
Reconciliation of Non-GAAP Financial Measures § Adjusted EBITDA is defined as net income before provision for (benefit from) income taxes, other income/expense, interest income/expense, gain on reversal of foreign currenc y translation adjustments from liquidation of subsidiaries , income/loss from discontinued operations, gain/loss on asset dispositions, depreciation and amortization, and non-cash stock-based compensation § Adjusted EBITDA Margin is defined as Adjusted EBITDA divided by revenue § Revenue, Net of Contract Termination Revenue is defined as Revenue minus Contract Termination Revenue§ Revenue in Local Currency is defined as Revenue from U.K. and others in the respective functional currency . This amount is multiplied by the period average exchange rate between such local functional currency and our functional currency, the U.S. dollar, to derive Revenue: U.K. and others ($) High Bandwidth Connectivity Solutions 16
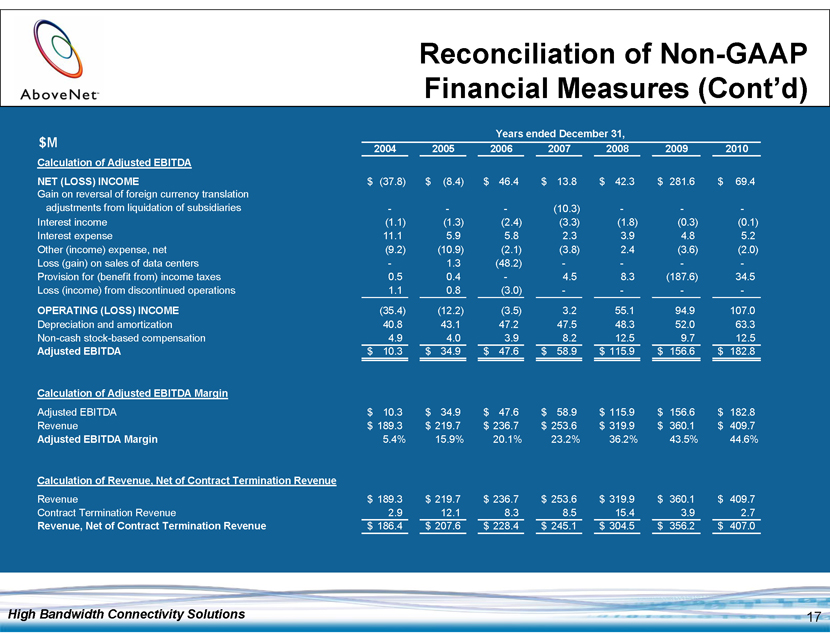
Reconciliation of Non -GAAP Financial Measures (Cont ’d) Years ended December 31, $M 2004 2005 2006 2007 2008 2009 2010 Calculation of Adjusted EBITDA NET (LOSS) INCOME $ (37.8) $ (8.4) $ 46.4 $ 13.8 $ 42.3 $ 281.6 $ 69.4 Gain on reversal of foreign currency translation adjustments from liquidation of subsidiaries - - - (10.3) - - -Interest income (1.1) (1.3) (2.4) (3.3) (1.8) (0.3) (0.1) Interest expense 11.1 5.9 5.8 2.3 3.9 4.8 5.2 Other (income) expense, net (9.2) (10.9) (2.1) (3.8) 2.4 (3.6) (2.0) Loss (gain) on sales of data centers - 1.3 (48.2) - - - -Provision for (benefit from) income taxes 0.5 0.4 - 4.5 8.3 (187.6) 34.5 Loss (income) from discontinued operations 1.1 0.8 (3.0) - - - -OPERATING (LOSS) INCOME (35.4) (12.2) (3.5) 3.2 55.1 94.9 107.0 Depreciation and amortization 40.8 43.1 47.2 47.5 48.3 52.0 63.3 Non-cash stock-based compensation 4.9 4.0 3.9 8.2 12.5 9.7 12.5 Adjusted EBITDA $ 10.3 $ 34.9 $ 47.6 $ 58.9 $ 115.9 $ 156.6 $ 182.8 Calculation of Adjusted EBITDA Margin Adjusted EBITDA $ 10.3 $ 34.9 $ 47.6 $ 58.9 $ 115.9 $ 156.6 $ 182.8 Revenue $ 189.3 $ 219.7 $ 236.7 $ 253.6 $ 319.9 $ 360.1 $ 409.7 Adjusted EBITDA Margin 5.4% 15.9% 20.1% 23.2% 36.2% 43.5% 44.6% Calculation of Revenue, Net of Contract Termination Revenue Revenue $ 189.3 $ 219.7 $ 236.7 $ 253.6 $ 319.9 $ 360.1 $ 409.7 Contract Termination Revenue 2.9 12.1 8.3 8.5 15.4 3.9 2.7 Revenue, Net of Contract Termination Revenue $ 186.4 $ 207.6 $ 228.4 $ 245.1 $ 304.5 $ 356.2 $ 407.0 High Bandwidth Connectivity Solutions 17
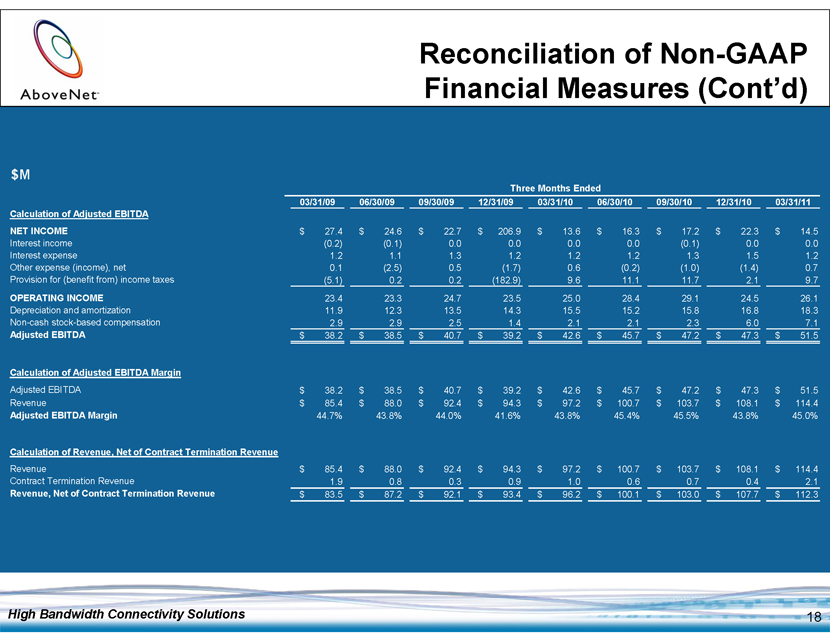
Reconciliation of Non -GAAP Financial Measures (Cont ’d) $M Three Months Ended 03/31/09 06/30/09 09/30/09 12/31/09 03/31/10 06/30/10 09/30/10 12/31/10 03/31/11 Calculation of Adjusted EBITDA NET INCOME $ 27.4 $ 24.6 $ 22.7 $ 206.9 $ 13.6 $ 16.3 $ 17.2 $ 22.3 $ 14.5 Interest income (0.2) (0.1) 0.0 0.0 0.0 0.0 (0.1) 0.0 0.0 Interest expense 1.2 1.1 1.3 1.2 1.2 1.2 1.3 1.5 1.2 Other expense (income), net 0.1 (2.5) 0.5 (1.7) 0.6 (0.2) (1.0) (1.4) 0.7 Provision for (benefit from) income taxes (5.1) 0.2 0.2 (182.9) 9.6 11.1 11.7 2.1 9.7 OPERATING INCOME 23.4 23.3 24.7 23.5 25.0 28.4 29.1 24.5 26.1 Depreciation and amortization 11.9 12.3 13.5 14.3 15.5 15.2 15.8 16.8 18.3 Non-cash stock-based compensa tion 2.9 2.9 2.5 1.4 2.1 2.1 2.3 6.0 7.1 Adjusted EBITDA $ 38.2 $ 38.5 $ 40.7 $ 39.2 $ 42.6 $ 45.7 $ 47.2 $ 47.3 $ 51.5 Calculation of Adjusted EBITDA Margin Adjusted EBITDA $ 38.2 $ 38.5 $ 40.7 $ 39.2 $ 42.6 $ 45.7 $ 47.2 $ 47.3 $ 51.5 Revenue $ 85.4 $ 88.0 $ 92.4 $ 94.3 $ 97.2 $ 100.7 $ 103.7 $ 108.1 $ 114.4 Adjusted EBITDA Margin 44.7% 43.8% 44.0% 41.6% 43.8% 45.4% 45.5% 43.8% 45.0% Calculation of Revenue, Net of Contract Termination Revenue Revenue $ 85.4 $ 88.0 $ 92.4 $ 94.3 $ 97.2 $ 100.7 $ 103.7 $ 108.1 $ 114.4 Contract Termination Revenue 1.9 0.8 0.3 0.9 1.0 0.6 0.7 0.4 2.1 Revenue, Net of Contract Termination Revenue $ 83.5 $ 87.2 $ 92.1 $ 93.4 $ 96.2 $ 100.1 $ 103.0 $ 107.7 $ 112.3 High Bandwidth Connectivity Solutions 18

Reconciliation of Non -GAAP Financial Measures (Cont ’d) (Revenue in millions) Three Months Ended Three Months Ended 03/31/10 03/31/11 % 12/31/10 03/31/11 % Revenue in Local Currency (£) 5.8 6.6 14% 6.7 6.6 (1%) Effective Exchange Rate * 1.56 1.60 1.58 1.60 Revenue: U.K. and others ($) 9.1 10.6 16% 10.6 10.6 0% * The effective exchange rate is the rate applied to the three month results to reflect the year to date currency translation rate. Note: The percentage changes are calculated based on the detailed amounts and may differ slightly from percentages calculated based on rounded amounts in the table above. High Bandwidth Connectivity Solutions 19
Reconciliation of Non-GAAP Financial Measures (Cont’d) • AboveNet’s management believes that adjusted or modified EBITDA and its related margin are measures of operating performance that are commonly reported and widely used by analysts, investors, and other interested parties in the telecommunications industry because they eliminate many differences in financial, capitalization, and tax structures, as well as certain non-cash and non-operating charges to earnings . AboveNet’s management currently uses Adjusted EBITDA and Adjusted EBITDA Margin for these purposes . AboveNet’s management believes that Adjusted EBITDA and Adjusted EBITDA Margin trends can be used as indicators of whether the Company’s operations are able to produce sufficient operating cash flow to fund working capital needs, service debt obligations and fund capital expenditures . • • Adjusted EBITDA is also used by the Company for other purposes , including , management ’s assessment of ongoing operations and as a measure for performance -based compensation . However, the definition of adjusted EBITDA for other purposes may differ from the definition of Adjusted EBITDA used herein. For example, for 2009 and 2010 the definition of adjusted EBITDA in the Company’s incentive cash bonus plan excludes certain customer termination fees. Additionally , Adjusted EBITDA as used in this press release may not be calculated identically to similarly titled measures reported by other companies . • • The Company also reviews revenue, net of contract termination revenue as well as revenue in local currency . Revenue, net of contract termination revenue shows the change in the Company’s recurring revenue from period to period excluding the impact of non-recurring contract termination revenue . Revenue in local currency shows the changes of foreign subsidiary revenue without the impact of currency fluctuations . Management believes these non-GAAP metrics provide helpful insight into revenue trends. High Bandwidth Connectivity Solutions 20