Exhibit 99.2

Juniper Networks, Inc.
1133 Innovation Way
Sunnyvale, CA 94089
April 28, 2016
CFO Commentary on First Quarter 2016 Preliminary Financial Results
Related Information
The following commentary is provided by management and should be referenced in conjunction with Juniper Networks’ first quarter 2016 preliminary financial results press release available on its Investor Relations website athttp://investor.juniper.net. These remarks represent management’s current views of the Company’s financial and operational performance and outlook and are provided to give investors and analysts further insight into its performance in advance of the earnings call webcast.
Q1 2016 Financial Results
GAAP
| | | | | | | | | | | | | | | | | | | | |
| (in millions, except per share amounts and percentages) | | Q1’16 | | | Q4’15 | | | Q1’15 | | | Q/Q Change | | | Y/Y Change | |
Revenue | | $ | 1,097.9 | | | $ | 1,319.6 | | | $ | 1,067.4 | | | | (17 | )% | | | 3 | % |
Product | | | 753.0 | | | | 973.9 | | | | 764.1 | | | | (23 | )% | | | (1 | )% |
Service | | | 344.9 | | | | 345.7 | | | | 303.3 | | | | — | % | | | 14 | % |
Gross margin % | | | 62.9 | % | | | 63.8 | % | | | 61.6 | % | | | (0.9 | )pts | | | 1.3pts | |
Research and development | | | 251.0 | | | | 247.2 | | | | 248.7 | | | | 2 | % | | | 1 | % |
Sales and marketing | | | 231.8 | | | | 255.9 | | | | 220.2 | | | | (9 | )% | | | 5 | % |
General and administrative | | | 59.4 | | | | 60.3 | | | | 55.2 | | | | (1 | )% | | | 8 | % |
Restructuring and other (benefits) charges | | | — | | | | (0.1 | ) | | | 1.4 | | | | N/M | | | | (100 | )% |
| | | | | | | | | | | | | | | | | | | | |
Total operating expenses | | $ | 542.2 | | | $ | 563.3 | | | $ | 525.5 | | | | (4 | )% | | | 3 | % |
| | | | | | | | | | | | | | | | | | | | |
Operating margin % | | | 13.5 | % | | | 21.2 | % | | | 12.3 | % | | | (7.7 | )pts | | | 1.2pts | |
| | | | | | | | | | | | | | | | | | | | |
Net income | | $ | 91.4 | | | $ | 197.8 | | | $ | 80.2 | | | | (54 | )% | | | 14 | % |
| | | | | | | | | | | | | | | | | | | | |
Diluted EPS(*) | | $ | 0.23 | | | $ | 0.51 | | | $ | 0.19 | | | | (55 | )% | | | 21 | % |
| | | | | | | | | | | | | | | | | | | | |
N/M - Not meaningful
| (*) | GAAP diluted EPS for the fourth quarter of 2015 includes a full-year $0.03 benefit due to the renewal of the research and development tax credit for 2015. |
Non-GAAP
| | | | | | | | | | | | | | | | | | | | | | |
| (in millions, except per share amounts and percentages) | | Q2’16 Guidance | | Q1’16 | | | Q4’15 | | | Q1’15 | | | Q/Q Change | | | Y/Y Change | |
Revenue(1) | | $1,190 +/-$30 | | $ | 1,097.9 | | | $ | 1,319.6 | | | $ | 1,067.4 | | | | (17 | )% | | | 3 | % |
Product(1) | | | | | 753.0 | | | | 973.9 | | | | 764.1 | | | | (23 | )% | | | (1 | )% |
Service(1) | | | | | 344.9 | | | | 345.7 | | | | 303.3 | | | | — | % | | | 14 | % |
Gross margin % | | 64% +/- 0.5% | | | 63.7 | % | | | 64.5 | % | | | 63.1 | % | | | (0.8 | )pts | | | 0.6pts | |
Research and development | | | | | 217.1 | | | | 215.7 | | | | 216.8 | | | | 1 | % | | | — | % |
Sales and marketing | | | | | 220.8 | | | | 241.4 | | | | 212.8 | | | | (9 | )% | | | 4 | % |
General and administrative | | | | | 49.9 | | | | 51.6 | | | | 47.1 | | | | (3 | )% | | | 6 | % |
| | | | | | | | | | | | | | | | | | | | | | |
Total operating expenses | | $500 +/- $5 | | $ | 487.8 | | | $ | 508.7 | | | $ | 476.7 | | | | (4 | )% | | | 2 | % |
| | | | | | | | | | | | | | | | | | | | | | |
Operating margin % | | ~22% (mdpt. of rev.) | | | 19.3 | % | | | 26.0 | % | | | 18.5 | % | | | (6.7 | )pts | | | 0.8pts | |
| | | | | | | | | | | | | | | | | | | | | | |
Net income | | | | $ | 142.2 | | | $ | 247.6 | | | $ | 131.6 | | | | (43 | )% | | | 8 | % |
| | | | | | | | | | | | | | | | | | | | | | |
Diluted EPS(2) | | $0.44 - $0.50 | | $ | 0.37 | | | $ | 0.63 | | | $ | 0.32 | | | | (41 | )% | | | 16 | % |
| | | | | | | | | | | | | | | | | | | | | | |
| (1) | Revenue numbers are GAAP. |
| (2) | Non-GAAP diluted EPS for the fourth quarter of 2015 includes a full-year $0.03 benefit due to the renewal of the research and development tax credit for 2015. |
The following CFO Commentary contains non-GAAP financial measures and the reconciliations to GAAP can be found at the end of this document.
Q1 2016 Overview
The March quarter was challenging from a revenue perspective. Enterprise revenues were impacted by cautious customer buying patterns due to macroeconomic factors and to a lesser extent, greater than anticipated weakness due to product transitions in campus and branch Security. Service Provider revenues were impacted by the timing of deployments related to certain U.S. and EMEA Tier 1 Telecoms.
Despite some of the challenges this quarter, we delivered year-over-year revenue growth led by increases in the Americas primarily driven by Cloud and Cable Providers, as well as growth in our Government vertical across all geographies. Our revenue growth and effective management of our cost structure resulted in expanded non-GAAP operating margin and a $0.05 increase in non-GAAP diluted earnings per share on a year-over-year basis.
In reviewing our top 10 customers for the quarter, five were Telecoms, four were Cloud or Cable Providers, and one was an Enterprise. Of these customers, three were located outside of the U.S.
Our underlying demand metrics were healthy this quarter, with a product book-to-bill greater than one, and a modest increase in product deferred revenue year-over-year and sequentially.
As we disclosed in the Q4 2015 CFO Commentary, we went live with our ERP system on January 18. Overall, we believe the implementation has gone well, however, order processing and shipment linearity were affected in the quarter as we ramped up on the new system. This system change resulted in invoicing occurring later in the quarter than customary, which increased DSO by approximately 15 days. We anticipate DSO to return to our target range of 45 to 55 days in Q2 2016. As is typical with ERP implementations of this magnitude, the stabilization of the new processes and system will take several months.
In the quarter, we had cash flow from operations of $172 million, down $47 million year-over-year, and up $55 million sequentially. Capital expenditures for the quarter were $49 million. We repurchased $75 million of shares and paid $38 million in dividends. Since the first quarter of 2014, inclusive of share repurchases and dividends, we have returned approximately $3.75 billion of capital to shareholders against our commitment to return $4.1 billion by the end of 2016.
As a reminder, we closed the BTI Systems acquisition on April 1, 2016, therefore, our Q1 2016 results do not include any contribution from the operations of BTI Systems.
Revenue
Product & Service
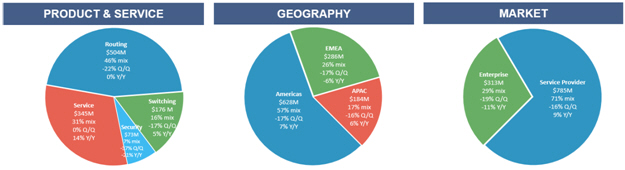
| | • | | Routing product revenue: $504 million, flat year-over-year and down 22% sequentially. Year-over-year, growth in Cloud and Cable Providers were offset by a decline in Telecom. Sequentially, the decrease was primarily due to Telecom and to a lesser extent, Cable, partially offset by growth in Cloud Providers. PTX grew year-over-year and sequentially, while MX was slightly up year-over-year and down sequentially. |
| | • | | Switching product revenue: $176 million, up 5% year-over-year and down 17% sequentially. We saw continued data center growth with our QFX family of products growing year-over-year and sequentially, which was offset by campus and branch, which declined year-over-year and from the prior quarter. |
| | • | | Security product revenue: $73 million, down 21% year-over-year and down 37% sequentially. The year-over-year decrease was primarily due to Enterprise and Cloud Providers, partially offset by growth in Government. The sequential decrease was due to a decline in Telecom and Enterprise. Our ScreenOS and Other Legacy products were $5 million, down 55% year-over-year and 5% from the prior quarter. |
| | • | | Service revenue:$345 million, up 14% year-over-year and flat sequentially. The year-over-year increase in revenue was primarily driven by support contracts related to strong product shipments in fiscal 2015, as well as strong performance in customer contract renewals. |
Geography
| | • | | Americas: $628 million, up 7% year-over-year and down 17% sequentially. The year-over-year growth was driven by Cloud and Cable Providers, partially offset by declines in Enterprise and Telecom. Sequentially, the decrease was primarily due to timing of deployments for certain Tier 1 Telecoms, and to a lesser extent, Enterprise and Cable, partially offset by growth in Cloud Providers. |
| | • | | EMEA:$286 million, down 6% year-over-year and down 17% from the prior quarter. The year-over-year decline was due to timing of deployments for certain Tier 1 Telecoms, partially offset by growth in Government. Sequentially, both Service Provider and Enterprise markets declined. |
| | • | | APAC:$184 million, up 6% year-over-year and down 16% quarter-over-quarter. The year-over-year increase was driven by Service Provider, partially offset by a decline in Enterprise. Sequentially, both Service Provider and Enterprise markets declined. |
Market
| | • | | Service Provider: $785 million, up 9% year-over-year and down 16% from the prior quarter. The year-over-year increase was driven by Americas and APAC, partially offset by EMEA. Sequentially, all geographies declined. |
| | • | | Enterprise:$313 million, down 11% from the prior year and down 19% from the prior quarter. The year-over-year decrease was due to declines in the Americas and APAC. Sequentially, all geographies declined. |
Gross Margins
| | • | | Non-GAAP gross margins: 63.7%, compared to 63.1% from the prior year and 64.5% from last quarter. |
| | • | | Non-GAAP product gross margins: 63.7%, down 0.2 points from a year ago and down 1.3 points from last quarter. Sequentially, the decrease was primarily due to lower volume. While the pricing environment is consistently competitive, we remain focused on delivering innovation and continued improvements to our cost structure. |
| | • | | Non-GAAP service gross margins: 63.7%, up 2.4 points from a year ago and up 0.5 points quarter-over-quarter. The year-over-year increase was due to higher support revenue, improved labor productivity, and timing of spare parts purchases. |
Operating Expenses
| | • | | Non-GAAP operating expenses: $488 million, an increase of $11 million, or 2% year-over-year, and a decrease of $21 million, or 4%, sequentially. The year-over-year increase was driven by an increase in sales and marketing to capture the growth opportunities from our new products. Sequentially, the decrease was primarily due to lower variable compensation. As reported for the quarter, operating expenses were 44.4% of revenue, down 0.3 points year-over-year. We expect to continue our focus on operational expense discipline and execute to our annualized long-term model of 39% of revenue. |
Operating Margins
| | • | | Non-GAAP operating margins:19.3%, an increase of 0.8 points year-over-year and a decrease of 6.7 points sequentially. We expect to continue our focus on prudent cost management as we execute to our annualized long-term model of 25% of revenue. |
Tax Rate
| | • | | Non-GAAP tax rate: 25.9%, up from 23.3% last quarter, primarily due to the full-year benefit of the renewal of the R&D tax credit for 2015 that was recognized in the fourth quarter of 2015. |
Diluted Earnings Per Share
| | • | | Non-GAAP diluted earnings per share: $0.37, an increase of $0.05 year-over-year primarily due to the positive impact from higher revenue and reduced share count. The sequential decrease of $0.26 was primarily due to lower revenue and, to a lesser extent, the full-year benefit of the renewal of the R&D tax credit for 2015 in the fourth quarter of $0.03, of which, $0.02 was related to the first three quarters of 2015. |
Balance Sheet, Cash Flow, Capital Return, and Other Financial Metrics
| | | | | | | | | | | | | | | | | | | | |
| (in millions, except product book-to-bill, days sales outstanding (“DSO”), and headcount) | | Q1’16 | | | Q4’15 | | | Q3’15 | | | Q2’15 | | | Q1’15 | |
Cash(1) | | $ | 3,416.8 | | | $ | 3,192.2 | | | $ | 3,247.0 | | | $ | 3,076.3 | | | $ | 3,450.6 | |
Debt(2) | | | 2,131.8 | | | | 1,937.4 | | | | 1,937.0 | | | | 1,936.7 | | | | 1,935.9 | |
Net cash and investments(2,3) | | | 1,285.0 | | | | 1,254.8 | | | | 1,310.0 | | | | 1,139.6 | | | | 1,514.7 | |
Operating cash flow | | | 172.4 | | | | 117.0 | | | | 293.0 | | | | 263.2 | | | | 219.3 | |
Capital expenditures | | | 49.3 | | | | 55.4 | | | | 71.1 | | | | 39.6 | | | | 44.2 | |
Depreciation and amortization | | | 45.4 | | | | 43.4 | | | | 40.8 | | | | 39.9 | | | | 46.0 | |
Share repurchases | | | 75.0 | | | | 92.5 | | | | 50.0 | | | | 600.0 | | | | 400.0 | |
Dividends | | $ | 38.3 | | | $ | 38.3 | | | $ | 38.5 | | | $ | 38.7 | | | $ | 40.8 | |
Diluted shares | | | 389.3 | | | | 390.9 | | | | 389.2 | | | | 397.2 | | | | 414.2 | |
Product book-to-bill | | | >1 | | | | >1 | | | | >1 | | | | >1 | | | | >1 | |
DSO | | | 64 | | | | 53 | | | | 42 | | | | 39 | | | | 43 | |
Headcount | | | 9,274 | | | | 9,058 | | | | 8,934 | | | | 8,815 | | | | 8,772 | |
| (1) | Cash includes cash, cash equivalents, and investments. |
| (2) | Certain amounts in the prior period have been retrospectively adjusted to conform to the current period presentation. |
| (3) | Net cash and investments includes, cash, cash equivalents, and investments, net of debt. |
Balance Sheet
| | • | | Cash: $3.4 billion, with 11% held onshore, up $225 million from the prior quarter. The increase in cash was largely due to debt raised in the quarter. |
| | • | | Debt:$2.1 billion. In March of 2016, we issued $500 million of long-term debt and retired $300 million of debt that matured in the quarter, for a net increase of $200 million. We continue to maintain investment grade credit ratings of BBB/Baa2 by S&P and Moody’s. We believe that our debt has well staggered maturities and aligns with our focus on an efficient capital structure. |
| | • | | Net cash and investments: $1.3 billion. An increase of $30 million quarter-over-quarter primarily due to cash from operations, offset by share repurchases of $75 million, capital expenditures of $49 million, and dividend payments of $38 million. |
Cash Flow
| | • | | Cash flow from operations:Cash flow from operations was $172 million, down $47 million year-over year and up $55 million sequentially. The year-over-year decline was primarily due to an increase in accounts receivable. Sequentially, the increase was driven by an increase in deferred revenue and accounts payable, offset by lower net income and other working capital requirements. |
DSO
| | • | | DSO:64 days, compared to 53 days from the prior quarter, an increase of 11 days. The elevated DSO was primarily due to the implementation of our new ERP system. This system change resulted in invoicing occurring later in the quarter than customary, which increased DSO by approximately 15 days. We anticipate DSO to return to our target range of 45 to 55 days in Q2 2016. |
Capital Return
| | • | | We continue to deliver on our commitment to shareholders and execute on our capital return plan. |
| | • | | We repurchased $75 million of shares in the quarter and paid $38 million in dividends. |
| | • | | Diluted shares declined 6% year-over-year. |
| | • | | Since the first quarter of 2014, inclusive of share repurchases and dividends, we have returned approximately $3.75 billion of capital to shareholders against our commitment to return $4.1 billion by end of 2016 and reduced our diluted share count by 22%. |
| | • | | A quarterly dividend of $0.10 per share was paid in March, which we intend to grow over time. |
Demand metrics
| | • | | Product book-to-bill was greater than 1. |
| | • | | Total deferred revenue was $1,260 million, up $85 million year-over-year and up $92 million quarter-over-quarter. |
| | • | | Product deferred revenue was $261 million, an increase of $8 million year-over-year and $21 million quarter-over-quarter. |
Headcount
| | • | | 9,274, an increase of 502 employees or 6% year-over-year, primarily in Services and Sales. |
System Change
| | • | | As we have previously disclosed, on January 18, 2016, we went live with a significant release to our ERP system, which changed the core systems in the following areas: accounting, order management, inventory management, case management, and billings. We believe the implementation has gone well, however, order processing and shipment linearity were affected in the quarter as we ramped up on the new system. |
Q2 2016 Outlook
These metrics are provided on a non-GAAP basis, except for revenue and share count.
We are focused on driving long-term shareholder value and remain constructive on revenue growth for 2016. We expect to continue to prudently manage operating expenses, expand operating margins, and grow non-GAAP diluted earnings per share in 2016.
Our guidance includes the contribution from our acquisition of BTI Systems, which closed on April 1, 2016. We expect BTI Systems to contribute approximately $10 million to $15 million of revenue and approximately $10 million of operating expenses. For the year, we expect the operations of BTI Systems to be neutral to non-GAAP diluted earnings per share. We plan to integrate BTI Systems into our business and do not intend to break out financial details going forward.
Our guidance for the quarter ending June 30, 2016, is as follows:
| | • | | Revenues will be approximately $1,190 million, plus or minus $30 million, which includes approximately $10 million to $15 million related to BTI Systems. |
| | • | | Non-GAAP gross margin will be approximately 64%, plus or minus 0.5%. |
| | • | | Non-GAAP operating expenses will be approximately $500 million, plus or minus $5 million, which includes approximately $10 million related to BTI Systems. |
| | • | | Non-GAAP operating margin will be approximately 22% at the midpoint of revenue guidance. |
| | • | | Non-GAAP tax rate of approximately 26% for the second quarter, which includes the benefit of the permanent R&D tax credit. |
| | • | | Non-GAAP net income per share will range between $0.44 and $0.50 on a diluted basis. This assumes a flat share count from the first quarter. |
Capital Return
| | • | | We intend to target a capital return policy of approximately 50% of annual free cash flow, inclusive of share repurchases and dividends, after completion of the $4.1 billion capital return program. |
Forward-Looking Statements
Statements in this CFO Commentary and related conference call concerning Juniper Networks’ business, economic and market outlook, long-term financial model, product portfolio and success of particular products and product families, the contribution of new products to our revenues, our DSO going forward, future financial and operating results, ability to deliver revenue, earnings and margin growth, improvements to our cost structure and expense reductions and management, innovation pipeline, capital structure, capital return program, including future dividends, dividend growth and share repurchases, 2016 operating principles, effect of the BTI acquisition on our revenue, operating results and guidance, and overall future prospects are forward looking statements within the meaning of the Private Securities Litigation Reform Act that involve a number of uncertainties and risks. Actual results or events could differ materially from those anticipated in those forward-looking statements as a result of several factors, including: general economic and political conditions globally or regionally; business and economic conditions in the networking industry; changes in overall technology spending and spending by communication service providers and major customers; the network capacity requirements of communication service providers; contractual terms that may result in the deferral of revenue; increases in and the effect of competition; the timing of orders and their fulfillment; issues resulting from the transition to our new ERP system; manufacturing and supply chain constraints, changes or disruptions; availability of key product components; ability to establish and maintain relationships with distributors, resellers and other partners; variations in the expected mix of products sold; changes in customer mix; changes in geography mix; customer and industry analyst perceptions of Juniper Networks and its technology, products and future prospects; delays in scheduled product availability; market acceptance of Juniper Networks products and services; rapid technological and market change; adoption of regulations or standards affecting Juniper Networks products, services or the networking industry; the ability to successfully acquire, integrate and manage businesses and technologies; product defects, returns or vulnerabilities; the ability to recruit and retain key personnel; significant effects of tax legislation and judicial or administrative interpretation of tax regulations; currency fluctuations; litigation settlements and resolutions; the potential impact of activities related to the execution of capital return and product rationalization; and other factors listed in Juniper Networks’ most recent report on Form 10-K filed with the Securities and Exchange Commission (“SEC”). All statements contained in this CFO Commentary and related conference call are made only as of the date set forth at the beginning of this document. Juniper Networks undertakes no obligation to update the information contained in this document or the related conference call in the event facts or circumstances subsequently change after the date of this document.
Use of Non-GAAP Financial Measures
This CFO Commentary contains references to the following non-GAAP financial measures: gross margin; product gross margin; service gross margin; product gross margin as a percentage of product revenue; service gross margin as a percentage of service revenue; gross margin as a percentage of revenue; research and development expense; sales and marketing expense; general and administrative expense; operating expense; operating expense as a percentage of revenue; operating income; operating margin; provision for income tax; income tax rate; net income; and diluted net income per share. For important commentary on why Juniper Networks considers non-GAAP information a useful view of the company’s financial results, please see the press release furnished with our Form 8-K filed today with the SEC. With respect to future financial guidance provided on a non-GAAP basis, we have included the estimated impact of our acquisition of BTI Systems Inc. on our future operating expenses and excluded estimates for amortization of intangible assets, share-based compensation expenses, acquisition-related charges, restructuring and other (benefits) charges, impairment charges, professional services related to non-routine stockholder matters, litigation settlement and resolution charges, gain or loss on equity investments, retroactive impact of certain tax settlements, non-recurring income tax adjustments, valuation allowance on deferred tax assets, and the income tax effect of non-GAAP exclusions. These measures are not presented in accordance with, nor are they a substitute for U.S. generally accepted accounting principles or GAAP. In addition, these measures may be different from non-GAAP measures used by other companies, limiting their usefulness for comparison purposes. The non-GAAP financial measures used in this CFO Commentary should not be considered in isolation from measures of financial performance prepared in accordance with GAAP. Investors are cautioned that there are material limitations associated with the use of non-GAAP financial measures as an analytical tool. In particular, many of the adjustments to our GAAP financial measures reflect the exclusion of items that are recurring and will be reflected in our financial results for the foreseeable future.
A reconciliation of non-GAAP guidance measures to corresponding GAAP measures is not available on a forward-looking basis due to the high variability and low visibility with respect to the charges which are excluded from these non-GAAP measures.
Juniper Networks, Inc.
Preliminary Supplemental Data
(in millions)
(unaudited)
Deferred Revenue
| | | | | | | | |
| | | As of | |
| | | March 31,
2016 | | | December 31,
2015 | |
Deferred product revenue: | | | | | | | | |
Undelivered product commitments and other product deferrals | | $ | 205.6 | | | $ | 210.1 | |
Distributor inventory and other sell-through items | | | 102.8 | | | | 81.8 | |
| | | | | | | | |
Deferred gross product revenue | | | 308.4 | | | | 291.9 | |
Deferred cost of product revenue | | | (47.3 | ) | | | (51.6 | ) |
| | | | | | | | |
Deferred product revenue, net | | | 261.1 | | | | 240.3 | |
Deferred service revenue | | | 998.9 | | | | 927.8 | |
| | | | | | | | |
Total | | $ | 1,260.0 | | | $ | 1,168.1 | |
| | | | | | | | |
Reported as: | | | | | | | | |
Current | | $ | 893.3 | | | $ | 822.9 | |
Long-term | | | 366.7 | | | | 345.2 | |
| | | | | | | | |
Total | | $ | 1,260.0 | | | $ | 1,168.1 | |
| | | | | | | | |
Security Products: Quarterly Revenue Trend
| | | | | | | | | | | | | | | | | | | | | | | | | | | | | | | | | | | | |
| | | Q1’15 | | | Q2’15 | | | Q3’15 | | | Q4’15 | | | Q1’16 | | | Q/Q | | | Y/Y | |
SRX Platform and Security Software | | $ | 81.1 | | | $ | 95.4 | | | $ | 111.4 | | | $ | 110.5 | | | $ | 68.1 | | | $ | (42.4 | ) | | | (38 | )% | | $ | (13.0 | ) | | | (16 | )% |
Screen OS and Other Legacy | | | 11.7 | | | | 11.7 | | | | 8.2 | | | | 5.6 | | | | 5.3 | | | | (0.3 | ) | | | (5 | )% | | | (6.4 | ) | | | (55 | )% |
| | | | | | | | | | | | | | | | | | | | | | | | | | | | | | | | | | | | |
Total product revenue | | $ | 92.8 | | | $ | 107.1 | | | $ | 119.6 | | | $ | 116.1 | | | $ | 73.4 | | | $ | (42.7 | ) | | | (37 | )% | | $ | (19.4 | ) | | | (21 | )% |
| | | | | | | | | | | | | | | | | | | | | | | | | | | | | | | | | | | | |
Juniper Networks, Inc.
Preliminary Reconciliations between GAAP and non-GAAP Financial Measures
(in millions, except percentages and per share amounts)
(unaudited)
| | | | | | | | | | | | |
| | | Three Months Ended | |
| | | March 31,
2016 | | | December 31,
2015 | | | March 31,
2015 | |
GAAP gross margin - Product | | $ | 475.1 | | | $ | 627.4 | | | $ | 475.3 | |
GAAP product gross margin % of product revenue | | | 63.1 | % | | | 64.4 | % | | | 62.2 | % |
Share-based compensation expense | | | 1.9 | | | | 1.1 | | | | 1.7 | |
Share-based payroll tax expense | | | 0.3 | | | | — | | | | 0.1 | |
Amortization of purchased intangible assets | | | 2.4 | | | | 4.4 | | | | 10.8 | |
| | | | | | | | | | | | |
Non-GAAP gross margin - Product | | $ | 479.7 | | | $ | 632.9 | | | $ | 487.9 | |
| | | | | | | | | | | | |
Non-GAAP product gross margin % of product revenue | | | 63.7 | % | | | 65.0 | % | | | 63.9 | % |
GAAP gross margin - Service | | $ | 215.8 | | | $ | 215.0 | | | $ | 182.0 | |
GAAP service gross margin % of service revenue | | | 62.6 | % | | | 62.2 | % | | | 60.0 | % |
Share-based compensation expense | | | 3.5 | | | | 3.4 | | | | 3.4 | |
Share-based payroll tax expense | | | 0.5 | | | | 0.1 | | | | 0.4 | |
| | | | | | | | | | | | |
Non-GAAP gross margin - Service | | $ | 219.8 | | | $ | 218.5 | | | $ | 185.8 | |
| | | | | | | | | | | | |
Non-GAAP service gross margin % of service revenue | | | 63.7 | % | | | 63.2 | % | | | 61.3 | % |
GAAP gross margin | | $ | 690.9 | | | $ | 842.4 | | | $ | 657.3 | |
GAAP gross margin % of revenue | | | 62.9 | % | | | 63.8 | % | | | 61.6 | % |
Share-based compensation expense | | | 5.4 | | | | 4.5 | | | | 5.1 | |
Share-based payroll tax expense | | | 0.8 | | | | 0.1 | | | | 0.5 | |
Amortization of purchased intangible assets | | | 2.4 | | | | 4.4 | | | | 10.8 | |
| | | | | | | | | | | | |
Non-GAAP gross margin | | $ | 699.5 | | | $ | 851.4 | | | $ | 673.7 | |
| | | | | | | | | | | | |
Non-GAAP gross margin % of revenue | | | 63.7 | % | | | 64.5 | % | | | 63.1 | % |
GAAP research and development expense | | $ | 251.0 | | | $ | 247.2 | | | $ | 248.7 | |
Share-based compensation expense | | | (32.3 | ) | | | (31.2 | ) | | | (30.7 | ) |
Share-based payroll tax expense | | | (1.6 | ) | | | (0.3 | ) | | | (1.2 | ) |
| | | | | | | | | | | | |
Non-GAAP research and development expense | | $ | 217.1 | | | $ | 215.7 | | | $ | 216.8 | |
| | | | | | | | | | | | |
GAAP sales and marketing expense | | $ | 231.8 | | | $ | 255.9 | | | $ | 220.2 | |
Share-based compensation expense | | | (9.4 | ) | | | (13.4 | ) | | | (5.8 | ) |
Share-based payroll tax expense | | | (1.1 | ) | | | (0.4 | ) | | | (0.8 | ) |
Amortization of purchased intangible assets | | | (0.5 | ) | | | (0.7 | ) | | | (0.8 | ) |
| | | | | | | | | | | | |
Non-GAAP sales and marketing expense | | $ | 220.8 | | | $ | 241.4 | | | $ | 212.8 | |
| | | | | | | | | | | | |
GAAP general and administrative expense | | $ | 59.4 | | | $ | 60.3 | | | $ | 55.2 | |
Share-based compensation expense | | | (4.7 | ) | | | (6.8 | ) | | | (4.4 | ) |
Share-based payroll tax expense | | | (0.2 | ) | | | — | | | | (0.4 | ) |
Amortization of purchased intangible assets | | | (0.4 | ) | | | (0.2 | ) | | | (0.3 | ) |
Acquisition/divestiture and other charges | | | (4.2 | ) | | | (1.7 | ) | | | — | |
Professional services related to non-routine stockholder matters | | | — | | | | — | | | | (3.0 | ) |
| | | | | | | | | | | | |
Non-GAAP general and administrative expense | | $ | 49.9 | | | $ | 51.6 | | | $ | 47.1 | |
| | | | | | | | | | | | |
Juniper Networks, Inc.
Preliminary Reconciliations between GAAP and non-GAAP Financial Measures
(in millions, except percentages and per share amounts)
(unaudited)
| | | | | | | | | | | | |
| | | Three Months Ended | |
| | | March 31,
2016 | | | December 31,
2015 | | | March 31,
2015 | |
GAAP operating expenses | | $ | 542.2 | | | $ | 563.3 | | | $ | 525.5 | |
GAAP operating expenses % of revenue | | | 49.4 | % | | | 42.7 | % | | | 49.2 | % |
Share-based compensation expense | | | (46.4 | ) | | | (51.4 | ) | | | (40.9 | ) |
Share-based payroll tax expense | | | (2.9 | ) | | | (0.7 | ) | | | (2.4 | ) |
Amortization of purchased intangible assets | | | (0.9 | ) | | | (0.9 | ) | | | (1.1 | ) |
Restructuring and other benefits (charges) | | | — | | | | 0.1 | | | | (1.4 | ) |
Acquisition/divestiture and other charges | | | (4.2 | ) | | | (1.7 | ) | | | — | |
Professional services related to non-routine stockholder matters | | | — | | | | — | | | | (3.0 | ) |
| | | | | | | | | | | | |
Non-GAAP operating expenses | | $ | 487.8 | | | $ | 508.7 | | | $ | 476.7 | |
| | | | | | | | | | | | |
Non-GAAP operating expenses % of revenue | | | 44.4 | % | | | 38.5 | % | | | 44.7 | % |
GAAP operating income | | $ | 148.7 | | | $ | 279.1 | | | $ | 131.8 | |
GAAP operating margin | | | 13.5 | % | | | 21.2 | % | | | 12.3 | % |
Share-based compensation expense | | | 51.8 | | | | 55.9 | | | | 46.0 | |
Share-based payroll tax expense | | | 3.7 | | | | 0.8 | | | | 2.9 | |
Amortization of purchased intangible assets | | | 3.3 | | | | 5.3 | | | | 11.9 | |
Restructuring and other (benefits) charges | | | — | | | | (0.1 | ) | | | 1.4 | |
Acquisition/divestiture and other charges | | | 4.2 | | | | 1.7 | | | | — | |
Professional services related to non-routine stockholder matters | | | — | | | | — | | | | 3.0 | |
| | | | | | | | | | | | |
Non-GAAP operating income | | $ | 211.7 | | | $ | 342.7 | | | $ | 197.0 | |
| | | | | | | | | | | | |
Non-GAAP operating margin | | | 19.3 | % | | | 26.0 | % | | | 18.5 | % |
GAAP income tax provision | | $ | 35.1 | | | $ | 62.8 | | | $ | 35.8 | |
GAAP income tax rate | | | 27.7 | % | | | 24.1 | % | | | 30.9 | % |
Income tax effect of non-GAAP exclusions | | | 14.6 | | | | 12.6 | | | | 12.7 | |
| | | | | | | | | | | | |
Non-GAAP provision for income tax | | $ | 49.7 | | | $ | 75.4 | | | $ | 48.5 | |
| | | | | | | | | | | | |
Non-GAAP income tax rate | | | 25.9 | % | | | 23.3 | % | | | 26.9 | % |
GAAP net income | | $ | 91.4 | | | $ | 197.8 | | | $ | 80.2 | |
Share-based compensation expense | | | 51.8 | | | | 55.9 | | | | 46.0 | |
Share-based payroll tax expense | | | 3.7 | | | | 0.8 | | | | 2.9 | |
Amortization of purchased intangible assets | | | 3.3 | | | | 5.3 | | | | 11.9 | |
Restructuring and other (benefits) charges | | | — | | | | (0.1 | ) | | | 1.4 | |
Acquisition/divestiture and other charges (income) | | | 1.5 | | | | 0.5 | | | | (1.1 | ) |
Professional services related to non-routine stockholder matters | | | — | | | | — | | | | 3.0 | |
Loss on equity investments | | | 5.1 | | | | — | | | | — | |
Income tax effect of non-GAAP exclusions | | | (14.6 | ) | | | (12.6 | ) | | | (12.7 | ) |
| | | | | | | | | | | | |
Non-GAAP net income | | $ | 142.2 | | | $ | 247.6 | | | $ | 131.6 | |
| | | | | | | | | | | | |
GAAP diluted net income per share | | $ | 0.23 | | | $ | 0.51 | | | $ | 0.19 | |
| | | | | | | | | | | | |
Non-GAAP diluted net income per share | | $ | 0.37 | | | $ | 0.63 | | | $ | 0.32 | |
| | | | | | | | | | | | |
Shares used in computing diluted net income per share | | | 389.3 | | | | 390.9 | | | | 414.2 | |
| | | | | | | | | | | | |