SECURITIES AND EXCHANGE COMMISSION
Washington, D.C. 20549
FORM 10-K
| ý | ANNUAL REPORT UNDER SECTION 13 OR 15(d) OF THE SECURITIES EXCHANGE ACT OF 1934 |
| | |
| For the fiscal year ended September 30, 2007 |
| | |
| o | TRANSITION REPORT UNDER SECTION 13 OR 15(d) OF THE SECURITIES EXCHANGE ACT OF 1934 |
Commission file number 001-15789
STRATUS SERVICES GROUP, INC.
(Exact name of Registrant as specified in its charter)
| Delaware | | 22-3499261 |
| (State or other jurisdiction of incorporation or organization) | | (I.R.S. Employer Identification No.) |
| | | |
| 149 Avenue at the Common, Suite 3, Shrewsbury, New Jersey 07702 |
| (Address of principal executive offices) |
| | | |
| (732) 866-0300 |
| (Registrant’s telephone number, including area code) |
| | | |
Securities registered under Section 12(b) of the Exchange Act: Not Applicable |
| | | |
| Securities registered under Section 12(g) of the Exchange Act: |
| Common Stock, $.04 par value |
| (Title of class) |
Indicate by check mark if the registrant is a well-known seasoned issuer, as defined in Rule 405 of the Securities Act. Yes o No ý.
Indicate by check mark if the registrant is not required to file reports pursuant to Section 13 or Section 15(d) of the Act. Yes o No ý.
Indicate by check mark whether the registrant has (1) filed all reports required to be filed by Section 13 or 15(d) of the Exchange Act during the preceding 12 months (or for such shorter period that the registrant was required to file such reports), and (2) has been subject to such filing requirements for the past 90 days. Yes ý No o
Indicate by check mark if disclosure of delinquent filers in response to Item 405 of Regulation S-K is not contained herein, and will not be contained, to the best of registrant’s knowledge, in definitive proxy or information statements incorporated by reference in Part III of this Form 10-K or any amendment to this Form 10-K. o
Indicate by check mark whether the registrant is a large accelerated filer, an accelerated filer, or a non-accelerated filer. See definition of “accelerated filer and large accelerated filer” in Rule 12b-2 of the Exchange Act. (Check one):
Large accelerated filer ¨ | Accelerated filer ¨ | Non-accelerated filer ý |
Indicate by check mark whether the registrant is a shell company (as defined in Rule 12b-2 of the Act). Yes o No ý.
The aggregate market value of the voting and non-voting common equity held by non-affiliates, computed by reference to the last sale price of such stock as reported by the OTC Bulletin Board, as of December 31, 2007, was $751,851 based upon 53,703,615 shares held by non-affiliates.
The number of shares of Common Stock, $.04 par value, outstanding as of December 31, 2007 was 69,568,617.
This Annual Report on Form 10-K contains “forward-looking statements” within the meaning of Section 27A of the Securities Act of 1933, as amended and Section 21E of the Securities Exchange Act of 1934, as amended. These statements relate to future economic performance, plans and objectives of management for future operations and projections of revenue and other financial items that are based on the beliefs of our management, as well as assumptions made by, and information currently available to, our management. The words “expect”, “estimate”, “anticipate”, “believe”, “intend”, and similar expressions are intended to identify forward-looking statements. Such statements involve assumptions, uncertainties and risks. If one or more of these risks or uncertainties materialize or underlying assumptions prove incorrect, actual outcomes may vary materially from those anticipated, estimated or expected. Among the key factors that may have a direct bearing on our expected operating results, performance or financial condition are economic conditions facing the information technology staffing industry generally; uncertainties related to the job market and our ability to attract qualified candidates; uncertainties associated with our brief operating history; our ability to raise additional capital; our ability to achieve and manage growth; our ability to attract and retain qualified personnel; our ability to develop new services; our ability to open new offices; general economic conditions; the continued cooperation of our creditors; our ability to diversify our client base; and other factors discussed in Item 1A of this Annual Report under the caption “Risk Factors” and from time to time in our filings with the Securities and Exchange Commission. These factors are not intended to represent a complete list of all risks and uncertainties inherent in our business. The following discussion and analysis should be read in conjunction with the Financial Statements and notes appearing elsewhere in this Annual Report.
In this Annual Report on Form 10-K, references to “Stratus”, “the Company”, “we”, “us” and “our” refer to Stratus Services Group, Inc. and, unless the context otherwise requires, Stratus Technology Services, LLC, and Green-Tech Assets, LLC, each a 51% owned joint venture of Stratus Services Group, Inc.
FORM 10-K
STRATUS SERVICES GROUP, INC.
Form 10-K for the Fiscal Year Ended September 30, 2006
Table of Contents
| | PAGE |
| | 4 |
ITEM 1A. | RISK FACTORS | 8 |
| | 11 |
| | 11 |
| | 11 |
| | | |
| | |
| | 12 |
| | 13 |
| | 13 |
| | 21 |
| | 22 |
| | 22 |
ITEM 9A. | CONTROLS AND PROCEDURES | 22 |
| | | |
| | |
| | 23 |
| | 24 |
| SECURITIES OWNERSHIP OF CERTAIN BENEFICIAL OWNERS AND MANAGEMENT AND RELATED STOCKHOLDER MATTERS | 30 |
| | 32 |
| PRINCIPAL ACCOUNTING FEES AND SERVICES | 32 |
| | | |
| | |
| | 33 |
| | | |
| INDEX TO FINANCIAL STATEMENTS | F-1 |
General
We provide information technology (“IT”) staffing services through Stratus Technology Services, LLC (“STS”), a 51% owned subsidiary, and technology asset disposition services through Green-Tech Assets, LLC, which is also a 51% owned subsidiary. Until December 2005, we were a national business services company engaged in providing outsourced labor and operational resources and temporary staffing services. We were incorporated in Delaware in March 1997 and began operations in August 1997 with the purchase of certain assets of Royalpar Industries, Inc. and its subsidiaries. This purchase provided us with a foundation to become a national provider of comprehensive staffing services.
In order to reduce workers’ compensation costs, we began, during the fiscal year ended September 30, 2004, to outsource payroll and related functions for our temporary employees and certain in-house personnel to ALS, LLC, a Florida limited liability company (“ALS”). As a result of this arrangement, all of our field personnel and temporary employees that we placed with our clients became employees of ALS during the fiscal year ended September 30, 2005.
In December 2005, we completed a series of asset sale transactions pursuant to which we sold substantially all of the assets that we used to conduct our staffing services business (the “Asset Sales”). As a result of the Asset Sales, we ceased conducting active staffing services operations for clients other than IT staffing solutions through STS.
STS provides IT staffing solutions to Fortune 1000, middle market and emerging companies. STS offers expertise in a wide variety of technology practices and disciplines ranging from networking professionals to internet development specialists and application programmers.
In August 2007, our newly formed 51% owned subsidiary, Transworld Assets, LLC, acquired substantially all of the assets used by Green-Tech Assets, Inc. and its affiliate, CC Laurel, Inc. in their technology asset disposal business. Following the transaction, we changed the name of Transworld Assets, LLC to Green-Tech Assets, LLC (“Green-Tech”).
Between September 1997 and December 2004, we completed ten acquisitions of staffing businesses, representing thirty offices in seven states. In March 2002, we sold our Engineering Division and in fiscal 2003 we sold the assets of eight of our offices located in Nevada, New Jersey, Florida and Colorado. In addition to the Asset Sales, we sold the assets of six of our northern California offices in June 2005 and in October 2005, we sold the assets of one of our New Jersey offices.
We are headquartered at 149 Avenue of the Common, Suite 3, Shrewsbury, New Jersey 07702 and our telephone number is (732) 866-0300. We maintain a presence on the Internet with our website at www.stratusservices.com, an informational site designed to give prospective customers and employees additional information regarding our operations.
Financial Information About Industry Segments
We disclose segment information in accordance with SFAS NO. 131, “Disclosure about Segments of an Enterprise and Related Information.” During the fiscal year ended September 30, 2007, we operated in two business segments: IT staffing solutions and technology asset disposition services following our acquisition of the Green-Tech business.
IT Staffing Solutions
We provide IT staffing services through our affiliate, STS. STS was formed in November 2000 as a 50/50 joint venture between us and Fusion Business Services, LLC, a New Jersey based technology project management firm, to consolidate and manage the company-wide technology services business into a single entity focused on establishing market share in the IT market for staffing services. We acquired an additional 1% interest in STS in February 2007. See “Part III-Item 13 Certain Relationships and Related Party Transactions”. STS markets its services to client companies seeking staff for project staffing, system maintenance, upgrades, conversions, installations, relocations, etc. STS provides broad-based professionals in such disciplines as finance, pharmaceuticals, manufacturing and media which include such job specifications as Desktop Support Administrators, Server Engineers, Programmers, Mainframe IS Programmers, System Analysts, Software Engineers and Programmer Analysts. In addition, STS, through its roster of professionals, can initiate and manage turnkey IT projects and provide outsourced IT support on a twenty-four hour, seven day per week basis. STS’ IT staffing solutions services are generally provided on a time-and-materials basis, meaning that STS bills its clients for the number of hours worked in providing services to the client. Hourly bill rates are typically determined based on the level of skill and experience of the consultants assigned and the supply and demand in the current market for those qualifications. Alternatively, the bill rates for some assignments are based on a mark-up over compensation and other direct and indirect costs.
Assignments can range from 30 days to over a year, with an average duration of 4 months. STS maintains a variable cost model in which it compensates most of its consultants only for those hours that it bills to its clients. The consultants who perform IT services for its clients consist of independent contractors and subcontractors. As a result of the sale of our staffing services business, we expect to focus primarily on the development of the STS IT staffing solutions business in fiscal 2006.
Technology Asset Disposition Services
General
Since August 2007, we have provided technology asset disposition services through our 51% owned subsidiary, Green-Tech. Green-Tech is a technology risk management company that provides complete, creative asset disposal and disposition solutions for Fortune 1000 and other companies. Green-Tech’s services include:
| · | technology asset disposition services; |
| · | data security protection; and |
| · | asset auditing and tracking. |
Green-Tech’s integrated legal, financial and insurance program is designed to provide liability protection against all environmental, software license infringement and security risks relating to the retirement of technology assets.
The Industry
In response to growing environmental and data security challenges facing businesses, information technology asset disposal services are being increasingly used in companies around the world. The recycling of desktops, notebooks personal computers, monitors, consumer electronics and all other electronic products and systems has become a growing business as a result of data security and environmental liability concerns. According to IDC, a subsidiary of Intelligence Data Group which provides market intelligence advisory services to the IT industry, approximately 35.3% of United States companies use a third party disposal service for the disposition of their technology assets. Companies use third party providers for their data security expertise and their ability to provide a certificate of compliance to protect against business, legal and environmental risks. In light of the potentially damaging impact on the environment that disposal of technology assets presents, companies are utilizing third party technology disposal providers to facilitate compliance with regulatory requirements and minimize environmental liability.
Technology Disposal and Risk Management
In providing its technology disposal services, Green-Tech utilizes the following four phase process:
| · | Risk Identification– Green-Tech assesses the client needs and identifies the risks that the client faces in disposing of its technology assets |
| · | Risk Analysis– The risks identified by Green-Tech and their potential impact on the client are analyzed and designated as either high, medium or low risk |
| · | Risk Planning– After analyzing the possible impact of the identified risks, Green-Tech develops step-by-step action plans outlining potential options on a worst case scenario basis |
| · | Risk Tracking – Green-Tech monitors “trigger events” that indicate that a risk is about to become a reality |
| · | Risk Control – Green-Tech takes the steps to minimize the adverse consequences of a risk scenario. |
Green-Tech provides quotes to clients on a per project basis and offers menu servicing designed to respond to simple as well as complex solutions processes.
Asset Recycling
Green-Tech utilizes new collection and processing technology to recycle a vast array of materials including commercial office paper, aluminum, electronic scrap, metals, organics and post-industrial plastics when a decision has been made to dispose of technology and other assets. Green-Tech partners with ISO 9001 and 14001 vendors who guarantee a zero landfill process where all materials are reused.
Through its relationship with a national insurer, Green-Tech provides environmental liability insurance to its clients who are named as additional insureds on Green-Tech’s insurance policies.
Data Security Protection
Retired technology assets can be sources of security breaches if the data they store is not properly removed prior to retirement. According to a study conducted by IDC, security concerns are the primary motivation for companies to use a third party information technology-asset disposal vendor. In addition to concerns about breaches of security and the risk of confidential data being used improperly, companies are now subject to a variety of laws and regulations which impose privacy requirements or mandate the protection of personal data, such as the Sarbanes-Oxley Act of 2002, the Gramm-Leach-Billey Act, Fair Credit Reporting Act, and the USA Patriot Act. As a result, companies need to ensure that data stored on its systems is fully secured or destroyed.
Green-Tech eliminates data security risks by utilizing U.S. Department of Defense certified data destruction technologies. Green-Tech’s 2000 full overwrite processes completely sanitize hard drives before their final disposition is determined. Hard drives that cannot be tested are physically destroyed and recycled to insure that no data breaches occur.
Asset Auditing and Tracking
As part of its asset audit and tracking services, Green-Tech maintains a comprehensive data base of serial numbers, asset tags and model number identification details for all technology assets it processes. Retired assets are registered, evaluated and routed for other services. The process is fully documented through the final disposition or redeployment of the asset. Green-Tech’s comprehensive data base enable clients to demonstrate that their technology assets have been disposed of in a manner that complies with all regulatory requirements.
Resale of Technology Assets
In addition to generating revenues from services to its clients, Green-Tech obtains additional revenues from sales of refurbished and/or working equipment collected from customers. Sales are generally conducted through on-line auction sites such as E-Bay.
Competitive Business Conditions
IT Staffing. STS operates in a highly competitive and fragmented industry. There are relatively few barriers to entry into its markets, and the IT staffing industry is served by thousands of competitors, many of which are small, local operations. There are also numerous large national and international competitors that directly compete with us, including TEKsystems, Inc., Ajilon Consulting, MPS Group, Inc., Kforce Inc., Spherion Corporation, CDI Corp., Computer Horizons Corp. and Analysts International Corp. Many of STS’ competitors may have greater marketing and financial resources than STS.
The competitive factors in obtaining and retaining clients include, among others, an understanding of client-specific job requirements, the ability to provide appropriately skilled information technology consultants in a timely manner, the monitoring of job performance quality and the price of services. The primary competitive factors in obtaining qualified candidates for temporary IT assignments are wages, the technologies that will be utilized, the challenges that an assignment presents and the types of clients and industries that will be serviced.
Technology Asset Disposition. The technology asset disposal industry is highly competitive and fragmented. Green-Tech competes on a local, regional and national level with a small number of major firms and many smaller companies. Green-Tech competes primarily on the uniqueness, quality and design of its services platform. Certain of Green-Tech’s competitors have greater name recognition and financial resources than Green-Tech. Green-Tech may also face competition from potential new entrants into the technology asset disposal industry or increased competition from existing competitors that may attempt to develop the ability to offer the full range of services offered by Green-Tech. Green-Tech believes that competition is based primarily on the ability to deliver solutions that meet a client’s requirements and, to a lesser extent, on price. Green-Tech’s competitors include Intechra, Redemtech and large electronics companies such as IBM, Dell and Sony. There can be no assurance that Green-Tech will be able to compete successfully in the future against existing or potential competitors.
Sales and Marketing
Due to monetary constraints our marketing has been limited. For the most part our information technology revenues sales have been generated by our internal sales forces located in our New Jersey and Florida offices. Recently we expanded our sales force in both the West and Mid-West regions of the United States. We generate sales for our technology asset disposal service business through our internal sales force and through third-party sales representatives. Our marketing strategy includes the cross-selling of both information technology services and technology asset disposal services.
Customers
STS and Green-Tech provide services to customers throughout the United States. During the year ended September 30, 2007, one STS customer represented 34% of STS’ revenues. During the period from August 2, 2007 (the date we acquired Green-Tech’s business) through September 30, 2007, two customers represented 37% and 16% of Green-Tech’s revenues, respectively. A loss of any of these customers could have a material adverse effect on our business.
Governmental Regulation
Staffing services firms, including IT staffing firms, are generally subject to one or more of the following types of government regulation: (1) regulation of the employer/employee relationship between a firm and its temporary employees; and (2) registration, licensing, record keeping and reporting requirements. Staffing services firms are the legal employers of their temporary workers. Therefore, laws regulating the employer/employee relationship, such as tax withholding and reporting, social security or retirement, anti-discrimination and workers’ compensation, govern these firms. State mandated workers’ compensation and unemployment insurance premiums have increased in recent years and have directly increased our cost of services. In addition, the extent and type of health insurance benefits that employers are required to provide employees have been the subject of intense scrutiny and debate in recent years at both the national and state level. Proposals have been made to mandate that employers provide health insurance benefits to staffing employees, and some states could impose sales tax, or raise sales tax rates on staffing services. Further increases in such premiums or rates, or the introduction of new regulatory provisions, could substantially raise the costs associated with hiring and employing staffing employees.
Certain states have enacted laws that govern the activities of “Professional Employer Organizations,” which generally provide payroll administration, risk management and benefits administration to client companies. These laws vary from state to state and generally impose licensing or registration requirements for Professional Employer Organizations and provide for monitoring of the fiscal responsibility of these organizations. We believe that Stratus is not a Professional Employer Organization and not subject to the laws that govern such organizations; however, the definition of “Professional Employer Organization” varies from state to state and in some states the term is broadly defined. If we are determined to be a Professional Employer Organization, we can give no assurance that we will be able to satisfy licensing requirements or other applicable regulations. In addition, we can give no assurance that the states in which we operate will not adopt licensing or other regulations affecting companies that provide commercial and professional staffing services.
Green-Tech’s operations are subject to numerous Federal and state statutes and regulations which govern the handling, transportation and disposition of hazardous materials, including cathode ray tubes and other components of and materials included in the technology assets handled, recycled and disposed of by Green-Tech.
Trademarks
We have not obtained federal registration of any of the trademarks we currently use or previously used in our business, including our slogan, name or logo or the slogan, name or logo of STS or Green-Tech. Currently, we are asserting Common Law protection for these slogans, names and logos by holding the marks out to the public as the property of Stratus, STS or Green-Tech, as the case may be. However, no assurance can be given that this Common Law assertion will be effective to prevent others from using any of our marks concurrently or in other locations. In the event someone asserts ownership to a mark, we may incur legal costs to enforce any unauthorized use of the marks or defend ourselves against any claims.
Employees
As of September 30, 2007, we were employing 87 total employees. Of that amount, 42 were billable employees on assignments. In addition, as of September 30, 2007, we had 23 consultants on assignment.
STS recruits its consultants through both centralized and decentralized recruiting programs. Its recruiters use its internal proprietary database, the Internet, local and national advertisements and trade shows.
This Form 10-K contains forward-looking statements concerning our future programs, products, expenses, revenue, liquidity and cash needs as well as our plans and strategies. These forward-looking statements are based on current expectations and the Company assumes no obligation to update this information. Numerous factors could cause actual results to differ significantly from the results described in these forward-looking statements, including the following risk factors.
We have disposed of a substantial portion of our assets and have significantly reduced the scope and changed the nature of our operations.
In December 2005, we completed a series of transactions pursuant to which we sold substantially all of the assets used to conduct our staffing services business, other than the IT staffing solutions business that we conduct through our 51% owned joint venture, STS. In August 2007, we entered the technology asset disposition business through our acquisition of Green-Tech’s business.
The sale of our staffing operations may subject us to claims of third parties.
We completed the Asset Sales with a view toward avoiding a foreclosure action by our lender and maximizing our prospects of reducing our indebtedness to creditors, including our lender, and the possibility of preserving value for our shareholders. In light of the exigent circumstances surrounding the Asset Sales, formal corporate procedures typically required in connection with these types of transactions were not adhered to. As a result, no assurance can be given that creditors and/or shareholders will not assert claims against us related to the Asset Sales.
We have limited liquid resources and a history of net losses.
Our auditors have qualified their opinion on our financial statements for the year ended September 30, 2006, with a qualification which raises substantial doubt about our ability to continue as a going concern. Our ability to continue in business depends upon the continued cooperation of our creditors, our ability to generate sufficient cash flow to meet our continuing obligations on a timely basis and our ability to obtain additional financing. Current liabilities at September 30, 2007 were $9,787,281 and current assets were $1,749,528. The difference of $8,037,753 is a working capital deficit, which is primarily the result of losses incurred during the previous four years. At September 30, 2007, we owed $1,434,058 under promissory notes that are past due or due upon demand, as well as $300,000 that was due in January 2005 in connection with the redemption of our Series A Preferred Stock. In addition, approximately $3.1 million of payroll taxes, including interest and penalties, was delinquent. We can give no assurance that we will raise sufficient capital to eliminate our working capital deficit or that our creditors will not seek to enforce their remedies against us, which could include the imposition of insolvency proceedings.
We may not be able to successfully integrate or manage the operations of Green-Tech
If we are unable to successfully manage and integrate the technology asset disposition operations of Green-Tech which we acquired in August 2007, our financial condition and operating results may suffer. We have no prior experience in the technology asset disposition industry and are heavily dependent on the personnel who joined us when we acquired the Green-Tech business.
Fluctuations in the general economy could have an adverse impact on our business.
Demand for IT staffing services is significantly affected by the general level of economic activity and unemployment in the United States. Companies use temporary staffing services to manage personnel costs and staffing needs. When economic activity increases, temporary employees are often added before full-time employees are hired. However, as economic activity slows, many companies reduce their utilization of temporary employees before releasing full-time employees. In addition, we may experience less demand for the services we provide through STS and more competitive pricing pressure during periods of economic downturn. Therefore, any significant economic downturn could have a material adverse effect on our business, results of operations, cash flows or financial condition.
We may be unable to achieve and manage our growth.
Our ability to achieve growth will depend on a number of factors, including: the strength of demand for IT solutions consultants and technology asset disposition services in our markets; the availability of capital to fund acquisitions; the ability to maintain or increase profit margins despite pricing pressures; and existing and emerging competition. We must also adapt our infrastructure and systems to accommodate growth and recruit and train additional qualified personnel. Should an economic slowdown or a recession continue for an extended period, competition for customers in the IT staffing solutions and technology asset disposition industries would increase and may adversely impact management’s allocation of our resources and result in declining revenues.
We rely heavily on executive management and could be adversely affected if our executive management team was not available.
We are highly dependent on our senior executives, including Joseph J. Raymond, our Chairman, CEO and President since September 1, 1997, and Michael A. Maltzman, Executive Vice President and Chief Financial Officer who has been serving in that capacity since September 1, 1997. We entered into an employment agreement with Mr. Raymond effective September 1, 1997, for continuing employment until he chooses to retire or until his death and that agreement remains in effect as written. In April 2005, we entered into a new employment agreement with Mr. Maltzman which expires in April 2008. The loss of the services of either Mr. Raymond or Mr. Maltzman could have a material adverse effect on our business, results of operations, cash flows or financial condition.
We rely heavily on our management information systems and our business would suffer if our systems fail or cannot be upgraded or replaced on a timely basis.
We believe our management information systems are instrumental to the success of our operations. Our business depends on our ability to store, retrieve, process and manage significant amounts of data. We continually evaluate the quality, functionality and performance of our systems in an effort to ensure that these systems meet our operational needs. We have, in the past, encountered delays in implementing, upgrading or enhancing systems and may, in the future, experience delays or increased costs. There can be no assurance that we will meet anticipated completion dates for system replacements, upgrades or enhancements that such work will be competed in the cost-effective manner, or that such replacements, upgrades and enhancements will support our future growth or provide significant gains in efficiency. The failure of the replacements, upgrades and enhancements to meet these expected goals could result in increased system costs and could have a material adverse effect on our business, results of operations, cash flows or financial condition.
Our financial results will suffer if we lose any of our significant customers.
Certain of our engagements to provide services to its customers are of a non-exclusive, short-term nature and subject to termination by the customer with little or no notice. The loss of any of our significant customers could have an adverse effect on our business, results of operations, cash flows or financial condition. We are also subject to credit risks associated with our trade receivables. Should any principal customers default on their large receivables, our business results of operations, cash flows or financial condition could be adversely affected.
We have experienced significant fluctuations in our operating results and anticipate that these fluctuations may continue.
Fluctuations in our operating results could have a material adverse effect on the price of our common stock. Operating results may fluctuate due to a number of factors, including the demand for our services, the level of competition within our markets, our ability control costs and expand operations, the timing and integration of acquisitions and the availability of qualified IT consultants. In addition, our results of operations could be, and have in the past been, adversely affected by severe weather conditions. Moreover, our results of operations have also historically been subject to seasonal fluctuations and this seasonality may continue in the future.
We compete in highly competitive markets with limited barriers to entry and significant pricing pressures and we may not be able to continue to successfully compete.
Both the U.S. IT staffing services and technology asset disposition markets are highly competitive and fragmented. Through STS, we compete in national, regional and local markets with full-service and specialized staffing agencies, systems integrators, computer systems consultants, search firms and other providers of staffing services. Green-Tech competes with a small number of large firms and many smaller companies. A majority of our competitors are significantly larger than we are and have greater marketing and financial resources than us. In addition, there are relative few barriers to entry into our markets and we have faced, and expect to continue to face, competition from new entrants into our markets. We expect that the level of competition will remain high in the future, which could limit our ability to maintain or increase our market share or maintain or increase gross margins, either of which could have a material adverse effect on our financial condition and results of operations. In addition, from time to time we experience significant pressure from our clients to reduce price levels, and during these periods we may face increased competitive pricing pressures. Competition may also affect our ability to recruit the personnel necessary to fill the needs of STS’ clients. We also face the risk that certain of STS’ current and prospective clients will decide to provide similar services internally. We may not be able to continue to successfully compete.
Our profitability will suffer if STS is not able to maintain current levels of billable hours and bill rates and control its costs.
Our profit margin, and therefore our profitability, is largely dependent on the number of hours billed for STS’ services, the rates it charges for these services and the pay rate of its consultants. Accordingly, if we are unable to maintain these amounts at
current levels, our profit margin and our profitability will suffer. The rates STS charges for its services are affected by a number of considerations, including:
| Ÿ | its clients’ perception of our ability to add value through our services; |
| Ÿ | competition, including pricing policies of its competitors; and |
| Ÿ | general economic conditions. |
The number of billable hours is affected by various factors, including the following:
| Ÿ | the demand for IT staffing services; |
| Ÿ | the quality and scope of its services; |
| Ÿ | seasonal trends, primarily as a result of holidays, vacations and inclement weather; |
| Ÿ | the number of billing days in any period; |
| Ÿ | the ability to transition consultants from completed assignments to new engagements; |
| Ÿ | the ability to forecast demand for services and thereby maintain an appropriately balanced and sized workforce; and |
| Ÿ | the ability to manage consultant turnover. |
STS’ pay rates are affected primarily by the supply of and demand for skilled U.S.-based consultants. During periods when demand for consultants exceeds the supply, pay rates may increase.
STS may be unable to attract and retain qualified billable consultants, which could have an adverse effect on its business, financial condition and results of operations.
STS’ operations depend on its ability to attract and retain the services of qualified billable consultants who possess the technical skills and experience necessary to meet its clients’ specific needs. STS must continually evaluate, upgrade and supplement our staff in each of our markets to keep pace with changing client needs and technologies and to fill new positions. The IT staffing industry in particular has high turnover rates and is affected by the supply of and demand for IT professionals. This has resulted in intense competition for IT professionals, and we expect such competition to continue. Customers may also hire STS’ consultants, which increases our turnover rate. The failure to attract and retain the services of personnel, or an increase in the turnover rate among STS employees, could have a material adverse effect on IT staffing business, operating results or financial condition. If a supply of qualified consultants, particularly IT professionals, is not available in sufficient numbers or on economic terms that are, or will continue to be, acceptable to us, our business, operating results or financial condition could be materially adversely affected.
We may be subject to claims as a result of actions taken by our temporary staffing personnel.
Actions taken by our temporary staffing employees could subject us to significant liability. Providers of temporary staffing services place people in the workplaces of other businesses. An inherent risk of such activity includes possible claims of errors and omissions, discrimination or harassment, theft of customer property, misappropriation of funds, misuse of customers’ proprietary information, employment of undocumented workers, other criminal activity or torts, claims under health and safety regulations and other claims. There can be no assurance that we will not be subject to these types of claims, which may result in negative publicity and our payment of monetary damages or fines, which, if substantial, could have a material adverse effect on our business, results of operations, cash flows or financial condition.
Short sales of our common stock could place downward pressure on the price of our common stock.
Selling stockholders and others may engage in short sales of our common stock. Short sales could place downward pressure on the price of our common stock.
Regulatory and legal uncertainties could harm our business.
The implementation of unfavorable governmental regulations or unfavorable interpretations of existing regulations by courts or regulatory bodies could require us to incur significant compliance costs, cause the development of the affected markets to become impractical or otherwise adversely affect our financial performance. If we are determined to be a “Professional Employer Organization,” we cannot assure you that we will be able to satisfy licensing requirements or other applicable regulations. Certain states have enacted laws which govern the activities of Professional Employer Organizations, which generally provide payroll administration, risk management and benefits administration to client companies. These laws vary from state to state and generally impose licensing or registration requirements for Professional Employer Organizations and provide for monitoring of the fiscal responsibility of these organizations. We believe that Stratus is not a Professional Employer Organization and not subject to the laws which govern such organizations; however, the definition of Professional Employer Organization varies from state to state and in
some states the term is broadly defined. In addition, we can give no assurance that the states in which we operate will not adopt licensing or other regulations affecting companies which provide commercial and professional staffing services.
Green-Tech is subject to numerous Federal and state laws and regulations pertaining to the handling, transport and disposition of hazardous materials, as well as laws pertaining to safeguarding personal data which may be embedded in the technology assets recycled and disposed of by Green-Tech. Any failure to comply with these laws could subject Green-Tech to liability.
We own no real property. We lease approximately 3,000 square feet in a professional office building in Shrewsbury, New Jersey as our and STS’ corporate headquarters. That facility houses all of our centralized corporate functions, including the Executive management team, payroll processing, accounting, human resources and legal departments. Our lease expires on May 31, 2011. In addition, STS maintains a branch office in Winter Park, Florida under a month to month lease and Green-Tech leases approximately 20,000 square feet of office and warehouse space in Providence, Rhode Island under a month-to-month lease. We believe that our facilities are generally adequate for our needs and we do not anticipate any difficulty in replacing such facilities or locating additional facilities, if needed.
We are currently a party to the following actions:
Tymatt Associates, LLC v. Stratus Services Group, Inc. On October 15, 2007, Tymatt Associates, LLC (“Tymatt”) filed suit against us for breach of contract in the Supreme Court of the State of New York, County of New York, seeking damages of $300,000 plus accrued interest at a rate of 18% per annum from January 31, 2005, as well as costs and expenses, including accountant’s fees and attorney’s fees, in connection with our failure to either pay to Tymatt the sum of $250,000 or to deliver to Tymatt a number of shares of Stratus common stock with a value of $250,000 by January 31, 2005 as required by the terms of a redemption agreement pertaining to our Series A Preferred Stock. We have been in discussions with Tymatt in an attempt to resolve this matter; however, no assurance can be given that we will be able to resolve this matter on terms that are satisfactory to us.
TeamOne Personnel Solutions, LLC vs. Stratus Services Group, Inc. On October 19, 2007, TeamOne Personnel Solutions, LLC (“TeamOne”) filed a Request for Entry of Default and Court Judgment in the amount of $157,004 in the Superior Court of California, County of Solano. TeamOne had filed in July 2007 suit seeking enforcement of an acceleration provision of a promissory note (the “Note”) executed by us in favor of TeamOne on March 2, 2005 in the principal amount of $160,000. We have been discussions with TeamOne to arrange for a deferred payment schedule for the amount owed; however, no assurance can be given that TeamOne will agree to deferring payment and will not seek to enforce its judgment.
In re APX Holdings, LLC, et al. In August 2007, the Trustee in a Chapter 7 bankruptcy proceeding in the United States Bankruptcy Court for the Central District of California involving APX Holding, LLC, one of our former customers, brought an action against us and several other parties, including our former lender and ALS, seeking to recover $860,184 of preference payments that were allegedly made by APX and its affiliates. We believe that the maximum amount of payments received by us which could be considered recoverable preference payments is approximately $23,000. As a result, we are vigorously defending this action.
Temporary Services Insurance Ltd. V. Stratus Services Group, Inc., ALS, LLC, U.S. Temps, Inc., et al. In September 2007, Temporary Services Insurance Ltd. (“TSIL”) instituted an action in the United States District Court, Middle District of Florida, Orlando Division, against us, ALS, certain principals and affiliates of ALS, and certain other parties alleging that we participated in a fraudulent scheme to obtain workers compensation insurance through TSIL at a cost substantially lower than the cost of workers compensation insurance that we could have otherwise obtained through our own carriers. In its complaint, TSIL, which seeks unspecified damages, alleges that ALS failed to disclose certain outsourcing agreements with its clients, including the outsourcing agreements between us and ALS, that the employees provided by ALS to perform services for us and our clients were actually our employees, and that we were unjustly enriched by ALS’ misrepresentations and failure to disclose material facts pertaining to its relationship with us. We intend to vigorously defend this matter.
We are involved, from time to time, in other routine litigation arising in the ordinary course of business. We do not believe that any other currently pending litigation will have a material adverse effect on our financial position or results of operations.
| SUBMISSION OF MATTERS TO A VOTE OF SECURITY HOLDERS |
During the fourth quarter of fiscal 2007, no matter was submitted to a vote of security holders through the solicitation of proxies or otherwise.
| MARKET FOR COMMON EQUITY, RELATED STOCKHOLDER MATTERS, AND ISSUER PURCHASES OF EQUITY SECURITIES. |
Our common stock was delisted from the Nasdaq SmallCap Market and is currently trading on the NASD OTC Bulletin Board under the symbol “SSVG.OB”. There were approximately 100 holders of record of common stock as of December 31, 2007. This number does not include the number of shareholders whose shares were held in “nominee” or “street name”. The table below sets forth, for the periods indicated, the high and low sales prices of our common stock as reported by the NASD OTC Bulletin Board.
| Fiscal Year 2006 | High | Low |
| Quarter Ended December 31, 2005 | 0.07 | 0.01 |
| Quarter Ended March 31, 2006 | 0.02 | 0.01 |
| Quarter Ended June 30, 2006 | 0.05 | 0.02 |
| Quarter Ended September 30, 2006 | 0.05 | 0.01 |
| Fiscal Year 2007 | High | Low |
| Quarter Ended December 31, 2006 | 0.02 | 0.01 |
| Quarter Ended March 31, 2007 | 0.02 | 0.01 |
| Quarter Ended June 30, 2007 | 0.02 | 0.01 |
| Quarter Ended September 30, 2007 | 0.10 | 0.01 |
On December 31, 2007, the closing price of our common stock as reported by the NASD OTC Bulletin Board was $.014 per share. We have never paid cash dividends on our common stock and we intend to retain earnings, if any, to finance future operations and expansion. Any future payment of dividends on our common stock will depend upon our financial condition, capital requirements and earnings as well as other factors that the Board of Directors deems relevant.
See “Part III, Item 12, Security Ownership of Certain Beneficial Owners and Management” for information regarding securities authorized for issuance under equity compensation plans.
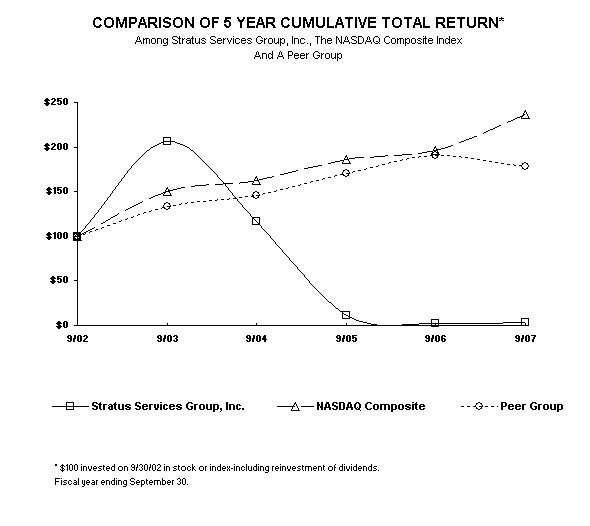
PERFORMANCE GRAPH
Set forth below is a performance graph which compares the percentage change in the cumulative total stockholder return on our Common Stock for the period from September 30, 2002 to September 30, 2007, with the cumulative total return over the same period on the Nasdaq Composite Index and a peer group over the same period (assuming the investment of $100 in the Company’s Common Stock, the Nasdaq Market Index and the peer group index on September 30, 2002 and that all dividends were reinvested).
| | 9/30/02 | 9/30/03 | 9/30/04 | 9/30/05 | 9/30/06 | 9/30/07 |
Stratus Services Group, Inc. | 100.00 | 206.67 | 116.67 | 10.83 | 2.00 | 3.92 |
| NASDAQ Composite | 100.00 | 150.59 | 162.76 | 185.69 | 196.70 | 236.91 |
Peer Group (1) | 100.00 | 133.32 | 145.47 | 170.20 | 190.62 | 178.59 |
(1) Consists of the following companies:
| Adecco SA | Comsys It Partners Inc. | Monster Worldwide Inc. |
| Administaff Inc. | Cross Country Healthcare Inc. | MPS Group Inc. |
| Allied Healthcare International Inc. | General Employees Ents | National Technical Systems Inc. |
| AMN Healthcare Services Inc. | Gevity HR Inc. | On Assignment Inc. |
| Analysts International | Heidrick Struggles International | RCM Technologies Inc. |
| ATC Healthcare Inc. | Hudson Highland Group Inc. | Resources Connection Inc. |
| Barrett Business Services Inc. | Kelly Services Inc. | Robert Half International |
| Butler International | Kforce Inc. | Spherion Corp. |
| CDI Corp. | Korn Ferry International | Teamstaff Inc. |
| Comforce Corp. | Labor Ready Inc. | Techteam Global Inc. |
| Computer Horizons Corp. | Manpower Inc. | Volt Information Science Inc. |
| Computer Task Group Inc. | Medical Staffing Network Holdings | Westaff Inc. |
(In thousands except per share)
The selected financial data that follows should be read in conjunction with our financial statements and the related notes thereto and Management’s Discussion and Analysis of Financial Condition and Results of Operations appearing elsewhere in this report.
| | Year Ended September 30, |
| | 2007 | 2006 | 2005 | | 2004 | | 2003 | |
| | | | | | | | | |
| Income statement data: | | | | | | | | |
| Revenues | $ 8,210 | $ 5,131 | $ 4,521 | | $ 1.150 | (1) | $ — | (1) |
| Gross profit | 2,492 | 1,526 | 1,318 | | 384 | | — | |
| Operating (loss) from continuing operations | (479) | (1,556) | (3,960) | | (3,055) | | (2,464) | |
| Net (loss) from continuing operations | (677) | (2,055) | (634) | | (1,834) | | (2,707) | |
| Net (loss) from continuing operations attributable to common stockholders | (719) | (2,097) | (676) | | (7,148) | | (4,337) | |
| | | | | | | | | |
| Per share data: | | | | | | | | |
| Net (loss) from continuing operations attributable to common stockholders – basic | $ (.01) | $ (.05) | $ (.04) | | $ (.94) | | $ (.25) | |
| Net (loss) from continuing operations attributable to common stockholders – diluted | $ (.01) | $ (.05) | $ (.04) | | $ (.94) | | $ (.25) | |
| Cash dividends declared | ¾ | ¾ | ¾ | | ¾ | | ¾ | |
| | | | | | | | | |
| | Year Ended September 30, |
| | 2007 | 2006 | 2005 | | 2004 | | 2003 | |
| | | | | | | | | |
| Balance sheet data: | | | | | | | | |
| Net working capital (deficiency) | $(8,038) | $(7,339) | $(9,161) | | $(16,267) | | $(7,979) | |
| Long-term obligations, including current portion | 2,323 | 1,457 | 858 | | 2,649 | | 4,001 | |
| Put option liability | — | — | — | | 673 | | 823 | |
| Warrant liability | — | — | 2 | | 5,266 | | — | |
| Minority Interest in Subsidiaries | 547 | 41 | 22 | | — | | — | |
| Redeemable convertible preferred stock | — | — | 2,218 | | 2,218 | | 3,810 | |
| Stockholders’ equity (deficiency) | (7,780) | (8,055) | (9,876) | | (9,773) | | (4,915) | |
| Total assets | 3,805 | 2,015 | 18,798 | | 27,907 | | 25,151 | |
(1) Prior to the third quarter of fiscal 2004, we accounted for our investment in STS, then a 50%-owned joint venture, under the equity method. Accordingly, the financial statements did not include the accounts of the joint venture until beginning with the third quarter of fiscal 2004 when the accounts of the joint venture were included in the consolidated financial statements.
| MANAGEMENT’S DISCUSSION AND ANALYSIS OF FINANCIAL CONDITION AND RESULTS OF OPERATIONS. |
Introduction
From inception until December 2005, we provided a wide range of staffing services and productivity consulting services associated with such staffing services nationally through a network of offices located throughout the United States. In December 2005, we completed a series of asset sale transactions pursuant to which we sold our staffing operations. As a result of such sales, we no longer actively conduct any staffing services business, other than IT staffing solutions services conducted through our 51% owned joint venture, STS. In August 2007, we entered the technology asset disposition business through our acquisition of the operations now conducted by our 51% subsidiary, Green-Tech.
Critical Accounting Policies and Estimates
The following accounting policies are considered by us to be “critical” because of the judgments and uncertainties affecting the application of these policies and because of the likelihood that materially different amounts would be reported under different conditions or using different assumptions.
Revenue Recognition
We recognize revenue from our staffing services as the services are performed by our workforce. Our customers are generally billed bi-weekly. At balance sheet dates, there are accruals for unbilled receivables and related compensation costs. We also provide permanent placement services. Fees for placements are recognized at the time the candidate commences employment. We guarantee our permanent placements for 60-90 days. In the event a candidate is not retained for the guarantee period, we will provide a suitable replacement candidate. In the event a replacement candidate cannot be located, we will provide a refund to the client. An allowance for refunds, based on our historical experience, is recorded in the financial statements. Revenues are recorded on a gross basis as a component of revenues. We recognize revenues from our technology asset disposal business when the services are rendered or when the product has been delivered so long as there is an agreed upon price and collection of the revenue is reasonably assured.
Allowance for Doubtful Accounts Receivable
We provide customary credit terms to our customers and generally do not require collateral. We perform ongoing credit evaluations of the financial condition of our customers and maintain an allowance for doubtful accounts receivable based upon historical collection experience and expected collectibility of accounts. As of September 30, 2007, we had recorded an allowance for doubtful accounts of approximately $200,000. The actual bad debts may differ from estimates and the difference could be significant.
Goodwill and Other Intangible Assets
We follow Financial Accounting Standards N. 142 (SFAS No. 142), “Goodwill and Other Intangible Assets”. Under SFAS No. 142, goodwill and indefinite lived intangible assets are no longer amortized but are reviewed at least annually for impairment. SFAS No. 142 prescribes a two-phase process for impairment testing of goodwill. The first phase screens for impairment; while the second phase (if necessary), measures the impairment. Factors included in the impairment analysis include expected revenue and EBITDA growth rates, working capital needs, discount rates and earnings multiples. These assumptions are based on management’s best estimate of the current and expected economic environment.
Valuation Allowance Against Deferred Income Tax Assets
Deferred tax assets and liabilities are determined based on differences between the financial reporting and tax bases of assets and liabilities, and are measured using the enacted tax rates and laws that are expected to be in effect when the differences reverse. We have recorded a valuation allowance of approximately $9.3 million to offset the entire balance of the deferred tax asset as of September 30, 2007. The valuation allowance was recorded as a result of the losses incurred by us and our belief that it is more likely than not that we will be unable to recover the net deferred tax assets.
Results of Operations
Discontinued Operations/Acquisition or Disposition of Assets
Effective as of June 5, 2005, we sold substantially all of the tangible and intangible assets, excluding accounts receivable of our six Northern California offices to ALS, a related party (see Note 15 to the Consolidated Financial Statements).
The purchase price was $3,315,719, which represented the balance due by us to ALS as of the close of business on May 3, 2005, less $600,000. Accordingly, $3,315,719 due to ALS as of the date of the sale was deemed paid and cancelled. In addition, all amounts due to us from ALS as of the date of sale were deemed paid in full. Such amounts aggregating $376,394 were comprised of a note receivable ($122,849), accounts receivable ($50,000) and other receivables ($203,545). ALS and our then lender also entered into a transaction pursuant to which ALS contributed $600,000 in exchange for a junior participation interest in amounts borrowed under our line of credit. ALS agreed to pay to us $600,000 as contingent purchase price. We agreed that this amount would be paid to us or offset against balances due by us to ALS, when ALS was repaid the junior participation interest and all other amounts due by us to ALS were paid in full. All amounts owed by ALS to us and by us to ALS under this agreement were satisfied in connection with our Asset Sale Transaction with ALS that was completed in December 2005.
In connection with the June 2005 transaction, we and ALS entered into a non-compete and non-solicitation agreement pursuant to which we agreed not to compete with ALS with the customers of and in the geographic area of the Northern California offices, and ALS agreed not to compete with us with respect to certain customers and accounts, including, accounts serviced by our remaining offices, for a period of two years.
The sale resulted in a gain of $2,239,108, computed as follows:
| | |
| Sales price – cancellation of accounts payable – related parties | $3,315,719 |
| | |
| Less costs of sale: | |
Write-off of amounts due from ALS | (376,394) |
Other costs (including $75,000 to a related party) | (322,952) |
| | |
Balance | 2,616,373 |
Net assets sold | 377,265 |
Gain | $2,239,108 |
In December 2005, we completed the following series of transactions pursuant to which we sold substantially all of our assets used to conduct our staffing services business, other than the IT staffing solutions business that is conducted through our 51% owned joint venture, STS:
| (a) | On December 2, 2005, we completed the sale, effective as of November 21, 2005, of substantially all of the tangible and intangible assets, excluding accounts receivable, of several of our offices located in the Western half of the United States (the “ALS Purchased Assets”) to ALS. The offices sold were the following: Chino, California; Colton, California; Los Angeles, California; Los Nietos, California; Ontario, California; Santa Fe Springs, California and the Phoenix, Arizona branches and the Dallas Morning News Account (the “Western Offices”). Pursuant to the terms of an Asset Purchase Agreement between us and ALS dated December 2, 2005 (the “ALS Asset Purchase Agreement”), the purchase price for the ALS Purchased Assets was paid or is payable as follows: |
| • | $250,000 was paid over the 60 days following December 2, 2005, for our documented cash flow requirements, all of which is payable at a rate no faster than $125,000 per 30 days; |
| • | $1,000,000 payable by ALS is being paid directly to certain taxing authorities to reduce our tax obligations; and |
| • | $3,537,000 which was paid by means of the cancellation of all net indebtedness owed by us to ALS outstanding as of the close of business on December 2, 2005. |
| In addition to the foregoing amounts, ALS also assumed our obligation to pay $798,626 due under a certain promissory note issued by us to Provisional Employment Solutions, Inc. As a result of the sale of the ALS Purchased Assets to ALS, all sums due and owing to ALS by us were deemed paid in full and no further obligations remain. |
In connection with the transaction, we entered into Non-Compete and Non-Solicitation Agreements with ALS pursuant to which we agreed not to compete with ALS with the customers of and in the geographic area of the Western Offices, and ALS agreed not to compete with us with respect to certain customers and accounts, including, accounts serviced by our remaining offices, for a period of two years.
| (b) | On December 5, 2005, we completed the sale, effective as of November 28, 2005 (the “AI Effective Date”), of substantially all of the tangible and intangible assets, excluding accounts receivable and other certain items, as described below, of three of our California offices (the “AI Purchased Assets”) to Accountabilities, Inc. (“AI”) The offices sold were the following: Culver City, California; Lawndale, California and Orange, California (the “Other California Offices”). Pursuant to the terms of an Asset Purchase Agreement between the Company and AI dated December 5, 2005 (the “AI Asset Purchase Agreement”), AI has agreed to pay to us an earnout amount equal to two percent of the sales of the Other California Offices for the first twelve month period after the AI Effective Date; one percent of the sales of the Other California Offices for the second twelve month period after the AI Effective Date; and one percent of the sales of the Other California Offices for the third twelve month period from the AI Effective Date. In addition, a Demand Subordinated Promissory Note between us and AI dated September 15, 2005 which had an outstanding principal balance of $125,000 at the time of closing was deemed paid and marked canceled. |
Certain assets held by the Other California Offices were excluded from the sale, including cash and cash equivalents, accounts receivable, and our rights to receive payments from any source.
In connection with the AI transaction, we entered into Non-Compete and Non-Solicitation Agreements with AI pursuant to which we agreed not to compete with AI with the customers of and in the geographic area of the Other California Offices, and AI agreed not to
compete with us with respect to certain customers and accounts, including, accounts serviced by our remaining offices, for a period of three years.
| (c) | On December 7, 2005, we completed the sale, effective as of November 28, 2005 (the “SOP Effective Date”), of substantially all of the tangible and intangible assets, excluding accounts receivable and other assets as described below, of several of our Northeastern offices (the “SOP Purchased Assets”) to Source One Personnel, Inc. (“SOP”). The offices sold were the following: Cherry Hill, New Jersey; New Brunswick, New Jersey; Mount Royal/Paulsboro, New Jersey (soon to be Woodbury Heights, New Jersey); Pennsauken, New Jersey; Norristown, Pennsylvania; Fairless Hills, Pennsylvania; New Castle Delaware and the former Freehold, New Jersey profit center (the “NJ/PA/DE Offices”). The assets of Deer Park, New York, Leominster, Massachusetts, Lowell, Massachusetts and Athol, Massachusetts (the “Earn Out Offices”) were also purchased (collectively the “NJ/PA/DE Offices” and the “Earn Out Offices” shall be referred to as the “Purchased Offices”). In addition to the foregoing, the SOP Purchased Assets also included substantially all of the tangible and intangible assets, excluding accounts receivable and other assets as described below, used by us in the operation of our business at certain facilities of certain customers including the following: the Setco facility in Cranbury New Jersey, the Record facility in Hackensack, New Jersey, the UPS-MI (formerly RMX) facility in Long Island, New York, the UPS-MI (formerly RMX) facility in the State of Connecticut, the UPS-MI (formerly RMX) facility in the State of Ohio, the APX facility in Clifton, New Jersey (the “Earn Out On-Site Business”) and the Burlington Coat Factory in Burlington, New Jersey, the Burlington Coat Factory facility in Edgewater Park, New Jersey and the UPS-MI (formerly RMX) facility in Paulsboro, New Jersey (the foregoing business and the “Earn-Out On-Site Businesses” shall be referred to herein collectively as the “On-Site Businesses”). Pursuant to the SOP Asset Purchase Agreement between us and SOP dated December 7, 2005 (the “SOP Asset Purchase Agreement”), the purchase price for the SOP Purchased Assets was paid or payable as follows (the “SOP Purchase Price”): |
| · | An aggregate of $974,031 of indebtedness owed by us to SOP (i) under certain promissory notes previously issued by us to SOP and (ii) in connection with a put right previously exercised by SOP with respect to 400,000 shares of our common stock was cancelled. |
| · | SOP is required to make the following earn out payments to us during the three year period commencing on the SOP Effective Date (the “Earn Out Period”): |
| · | Two percent of sales (excluding taxes on sales) from the Earn Out Offices and the Earn Out On-Site Businesses for the initial twelve months of the Earn Out Period. |
| · | One percent of sales (excluding taxes on sales) from the Earn Out Offices and the Earn Out On-Site Businesses for the second twelve months of the Earn Out Period. |
| · | One percent of sales (excluding taxes on sales) from the Earn Out Offices and the Earn Out On-Site Businesses for the third twelve months of the Earn Out Period. |
Certain assets held by the Purchased Offices were excluded from the sale, including cash and cash equivalents, accounts receivable, our rights to receive payments from any source.
In connection with the SOP transaction, we entered into Non-Compete and Non-Solicitation Agreements with SOP pursuant to which we agreed not to compete with SOP with respect to the business acquired from us by SOP for a period of two years.
| (d) | On December 7, 2005 (the “Closing Date”), we completed the sale of substantially all of the tangible and intangible assets, excluding cash and cash equivalents, of two of our California branch offices (the “TES Purchased Assets”) to Tri-State Employment Service, Inc. (“TES”). The offices sold were the following: Bellflower, California and West Covina, California (the “California Branch Offices”). Pursuant to the terms of an Asset Purchase Agreement between the Registrant and TES dated December 7, 2005 (the “TES Asset Purchase Agreement”), TES has agreed to pay to us as follows: |
| · | two percent of sales of the California Branch Offices to existing clients for the first twelve month period after the Closing Date; |
| · | one percent of sales of the California Branch Offices to existing clients for the second twelve month period after the Closing Date; and |
| · | one percent of sales of the California Branch Offices to existing clients for the third twelve month period after the Closing Date. |
For purposes of calculating the amount owed by TES to us, in no event shall the aggregate annual sales to such clients exceed $25,000,000.
On the Closing Date, TES made a payment of $1,972,521 to our lender and acquired the lender’s rights to certain of our accounts receivable that collateralize our obligation to the lender. As a result of this transaction, our obligations to the lender were reduced by $1,972,521.
In connection with the TES transaction, we entered into Non-Compete and Non-Solicitation Agreements pursuant to which we agreed not to compete with TES with the customers of and in the geographic area of the California Branch Offices, and TES agreed not to compete with Stratus with respect to certain customers and accounts, including, accounts serviced by Stratus’ remaining offices, for a period of three years.
The foregoing transactions resulted in a $3,804,047 net gain on sale of discontinued operations which is summarized as follows:
| Sold to: | | | |
| ALS | $ | 4,340,459 | |
| AI | | (10,013 | ) |
| SOP | | (190,879 | ) |
| TES | | (275,520 | ) |
| | 3,864,047 | |
| | | |
| Other costs of sales | | (60,000 | ) |
| Gain on sale of discontinued operations | $ | 3,804,047 | |
The above gain includes earnout payments of $721,466.
Continuing Operations
Year Ended September 30, 2007 Compared to Year Ended September 30, 2006
Revenues. Revenues increased 60.0% to $8,209,564 for the year ended September 30, 2007 from $5,131,081 for the year ended September 30, 2006. Approximately $595,000 of the increase was attributable to the acquisition of our technology asset disposition operations in August 2007. Excluding the acquisition, revenues increased 48.4%. This increase was primarily a result of an increase in billable hours and permanent placements and expansion of our customer base.
Gross Profit. Gross profit increased 63.3% to $2,492,267 for the year ended September 30, 2007 from $1,525,837 for the year ended September 30, 2006. Approximately $197,000 of the increase was attributable to the acquisition in August 2007. Excluding the acquisition, gross profits increased 50.4%, primarily as a result of increased revenues. Gross profit as a percentage of revenues, exclusive of the gross profit attributable to the acquisition, increased to 30.1% for the year ended September 30, 2007 from 29.7% for the year ended September 30, 2006, primarily as a result of increased permanent placements.
Selling, General and Administrative Expenses. Selling, General and Administrative expenses (“SG&A”) decreased 3.6% to $2,971,755 for the year ended September 30, 2007 from $3,082,139 for the year ended September 30, 2006. Exclusive of approximately $195,000 attributable to the acquisition in August 2007, SG&A decreased 6.3%. SG&A as a percentage of revenues decreased to 36.2% for the year ended September 30, 2007 from 60.1% for the year ended September 30, 2006.
As a result of the Asset Sales completed in December 2005, we began reducing our corporate overhead structure to be more in line with the remaining revenues. These reductions were completed in February 2006.
Interest Expense. Interest expense decreased 48.9% to $246,342 for the year ended September 30, 2007 from $481,762 for the year ended September 30, 2006. Interest expense as a percentage of revenues decreased to 3.0% for the year ended September 30, 2007 from 9.4% for the year ended September 30, 2006. Interest expense in the year ended September 30, 2006 includes $100,000 of the principal amount of the Convertible Note issued in exchange for our Series I Preferred Stock that was attributable to the settlement of our obligation to pay certain advisory fees and dividend payments under the terms of the Series I Preferred Stock (see Note 14 to the Consolidated Financial Statements).
Gain on Change in Fair Value of Warrants. We recognized a non-cash gain as a result of the decrease in the fair value of certain warrants accounted for as a derivative liability of $-0- and $2,135 in the years ended September 30, 2007 and 2006, respectively.
Minority interest in net (income) loss of consolidated subsidiaries. The minority interest in net loss of consolidated subsidiaries for the years ended September 30, 2007 and 2006 represents the minority venturers’ proportionate share of the net loss of our consolidated subsidiaries.
Net (Loss) Attributable to Common Stockholders from Continuing Operations. As a result of the foregoing, we had a net (loss) attributable to common stockholders of $(718,782), for the year ended September 30, 2007 compared to a net (loss) attributable to common stockholders of $(2,097,372) for the year ended September 30, 2006.
Year Ended September 30, 2006 Compared to the Year Ended September 30, 2005
Revenues. Revenues increased 13.5% to $5,131,081 for the year ended September 30, 2006 from $4,520,643 for year ended September 30, 2005. This increase was primarily a result of an increase in billable hours.
Gross Profit. Gross profit increased 15.8% to $1,525,837 for the year ended September 30, 2006 from $1,317,927 for the year ended September 30, 2005, primarily as a result of increased revenues.. Gross profit as a percentage of revenues increased to 29.7% for the year ended September 30, 2006 from 29.2% for the year ended September 30, 2005, primarily as a result of increased permanent placements.
Selling, General and Administrative Expenses. SG&A decreased 41.6% to $3,082,139 for the year ended September 30, 2006 from $5,278,186 for the year ended September 30, 2005. SG&A expenses as a percentage of revenues decreased to 60.1% for the year ended September 30, 2006 from 116.8% for the year ended September 30, 2005.
As a result of the Asset Sales completed in December 2005, we began reducing our corporate overhead structure to be more in line with the remaining revenues. These reductions were completed in February 2006.
Interest Expense. Interest expense decreased 74.6% to $481,762 for the year ended September 30, 2006 from $1,895,283 for the year ended September 30, 2005. Interest expense as a percentage of revenues decreased to 9.4% for the year ended September 30, 2006 from 41.9% for the year ended September 30, 2005. Included in interest for the year ended September 30, 2005 was $217,750, which had to be paid to the holder of the Series I Preferred Stock and an advisory fee of $217,750 which was paid in connection with the extension of the redemption date of the Series I Preferred Stock.
Gain on Change in Fair Value of Warrants. We recognized a non-cash gain as a result of the decrease in the fair value of certain warrants accounted for as a derivative liability of $2,135 and $5,263,854 in the years ended September 30, 2006 and 2005, respectively.
Minority interest in net (income) loss of consolidated subsidiaries. The minority interest in net income of consolidated subsidiaries for the years ended September 30, 2006 and 2005 represents the minority venturer’s proportionate share of the net income of STS.
Net (Loss) Attributable to Common Stockholders From Continuing Operations. As a result of the foregoing, we had a net (loss) attributable to common stockholders of $(2,097,342) for the year ended September 30, 2006 compared to a net (loss) attributable to common stockholders of $(676,194) for the year ended September 30, 2005.
Liquidity and Capital Resources
Cash flows have not been segregated between continuing operations and discontinued operations in the accompanying condensed consolidated statements of cash flows. Cash provided to us from discontinued operations (included in the consolidated cash flow discussions below) during the years ended September 30, 2007, 2006 and 2005 was comprised of the following:
| | Year Ended September 30, | |
| | 2007 | 2006 | 2005 | | | |
| Cash provided by (used in) operating activities | $ | (759,184) | $ 7,955,991 | $ 6,886,346 | | | |
| Cash provided by (used in) investing activities | | 1,017,203 | 1,316,953 | (289,217) | | | |
| Cash used in financing activities | | - | (7,969,175) | (3,012,326) | | | |
| Net | $ | 258,019 | $ 1,303,769 | $ 3,584,803 | | | |
Although there is no assurance we will continue to receive earnout payments in connection with discontinued operations, we estimate that we will receive approximately $20,000 per month, through November 2008.
At September 30, 2007, we had limited liquid resources. Current liabilities were $9,787,281 and current assets were $1,749,528. The difference of $8,037,753 is a working capital deficit, which is primarily the result of losses incurred during the last several years. The financial statements do not include any adjustments to reflect the possible future effect on the recoverability and classification of assets or the amounts and classification of liabilities that may result from the outcome of this uncertainty.
Our continuation of existence is dependent upon the continued cooperation of our creditors, our ability to generate sufficient cash flow to meet our continuing obligations on a timely basis, to fund the operating and capital needs, and to obtain additional financing as may be necessary.
We have taken steps to revise and reduce our operating requirements, which we believe will be sufficient to assure continued operations and implementation of our plans. The steps included closing branches that are not profitable, reductions in staffing and other selling, general and administrative expenses, and, most significantly, the Asset Sale transactions that were completed in December 2005. We continue to pursue other sources of equity or long-term debt financings. We also continue to negotiate payment plans and other accommodations with our creditors. We believe that the cash flow from operations and earnout payments to which we are entitled in connection with the Asset Sales will provide us with sufficient cash flow to support our operations in the next twelve months provided that we continue to receive cooperation and accommodations from our creditors. No assurance can be given that our creditors will not seek to pursue all remedies available to them, which could result in a voluntary or involuntary bankruptcy proceeding.
Net cash provided by (used in) operating activities was $(1,162,054) and $6,743,565 in the years ended September 30, 2007 and 2006, respectively.
Net cash provided by (used in) investing activities was $(207,440) and $(1,300,241) in the years ended September 30, 2007 and 2006, respectively. Net cash used for the acquisition in 2007 was $1,192,643. Net cash received in connection with the sale of discontinued operations was $1,017,203 and $1,329,999 in the years ended September 30, 2007 and 2006, respectively. Such amounts were comprised of earnout payments in 2007 and included earnout payments of $676,763 in 2006. Cash used for capital expenditures was $32,000 and $36,367 in the years ended September 30, 2007 and 2006, respectively.
Net cash provided by (used in) financing activities was $1,429,462 and $(7,999,709) in the years ended September 30, 2007 and 2006, respectively. We had net proceeds (repayments) of $45,620 and $(6,362,218) under our lines of credit in the years ended September 30, 2007 and 2006, respectively. Net short-term loan proceeds (repayments) were $36,879 and $(29,975) in the years ended September 30, 2007 and 2006, respectively. During the year ended September 30, 2007, our Chief Executive Officer loaned $100,000 to us which was repaid during the year ended September 30, 2007. Payments of notes payable-acquisitions was $11,337 and $77,783 in the years ended September 30, 2007 and 2006, respectively. We paid $1,515,000 in the year ended September 30, 2006, against a note payable to Pinnacle Partners, LP, a related party. During the year ended September 30, 2007, we received net proceeds of $1,348,925 from the minority investors in Green-Tech Assets, LLC of which $675,000 is represented by notes payable and the balance is contributed equity. Our principal uses of cash are to fund temporary employee payroll expense and employer related payroll taxes, investment in capital equipment, expansion of services offered, workers’ compensation, general liability and other insurance coverages and debt service.
In January 2006, STS entered into a Factoring and Security Agreement (the “Factoring Agreement”) with Action Capital Corporation (“Action”) which provides for the sale of up to $1,500,000 of accounts receivable of STS to Action. Action reserves and withholds in a reserve account, an amount equal to 10% of the face amount of accounts receivable purchased under the Factoring Agreement. Action has full recourse against STS, including the right to charge-back or sell back any accounts receivable if not paid within 90 days of the date of purchase. The Factoring Agreement provides for interest at an annual rate of prime plus 1% plus a monthly fee of .6% on the daily average of unpaid balances. The prime rate at September 30, 2006 was 8.25%. As of September 30, 2006, $596,950 was outstanding under the Factoring Agreement.
During fiscal 2003, we were notified by both the New Jersey Department of Labor and the California Employment Development Department (the “EDD”) that, if certain payroll delinquencies were not cured, judgment would be entered against us. As of September 30, 2007, there was still an aggregate of $3.2 million in delinquent payroll taxes outstanding, including interest and penalties, which are included in “Payroll taxes payable” in the September 30, 2007 balance sheet as set forth herein on pages F-3 and F-4. Judgment has not been entered against us in California. While judgment has been entered against us in New Jersey, no actions have been taken to enforce same. On January 7, 2005, we entered into a payment plan agreement with the EDD, which requires us to pay $12,500 per week to the EDD. The $12,500 weekly payment is subject to increase for a three month period following any quarter in which our reported income exceeds $200,000, based upon a percentage related to the amount of increase above $200,000.
In July 2003, we entered into an agreement with the holder of our Series A Preferred Stock pursuant to which we agreed to redeem the aggregate 1,458,933 shares of Series A Preferred Stock then outstanding. The agreement, as amended in March 2004, provided that our obligation to redeem the Series A Preferred Stock was contingent upon the sale of not less than $1,000,000 units in our “best efforts” public offering of units. This condition was satisfied in July 2004. As a result, we paid $500,000 and issued 1,750,000 shares of common stock to the Series A holder and redeemed all of the Series A Preferred Stock following the initial closing of the offering. We were obliged to pay the Series A holder an additional $250,000 by January 31, 2005, at our option, issue to the Series A holder shares of common stock having an aggregate market value of $250,000, based upon the average closing bid prices of the common stock for the 30 days preceding January 31, 2005. We failed to make the $250,000 payment in cash or stock. Accordingly, we are required to pay $300,000 in cash, plus accrued interest at the rate of 18% per year from the date of default until the date the default is cured, to the former holder of the Series A Preferred Stock. The former holder of the Series A Preferred Stock has instituted litigation against us related to this matter and the Asset Sales. See “Item 3. Legal Proceedings.”. We are currently in discussions with the former holder of the Series A Preferred Stock to try to resolve all issues.
In January 2006 we entered into an agreement with the holder of all of the outstanding shares of our Series I Preferred Stock pursuant to which we issued to the holder, effective as of December 28, 2005, a secured convertible promissory note in the aggregate principal amount of $2,356,750 in exchange for all of such shares of Series I Preferred Stock. (See Notes 14 and 15 to the Consolidated Financial Statements).
As of September 30, 2007, there were no off-balance sheet arrangements, unconsolidated subsidiaries, commitments or guarantees of other parties, except as disclosed in the notes to financial statements. Stockholders’ (deficiency) at that date was $(7,779,880).
We engaged in various transactions with related parties during the fiscal 2007 and were indebted to certain related parties at September 30, 2007, including the following:
• | During the year Joseph J. Raymond, our Chairman, President and Chief Executive Officer, loaned us $100,000, all of which was repaid during the year. |
• | During the year, a significant shareholder loaned us $44,500, all of which was repaid during the year. |
• | At September 30, 2007, we owed: $41,000 under a demand note bearing interest at 10% a year to a corporation owned by the son of Joseph J. Raymond; $3,123 to a trust formed for the benefit of a family member of a former member of our board of Directors under a promissory note bearing interest at 12% a year which became due in full in August 2005 and $41,598 to a former member of our Board of Directors under a promissory note bearing interest at 12% a year which became due in full in May 2006 |
• | The nephew of our Chairman, President and CEO is affiliated with Pinnacle Investment Partners, LP (“Pinnacle”). The Company also believes that PIP Management, Inc., which was designated as the advisor to the Series I holders, is also affiliated with Pinnacle. In January 2006, we entered into an agreement with Pinnacle pursuant to which we issued to Pinnacle, effective as of December 28, 2005, a secured convertible promissory note in the aggregate principal amount of $2,356,850 in exchange for all the outstanding shares of Series I Preferred Stock (see Notes 14 and 15 to the Consolidated Financial Statements). As of September 30, 2007, $618,850 was outstanding under the secured convertible promissory note. |
Contractual Obligations
Our aggregate contractual obligations as of September 30, 2007 were as follows:
| | | Payments Due by Fiscal Period (in Thousands) |
| | | | 2009 - | 2011 - | |
| | Total | 2008 | 2010 | 2012 | Thereafter |
| | | | | | |
| Contractual Obligations: | | | | | |
| Long-term debt obligations | $ 2,323 | $ 1,073 | $ 559 | $ 691 | $ — |
| Operating lease obligations | 189 | 60 | 119 | 10 | ¾ |
| Series A redemption payable | 300 | 300 | | | |
| Worker’s compensation insurance liability (a) | 251 | 68 | | 39 | |
| TOTAL | $ 3,063 | $ 1,501 | $ 822 | $ 740 | $ ¾ |
| | | | | | |
| (a) | In December 2006, we entered into an agreement with the California Compensation Insurance Fund (the “Fund”) whereby the Fund agreed to reduce our then liability of $2,023,000 to $300,000 provided that we make certain monthly payments aggregating $300,000 over 56 months. At September 30, 2007, $1,974,000 ins included in accounts payable and accrued expenses on the attached consolidated balance sheet. The difference of $1,723,000 has not been recognized in earnings at this time since it is contingent upon our paying the $300,000 in accordance with the terms of the agreement. |
Impact of Inflation
We believe that since our inception, inflation has not had a significant impact on our results of operations.
Impact of Recent Accounting Pronouncements
In July 2006, the FASB issued Interpretation No. 48, “Accounting for Uncertainty in Income Taxes” (“FIN 48”), which is effective for fiscal years beginning after December 15, 2006. FIN 48 clarifies the accounting for uncertainty in income taxed recognized in the financial statements in accordance with FASB Statement No. 109, “Accounting for Income Taxes.” This interpretation prescribes a comprehensive model for how a company should recognize, measure, present, and disclose in its financial statements uncertain tax positions that the company has taken or expects to take on a tax return. We do not expect that the implementation of FIN 48 will have a material impact on our financial position, results of operations or cash flows.
In September 2006, the FASB issued SFAS No. 157, “Fair Value Measurements,” which defines fair value, establishes a framework for measuring fair value in generally accepted accounting principles, and expands disclosures about fair value measurements. SFAS 157 is effective in fiscal years beginning after November 15, 2007. We are currently assessing the impact the adoption of this pronouncement will have on our financial statements.
In February 2007, the FASB issued SFAS No. 159, “The Fair Value Option for Financial Assets and Financial Liabilities” and is effective for fiscal years beginning after November 15, 2007. This Statement permits entities to choose to measure many financial instruments and certain other items at fair value. The objective is to improve financial reporting by providing entities with the opportunity to mitigate volatility in reported earnings caused by measuring related assets and liabilities differently without having to apply complex hedge accounting provisions. We are currently assessing the impact the adoption of this pronouncement will have on our financial statements.
In December 2007, the FASB issued SFAS No. 160 “Noncontrolling Interests in Consolidated Financial Statements-an amendment of ARB No. 51” and is effective for fiscal years beginning after December 5, 2008. This Statement establishes accounting and reporting standards for the noncontrolling interest in a subsidiary and for the deconsolidation of a subsidiary. We are currently assessing the impact the adoption of this pronouncement will have on our financial statements.
In December 2007, the FASB issued SFAS No. 141 (Revised) “Business Combinations” and is effective for fiscal years beginning after December 13, 2008. This Statement establishes principles and requirements for how the acquirer of a business recognizes and measures in its financial statements the identifiable assets acquired, the liabilities assumed, and any noncontrolling interest in the acquiree. The Statement also provides guidance for recognizing and measuring the goodwill acquired in the business combination and determines what information to disclose to enable users of the financial statements to evaluate the nature and financial effects of the business combination. We are currently assessing the impact the adoption of this pronouncement will have on our financial statements.
On September 13, 2006 the Securities and Exchange Commission (“SEC”) issued Staff Accounting Bulletin No. 108 (“SAB 108”) which provides interpretive guidance on how the effects of the carryover or reversal of prior year misstatements should be considered in quantifying a current year misstatement. SAB 108 is effective for fiscal years ending after November 15, 2006. The adoption of SAB 108 has no material impact on our financial statements.
| QUANTITATIVE AND QUALITATIVE DISCLOSURE ABOUT MARKET RISKS |
We are subject to the risk of fluctuating interest rates in the ordinary course of business for borrowings under our Factoring Agreement, which provides for the sale of up to $1,500,000 of accounts receivable to Action Capital. Advances under this agreement bear interest at an annual rate of prime plus 1%, plus a monthly management fee of .6% on the daily average of unpaid balances.
We believe that our business operations are not exposed to market risk relating to foreign currency exchange risk or commodity price risk.
| FINANCIAL STATEMENTS AND SUPPLEMENTARY DATA. |
The response to this item is submitted in a separate section of this report commencing on Page F-1.
| CHANGES IN AND DISAGREEMENTS WITH ACCOUNTANTS ON ACCOUNTING AND FINANCIAL DISCLOSURE. |
No change in accountants or disagreement requiring disclosure pursuant to applicable regulations took place within the reporting period or in any subsequent interim period.
| ITEM 9A. | CONTROLS AND PROCEDURES |
Under the supervision and with the participation of management, including our Chief Executive Officer and our Chief Financial Officer, we have evaluated the effectiveness of the design and operation of our disclosure controls and procedures. Disclosure controls and procedures are controls and procedures that are designed to ensure that information required to be disclosed in our reports filed or submitted under the 1934 Act is recorded, processed, summarized and reported within the time periods specified in the SEC’s rules and forms. Based on this evaluation, our Chief Executive Officer and Chief Financial Officer have concluded that our disclosure controls and procedures were effective as of the end of the period covered by this annual report. There were no changes in our internal controls during the quarter ended September 30, 2007 that have materially affected, or are reasonably likely to have materially affected our internal controls over financial reporting.
Our management, including the Chief Executive Officer and Chief Financial Officer, does not expect that our disclosure controls and procedures or our internal control over financial reporting will prevent all error and all fraud. A control system, no matter how well designed and operated, can provide only reasonable, not absolute, assurance that the objectives of the control system are met. Because of the inherent limitations in all control systems, no evaluation of controls can provide absolute assurance that all control issues and instances of fraud, if any, within the company have been detected.
| DIRECTORS, EXECUTIVE OFFICERS AND CORPORATE GOVERNANCE. |
The Board of Directors and Officers
The name and age of each the directors and the executive officers of the Company and their respective positions with the Company are set forth below. Additional biographical information concerning each of the directors and the executive officers follows the table.
| Name | Age | Position |
| | | |
| Joseph J. Raymond | 72 | Chairman of the Board, President and Chief Executive Officer |
| | | |
| Norman Goldstein | 66 | Director |
| | | |
| Michael A. Maltzman | 60 | Chief Financial Officer & Treasurer |
| | | |
| Thurston J. Hartford | 45 | Director |
| | | |
| Jamie Raymond | 40 | President of STS |
| | | |
| J. Todd Raymond | 39 | Corporate Secretary |
Joseph J. Raymond has served as Chairman of the Board and Chief Executive Officer of Stratus since its inception in 1997. Prior thereto, he served as Chairman of the Board, President and Chief Executive Officer of Transworld Home Healthcare, Inc. (NASDAQ:TWHH), a provider of healthcare services and products, from 1992 to 1996. From 1987 through 1997, he served as Chairman of the Board and President of Transworld Nurses, Inc., a provider of nursing and paraprofessional services, which was acquired by Transworld Home Healthcare, Inc. in 1992.
Norman Goldstein has served as a Director of Stratus since July 2005. He has served as the President and CEO of NGA Inc., an export/import company primarily dealing in the importation, sale and distribution of all types of flat glass products throughout the USA since 2000. Prior to his association with NGA Inc., Mr. Goldstein formed Norwell International, which acquired a small glove company and engaged in the business of latex gloves and other related medical/dental products. In the year 2000, Mr. Goldstein sold Norwell International to one of the largest glove manufacturers in Malaysia (Asia Pacific Ltd.).
Michael A. Maltzman has served as Treasurer and Chief Financial Officer of Stratus since September 1997 when it acquired the assets of Royalpar Industries, Inc. and was appointed to the Board of Directors on August 6, 2007. Mr. Maltzman served as a Chief Financial Officer of Royalpar Industries, Inc., from April 1994 to August 1997. From June 1988 to July 1993, he served as Vice President and Chief Financial Officer of Pomerantz Staffing Services, Inc., a national staffing company. Prior thereto, he was a Partner with Eisner & Lubin, a New York accounting firm. Mr. Maltzman is a Certified Public Accountant.
Thurston J. Hartford was appointed to the Board of Directors of Stratus on August 2, 2007, in connection with the Company’s acquisition of substantially all of the assets of Green-Tech Assets, Inc. and CC Laurel, Inc., companies in which Mr. Hartford and his wife were the principal shareholders. Mr. Hartford served as Chief Executive Officer of each of these companies from their inception in 2001 until August 2007.
Jamie Raymond has served as President of STS since it began operations in January 2001. Prior to founding STS, he served as a Regional Vice President of Stratus. Mr. Raymond has over 14 years in management, sales and operations in the staffing industry and has held various positions including Branch Manger, Sales Representative and Recruiter. Jamie Raymond is the son of Joseph J. Raymond.
J. Todd Raymond has served as Secretary of the Company since September 1997 and as General Counsel from September 1997 until March 2002. He currently serves as President and Interim CEO of The Telx Group, Inc., a telecommunications company. From December 1994 to January 1996, Mr. Raymond was an associate and managing attorney for Pascarella & Oxley, a New Jersey general practice law firm. Prior thereto, Mr. Raymond acted as in-house counsel for Raymond & Perri, an accounting firm. From September 1993 to September 1994, Mr. Raymond was an American Trade Policy Consultant for Sekhar-Tunku Imran Holdings Sdn Berhad, a Malaysian multi-national firm. He is the nephew of Joseph J. Raymond.
Director Independence
None of the existing members of our Board of direct is considered “independent” as that term is define in NASD Rule 4200(a)(15,) other than Norman Goldstein. Bernard Freidman, who served as a director from August 6, 2007 until November 30, 2007, was not considered independent under such definition.
Code of Ethics and Business Conduct
We have adopted a Code of Ethics and Business Conduct that applies to all of our directors, officers and employees, including our Chief Executive Officer, our Chief Financial Officer and other senior financial officers. Our Code of Ethics and Business Conduct is posted on our website, www.stratusservices.com, under the “Employee Information-Legal” caption. We intend to disclose on our website any amendment to, or waiver of, a provision of the Code of Ethics and Business Conduct that applies to our Chief Executive Officer, our Chief Financial Officer or our other senior financial officers.
Audit Committee Financial Expert
The Audit Committee of our Board of Directors consists of Norman Goldstein and Thurston J. Hartford. Our Board of Directors has designated Norman Goldstein as the Audit Committee’s financial expert. Mr. Goldstein is considered “independent” under NASD Rule 4200(a)(15).
Compliance with Section 16(a) of the Exchange Act
Section 16(a) of the Exchange Act requires our executive officers and directors, and persons who own more than ten percent of a registered class of our equity securities, to file reports of ownership and changes in ownership on Forms 3, 4 and 5 with the Securities and Exchange Commission (the “SEC”). Officers, directors and greater than ten percent stockholders are required by SEC regulation to furnish the Company with copies of all Forms 3, 4 and 5 they file.
Based solely on our review of the copies of such forms we have received, we believe that all of our executive officers, directors and greater than ten percent stockholders complied with all filing requirements applicable to them with respect to events or transactions during fiscal 2007, except Jamie Raymond who failed to timely file a Form 4 in August 2007 in connection with his acquisition of 35,066 shares of our Common Stock in February 2007.
Nominees for Director
The Board will consider nominees for director suggested by our shareholders. A shareholder who wishes to suggest a nominee for director should write to our Corporate Secretary and include the following information: (1) the name and contact information for the nominee; (2) a statement of the nominee’s business experience and educational background; (3) a detailed description describing any relationship between the nominee and the proposing shareholder; (4) a statement by the shareholder explaining why he or she believes that the nominee is qualified to serve on the Board and how his or her service would benefit us; and (5) a statement that the nominee is willing to be considered and willing to serve as a director of Stratus if nominated and elected. We will provide notice in a Report on Form 10-Q filed with the Securities and Exchange Commission of the deadline by which the required information must be submitted to us. The Board retains complete discretion for making nominations for election as a member of the Board. There were no changes in the procedures by which shareholders may recommend nominees for director during the fiscal year ended September 30, 2007.
| ITEM 11. | EXECUTIVE COMPENSATION |
Compensation Discussion and Analysis
The following compensation discussion and analysis presents information regarding the compensation of our senior executives, including the process for determining the total compensation of our Chief Executive Officer and other Named Executive Officers for whom compensation is disclosed in the tables below. During the fiscal year ended September 30, 2007, our Board of Directors reviewed and approved the annual compensation of our executive officers. In September 2007, the Board of Directors appointed a Compensation Committee, consisting of Norman Goldstein, Thurston Hartford and Bernard Freedman, who subsequently resigned his position as a Director and member of the Compensation Committee in December 2007. In fiscal 2008, the Compensation Committee will have the responsibility of evaluating and approving compensation of directors and officers and formulating our compensation policy in the future.
Compensation Objectives and Policies
The objective of our executive compensation program is to enhance our long-term profitability by providing compensation that will attract and retain superior talent, reward performance and align the interests of the executive officers with the long-term interests of our shareholders.
In recent years, the Board of Directors has been responsible for ensuring that compensation and benefit packages provided are suitable and are not excessive. The Compensation Committee will fulfill this role in the future. Regarding most compensation matters, including executive and director compensation, management has provided recommendations to the Board of Directors. Inasmuch as certain executive officers have been members of the Board, their views as to their own compensation have been taken into account by the Board; however, until September 2007 when it established the Compensation Committee, the Board of Directors
did not delegate any of its functions to others in setting compensation. These compensation and benefit packages may include salaries, bonuses, vacations, termination benefits, contribution to employee pension plans, stock option and stock purchase plans, indemnification agreements and employment/change of control contracts.
When reviewing compensation arrangements for a member or members of senior management and directors, our Board has considered, and it is anticipated that the Compensation Committee will consider, the following matters:
| (a) | The combined value of all cash and non-cash benefits provided to the individual or individuals; |
| (b) | The compensation history of the individual or individuals as compared to other individuals with comparable expertise at Stratus; |
| (c) | Our financial condition; |
| (d) | Comparable compensation practices at similar companies location and the services provided; and |
| (e) | The projected total cost and benefit to us for post-employment benefits. |
Stock price performance has not been a factor in determining annual compensation because the price of our common stock is subject to a variety of factors outside management’s control.
The Board of Directors has not subscribed to an exact formula for allocating cash and non-cash compensation in the past, and neither the Board of Directors nor the Compensation Committee has developed formal guidelines to use for allocating compensation between cash and non-cash compensation; however, the Board of Directors believes that long-term performance can be enhanced through an ownership of culture that encourages long-term participation by executive officers in equity based awards, and it is anticipated that the Compensation Committee will take into account the liquidity and market price of equity to be awarded, publicly available data for other comparable companies, the number of shares and options held by our management and our cash position in determining the appropriate allocation. It is anticipated that in making such allocations, the Compensation Committee will balance our need to limit cash expenditures with the expectations of those individuals that it hopes to recruit and retain as employees.
Elements of the Executive Compensation Program
Base Salary
The base salaries of our President and Chief Executive Officer and our Chief Financial Officer have been established pursuant to employment agreements entered into a 1997 and 2005, respectively. Base salaries of officers and others who were previously employed by Green-Tech Assets, Inc. who became our employees when we acquired Green-Tech Assets, Inc.’s business in August 2005 are the same as the base salaries in place prior to the acquisition. Base salary levels for our other executive officers are competitively set relative to companies in peer businesses. In reviewing base salaries, our Board of Directors has taken into account, and it is anticipated that the Compensation Committee will take into account, individual experience and past performance.
Joseph J. Raymond served as our President and Chief Executive Officer for the fiscal year ended September 30, 2007. Mr. Raymond is entitled to an annual base salary of $175,000 per annum; however, Mr. Raymond voluntarily agreed to accept a reduced salary of $63,000 during fiscal 2007 to help us preserve our cash resources.
Bonus Awards
We did not pay any cash bonuses in fiscal 2007, and our Board of Directors has not established a specific individual or corporate quantitative or qualitative performance goals for determining future performance based incentive compensation, except to the extent that executive officers are entitled to such compensation pursuant to employment agreements. The Compensation Committee has not yet developed a policy with respect to how incentive cash compensation will fit within its overall compensation philosophy, but it is anticipated that any such policy will be influenced by competitive market conditions for attracting and retaining skilled personnel. It is anticipated that annual performance bonuses will be intended to provide a direct cash incentive to executive officers and other key employees for a variety of performance measures; however, specific performance measures have not yet been developed.
Equity Compensation
The purpose of the Stratus Services Group, Inc. 2006 Equity Incentive Plan (the “Equity Incentive Plan”) is to advance the interests of the company by enhancing our ability to (i) attract and retain employees and other persons or entities who are in a position to make significant contributions to the success of the Company; (ii) reward such persons for such contributions; and (iii) encourage such persons or entities to take into account the long-term interest of the Company through ownership of shares of the Company’s common stock, $.04 par value per share (the “Common Stock”).
The Equity Incentive Plan is intended to accomplish these objectives by enabling us to grant awards (“Awards”) in the form of incentive stock options, nonqualified stock options, stock appreciation, restricted stock, deferred stock, or other stock based awards. No awards were made under the Equity Incentive Plan during fiscal 2007.
Perquisites and Other Personal Benefits
We provide executive officers and other employees with perquisites and other personal benefits that our Board believes are reasonable and consistent with its overall compensation program to better enable us to attract and retain superior employees for key positions. The Board periodically reviews the levels of perquisite and other personal benefits provided. Each of our full-time employees is entitled to receive medical benefits and part of the cost is funded by the employee.
Change of Control
We have employment agreements with each of Joseph J. Raymond and Michael A. Maltzman, entered into on September 1997 and April 13, 2005, respectively, that contain change of control provisions. See discussion under “Employment Agreements; Potential Payments to Named Executive Officers Upon Termination of Employment or Change of Control” below.
Deductibility of Compensation
The Internal Revenue Code of 1986, as amended (the “Code”), restricts deductibility of annual individual compensation to its top executive officers in excess of $1 million if certain conditions set forth in the Code are not fully satisfied. We intend, to the extent
practicable, to preserve deductibility under the Code of compensation paid to its executive officers while maintaining compensation programs that effectively attract and retain exceptional executives in a highly competitive environment. Accordingly, compensation paid is generally tax-deductible. However, on occasion it may not be possible to satisfy all conditions of the Code for deductibility and still meet our compensation needs, and in such limited situations, certain compensation paid to some executives may not be tax-deductible.
Board of Directors Report
The Board of Directors has discussed and reviewed the foregoing Compensation Discussion and Analysis with management. Based upon this review and discussion, the Board recommended that the Compensation Discussion and Analysis be included in this Annual Report on Form 10-K.
The Board of Directors has reviewed all components of the executive officers’ compensation, including base salary levels, the cost of all perquisites and other personal benefits, as well as potential change-in-control scenarios. Based on this review, the Board finds the executive officers’ total compensation in the aggregate to be reasonable and not excessive.
Submitted by: Joseph J. Raymond
Norman Goldstein
Thurston Hartford
Michael Maltzman
Compensation Committee Interlocks and Insider Participation
The Compensation Committee of the Board of Directors, which consists of directors Norman Goldstein and Thurston Hartford, was established in September 2007 and will be responsible for determining whether the Company’s compensation and benefits packages are suitable and do not provide excessive benefits or result in material financial loss to Stratus. The Compensation Committee will also be responsible for approving or recommending to the Board compensation packages and plans for senior management and directors. These compensation packages include salaries, bonuses, vacations, termination benefits, profit-sharing plans, contributions to employee pension plans, stock option and stock purchase plans, indemnification agreements and employment/change of control contracts.
None of the members of the Compensation Committee is currently or has been at any time an officer or employee of Stratus. No member of the Compensation Committee or executive officer of Stratus serves as a member of the board of directors or compensation committee of any entity that has one or more executive officers serving as a member of the Board of Directors or Compensation Committee of Stratus.
SUMMARY COMPENSATION TABLE
The following table sets forth information concerning the annual and long-term compensation of the Named Executive Officers for services in all capacities for the fiscal year ended September 30, 2007. The Named Executive Officers are (1) our President and Chief Executive Officer, (2) our Chief Financial Officer and Treasurer, and (3) the President of STS, whose names are set forth in the table below (the “Named Executive Officers”). No other officer received total compensation in excess of $100,000 in fiscal 2007.
SUMMARY COMPENSATION TABLE for Fiscal Year End September 30, 2007 |
| Name and Principal Position | Year | Salary ($) | Bonus ($) | Stock Awards ($)(1) | Option Awards ($) | Non-Equity Incentive Plan Compensation ($) | Change in Pension Value and Nonqualified Deferred Compensation Earnings ($) | All Other Compensation ($) | Total ($) |
(a) | (b) | (c) | (d) | (e) | (f) | (g) | (h) | (i) | (j) |
Joseph J. Raymond Chairman and Chief Executive Officer | 2007 2006 2005 | $63,000 26,923 160,385 | $--- --- 10,000 | $ --- 16,000 --- | $ --- --- --- | $ --- --- --- | $ --- --- --- | $ --- --- --- | $63,000 42,923 170,385 |
Michael A. Maltzman Chief Financial Officer and Treasurer | 2007 2006 2005 | $179,584 178,729 172,308 | $--- 6,000 27,450 | $ --- 16,000 --- | $ --- --- --- | $ --- --- --- | $ --- --- --- | $ --- --- --- | $160,095 200,729 199,750 |
Jamie Raymond President of STS | 2007 2006 2005 | $160,095 138,960 126,760 | $--- 6,000 --- | $ --- 16,000 --- | $ --- --- --- | $ --- --- --- | $ --- --- --- | $ --- --- --- | $179,584 160,960 199,758 |
____
(1) Represents awards of restricted stock. Amounts reflected represent compensation expense recorded in connection with these awards.
Grants of Plan-Based Awards
No plan-based awards were made to any of the Named Officers during the fiscal year ended September 30, 2007.
Outstanding Equity Awards at Fiscal Year-End
The following table provides information about all equity compensation awards held by the Named Executive Officers at September 30, 2007.
OUTSTANDING EQUITY AWARDS for Fiscal Year End September 30, 2007 |
| | | |
| Name | Date of Grant | Number of Securities Underlying Unexercised Options (#) Exercisable | Number of Securities Underlying Unexercised Options (#) Unexercisable | Equity Incentive Plan Awards: Number of Securities Underlying Unexercised Unearned Options (#) | Option Exercise Price ($) | Option Expiration Date | Number of Shares or Units of Stock That Have Not Vested (#) | Market Value of Shares or Units of Stock That Have Not Vested ($) | Equity Incentive Plan Awards: Number of Unearned Shares, Units or Other Rights That Have Not Vested (#) | Equity Incentive Plan Awards: Market or Payout Value of Unearned Shares, Units or Other Rights That Have Not Vested ($) |
Joseph J. Raymond Chairman and Chief Executive Officer | - | - | - | - | - | - | - | - | - | - |
Michael A. Maltzman Chief Financial Officer and Treasurer | 04/20/05 | 750,000 | - | - | $0.26 | 04/19/15 | 83,334 | $1,667 | - | - |
Jamie Raymond President of STS | - | - | - | - | - | - | - | - | - | - |
Employment Agreements; Potential Payments to Named Executive Officers Upon Termination of Employment or Change in Control
In September 1997, we entered into an employment agreement (the “Raymond Agreement”) with Joseph J. Raymond, Chairman and Chief Executive Officer, which had an initial term that expired in September 2000. The Raymond Agreement has been extended through September 30, 2008. Pursuant to the Raymond Agreement and subsequent amendments, Mr. Raymond is entitled to a minimum annual base salary of $175,000 which is reviewed periodically and subject to such increases as the Board of Directors, in its sole discretion, may determine. During the term of the Raymond Agreement, if we are profitable, Mr. Raymond is entitled to a bonus/profit sharing award equal to .4% of our gross margin, but not in excess of 100% of his base salary. If we are not profitable, he is entitled to a $10,000 bonus. Mr. Raymond is eligible for all benefits made available to senior executive employees, and is entitled to the use of an automobile. In fiscal 2002, 2003 and 2004, Mr. Raymond voluntarily waived a substantial portion of his minimum annual base salary.
In the event we terminate Mr. Raymond without “Good Cause”, Mr. Raymond will be entitled to severance compensation equal to 2.9 times his base salary then in effect plus any accrued and unpaid bonuses and unreimbursed expenses. As defined in the Raymond Agreement “Good Cause” shall exist only if Mr. Raymond:
| • | willfully or repeatedly fails in any material respect to perform his obligations under the Raymond Agreement, subject to certain opportunities to cure such failure; |
| • | is convicted of a crime which constitutes a felony or misdemeanor or has entered a plea of guilty or no contest with respect to a felony or misdemeanor during his term of employment; |
| • | has committed any act which constitutes fraud or gross negligence; |
| • | is determined by the Board of Directors to be dependent upon alcohol or drugs; or |
| • | breaches confidentiality or non-competition provisions of the Raymond Agreement. |
Mr. Raymond is also entitled to severance compensation in the event that he terminates the Raymond Agreement for “Good Reason” which includes:
| • | the assignment to him of any duties inconsistent in any material respect with his position or any action which results in a significant diminution in his position, authority, duties or responsibilities; |
| • | a reduction in his base salary unless his base salary is, at the time of the reduction, in excess of $200,000 and the percentage reduction does not exceed the percentage reduction of our gross sales over the prior twelve month period; |
| • | We require Mr. Raymond to be based at any location other than within 50 miles of our current executive office location; and |
| • | a Change in Control of our Company, which includes the acquisition by any person or persons acting as a group of beneficial ownership of more than 20% of our outstanding voting stock, mergers or consolidations of our company which result in the holders of Stratus’ voting stock immediately before the transaction holding less than 80% of the voting stock of the surviving or resulting corporation, the sale of all or substantially all of our assets, and certain changes in our Board of Directors. |
In the event that the aggregate amount of compensation payable to Mr. Raymond would constitute an “excess parachute payment” under the Internal Revenue Code of 1986, as amended (the “Code”), then the amount payable to Mr. Raymond will be reduced so as not to constitute an “excess parachute payment.” All severance payments are payable within 60 days after the termination of employment.
Mr. Raymond has agreed that during the term of the Raymond Agreement and for a period of one year following the termination of his employment, he will not engage in or have any financial interest in any business enterprise in competition with us that operates anywhere within a radius of 25 miles of any offices maintained by us as of the date of the termination of employment.
On April 13, 2005, we entered into a new three (3) year employment agreement with Michael A. Maltzman, CFO (the “Maltzman Agreement”). Mr. Maltzman’s prior agreement was terminable by either party without cause at any time. However, in the event that Mr. Maltzman’s prior agreement had been terminated without cause or by Mr. Maltzman with good reason, Mr. Maltzman would have been entitled to a severance payment equal to the greater of one month’s salary for each year worked or three months’ salary.
Under the new Maltzman Agreement, Mr. Maltzman is entitled to a minimum annual salary of $175,000 for year one of the Agreement, $185,000 for year two of the Agreement, and $190,000 in year three of the agreement. This base salary is to be reviewed periodically and subject to such increases as the Board of Directors, in its sole discretion, may determine. During the term of the Maltzman Agreement, Mr. Maltzman is entitled to a bonus of three-tenths of one percent (3/10%) of our reported gross profits, for each financial quarter, such bonus to be payable within forty-five (45) days of completion of the applicable quarter, and such other bonus or bonuses as the Board in its discretion may determine to award him from time to time.
As further consideration for entering into the Maltzman Agreement, Mr. Maltzman received immediately exercisable options to purchase 750,000 shares of our common stock, at an exercise price equal to the market price on the date of grant. Mr. Maltzman also received 250,000 shares of restricted company common stock, vested evenly over a three (3) year period, and restricted as to transfer until vested. We also paid Mr. Maltzman an additional cash bonus of thirty-eight percent (38%) of the taxable income resulting to Mr. Maltzman from the grant of such restricted stock, in the year taxable to Mr. Maltzman. Mr. Maltzman is eligible for all benefits made available to senior executive employees, and is entitled to an automobile allowance.
In the event we terminate Mr. Maltzman without “Good Cause”, Mr. Maltzman will be entitled to severance compensation equal to the base salary then in effect, through the remainder of the three (3) year term, payable on a bi-monthly basis, plus any accrued and unpaid bonuses and unreimbursed expenses. As defined in the Maltzman Agreement “Good Cause” shall exist only if Mr. Maltzman willfully or repeatedly fails in any material respect to perform his obligations under the Maltzman Agreement, subject to certain opportunities to cure such failure; is convicted of a crime which constitutes a felony or misdemeanor or has entered a plea of guilty or no contest with respect to a felony or misdemeanor during his term of employment; has committed any act which constitutes fraud or gross negligence; or breaches confidentiality or non-competition provisions of the Maltzman Agreement. Mr. Maltzman is also entitled to severance compensation in the event that he terminates the Maltzman Agreement for “Good Reason” which includes the assignment to him of any duties inconsistent in any material respect with his position or any action which results in a significant diminution in his position, authority, duties or responsibilities; a reduction in his base salary unless his base salary is, at the time of the
reduction in excess of $190,000 and the percentage reduction does not exceed the percentage reduction of our gross sales over the prior twelve month period; we require Mr. Maltzman to be based at any location other than within 20 miles of its current executive office location; and, if the Maltzman Agreement is not assumed by the surviving corporation, a Change in Control, which includes the acquisition by any person or persons acting as a group of beneficial ownership of more than 20% of our outstanding voting stock, mergers or consolidations, which result in the holders of our voting stock immediately before the transaction holding less than 80% of the voting stock of the surviving or resulting corporation, the sale of all or substantially all of our assets, and certain changes in our senior management or Board of Directors.
In the event that the aggregate amount of compensation payable to Mr. Maltzman would constitute an “excess parachute payment” under the Internal Revenue Code of 1986, as amended, then the amount payable to Mr. Maltzman will be reduced so as not to constitute an “excess parachute payment.” Additionally, in the event that the aggregate severance and other compensation would be deemed “non-qualified deferred compensation” subject to any taxes, penalties, and/or interest for which Mr. Maltzman could be found liable if the same is deemed to be “non-qualified deferred compensation”, we shall reimburse Mr. Maltzman for any and all such additional taxes, penalties and interest.
Mr. Maltzman has agreed that during the term of the Maltzman Agreement and for a period of one year following the termination of his employment, he will not engage in or have any financial interest in any business enterprise in competition with us that operates anywhere within a radius of 75 miles of any office maintained by us as of the date of termination.
In agreeing to the severance and change-in-control provisions with Mr. Raymond and Mr. Maltzman, our Board of Directors believes that these provisions were necessary to induce them to remain in our employ, and that such provisions are relatively common for chief executive officers and chief financial officers. Differences between these arrangements with Mr. Raymond and Mr. Maltzman are primarily the result of the negotiations that took place with such officers.
| Option Exercises and Stock Vested Table |
The following table presents information with respect to options exercised by the Named Officers and stock awards held by the Named Officers that vested during the fiscal year ended September 30, 2007
OPTION EXERCISES AND STOCK VESTED |
| | Option Awards | Stock Awards |
Name (a) | Number of Shares Acquired on Exercise (#) (b) | Value Realized on Exercise ($) (c) | Number of Shares Acquired on Vesting (#) (d) | Value Realized on Vesting ($) (e) |
Joseph J. Raymond Chairman and Chief Executive Officer | --- | --- | --- | --- |
Michael A. Maltzman Chief Financial Officer | --- | --- | 83,333 | 1,667 |
James Raymond President of STS | --- | --- | --- | --- |
Director Compensation
We did not pay any compensation to our directors in fiscal 2007. Commencing in fiscal 2008 we anticipate that we will compensate non-employee directors through awards of common stock; however, the details of the non-employee director compensation program have not yet been developed.
| ITEM 12. | SECURITY OWNERSHIP OF CERTAIN BENEFICIAL OWNERS AND MANAGEMENT AND RELATED STOCKHOLDER MATTERS |
The following table sets forth information, as of December 31, 2007 with respect to (a) each person who is known by us to be the beneficial owner (as defined in Rule 13d-3 (“Rule 13d-3”) of the Securities and Exchange Act of 1934) of more than five percent (5%) of the Company’s Common Stock and Series F Preferred Stock and (b) the beneficial ownership of Common Stock and Series F Preferred Stock by each director, the Company’s Chief Executive Officer and the other of the Company’s current executive officers
of the Company who earned in excess of $100,000 in fiscal 2007, and by all directors and executive officers as a group. Except as set forth in the footnotes to the table, the stockholders have sole voting and investment power over such shares.
| | Common Stock | | Series F Preferred Stock | |
| Name of Beneficial Owner | Amount and Nature of Beneficial Ownership | | % of Class | | Amount and Nature of Beneficial Ownership | | % of Class | | |
| Joseph J. Raymond | 8,098,495 | (1) | 11.3 | % | 6,000 | | 100.0 | % | |
| Pinnacle Investment Partners, LLP | 7,721,258 | (2) | 9.99 | | ¾ | | ¾ | | |
| Michael A. Maltzman | 3,511,666 | (3) | 5.0 | | ¾ | | ¾ | | |
| Norman Goldstein | 2,040,275 | | 2.9 | | | | | | |
| Jamie Raymond | 3,035,056 | | 4.4 | | ¾ | | ¾ | | |
| Bernard Freedman | 11,000,000 | | 15.8 | | ¾ | | ¾ | | |
| Thurston Hartford | 2,000,000 | | 2.9 | | ¾ | | ¾ | | |
| All Directors and Executive Officers as a Group (5 Persons) (1) and (3) | 18,685,492 | | 25.8 | % | 6,000 | | 100.0 | % | |
| (1) | Includes (i) 1,500,000 shares of common stock issuable as of December 31, 2007, upon conversion of 6,000 shares of Series F Preferred Stock; and (ii) 570,500 shares of common stock issuable pursuant to warrants owned by a corporation of which Mr. Raymond is the sole owner. |
| (2) | Represents shares issuable upon conversion of secured Convertible Note and subject to warrants which are currently exercisable. Does not include 8,266,242 shares of our common stock acquirable upon the conversion of a convertible note and exercise of warrants held by the stockholder. Pursuant to the terms of the convertible note and warrants, the number of shares of our common stock that may be acquired by the stockholder upon any conversion of the convertible note and exercise of the warrants is limited, to the extent necessary, to ensure that following such conversion or exercise, the number of shares of our common stock then beneficially owned by the stockholder does not exceed 9.99% of the total number of shares of our common stock then outstanding. Accordingly, in light of the beneficial ownership cap, the stockholder is entitled to acquire in the aggregate 7.721,258 shares of our common stock. Based upon public releases issued by Pinnacle and documents filed with the Securities and Exchange Commission, the Company understands that Chris Janish, Pinnacle’s Fund Manager and President of PIP Management, Inc., the general partner of Pinnacle, has voting and dispositive power with respect to the shares held by Pinnacle. |
| (3) | Includes 750,000 shares subject to options which are currently exercisable or may become exercisable within 60 days of December 31, 2007. |
Securities Authorized for Issuance under Equity Compensation Plans
The number of stock options outstanding under our equity compensation plans, the weighted average exercise price of outstanding options, and the number of securities remaining available for issuance, as of September 30, 2007, was as follows:
| Plan Category | Number of securities to be issued upon exercise of outstanding options, warrants and rights (a) | Weighted-average exercise price of outstanding options, warrants and rights (b) | Number of securities remaining available for future issuance under equity compensation plans (excluding securities reflected In column (a)) (c) |
| | | | |
| Equity compensation plans approved by security holders (1) | 199,000 | $ .26 | 19,801,000 |
| | | | |
| Equity compensation plans not approved by security holders (2) | 551,000 | $ .26 | 0 |
| | | | |
| Total | 750,000 | $ .26 | 19,801,000 |
______________________________
| (1) | Our equity incentive plans provide for the issuance of incentive awards to officers, directors, employees and consultants in the form of stock options, stock appreciation rights, restricted stock and deferred stock, and in lieu of cash compensation. |
| | |
| (2) | Represents shares subject to options granted to Michael A. Maltzman which expire in April 2015. |
| CERTAIN RELATIONSHIPS AND RELATED TRANSACTIONS, AND DIRECTOR INDEPENDENCE. |
At September 30, 2007, we owed: $41,000 under a demand note bearing interest at 10% per annum to a corporation owned by the son of Joseph J. Raymond; $5,123 to a trust formed for the benefit of a family member of a former member of our Board of Directors under a promissory note bearing interest at 12% per annum which became due in full in August 2005 and $3,123 to a former member of our Board of Directors under a promissory note bearing interest at 12% per annum which became due in full in May 2006.
On January 21, 2007, we acquired an additional 1% interest in STS from Fusion Business Services, LLC in exchange for the issuance of 70,111 shares of our common stock. Fusion Business Services, LLC has the right to reacquire the 1% interest upon the occurrence of certain events, including the institution of bankruptcy or insolvency proceedings against us, a sale of all or substantially all of our assets, merger or consolidation between us and another entity or our liquidation or dissolution. Jamie Raymond, the son of Joseph J. Raymond, our President and Chief, is the President of STS.
During the fiscal year ended September 30, 2007, Joseph J. Raymond loaned us $100,000, which we repaid in January 2007 with no interest.
Bernard Freedman, who holds in excess of 5% of our outstanding common stock, loaned us $44,500 during the fiscal year ended September 30, 2007. This amount, with interest at a rate of 12% per annum, was repaid in September 2007.
At September 30, 2007, we owed $618,850 under a convertible promissory note issued to Pinnacle Investment partners, L.P. in January 2006. Pinnacle Investment Partners, L.P. is the beneficial holder of in excess of 5% of our Common Stock, and an affiliate of Pinnacle Investment Partners, L.P. is the nephew of Joseph J. Raymond.
| ITEM 14. | PRINCIPAL ACCOUNTING FEES AND SERVICES |
Selection of the independent public accountants for the Company is made by the Board of Directors. The Company’s Board of Directors did not have an Audit Committee in fiscal 2007 until an Audit Committee was established in September 2007.
The following table sets forth the aggregate fees billed to us for the years ended September 30, 2007 and September 30, 2006 by Gruber & Company, LLC, our independent auditors for the fiscal years ended September 30, 2007 and 2006:
| | 2007 | 2006 |
| | | |
| Audit Fees | $ 39,500 | $ 22,500 |
| Audit-Related Fees | -0- | -0- |
| Tax Fees | 7,500 | 15,130 |
| All Other Fees | -0- | -0- |
Audit fees represent amounts billed for professional services rendered for the audit of our annual financial statements and the reviews of the financial statements included in our Forms 10-Q and Forms 8-K for the fiscal year. Before Gruber & Company, LLC was engaged by us to render audit or non-audit services, the engagements were approved by our Board of Directors. Our Board of Directors is of the opinion that the Audit Related Fees charged by Gruber & Company, LLC were consistent with Gruber & Company, LLC maintaining its independence from us.
The Board of Directors has considered whether provision of the non-audit services described above is compatible with maintaining the independent accountant’s independence and has determined that such services did not adversely affect Gruber & Company, LLC’s independence.
| EXHIBITS, FINANCIAL STATEMENT SCHEDULES |
| Number | Description |
| | |
| 2.1 | Asset Purchase Agreement, dated July 9, 1997, among the Company and Royalpar Industries, Inc., Ewing Technical Design, Inc., LPL Technical Services, Inc. and Mainstream Engineering Company, Inc., as amended by Amendment No. 1 to the Asset Purchase Agreement, dated as of July 29, 1997.(1) |
| | |
| 2.2 | Asset Purchase Agreement, effective January 1, 1999, by and between the Company and B&R Employment Inc.(1) |
| | |
| 2.3 | Asset Purchase Agreement, dated June 16, 2000, by and between the Company and Outsource International of America, Inc.(5) |
| | |
| 2.4 | Asset Purchase Agreement, dated October 13, 2000, by and between the Company and Outsource International of America, Inc.(6) |
| | |
| 2.5 | Asset Purchase Agreement, dated January 2, 2001, by and between the Company and Cura Staffing Inc. and Professional Services, Inc.(15) |
| | |
| 2.6 | Asset Purchase Agreement, dated July 27, 2001, by and between the Company and Source One Personnel, Inc.(8) |
| | |
| 2.7 | Asset Purchase Agreement, dated December 27, 2001, by and between the Company and Provisional Employment Solutions, Inc.(9) |
| | |
| 2.8 | Asset Purchase Agreement, dated as of January 24, 2002 among the Company, Charles Sahyoun, Sahyoun Holdings, LLC and SEA Consulting Services Corporation. Information has been omitted from the exhibit pursuant to an order granting confidential treatment.(16) |
| | |
| 2.9 | Asset Purchase Agreement dated as of March 4, 2002, by and among Wells Fargo Credit, Inc. and the Company.(22) |
| | |
| 2.10 | Asset Purchase Agreement dated November 19, 2002, by and between the Company and Elite Personnel Services, Inc.(23) |
| | |
| 2.11 | Asset Purchase Agreement dated as of September 10, 2003 between the Company and D/O Staffing, LLC.(28) |
| | |
| 2.12 | Asset Purchase Agreement dated as of August 18, 2003 between the Company and ALS, LLC.(28) |
| | |
| 2.13 | Asset Purchase Agreement dated as of June 10, 2005 between Stratus Services Group, Inc. and ALS, LLC. (33) |
| | |
| 2.14 | Asset Purchase Agreement dated as of October 21, 2005 between Stratus Services Group, Inc. and Source One Financial Staffing, LLC. (34) |
| | |
| 2.16 | Asset Purchase Agreement dated as of December 2, 2005 between Stratus Services Group, Inc. and ALS, LLC. (35) |
| | |
| 2.17 | Asset Purchase Agreement dated as of December 5, 2005 between Stratus Services Group, Inc. and Accountabilities, Inc. (35) |
| | |
| 2.18 | Asset Purchase Agreement dated as of December 7, 2005 between Stratus Services Group, Inc. and Source One Personnel, Inc (35) |
| | |
| 2.19 | Asset Purchase Agreement dated as of December 7, 2005 between Stratus Services Group, Inc. and Tri-State Employment Service, Inc. (35) |
| 2.20 | Asset Purchase Agreement dated as of August 1, 2007 among Transworld Assets, LLC, Green-Tech Assets, Inc. and CC Laurel, Inc. (53) |
| 3.1 | Amended and Restated Certificate of Incorporation of the Company.(1) |
| | |
| 3.1.1 | Certificate of Designation, Preferences and Rights of Series A Preferred Stock.(10) |
| | |
| 3.1.2 | Certificate of Amendment to Certificate of Designation.(14) |
| | |
| 3.1.3 | Certificate of Designation, Preferences and Rights of Series B Preferred Stock.(14) |
| | |
| 3.1.4 | Certificate of Designation, Preferences and Rights of Series E Preferred Stock.(21) |
| | |
| 3.1.5 | Certificate of Amendment to Certificate of Designation, Preferences and Rights of Series E Preferred Stock.(21) |
| | |
| 3.1.6 | Certificate of Designation, Preferences and Rights of Series F Preferred Stock.(21) |
| | |
| 3.1.7 | Certificate of Designation, Preferences and Rights of Series H Preferred Stock.(24) |
| | |
| 3.1.8 | Certificate of Amendment to Certificate of Designation, Preferences and Rights of Series E Preferred Stock.(28) |
| | |
| 3.1.9 | Form of Certificate of Designation, Preferences and Rights of Series I Preferred Stock.(31) |
| | |
| 3.1.10 | Certificate of Amendment to Restated Certificate of Incorporation.(31) |
| | |
| 3.2 | By-Laws of the Registrant.(2) |
| | |
| 4.1.1 | Specimen Common Stock Certificate of the Company.(1) |
| | |
| 4.1.2 | Form of 6% Convertible Debenture.(11) |
| | |
| 4.1.8 | Specimen Series E Stock Certificate of the Company.(21) |
| | |
| 4.1.9 | Specimen Series F Stock Certificate of the Company.(21) |
| | |
| 4.1.10 | Exchange Agreement between Pinnacle Investment Partners, LP and the Company.(21) |
| | |
| 4.1.11 | Exchange Agreement between Transworld Management Services, Inc. and the Company.(21) |
| | |
| 4.1.12 | Stock Purchase Agreement between Joseph J. Raymond, Sr., and the Company regarding Series F Preferred Stock. (21) |
| | |
| 4.1.13 | Specimen Series I Stock Certificate of the Company.(32) |
| | |
| 4.2.1 | Warrant for the Purchase of 10,000 Shares of Common Stock of Stratus Services Group, Inc., dated November 30, 1998, between Alan Zelinsky and the Company and supplemental letter thereto dated December 2, 1998.(1) |
| | |
| 4.2.2 | Warrant for the Purchase of 40,000 Shares of Common Stock of Stratus Services Group, Inc., dated November 23, 1998, between David Spearman and the Company.(1) |
| | |
| 4.2.3 | Warrant for the Purchase of 10,000 Shares of Common Stock of Stratus Services Group, Inc., dated November 30, 1998, between Sanford Feld and the Company, and supplemental letter thereto dated December 2, 1998.(1) |
| | |
| 4.2.4 | Warrant for the Purchase of 20,000 Shares of Common Stock of Stratus Services Group, Inc., dated November 30, 1998, between Peter DiPasqua, Jr. and the Company.(1) |
| | |
| 4.2.5 | Warrant for the Purchase of 20,000 Shares of Common Stock of Stratus Services Group, Inc., dated December 2, 1998, between Shlomo Appel and the Company.(1) |
| | |
| 4.2.6 | Form of Underwriter’s Warrant Agreement between the Company and Hornblower & Weeks, Inc., including form of warrant certificate.(7) |
| 4.2.7 | Warrant for the Purchase of Common Stock dated as of December 4, 2000 issued to May Davis Group, Inc.(13) |
| | |
| 4.2.8 | Warrant for the Purchase of Common Stock dated as of December 4, 2000 issued to Hornblower & Weeks, Inc.(13) |
| | |
| 4.2.9 | Warrant for the Purchase of Common Stock dated as of December 12, 2001 issued to International Capital Growth. (15) |
| | |
| 4.2.10 | Warrant for the Purchase of Common Stock dated as of April 9, 2002 issued to CEOCast.(22) |
| | |
| 4.2.11 | Warrant for the Purchase of Common Stock dated as of October 17, 2001 issued to Stetson Consulting.(22) |
| | |
| 4.2.12 | Warrant for the Purchase of Common Stock dated as of November 3, 2003 issued to Advantage Services Group, LLC.(28) |
| | |
| 4.2.13 | Warrant Agreement between the Company and American Stock Transfer & Trust Company, including form of warrant certificate for warrant comprising part of unit.(31) |
| | |
| 4.2.14 | Secured Convertible Promissory Note dated as of December 28, 2005 issued to Pinnacle Investment Partners, L.P. (36) |
| | |
| 10.1.1 | Employment Agreement dated September 1, 1997, between the Company and Joseph J. Raymond.(1)* |
| | |
| 10.1.7 | Consulting Agreement, dated as of August 11, 1997, between the Company and Jeffrey J. Raymond.(1) |
| | |
| 10.1.8 | Non-Competition Agreement, dated June 19, 2000 between the Company and Outsource International of America, Inc.(5) |
| | |
| 10.1.9 | Non-Competition Agreement, dated October 27, 2000 between the Company and Outsource International of America, Inc.(6) |
| | |
| 10.1.10 | Option to purchase 1,000,000 shares of the Company’s Common Stock issued to Joseph J. Raymond.(11) |
| | |
| 10.1.11 | Option to purchase 500,000 shares of the Company’s Common Stock issued to Joseph J. Raymond. (19) |
| | |
| 10.1.12 | Option to purchase 1,750,000 shares of the Company’s Common Stock issued to Joseph J. Raymond.(19) |
| | |
| 10.1.13 | Non-Competition Agreements dated December 1, 2002 between the Company and each of Elite Personnel Services, Inc. and Bernard Freedman.(23) |
| | |
| 10.1.14 | Employment Agreement dated December 1, 2002 between the Company and Bernard Freedman.(23) |
| | |
| 10.2.1 | Lease, effective October 1, 2002, for offices located at 500 Craig Road, Manalapan, New Jersey 07726.(22) |
| | |
| 10.4.2 | Promissory Note and Security Agreement in the amount of $400,000, dated as of June 19, 2000, issued by the Company to Outsource International of America, Inc.(5) |
| | |
| 10.4.3 | Promissory Note in the amount of $100,000, dated as of June 19, 2000, issued by the Company to Outsource International of America, Inc.(5) |
| 10.4.4 | Promissory Note and Security Agreement in the amount of $75,000, dated as of October 27, 2000, issued by the Company to Outsource International of America, Inc.(6) |
| | |
| 10.4.5 | Promissory Note and Security Agreement in the amount of $600,000, dated as of July 27, 2001, issued by the Company to Source One Personnel, Inc.(8) |
| | |
| 10.4.6 | Promissory Note and Security Agreement in the amount of $1.8 million, dated as of July 27, 2001, issued by the Company to Source One Personnel, Inc.(8) |
| | |
| 10.4.7 | Promissory Note in the amount of $1,264,000 dated as of December 1, 2002, issued by the Company to Elite Personnel Services, Inc.(23) |
| 10.5.1 | Registration Rights Agreement, dated August, 1997, by and among the Company and AGR Financial, L.L.C.(1) |
| | |
| 10.5.2 | Registration Rights Agreement, dated August 1997, by and among the Company and Congress Financial Corporation (Western).(1) |
| | |
| 10.5.3 | Form of Registration Rights Agreement, dated December 4, 2000, by and among the Company and purchasers of the Company’s 6% Convertible Debenture.(11) |
| | |
| 10.5.4 | Registration Rights Agreement, dated as of December 4, 2000, between the Company, May Davis Group, Inc., Hornblower & Weeks, Inc. and the other parties named therein.(13) |
| | |
| 10.6.1 | Stock Purchase and Investor Agreement, dated August 1997, by and between the Company and Congress Financial Corporation (Western).(1) |
| | |
| 10.6.2 | Stock Purchase and Investor Agreement, dated August 1997, by and among the Company and AGR Financial, L.L.C.(1) |
| | |
| 10.6.3 | Form of Securities Purchase Agreement, dated December 4, 2000 by and between the Company and purchasers of the Company’s 6% Convertible Debenture.(11) |
| | |
| 10.7.1 | 1999 Equity Incentive Plan.(1)** |
| | |
| 10.7.2 | 2000 Equity Incentive Plan.(11)** |
| | |
| 10.7.3 | 2001 Equity Incentive Plan.(12)** |
| | |
| 10.7.4 | 2002 Equity Incentive Plan.(19)** |
| | |
| 10.7.5 | Form of Option issued under 1999 Equity Incentive Plan.(19)** |
| | |
| 10.7.6 | Form of Option issued under 2000 Equity Incentive Plan.(19)** |
| | |
| 10.7.7 | Form of Option issued under 2001 Equity Incentive Plan.(19)** |
| | |
| 10.7.8 | Form of Option issued under 2002 Equity Incentive Plan.(19)** |
| | |
| 10.8 | Debt to Equity Conversion Agreement by and between the Company and B&R Employment, Inc.(3) |
| | |
| 10.8.1 | Amendment to Debt to Equity Conversion Agreements by and between the Company and B&R Employment, Inc.(2) |
| | |
| 10.8.2 | Forbearance Agreement dated January 24, 2002 between the Company and Source One Personnel. (20) |
| | |
| 10.8.3 | Modification of Forbearance Agreement dated June 4, 2002 between the Company and Source One Personnel, together with Exhibits thereto.(21) |
| 10.10 | Allocation and Indemnity Agreement dated as of January 24, 2002 among the Company, Charles Sahyoun and Sahyoun Holdings, LLC.(20) |
| | |
| 10.11 | Letter Agreement dated April 15, 2002 between the Company, Sahyoun Holdings, LLC and Joseph J. Raymond, Sr. amending the Allocation and Indemnity Agreement dated April 18, 2002.(17) |
| | |
| 10.12 | Exchange Agreement dated March 11, 2002 by and between Transworld Management Services, Inc. and the Company.(22) |
| | |
| 10.13 | Securities Purchase Agreement dated March 11, 2002, by and between Pinnacle Investment Partners, LP and the Company.(22) |
| | |
| 10.14 | Operating Agreement of Stratus Technology Services.(28) |
| 10.15 | Form of Securities Purchase Agreement between the Company and Series E Shareholders.(27) |
| | |
| 10.16 | Compromise Agreement between the Company and Series E Shareholders dated July 30, 2003.(27) |
| | |
| 10.17 | Redemption Agreement dated July 31, 2003 between Artisan (UK) plc and the Company.(29) |
| | |
| 10.18 | Agreement to Exchange Series H Preferred Shares for Series E Preferred Shares between the Company and Pinnacle Investment Partners, L.P.(27) |
| | |
| 10.20 | Letter Agreement regarding Receivables between the Company and Advantage Services Group, LLC. (28) |
| | |
| 10.21 | Waiver Letter Agreement between the Company and Series E Shareholders.(31) |
| | |
| 10.22 | Letter Agreement between the Company and the Series A Holders extending the time for issuance of shares.(31) |
| | |
| 10.27 | Payment Plan Agreement between the Company and the California EDD. (38) |
| | |
| 10.31 | Employment Agreement of Michael A. Maltzman, CFO. (39) |
| | |
| 10.33 | Stratus Services Group, Inc. Non-Competition and Non-Solicitation Agreement. (33) |
| | |
| 10.34 | ALS, LLC Non-Competition and Non-Solicitation Agreement. (33) |
| | |
| 10.53 | Non-Competition and Non-Solicitation Agreement executed by Stratus Services Group, Inc. for the benefit of ALS, LLC. (34) |
| | |
| 10.62 | Non-Competition and Non-Solicitation Agreement dated December 2, 2005 between Stratus Services Group, Inc. and ALS, LLC binding Stratus Services Group, Inc to the terms thereto. (51) |
| | |
| 10.63 | Non-Competition and Non-Solicitation Agreement dated December 5, 2005 between Stratus Services Group, Inc. and Accountabilities, Inc. binding Stratus Services Group, Inc to the terms thereto. (51) |
| | |
| 10.64 | Non-Competition and Non-Solicitation Agreement dated December 7, 2005 between Stratus Services Group, Inc. and Source One Personnel binding Stratus Services Group, Inc. to the terms thereto. (51) |
| | |
| 10.65 | Non-Competition and Non-Solicitation Agreement dated December 7, 2005 between Stratus Services Group, Inc. and Tri-State Employment Service, Inc. binding Stratus Services Group, Inc. to the terms thereto. (51) |
| | |
| 10.66 | Non-Competition and Non-Solicitation Agreement dated December 7, 2005 between Stratus Services Group, Inc. and Tri-State Employment Service, Inc. binding Tri-State Employment Service, Inc. to the terms thereto. (51) |
| | |
| 10.67 | Exchange Agreement dated as of December 28, 2005 between Stratus Services Group, Inc. and Pinnacle Investment Partners, L.P. (51) |
| | |
| 10.68 | Settlement Agreement between California Compensation Insurance Fund and Stratus Services Group, Inc. (52) |
| | |
| 10.69 | Membership Interest Purchase Agreement between Stratus Services Group, Inc. and Fusion Business Services, LLC (54) |
| | |
| 10.70 | Promissory Note issued by Transworld Assets, LLC to Green-Tech Assets, Inc. dated August 1, 2007. (53) |
| | |
| 10.71 | Guaranty issued by Stratus Services Group, Inc. dated August 1, 2007. (53) |
| | |
| 10.72 | Registration Rights Agreement dated as of August 1, 2007 between Stratus Services Group, Inc. and Thurston J. Hartford. (53) |
| | |
| 10.73 | Operating Agreement of Transworld Assets, LLC. (55) |
| | |
| 21 | Subsidiaries of Registrant. (filed herewith) |
| 23 | Consent of E. Randall Gruber, CPA, P.C.(filed herewith) |
| | |
| 24 | Power of Attorney (located on signature pages of this filing). |
| | |
| 31.1 | Certification of Chief Executive Officer pursuant to Section 302 of the Sarbanes-Oxley Act of 2002.(filed herewith) |
| | |
| 31.2 | Certification of Chief Financial Officer pursuant to Section 302 of the Sarbanes-Oxley Act of 2002.(filed herewith) |
| 32.1 | Certification of Chief Executive Officer pursuant to Section 906 of the Sarbanes-Oxley Act of 2002.(filed herewith) |
| | |
| 32.2 | Certification of Chief Financial Officer pursuant to Section 906 of the Sarbanes-Oxley Act of 2002.(filed herewith) |
| | |
| * | Constitutes a management contract required to be filed pursuant to Item 14(c) of Form 10-K. |
| | |
| ** | Constitutes a compensation plan required to be filed pursuant to Item 14(c) of Form 10-K. |
________________________
| Footnote 1 | Incorporated by reference to similarly numbered Exhibits filed with Amendment No. 1 to the Company’s Registration Statement on Form SB-2 (Registration Statement No. 333-83255) as filed with the Securities and Exchange Commission on September 3, 1999. |
| | |
| Footnote 2 | Incorporated by reference to similarly numbered Exhibits filed with Amendment No. 6 to the Company’s Registration Statement on Form SB-2 (Registration Statement No. 333-83255) as filed with the Securities and Exchange Commission on February 1, 2000. |
| | |
| Footnote 3 | Incorporated by reference to similarly numbered Exhibits filed with Amendment No. 3 to the Company’s Registration Statement on Form SB-2 (Registration Statement No. 333-83255) as filed with the Securities and Exchange Commission on December 17, 1999. |
| | |
| Footnote 4 | Incorporated by reference to similarly numbered Exhibits filed with Amendment No. 7 to the Company’s Registration Statement on Form SB-2 (Registration Statement No. 333-83255) as filed with the Securities and Exchange Commission on March 17, 2000. |
| | |
| Footnote 5 | Incorporated by reference to the Exhibits to the Company’s Form 8-K, as filed with the Securities and Exchange Commission on June 30, 2000. |
| | |
| Footnote 6 | Incorporated by reference to the Exhibits to the Company’s Form 8-K, as filed with the Securities and Exchange Commission on November 3, 2000. |
| | |
| Footnote 7 | Incorporated by reference to Exhibit 1.2 filed with Amendment No. 5 to the Company’s Registration Statement on Form SB-2 (Registration Statement No. 333-83255) as filed with the Securities and Exchange Commission on February 11, 2000. |
| | |
| Footnote 8 | Incorporated by reference to the Exhibits to the Company’s Form 8-K, as filed with the Securities and Exchange Commission on August 9, 2001. |
| | |
| Footnote 9 | Incorporated by reference to the Exhibits to the Company’s Form 8-K, as filed with the Securities and Exchange Commission on January 2, 2002. |
| | |
| Footnote 10 | Incorporated by reference to Exhibit 3 filed with Form 10-Q for the Quarter ended June 30, 2001 as filed with the Securities and Exchange Commission on August 14, 2001. |
| | |
| Footnote 11 | Incorporated by reference to similarly numbered Exhibits to the Company’s Form 10-KSB, as filed with the Securities and Exchange Commission on December 29, 2000. |
| | |
| Footnote 12 | Incorporated by reference to similarly numbered Exhibits filed with the Company’s Registration Statement on Form S-1 (Registration Statement No. 333-55312) as filed with the Securities and Exchange Commission on February 9, 2001. |
| | |
| Footnote 13 | Incorporated by reference to the Exhibits to the Company’s Form S-1/A, as filed with the Securities and Exchange Commission on April 11, 2001. |
| Footnote 14 | Incorporated by reference to the Exhibits to the Company’s Form 8-K, as filed with the Securities and Exchange Commission on April 4, 2002. |
| | |
| Footnote 15 | Incorporated by reference to similarly numbered Exhibits filed with the Registrant’s Form 10-K for the fiscal year ended September 30, 2001, and filed with the Securities and Exchange Commission on January 25, 2002. |
| Footnote 16 | Incorporated by reference to similarly numbered Exhibits filed with the Registrant’s Form 10-K/A for the fiscal year ended September 30, 2001, as filed with the Securities and Exchange Commission on March 5, 2002. |
| | |
| Footnote 17 | Incorporated by reference to the Exhibits to the Company’s Form 10-Q for the quarter ended March 31, 2002, as filed with the Securities and Exchange Commission on May 15, 2002. |
| | |
| Footnote 18 | Incorporated by reference to the Exhibits to the Company’s Form 8-K, as filed with the Securities and Exchange Commission on April 4, 2002. |
| | |
| Footnote 19 | Incorporated by reference to the Exhibits to the Company’s Form S-8, as filed with the Securities and Exchange Commission on September 17, 2002. |
| | |
| Footnote 20 | Incorporated by reference to the Exhibits to the Company’s Form 10-K, as filed with the Securities and Exchange Commission on January 25, 2002, as amended by the Company’s Form 10-K/A, as filed with the Securities and Exchange Commission on March 5, 2002. |
| | |
| Footnote 21 | Incorporated by reference to the Company’s 10-Q, for the quarter ended June 30, 2002, as filed with the Securities and Exchange Commission on August 14, 2002. |
| | |
| Footnote 22 | Incorporated by reference to the similarly numbered Exhibits filed with the Company’s Registration Statement on Form S-1 (Registration Statement No. 333-100149) as filed with the Securities and Exchange Commission on September 27, 2002. |
| | |
| Footnote 23 | Incorporated by reference to Exhibits to the Company’s Form 8-K, as filed with the Securities and Exchange Commission on November 26, 2002. |
| | |
| Footnote 24 | Incorporated by reference to the similarly numbered Exhibits to the Company’s Form 10-K, as filed with the Securities and Exchange Commission on December 23, 2002. |
| | |
| Footnote 25 | Incorporated by reference to the Exhibits to the Company’s Form S-1, as filed with the Securities and Exchange Commission on February 2, 2003. |
| | |
| Footnote 26 | Incorporated by reference to the Exhibits to the Company’s Form S-1, as filed with the Securities and Exchange Commission on March 20, 2003. |
| | |
| Footnote 27 | Incorporated by reference to the similarly numbered exhibits to the Company’s Form 10-Q for the quarterly period ended June 30, 2003, as filed with the Securities and Exchange Commission on August 13, 2003. |
| | |
| Footnote 28 | Incorporated by reference to similarly numbered exhibits to the Company’s Form 10-K for the fiscal year ended September 30, 2003 as filed with the Securities and Exchange Commission on December 24, 2003. |
| | |
| Footnote 29 | Incorporated by reference to similarly numbered exhibits to Amendment No. 2 to the Company’s Registration Statement on Form S-1 filed with the Securities and Exchange Commission on March 30, 2004. |
| | |
| Footnote 30 | Incorporated by reference to similarly numbered exhibits to Post-Effective Amendment No. 1 to the Company’s Registration Statement on Form S-1 filed with the Securities and Exchange Commission on June 14, 2004. |
| | |
| Footnote 31 | Incorporated by reference to similarly numbered exhibits to the Company’s Form 10-Q for the quarter ended June 30, 2004 as filed with the Securities and Exchange Commission on August 16, 2004. |
| | |
| Footnote 32 | Incorporated by reference to similarly numbered exhibits to Amendment No. 1 to the Company’s Registration Statement on Form S-4 filed with the Securities and Exchange Commission on March 30, 2004. |
| | |
| Footnote 33 | Incorporated by reference to similarly numbered exhibits to the Company’s Form 8-K, as filed with the Securities and Exchange Commission on June 15, 2005. |
| | |
| Footnote 34 | Incorporated by reference to similarly numbered exhibits to the Company’s Form 8-K, as filed with the Securities and Exchange Commission on October 25, 2005. |
| Footnote 35 | Incorporated by reference to similarly numbered exhibits to the Company’s Form 8-K, as filed with the Securities and Exchange Commission on December 23, 2005. |
| | |
| Footnote 36 | Incorporated by reference to similarly numbered exhibits to the Company’s Form 8-K, as filed with the Securities and Exchange Commission on January 18, 2006. |
| | |
| Footnote 37 | Incorporated by reference to similarly numbered exhibits to the Company’s Form 8-K/A, as filed with the Securities and Exchange Commission on January 21, 2006. |
| | |
| Footnote 38 | Incorporated by reference to similarly numbered exhibits to the Company’s Report on Form 10-Q for the quarterly period ended December 31, 2004, as filed with the Securities and Exchange Commission on February 14, 2005. |
| | |
| Footnote 39 | Incorporated by reference to similarly numbered exhibits to the Company’s Report on Form 10-Q for the quarterly period ended March 30, 2005, as filed with the Securities and Exchange Commission on May 16, 2005. |
| | |
| Footnote 40 | Incorporated by reference to similarly numbered exhibits to the Company’s Report on Form 10-Q for the quarterly period ended June 30, 2005, as filed with the Securities and Exchange Commission on August 17, 2005. |
| | |
| Footnote 41 | Incorporated by reference to similarly numbered exhibits to the Company’s Form 8-K, as filed with the Securities and Exchange Commission on August 30, 2005. |
| | |
| Footnote 42 | Incorporated by reference to similarly numbered exhibits to the Company’s Form 8-K, as filed with the Securities and Exchange Commission on September 8, 2005. |
| | |
| Footnote 43 | Incorporated by reference to similarly numbered exhibits to the Company’s Form 8-K, as filed with the Securities and Exchange Commission on September 14, 2005. |
| | |
| Footnote 44 | Incorporated by reference to similarly numbered exhibits to the Company’s Form 8-K, as filed with the Securities and Exchange Commission on September 21, 2005. |
| | |
| Footnote 45 | Incorporated by reference to similarly numbered exhibits to the Company’s Form 8-K, as filed with the Securities and Exchange Commission on October 4, 2005. |
| | |
| Footnote 46 | Incorporated by reference to similarly numbered exhibits to the Company’s Form 8-K, as filed with the Securities and Exchange Commission on October 7, 2005. |
| | |
| Footnote 47 | Incorporated by reference to similarly numbered exhibits to the Company’s Form 8-K, as filed with the Securities and Exchange Commission on October 12, 2005. |
| | |
| Footnote 48 | Incorporated by reference to similarly numbered exhibits to the Company’s Form 8-K, as filed with the Securities and Exchange Commission on November 7, 2005. |
| | |
| Footnote 49 | Incorporated by reference to similarly numbered exhibits to the Company’s Form 8-K, as filed with the Securities and Exchange Commission on November 18, 2005. |
| | |
| Footnote 50 | Incorporated by reference to similarly numbered exhibits to the Company’s Form 8-K, as filed with the Securities and Exchange Commission on November 30, 2005. |
| | |
| Footnote 51 | Incorporated by reference to similarly numbered exhibits to the Company’s Form 10-K, as filed with the Securities and Exchange Commission on February 3, 2006. |
| | |
| Footnote 52 | Incorporated by reference to similarly numbered exhibits to the Company’s Form 8-K, as filed with the Securities and Exchange Commission on December 7, 2006. |
| | |
| Footnote 53 | Incorporated by reference to similarly numbered exhibits to the Company’s Form 8-K, as filed with the Securities and Exchange Commission on August 6, 2007. |
| | |
| Footnote 54 | Incorporated by reference to similarly numbered exhibits to the Company’s Report on Form 10-Q for the quarterly period ended December 31, 2006, as filed with the Securities and Exchange Commission on February 14, 2007. |
| | |
| Footnote 55 | Incorporated by reference to similarly numbered exhibits to the Company’s Report on Form 10-Q for the quarterly period ended June 30, 2007, as filed with the Securities and Exchange Commission on August 13, 2007 |
SIGNATURES
Pursuant to the requirements of Section 13 or 15(d) of the Securities Exchange Act of 1934, the registrant has duly caused this report to be signed on behalf of the undersigned, thereunto duly authorized.
| | STRATUS SERVICES GROUP, INC. |
| | | |
| | | |
| Date: January 14, 2008 | By: | /s/ Joseph J. Raymond | |
| | | Joseph J. Raymond |
| | | Chairman of the Board of Directors, President and Chief Executive Officer |
| | | |
POWER OF ATTORNEY
KNOW ALL PERSONS BY THESE PRESENTS that each individual whose signature appears below constitutes and appoints Joseph J. Raymond and each of them, as his true lawful attorney-in-fact and agent, with full power of substitution for him or her and in his or her name, place and stead, in any and all capacities, to sign any and all amendments to this Form 10-K, and to file the same, together with all the exhibits thereto and all documents in connection therewith, with the Securities and Exchange Commission, granting unto said attorneys-in-fact and agents, and each of them, full power and authority to do and perform each and every act and being requisite and necessary to be done in and about the premises, as fully to all intents and purposes as he or she might or could do in person, hereby ratifying and confirming all that said attorneys-in-fact and agents or any of them, of his or her or their substitute or substitutes, may lawfully do or cause to be done by virtue hereof.
Pursuant to the requirements of the Securities Exchange Act of 1934, this report has been signed below by the following persons on behalf of the registrant and in the capacities and on the dates indicated.
| Signature | | Title | | Date | |
| | | |
| | | |
| /s/ Joseph J. Raymond | | Chairman, Chief Executive Officer and Director | January 14, 2008 |
| Joseph J. Raymond | (Principal Executive Officer) | |
| | | |
| | | |
| /s/ Michael A. Maltzman | | Vice President, Chief Financial Officer and Director | January 14, 2008 |
| Michael A. Maltzman | (Principal Financing and Accounting Officer) | |
| | | |
| | | |
| /s/ Norman Goldstein | | Director | January 14, 2008 |
| Norman Goldstein | | |
| | | |
| | | |
| /s/ Thurston J. Hartford | Director | January 14, 2008 |
| Thurston J. Hartford | | |
STRATUS SERVICES GROUP, INC.
As of September 30, 2007 and 2006
and for the Years Ended September 30, 2007, 2006 and 2005
| Report of Gruber & Company, LLC | F-2 |
| Consolidated Financial Statements | |
| F-3 |
| F-5 |
| F-6 |
| F-8 |
| F-14 |
Gruber & Company, LLC
REPORT OF INDEPENDENT REGISTERED PUBLIC ACCOUNTING FIRM
To the Shareholders and Board of Directors
Stratus Services Group, Inc.
We have audited the accompanying consolidated balance sheets of Stratus Services Group, Inc. as of September 30, 2007 and 2006, and the related consolidated statements of operations, stockholders’ equity (deficiency) and cash flows for each of the years in the three-year period ended September 30, 2007. These financial statements are the responsibility of the company’s management. Our responsibility is to express an opinion on these financial statements based on our audits.
We conducted our audits in accordance with the standards of the Public Company Accounting Oversight Board (United States). Those standards require that we plan and perform the audit to obtain reasonable assurance about whether the financial statements are free of material misstatement. The company is not required to have, nor were we engaged to perform, an audit of its internal control over financial reporting. Our audit included consideration of internal control over financial reporting as a basis for designing audit procedures that are appropriate in the circumstances, but not for the purpose of expressing an opinion on the effectiveness of the company’s internal control over financial reporting. Accordingly, we express no such opinion. An audit also includes examining, on a test basis, evidence supporting the amounts and disclosures in the financial statements, assessing the accounting principles used and significant estimates made by management, as well as evaluating the overall financial statement presentation. We believe that our audits provide a reasonable basis for our opinion.
In our opinion, the financial statements referred to above present fairly, in all material respects, the financial position of Stratus Services Group, Inc. as of September 30, 2007 and 2006, and the results of its operations and its cash flows for each of the years in the three-year period ended September 30, 2007 in conformity with accounting principles generally accepted in the United States of America.
The accompanying consolidated financial statements have been prepared assuming that the Company will continue as a going concern. As discussed in Note 1 to the financial statements, the Company has suffered recurring losses from operations and has a net capital deficiency, which raises substantial doubt about its ability to continue as a going concern. Management’s plans regarding those matters also are described in Note 1. The consolidated financial statements do not include any adjustments that might result from the outcome of this uncertainty.
In connection with the audits of the consolidated financial statements, we audited the financial Schedule II. In our opinion, the financial schedule, when considered in relation to the consolidated financial statements taken as a whole, presents fairly, in all material respects, the information stated herein.
Gruber & Company, LLC
Lake Saint Louis, Missouri
January 7, 2008
STRATUS SERVICES GROUP, INC.
| | | September 30, | |
| Assets | | 2007 | | | 2006 | |
| Current assets | | | | | | |
| Cash | | $ | 144,849 | | | $ | 84,881 | |
| Accounts receivable – less allowance for doubtful accounts of $200,000 and $3,039,000 | | | 1,104,650 | | | | 815,463 | |
| Unbilled receivables | | | 176,690 | | | | 126,191 | |
| Due from related party | | | - | | | | 499,264 | |
| Notes receivable (current portion) | | | - | | | | 80,000 | |
| Prepaid insurance | | | 53,351 | | | | 12,244 | |
| Prepaid expenses and other current assets | | | 269,988 | | | | 244,662 | |
| Assets held for sale | | | - | | | | — | |
| | | | 1,749,528 | | | | 1,862,705 | |
| | | | | | | | | |
| Property and equipment, net of accumulated depreciation | | | 186,279 | | | | 145,727 | |
| Intangible assets, net of accumulated amortization | | | 94,444 | | | | - | |
| Goodwill | | | 1,766,336 | | | | — | |
| Other assets | | | 8,820 | | | | 6,350 | |
| | | $ | 3,805,407 | | | $ | 2,014,782 | |
| Liabilities and Stockholders’ Equity (Deficiency) | | | | | | | | |
| Current liabilities | | | | | | | | |
| Loans payable (current portion) | | $ | 130,983 | | | $ | 72,477 | |
| Loans payable - related parties | | | 85,721 | | | | 87,721 | |
| Notes payable – acquisitions (current portion) (including $52,859 to related party) | | | 349,673 | | | | 203,663 | |
| Note payable - related party (current portion) | | | 506,233 | | | | 265,308 | |
| Line of credit | | | 642,570 | | | | 596,950 | |
| Insurance obligation payable | | | 13,154 | | | | 7,348 | |
| Accounts payable and accrued expenses | | | 4,349,523 | | | | 3,736,396 | |
| Accrued payroll and taxes | | | 190,969 | | | | 107,204 | |
| Payroll taxes payable | | | 3,218,455 | | | | 3,823,710 | |
| Series A redemption payable | | | 300,000 | | | | 300,000 | |
| | | | 9,787,281 | | | | 9,200,777 | |
| | | | | | | | | |
| | | | | | | | | |
| Loans payable (net of current portion) | | | 35,013 | | | | — | |
Notes payable – acquisitions (net of current portion) (including $109,664 to related party) | | | 430,241 | | | | 476,017 | |
| Note payable – related party (net of current portion) | | | 110,617 | | | | 351,542 | |
| Notes payable – minority interest investors | | | 675,000 | | | | - | |
| | | | 11,038,152 | | | | 10,028,336 | |
| | | | | | | | | |
| Commitments and contingencies | | | | | | | | |
| | | | | | | | | |
| Minority interest | | | 547,135 | | | | 41,316 | |
| | | | | | | | | |
| Stockholders’ equity (deficiency) | | | | | | | | |
| Preferred stock, $.01 par value, 5,000,000 shares authorized | | | | | | | | |
| | | | | | | | | |
| Series F voting convertible preferred stock, $.01 par value, 6,000 and 6,000 shares issued and outstanding, liquidation preference of $600,000 (including unpaid dividends of $133,000 and $91,000) | | | 733,000 | | | | 691,000 | |
| Common stock, $.04 par value, 100,000,000 shares authorized; 69,568,615 and 64,479,754 shares issued and outstanding | | | 2,782,745 | | | | 2,619,190 | |
| Additional paid-in capital | | | 9,760,516 | | | | 9,407,238 | |
| Accumulated deficit | | | (21,056,141 | ) | | | (20,772,298 | ) |
| Total stockholders’ equity (deficiency) | | | (7,779,880 | ) | | | (8,054,870 | ) |
| | | $ | 3,805,407 | | | $ | 2,014,782 | |
See accompanying summary of accounting policies and notes to consolidated financial statements.
STRATUS SERVICES GROUP, INC.
| | | Years Ended September 30, | |
| | | 2007 | | | 2006 | | | 2005 | |
| | | | | | | | | | |
| Revenues | | $ | 8,209,564 | | | $ | 5,131,081 | | | $ | 4,520,643 | |
| | | | | | | | | | | | | |
| Cost of revenues ($-0-, $479,873 and $491,358 to related parties) | | | 5,717,297 | | | | 3,605,244 | | | | 3,202,716 | |
| | | | | | | | | | | | | |
| Gross profit | | | 2,492,267 | | | | 1,525,837 | | | | 1,317,927 | |
| | | | | | | | | | | | | |
| Selling, general and administrative expenses | | | 2,971,755 | | | | 3,082,139 | | | | 5,278,186 | |
| | | | | | | | | | | | | |
| Operating (loss) from continuing operations | | | (479,488 | ) | | | (1,556,302 | ) | | | (3,960,259 | ) |
| | | | | | | | | | | | | |
| Interest expense | | | (246,342 | ) | | | (481,762 | ) | | | (1,895,283 | ) |
| | | | | | | | | | | | | |
| Other income (expense) (net) | | | — | | | | (398 | ) | | | 16,420 | |
| | | | | | | | | | | | | |
| Gain on change in fair value of warrants | | | - | | | | 2,135 | | | | 5,263,854 | |
| | | | | | | | | | | | | |
| (Loss) from continuing operations before minority interest | | | (725,830 | ) | | | (2,035,531 | ) | | | (575,268 | ) |
| Minority interest in net (income) loss of consolidated subsidiaries | | | 49,048 | | | | (19,811 | ) | | | (58,926 | ) |
| | | | | | | | | | | | | |
| (Loss) from continuing operations | | | (676,782 | ) | | | (2,055,342 | ) | | | (634,194 | ) |
| Discontinued operations — income (loss) from discontinued operations | | | (125,000 | ) | | | (307,044 | ) | | | (1,973,475 | ) |
| Gain on sale of discontinued operations (net) | | | 517,939 | | | | 3,804,047 | | | | 2,239,108 | |
| Net earnings (loss) | | | (283,843 | ) | | | 1,441,661 | | | | (368,561 | ) |
| Dividends on preferred stock | | | (42,000 | ) | | | (42,000 | ) | | | (42,000 | ) |
| Net earnings (loss) attributable to common stockholders | | $ | (325,843 | ) | | $ | 1,399,661 | | | $ | (410,561 | ) |
| | | | | | | | | | | | | |
| Basic: | | | | | | | | | | | | |
| (Loss) from continuing operations | | $ | (.01 | ) | | $ | (.05 | ) | | $ | (.04 | ) |
| Earnings from discontinued operations | | | .01 | | | | .08 | | | | .02 | |
| Net earnings (loss) | | $ | - | | | $ | .03 | | | $ | (.02 | ) |
| | | | | | | | | | | | | |
| Diluted: | | | | | | | | | | | | |
| (Loss) from continuing operations | | $ | (.01 | ) | | $ | (.05 | ) | | $ | (.04 | ) |
| Earnings from discontinued operations | | | .01 | | | | .08 | | | | .02 | |
| Net earnings (loss) | | $ | - | | | $ | .03 | | | $ | (.02 | ) |
| | | | | | | | | | | | | |
| Weighted average shares, outstanding per common share | | | | | | | | | | | | |
| Basic | | | | | | | | | | | | |
| Diluted | | | | | | | | | | | | |
| | | | 66,873,827 | | | | 43,721,219 | | | | 17,115,983 | |
| | | | 66,873,827 | | | | 53,406,997 | | | | 17,115,983 | |
See accompanying summary of accounting policies and notes to consolidated financial statements.
STRATUS SERVICES GROUP, INC.
| | | Years Ended September 30, | |
| | | 2007 | | | 2006 | | | 2005 | |
| Cash flows from (used in) operating activities | | | | | | | | | |
| Net earnings (loss) | | $ | (283,843 | ) | | $ | 1,441,661 | | | $ | (368,561 | ) |
| Adjustments to reconcile net earnings (loss) to net cash used by operating activities | | | | | | | | | | | | |
| Depreciation | | | 81,088 | | | | 111,399 | | | | 326,126 | |
| Amortization | | | 5,556 | | | | 41,902 | | | | 382,842 | |
| Provision for doubtful accounts | | | 125,000 | | | | ¾ | | | | 1,000,000 | |
| Loss on impairment of goodwill | | | ¾ | | | | ¾ | | | | 3,263,272 | |
| Deferred financing costs amortization | | | ¾ | | | | ¾ | | | | 1,748 | |
| (Gain) loss on sales of discontinued operations | | | (517,939 | ) | | | (3,804,047 | ) | | | (2,239,108 | ) |
| Stock compensation | | | - | | | | 100,400 | | | | 42,000 | |
| Common stock and warrants issued for fees | | | - | | | | 13,000 | | | | 261,300 | |
| Imputed interest | | | 35,343 | | | | 41,704 | | | | 73,392 | |
| Accrued interest | | | 50,879 | | | | 40,497 | | | | (26,853 | ) |
| Gain on change in fair value of warrants | | | - | | | | (2,135 | ) | | | (5,263,854 | ) |
| Minority interest | | | (49,048 | ) | | | 19,811 | | | | 58,926 | |
| Dividends on preferred stock | | | - | | | | 163,625 | | | | (715 | ) |
| Intrinsic value of beneficial conversion feature of convertible preferred stock | | | - | | | | 1,674 | | | | ¾ | |
| Changes in operating assets and liabilities | | | | | | | | | | | | |
| Accounts receivable | | | (219,202 | ) | | | 11,104,275 | | | | 1,612,166 | |
| Prepaid insurance | | | (28,107 | ) | | | 443,637 | | | | 1,473,175 | |
| Prepaid expenses and other current assets | | | 8,999 | | | | 181,378 | | | | 54,610 | |
| Other assets | | | (2,470 | ) | | | 27,556 | | | | 91,878 | |
| Insurance obligation payable | | | 5,806 | | | | (106,025 | ) | | | (21,602 | ) |
| Accrued payroll and taxes | | | 83,765 | | | | (177,630 | ) | | | (870,592 | ) |
| Payroll taxes payable | | | (605,255 | ) | | | (785,875 | ) | | | (543,561 | ) |
| Accounts payable and accrued expenses | | | 147,374 | | | | (2,113,242 | ) | | | 3,833,709 | |
| Total adjustments | | | (878,211 | ) | | | 5,301,904 | | | | 3,508,859 | |
| | | | (1,162,054 | ) | | | 6,743,565 | | | | 3,140,298 | |
| Cash flows from (used in) investing activities | | | | | | | | | | | | |
| Purchase of property and equipment | | | (32,000 | ) | | | (36,367 | ) | | | (233,721 | ) |
| Payments for business acquisitions | | | (1,192,643 | ) | | | ¾ | | | | (136,000 | ) |
| Net proceeds from (payments in connection with) sale of discontinued operations (including $499,264 and $750,736 from a related party in 2007 and 2006) (net of $10,000 in costs in 2006) | | | 1,017,203 | | | | 1,329,999 | | | | (322,952 | ) |
| Collection of notes receivable | | | - | | | | 6,609 | | | | 20,343 | |
| | | | (207,440 | ) | | | 1,300,241 | | | | (672,330 | ) |
| Cash flows from (used in) financing activities | | | | | | | | | | | | |
| Proceeds from loans payable | | | 50,000 | | | | ¾ | | | | 125,000 | |
| Payments of loans payable | | | (11,121 | ) | | | (5,973 | ) | | | (115,241 | ) |
| Proceeds from loans payable – related parties | | | 144,500 | | | | ¾ | | | | 665,000 | |
| Payments of loans payable – related parties | | | (146,500 | ) | | | (24,002 | ) | | | (792,852 | ) |
| Payments of note payable – related parties | | | ¾ | | | | (1,515,000 | ) | | | ¾ | |
| Payments of notes payable – acquisitions | | | (11,337 | ) | | | (77,783 | ) | | | (883,675 | ) |
| Proceeds from minority interest investors (net) | | | 1,348,925 | | | | ¾ | | | | ¾ | |
| Proceeds from exercise of warrants | | | 9,375 | | | | ¾ | | | | ¾ | |
| Net proceeds from (repayment of) line of credit | | | 45,620 | | | | (6,362,218 | ) | | | (2,097,381 | ) |
| Cash overdraft | | | ¾ | | | | (14,731 | ) | | | (9,761 | ) |
| Redemption of preferred stock | | | ¾ | | | | ¾ | | | | (34,000 | ) |
| Dividends paid | | | ¾ | | | | ¾ | | | | (20,000 | ) |
| | | | 1,429,462 | | | | (7,999,709 | ) | | | (3,162,910 | ) |
| Net change in cash | | | 59,968 | | | | 44,097 | | | | (694,942 | ) |
| Cash – beginning | | | 84,881 | | | | 40,784 | | | | 735,726 | |
| Cash – ending | | $ | 144,849 | | | $ | 84,881 | | | $ | 40,784 | |
| | | | | | | | | | | | | |
| Supplemental disclosure of cash paid | | | | | | | | | | | | |
| Interest | | $ | 364,984 | | | $ | 421,022 | | | $ | 2,404,231 | |
| | | | | | | | | | | | | |
| | | | | | | | | | | | | |
| Schedule of noncash investing and financing activities | | | | | | | | | | | | |
| Fair value of assets acquired | | $ | 2,163,745 | | | $ | ¾ | | | $ | 358,500 | |
| Less: cash paid | | | (669,000 | ) | | | ¾ | | | | (136,000 | ) |
| Less: common stock and put options issued | | | (400,000 | ) | | | ¾ | | | | (16,500 | ) |
| Liabilities assumed | | $ | 1,094,745 | | | $ | ¾ | | | $ | 206,000 | |
| Sale of discontinued operations: | | | | | | | | | | | | |
| Gain on sale | | $ | 517,939 | | | $ | 3,804,047 | | | $ | 2,239,108 | |
| Net assets sold | | | ¾ | | | | 1,683,783 | | | | 377,265 | |
| Due from related party | | | 499,264 | | | | (499,264 | ) | | | ¾ | |
| Accrued earn-out | | | ¾ | | | | (167,203 | ) | | | ¾ | |
| Cancellation of amounts due from related parties | | | ¾ | | | | (3,541,364 | ) | | | 376,394 | |
| Cancellation of accounts payable-related parties (net) | | | ¾ | | | | ¾ | | | | (3,315,719 | ) |
| Accrued expenses | | | ¾ | | | | 60,000 | | | | ¾ | |
| Net cash received (paid) | | $ | 1,017,203 | | | $ | 1,339,999 | | | $ | (322,952 | ) |
| | | | | | | | | | | | | |
| Assignment of note receivable in exchange for notes payable - acquisitions | | $ | 80,000 | | | $ | ¾ | | | $ | ¾ | |
| Issuance of common stock upon conversion of convertible preferred stock | | $ | - | | | $ | 24,366 | | | $ | ¾ | |
| Issuance of Series F Preferred Stock in exchange for accrued dividends | | $ | - | | | $ | 45,000 | | | $ | ¾ | |
| Issuance of warrants for fees | | $ | - | | | $ | 13,000 | | | $ | ¾ | |
| Accrued interest converted to loan payable | | $ | - | | | $ | ¾ | | | $ | 21,600 | |
| Issuance of common stock in exchange for loans and notes payable | | $ | ¾ | | | $ | 15,000 | | | $ | ¾ | |
| Put option liability converted to loan payable | | $ | ¾ | | | $ | ¾ | | | $ | 18,000 | |
| Cumulative dividends and accretion on preferred stock | | $ | 42,000 | | | $ | 42,000 | | | $ | 42,000 | |
See accompanying summary of accounting policies and notes to consolidated financial statements.
STRATUS SERVICES GROUP, INC.
Consolidated Statement of Stockholders’ Equity (Deficiency)
| | | | | | Common Stock | | | Preferred Stock | |
| | | Total | | | Amount | | | Shares | | | Amount | | | Shares | |
| | | | | | | | | | | | | | | | |
| Balance – September 30, 2004 | | $ | (9,773,210 | ) | | $ | 672,914 | | | | 16,822,854 | | | $ | 730,700 | | | | 6,572 | |
| Net (loss) | | | (368,561 | ) | | | ¾ | | | | ¾ | | | | ¾ | | | | ¾ | |
| Dividends on preferred stock | | | (20,000 | ) | | | ¾ | | | | ¾ | | | | 22,000 | | | | ¾ | |
| Issuance of common stock in connection with acquisition | | | 16,500 | | | | 2,000 | | | | 50,000 | | | | ¾ | | | | ¾ | |
| Exercise of put option | | | ¾ | | | | (200 | ) | | | (5,000 | ) | | | ¾ | | | | ¾ | |
| Issuance of restricted stock | | | 42,000 | | | | 10,000 | | | | 250,000 | | | | ¾ | | | | ¾ | |
| Redemption of Series E Preferred Stock | | | (34,000 | ) | | | ¾ | | | | ¾ | | | | (34,000 | ) | | | (325 | ) |
| Issuance of common stock to Series I holders | | | 217,750 | | | | 82,952 | | | | 2,073,808 | | | | ¾ | | | | ¾ | |
| Issuance of common stock for fees | | | 43,550 | | | | 16,591 | | | | 414,761 | | | | ¾ | | | | ¾ | |
| Balance – September 30, 2005 | | $ | (9,875,971 | ) | | $ | 784,257 | | | | 19,606,423 | | | $ | 718,700 | | | | 6,247 | |
See accompanying summary of accounting policies and notes to consolidated financial statements.
STRATUS SERVICES GROUP, INC.
Consolidated Statement of Stockholders’ Equity (Deficiency)
| | | Additional Paid-In Capital | | | Accumulated Deficit | |
| | | | | | | |
| Balance – September 30, 2004 | | $ | 10,668,574 | | | $ | (21,845,398 | ) |
| Net (loss) | | | ¾ | | | | (368,561 | ) |
| Dividends on preferred stock | | | (42,000 | ) | | | ¾ | |
| Issuance of common stock in connection with acquisition | | | 14,500 | | | | ¾ | |
| Exercise of put options | | | 200 | | | | ¾ | |
| Issuance of restricted stock | | | 32,000 | | | | ¾ | |
| Redemption of Series E Preferred Stock | | | ¾ | | | | ¾ | |
| Issuance of common stock to Series I holders | | | 134,798 | | | | ¾ | |
| Issuance of common stock for fees | | | 26,959 | | | | ¾ | |
| Balance – September 30, 2005 | | $ | 10,835,031 | | | $ | (22,213,959 | ) |
See accompanying summary of accounting policies and notes to consolidated financial statements.
STRATUS SERVICES GROUP, INC.
Consolidated Statement of Stockholders’ Equity (Deficiency)
| | | | | | Common Stock | | | Preferred Stock | |
| | | Total | | | Amount | | | Shares | | | Amount | | | Shares | |
| | | | | | | | | | | | | | | | |
| Net earnings | | $ | 1,441,661 | | | $ | ¾ | | | | ¾ | | | $ | 42,000 | | | | ¾ | |
| Dividends on preferred stock | | | ¾ | | | | ¾ | | | | ¾ | | | | ¾ | | | | ¾ | |
| Conversion of Series I Preferred Stock for Common Stock | | | 26,040 | | | | 153,600 | | | | 3,840,000 | | | | ¾ | | | | ¾ | |
| Conversion of Series F Preferred Stock for Common Stock | | | ¾ | | | | 120,000 | | | | 3,000,000 | | | | (45,000 | ) | | | ¾ | |
| Issuance of warrants for services provided | | | 13,000 | | | | ¾ | | | | ¾ | | | | ¾ | | | | ¾ | |
| Conversion of convertible notes payable for common stock | | | 225,000 | | | | 1,033,333 | | | | 25,833,331 | | | | ¾ | | | | ¾ | |
| Issuance of common stock in exchange for loans and notes payable | | | 15,000 | | | | 40,000 | | | | 1,000,000 | | | | ¾ | | | | ¾ | |
| Issuance of common stock to employees | | | 100,400 | | | | 488,000 | | | | 12,200,000 | | | | ¾ | | | | ¾ | |
| Cancellation of Series E Preferred Stock dividends | | | ¾ | | | | ¾ | | | | ¾ | | | | (24,700 | ) | | | (247 | ) |
| Balance – September 30, 2006 | | $ | (8,054,870 | ) | | $ | 2,619,190 | | | | 65,479,754 | | | $ | 691,000 | | | | 6,000 | |
See accompanying summary of accounting policies and notes to consolidated financial statements.
STRATUS SERVICES GROUP, INC.
Consolidated Statement of Stockholders’ Equity (Deficiency)
| | | Additional Paid-In Capital | | | Accumulated Deficit | |
| | | | | | | |
| Net earnings | | $ | ¾ | | | $ | 1,441,661 | |
| Dividends on preferred stock | | | (42,000 | ) | | | ¾ | |
| Conversion of Series I Preferred Stock for Common Stock | | | (127,560 | ) | | | ¾ | |
| Conversion of Series F Preferred Stock dividends for Common Stock | | | (75,000 | ) | | | ¾ | |
| Issuance of warrants for services provided | | | 13,000 | | | | ¾ | |
| Conversion of convertible notes payable for Common Stock | | | (808,333 | ) | | | ¾ | |
| Issuance of Common Stock in exchange for loans and notes payable | | | (25,000 | ) | | | ¾ | |
| Issuance of common stock to employees | | | (387,600 | ) | | | ¾ | |
| Cancellation of Series E Preferred Stock dividends | | | 24,700 | | | | ¾ | |
| Balance – September 30, 2006 | | $ | 9,407,238 | | | $ | (20,772,298 | ) |
See accompanying summary of accounting policies and notes to consolidated financial statements.
STRATUS SERVICES GROUP, INC.
Consolidated Statement of Stockholders’ Equity (Deficiency)
| | | | | Common Stock | | Preferred Stock | |
| | | Total | | Amount | | Shares | | Amount | | Shares | |
| | | | | | | | | | | | |
| Net (loss) | | $ | (283,843 | ) | $ | - | | | - | | $ | - | | | - | |
| Dividends on preferred stock | | | - | | | - | | | - | | | 42,000 | | | - | |
| Exercise of Warrants | | | 9,375 | | | 750 | | | 18,750 | | | - | | | - | |
| Issuance of common stock in exchange for additional 1% interest in subsidiary | | | 756 | | | 2,805 | | | 70,111 | | | - | | | - | |
| Increase in investment in subsidiary resulting from minority interest contributed capital | | | 294,702 | | | - | | | - | | | - | | | - | |
| Issuance of common stock in connection with acquisition | | | 223,600 | | | 80,000 | | | 2,000,000 | | | - | | | - | |
| Issuance of common stock to employees | | | 30,400 | | | 80,000 | | | 2,000,000 | | | - | | | - | |
| Balance - September 30, 2007 | | $ | (7,779,880 | ) | $ | 2,782,745 | | | 69,568,615 | | $ | 733,000 | | | 6,000 | |
See accompanying summary of accounting policies and notes to consolidated financial statements.
STRATUS SERVICES GROUP, INC.
Consolidated Statement of Stockholders’ Equity (Deficiency)
| | | Additional Paid-In Capital | | Accumulated Deficit | |
| | | | | | |
| Net (loss) | | $ | - | | $ | (283,843 | ) |
| Dividends on preferred stock | | | (42,000 | ) | | - | |
| Exercise of warrants | | | 8,625 | | | - | |
| Issuance of common stock in exchange for additional 1% interest in subsidiary | | | (2,049 | ) | | - | |
| Increase on investment in subsidiary resulting from minority interest contributed capital | | | 294,702 | | | - | |
| Issuance of common stock in connection with acquisition | | | 143,600 | | | - | |
| Issuance of common stock to employees | | | (49,600 | ) | | - | |
| Balance - September 30, 2007 | | $ | 9,760,517 | | $ | (21,056,141 | ) |
See accompanying summary of accounting policies and notes to consolidated financial statements.
STRATUS SERVICES GROUP, INC.
| Note 1 - | Description of Business and Segment Information |
Description of Business
Until December 2005, Stratus Services Group, Inc. (“Stratus”) , together with its 51%-owned joint venture, Stratus Technology Services, LLC (“STS”), was a national provider of staffing and productivity consulting services. In December 2005, Stratus completed a series of asset sales transactions pursuant to which it sold substantially all of the asset it used to conduct its staffing services (see Note 4). In August 2007, Stratus’ newly formed subsidiary, Transworld Assets, LLC (“Transworld”) (see Note 2) acquired substantially all of the assets used by Green-Tech Assets, Inc. and its affiliate, CC Laurel, Inc. in their technology asset disposal business (see Notes 2 and 5). Following the transaction, Transworld Assets, LLC changed its named to Green-Tech Assets, LLC (“GTA”). Stratus, STS and GTA are herein referred to as the “Company”.
Segment Information
The operating segments reported below are the segments for which operating results are evaluated regularly by management in deciding how to allocate resources and in assessing performance. The Company’s reportable segments are strategic divisions that offer different services and are managed separately as each division requires different resources and marketing strategies. The accounting policies of the business segments are the same as those described in the Summary of Significant Accounting Policies in Note 3 of Notes to Consolidated Financial Statements. Intersegment sales are not significant.
Prior to the acquisition of the electronic recycling business in August 2007, the Company operated as one business segment.
Net revenues and operating income (loss) by segments for the year ended September 30, 2007 is as follows:
| Revenues: | | | |
| Information technology services | | $ | 7,614,074 | |
| Technology asset disposal business | | | 595,490 | |
| Consolidated revenues | | $ | 8,209,564 | |
| | | | | |
| Operating (loss): | | | | |
| Information technology services | | $ | 59,261 | |
| Technology asset disposal business | | | 1,509 | |
| Corporate expenses | | | (540,258 | ) |
| Consolidated operating (loss) | | $ | (479,488 | ) |
Management reviews the Company’s assets on a consolidated basis because it is not meaningful to allocate assets to the various segments. Management evaluates segment performance based on revenues and operating income. The company does not allocate income taxes or charges determined to be non-recurring in nature. Unallocated amounts of operating (loss) consist of corporate expenses.
The Company primarily operates in the United States.
| Note 2 - | Newly-Formed Subsidiary |
In July 2007, Stratus, in exchange for 5,000,000 shares of its common stock received a 51% interest in an entity created to acquire substantially all of the assets of Green-Tech Assets, Inc. and its affiliate, CC Laurel, Inc. Following the acquisition, Transworld changed its name to Green-Tech Assets, LLC. Minority interest investors in GTA, through a private offering, purchased units at the price of $100,000 which was comprised of a pro-rata share of the minority interest and a $50,000 note bearing interest at 6% per year and due July 31, 2012. In addition, each unit owner received 50,000 shares of Stratus’ common stock which was held by GTA. As of September 30, 2007, 13.5 unites were sold, representing $675,000 in contributed capital and $675,000 in notes payable.
| Note 3 - | Significant Accounting Policies |
Principles of Consolidation
The consolidated financial statements include the accounts of Stratus Services Group, Inc. and its 51%-owned joint ventures, STS and GTA. The other venturers’ share of earnings (loss) is reflected as a minority interest.
Basis of Presentation
The accompanying consolidated financial statements have been prepared on a going concern basis, which contemplates the realization of assets and the satisfaction of liabilities in the normal course of business. As shown in the financial statements, the Company incurred significant losses from continuing operations of $677,000, $2,055,000 and $634,000 during the years ended September 30, 2007, 2006 and 2005, respectively, and has a working capital deficit of $8,038,000 at September 30, 2007. These factors, among others, indicate that the Company may be unable to continue as a going concern. The financial statements do not include any adjustments relating to the recoverability and classification of liabilities that might be necessary should the Company be unable to continue as a going concern.
Management recognizes that the Company’s continuation as a going concern is dependent upon its ability to generate sufficient cash flow to allow it to satisfy its obligations on a timely basis, to fund the operation and capital needs, and to obtain additional financing as may be necessary.
Management of the Company has taken steps to revise and reduce its operating requirements, which it believes will be sufficient to assure continued operations and implementation of the Company’s plans. The steps included closing branches that were not profitable, consolidating branches and reductions in staffing and other selling, general and administrative expense, and most significantly, the asset sales transactions that were completed in December 2005 (see Note 4).
The Company continues to pursue other sources of equity or long-term debt financings. The Company also continues to negotiate payment plans and other accommodations with its creditors.
Revenue Recognition
The Company recognizes revenue from staffing services as the services are performed by its workforce. The Company’s customers are generally billed bi-weekly. At balance sheet dates, there are accruals for unbilled receivables and related compensation costs. The Company also provides permanent placement services. Fees for placements are recognized at the time the candidate commences employment. The Company guarantee’s its permanent placements for 60-90 days. In the event a candidate is not retained for the guarantee period, the Company will provide a suitable replacement candidate. In the event a replacement candidate cannot be located, the Company will provide a refund to the client. An allowance for refunds, based on the Company’s historical experience, is recorded in the financial statements. Revenues are recorded gross as a component of revenues. The Company recognizes revenues from its technology asset disposal business when the services are rendered or when the product has been delivered so long as there is an agreed upon price and collection of the revenue is reasonably assured.
Use of Estimates
The preparation of financial statements in conformity with accounting principles generally accepted in the United States of America requires management to make estimates and assumptions that affect the reported amounts of assets and liabilities
and disclosure of contingent assets and liabilities at the date of the financial statements and the reported amounts of revenues and expenses during the reporting period. Actual results could differ from those estimates.
Concentration of Cash
The Company maintains its cash in bank deposit accounts, which, at times may exceed federally insured limits. The Company has not experienced any losses in such accounts.
Earnings/Loss Per Share
The Company utilizes Statement of Financial Accounting Standards (“SFAS”) No. 128 “Earnings Per Share”, whereby basic earnings per share (“EPS”) excludes dilution and is computed by dividing earnings available to common stockholders by the weighted-average number of common shares outstanding during the period. Diluted EPS assumes conversion of dilutive options and warrants, and the issuance of common stock for all other potentially dilutive equivalent shares outstanding.
There were no dilutive shares for the year ended September 30, 2007, 2006 and 2005 respectively. Outstanding stock options and warrants not included in the computation of earnings per share for the year ended September 30, 2007, 2006 and 2005 totaled 17,213,653, 19,206,475 and 17,099,952 respectively. These options and warrants were excluded because their inclusion would have an anti-dilutive effect on earnings per share.
Property and Equipment
Property and equipment is stated at cost, less accumulated depreciation. Depreciation is provided over the estimated useful lives of the assets as follows:
| | Method | Estimated Useful Life |
| Furniture and fixtures | Straight-line | 3-5 years |
| Office equipment | Straight-line | 3-5 years |
| Computer equipment | Straight-line | 5 years |
| Computer software | Straight-line | 3 years |
| Machinery and equipment | Straight-line | 3 years |
| Truck | Straight-line | 2 years |
Fair Values of Financial Instruments
Fair values of cash, accounts receivable, accounts payable and short-term borrowings approximate cost due to the short period of time to maturity. Fair values of long-term debt, which have been determined based on borrowing rates currently available to the Company for loans with similar terms or maturity, approximate the carrying amounts in the financial statements.
Stock – Based Compensation
Effective October 1, 2005, the Company adopted SFAS No. 123(R) (revised 2004), Share-Based Payment, using the modified prospective application transition method. All outstanding stock options at October 1, 2005, were fully-vested. Accordingly, the adoption of SFAS No. 123(R) did not have a significant impact on our financial position, results of operations or cash flows. There were no options granted during the years ended September 30, 2007 and 2006.
For SFAS No. 148 purposes, the fair value of each option granted was estimated as of the date of grant using the Black-Scholes option pricing model with the following weighted average assumptions used for the year ended September 30, 2005:
| Risk-free interest rate | | | 4 | % |
| Dividend yield | | | 0 | % |
| Expected life | | 4-7 years | |
| Volatility | | | 100 | % |
If the Company had elected to recognize the compensation costs of its stock option plans based on the fair value of the awards under those plans in accordance with SFAS No. 148, net loss and loss per share for the year ended September 30, 2005 would have been adjusted to the proforma amounts below:
| | | | |
Net (loss) attributable to common stockholders, as reported | | $ | (410,561 | ) |
| | | | | |
| Deduct: | | | | |
Total stock-based employee compensationexpense determined under fair value basedmethod for all awards, net of related tax effects | | | (613,097 | ) |
| | | | | |
Pro forma net (loss) attributable to commonstockholders | | $ | (1,023,658 | ) |
| | | | | |
(Loss) from continuing operations per common share attributable to common stockholders: | | | | |
| Basic – as reported | | $ | (.02 | ) |
| Basic – pro forma | | $ | (.06 | ) |
| | | | | |
| Diluted – as reported | | $ | (.02 | ) |
| Basic – pro forma | | $ | (.06 | ) |
During the year ended September 30, 2006, the Company issued an aggregate of 12,200,000 shares of its common stock to five employees, a director, three former directors, and a consultant. In connection therewith, the value of the shares was based on the market price at date of issuance and accordingly, $100,400 was charged to operations.
Income Taxes
The Company recognizes deferred tax assets and liabilities based on differences between the financial reporting and tax bases of assets and liabilities using the enacted tax rates and laws that are expected to be in effect when the differences are expected
to be recovered. The Company provides a valuation allowance for deferred tax assets for which it does not consider realization of such assets to be more likely than not.
Advertising Costs
Advertising costs are expensed as incurred. The expenses for the years ended September 30, 2007, 2006 and 2005 were $58,000, $81,000 and $241,000, respectively, and are included in selling, general and administrative expenses.
Goodwill and Other Intangible Assets
The Company follows Financial Accounting Standards No. 142 (SFAS No. 142), “Goodwill and Other Intangible Assets”. Under SFAS No. 142, goodwill and indefinite lived intangible assets are no longer amortized but are reviewed at least annually for impairment. SFAS No. 142 prescribes a two-phase process for impairment testing of goodwill. The first phase screens for impairment; while the second phase (if necessary), measures the impairment.
Impairment of Long-Lived Assets
The Company evaluates the recoverability of its long-lived assets in accordance with Statement of Financial Accounting Standards No. 144 “Accounting for the Impairment or Disposal of Long-Lived Assets” (“SFAS No. 144”). SFAS No. 144 requires recognition of impairment of long-lived assets in the event the net book value of such assets exceeds the future undiscounted cash flows attributable to such assets.
New Accounting Standards
In July 2006, the FASB issued FASB Interpretation No. 48 (FIN 48), “Accounting for Uncertainty in Income Taxes – an interpretation of FASB Statement No. 109”. FIN 48 provides guidance for the recognition, measurement, classification and disclosure of the financial statement effects of a position taken or expected to be taken in a tax return (“tax position”). The financial statement effects of a tax position must be recognized when there is a likelihood of more than 50 percent that based on the technical merits, the position will be sustained upon examination and resolution of the related appeals or litigation processes, if any. A tax position that meets the recognition threshold must be measured initially and subsequently as the largest amount of tax benefit that is greater than 50 percent likely of being realized upon ultimate settlement with a taxing authority. The interpretation is effective for fiscal years beginning after December 15, 2006. The Company does not expect its adoption of FIN 48 to have a material impact on its consolidated financial portion, results of operations or cash flows.
In September 2006, the FASB issued SFAS No. 157, “Fair Value Measurements”. This Statement defines fair value, establishes a framework for measuring fair value in generally accepted accounting principles (GAAP), and expands disclosures about fair value measurements. The Statement applies under other accounting pronouncements that require or permit fair value measurements. SFAS No. 157 is effective for fiscal years beginning after November 15, 2007, or the Company’s fiscal year ending September 30, 2009. The Company is currently assessing the impact the adoption of this pronouncement will have on the financial statements.
In February 2007, the FASB issued SFAS No. 159, “The Fair Value Option for Financial Assets and Financial Liabilities” and is effective for fiscal years beginning after November 15, 2007. This Statement permits entities to choose to measure many financial instruments and certain other items at fair value. The objective is to improve financial reporting by providing entities with the opportunity to mitigate volatility in reported earnings caused by measuring related assets and liabilities differently without having to apply complex hedge accounting provisions. The Company is currently assessing the impact the adoption of this pronouncement will have on the financial statements.
In December 2007, the FASB issued SFAS No. 160 “Noncontrolling Interests in Consolidated Financial Statements-an amendment of ARB No. 51” and is effective for fiscal years beginning after December 5, 2008. This Statement establishes accounting and reporting standards for the noncontrolling interest in a subsidiary and for the deconsolidation of a subsidiary. The Company is currently assessing the impact the adoption of this pronouncement will have on the Company’s financial statements.
In December 2007, the FASB issued SFAS No. 141 (Revised) “Business Combinations”. SFAS 141 (Revised) is effective for fiscal years beginning after December 13, 2008. This Statement establishes principles and requirements for how the acquirer of a business recognizes and measures in its financial statements the identifiable assets acquired, the liabilities assumed, and any noncontrolling interest in the acquiree. The Statement also provides guidance for recognizing and measuring the goodwill acquired in the business combination and determines what information to disclose to enable users of the financial statements to evaluate the nature and financial effects of the business combination. The Company is currently assessing the impact the adoption of this pronouncement will have on the Company’s financial statements.
On September 13, 2006 the Securities and Exchange Commission (“SEC”) issued Staff Accounting Bulletin No. 108 (“SAB 108”) which provides interpretive guidance on how the effects of the carryover or reversal of prior year misstatements should
be considered in quantifying a current year misstatement. SAB 108 is effective for fiscal years ending after November 15, 2006. The adoption of this pronouncement had no material impact on the Company’s financial statements.
Reclassifications
Certain prior year financial statement amounts have been reclassified to be consistent with the presentation for the current year.
| Note 4 - | Discontinued Operations |
| (a) | Effective as of June 5, 2005 (the “Effective Date”), the Company sold substantially all of the assets, excluding accounts receivable of its six Northern California offices to ALS, LLC (“ALS”) a related party (see Note 16). The son of the Company’s Chief Executive Officer is a 50% member in ALS. |
The purchase price was $3,315,719, which represented the balance due by the Company to ALS as of the close of business on May 3, 2005, less $600,000. Accordingly, on the Effective Date, $3,315,719 due to ALS was deemed paid and cancelled. In addition, all amounts due to the Company from ALS as of the Effective Date were deemed paid in full. Such amounts aggregating $376,394 were comprised of a note receivable ($122,849), accounts receivable ($50,000) and other receivables ($203,545).
In connection with the transaction, the Company and ALS entered into a non-compete and non-solicitation agreement pursuant to which the Company agreed not to compete with ALS with the customers of and in the geographic area of the Northern California offices, and ALS agreed not to compete with us with respect to certain customers and accounts, including, accounts serviced by our remaining offices, for a period of two years.
The sale resulted in a gain of $2,239,108, computed as follows:
| Sales price - cancellation of accounts payable - related parties | | $ | 3,315,719 | |
| | | | |
| Less costs of sale: | | | | |
| Write-off of amounts due from ALS | | | (376,394 | ) |
| Other costs (including $75,000 to a related party) (see Note 17) | | | (322,952 | ) |
| | | | |
| Balance | | | 2,616,373 | |
| Net assets sold | | | 377,265 | |
| Gain | | $ | 2,239,108 | |
| (b) | In December 2005, the Company completed the following series of transactions pursuant to which we sold substantially all of our assets used to conduct its staffing services business, other than the IT staffing solutions business that is conducted through the Company’s 50% owned joint venture, STS. |
| (i) | On December 2, 2005, the Company completed the sale, effective as of November 21, 2005, of substantially all of the tangible and intangible assets, excluding accounts receivable, of several of its offices located in the Western half of the United States (the “ALS Purchased Assets”) to ALS, a related party (see Note 17). The offices sold were the following: Chino, California; Colton, California; Los Nietos, California; Ontario, California; Santa Fe Springs, California and the Phoenix, Arizona branches and the Dallas Morning News Account (the “Western Offices”). Pursuant to the terms of an Asset Purchase Agreement between the Company and ALS dated December 2, 2005 (the “ALS Asset Purchase Agreement”), the purchase price for the ALS Purchased Assets was paid or is payable as follows: |
| • | $250,000 was paid over the 60 days following December 2, 2005, at a rate no faster than $125,000 per 30 days; |
| • | $1,000,000 payable by ALS is being paid directly to certain taxing authorities to reduce the Company’s tax obligations; and |
| • | $3,537,000 was paid by means of the cancellation of all net indebtedness owed by the Company to ALS outstanding as of the close of business on December 2, 2005. |
| In addition to the foregoing amounts, ALS also assumed the Company’s obligation to pay $798,626 due under a certain promissory note issued by the Company to Provisional Employment Solutions, Inc. As a result of the sale of the ALS Purchased Assets to ALS, all sums due and owing to ALS by Stratus were deemed paid in full and no further obligations remain. |
| (ii) | On December 5, 2005, we completed the sale, effective as of November 28, 2005 (the “AI Effective Date”), of substantially all of the tangible and intangible assets, excluding accounts receivable and other certain items, as described below, of three of our California offices (the “AI Purchased Assets”) to Accountabilities, Inc. (“AI”) The offices sold were the following: Culver City, California; Lawndale, California and Orange, California (the “Other California Offices”). Pursuant to the terms of an Asset Purchase Agreement between the Company and AI dated December 5, 2005 (the “AI Asset Purchase Agreement”), AI has agreed to pay to the Company earnout amount equal to two percent of the sales of the Other California Offices for the first twelve month period after the AI Effective Date; one percent of the sales of the Other California Offices for the second twelve month period after the AI Effective Date; and one percent of the sales of the Other California Offices for the third twelve month period from the AI Effective Date. In addition, a Demand Subordinated Promissory Note between the Company and AI dated September 15, 2005 which had an outstanding principal balance of $125,000 at the time of closing was deemed paid and marked canceled. Certain assets held by the Other California Offices were excluded from the sale, including cash and cash equivalents, accounts receivable, and the Company’s rights to receive payments from any source. |
| (iii) | On December 7, 2005, the Company completed the sale, effective as of November 28, 2005 (the “SOP Effective Date”), of substantially all of the tangible and intangible assets, excluding accounts receivable and other assets as described below, of several of our Northeastern offices (the “SOP Purchased Assets”) to Source One Personnel, Inc. (“SOP”). The offices sold were the following: Cherry Hill, New Jersey; New Brunswick, New Jersey; Mount Royal/Paulsboro, New Jersey (soon to be Woodbury Heights, New Jersey); Pennsauken, New Jersey; Norristown, Pennsylvania; Fairless Hills, Pennsylvania; New Castle Delaware and the former Freehold, New Jersey profit center (the “NJ/PA/DE Offices”). The assets of Deer Park, New York, Leominster, Massachusetts, Lowell, Massachusetts and Athol, Massachusetts (the “Earn Out Offices”) were also purchased (collectively the “NJ/PA/DE Offices” and the “Earn Out Offices” shall be referred to as the “Purchased Offices”). In addition to the foregoing, the SOP Purchased Assets also included substantially all of the tangible and intangible assets, excluding accounts receivable and other assets as described below, used by the Company in the operation of its business at certain facilities of certain customers including the following: the Setco facility in Cranbury New Jersey, the Record facility in Hackensack, New Jersey, the UPS-MI (formerly RMX) facility in Long Island, New York, the UPS-MI (formerly RMX) facility in the State of Connecticut, the UPS-MI (formerly RMX) facility in the State of Ohio, the APX facility in Clifton, New Jersey (the “Earn Out On-Site Business”) and the Burlington Coat Factory in Burlington, New Jersey, the Burlington Coat Factory facility in Edgewater Park, New Jersey and the UPS-MI (formerly RMX) facility in Paulsboro, New Jersey (the foregoing business and the “Earn-Out On-Site Businesses” shall be referred to herein collectively as the “On-Site Businesses”). Pursuant to the SOP Asset Purchase Agreement between the Company and SOP dated December 7, 2005 (the “SOP Asset Purchase Agreement”), the purchase price for the SOP Purchased Assets was paid or is payable as follows (the “SOP Purchase Price”): |
| · | An aggregate of $974,031 of indebtedness owed by the Company to SOP (i) under certain promissory notes previously issued by the Company to SOP and (ii) in connection with a put right previously exercised by SOP with respect to 400,000 shares of our common stock was cancelled. |
| · | SOP is required to make the following earn out payments to the Company during the three year period commencing on the SOP Effective Date (the “Earn Out Period”): |
| · | Two percent of sales (excluding taxes on sales) from the Earn Out Offices and the Earn Out On-Site Businesses for the initial twelve months of the Earn Out Period. |
| · | One percent of sales (excluding taxes on sales) from the Earn Out Offices and the Earn Out On-Site Businesses for the second twelve months of the Earn Out Period. |
| · | One percent of sales (excluding taxes on sales) from the Earn Out Offices and the Earn Out On-Site Businesses for the third twelve months of the Earn Out Period. |
In June 2007, the Company agreed to accept a $90,000 lump sum payment as payment in full of any remaining SOP obligation under the SOP Asset Purchase Agreement.
Certain assets held by the Purchased Offices were excluded from the sale, including cash and cash equivalents, accounts receivable, our rights to receive payments from any source.
| (iv) | On December 7, 2005 (the “Closing Date”), the Company completed the sale of substantially all of the tangible and intangible assets, excluding cash and cash equivalents, of two of its California branch offices (the “TES Purchased Assets”) to Tri-State Employment Service, Inc. (“TES”). The offices sold were the following: Bellflower, California and West Covina, California (the “California Branch Offices”). Pursuant to the terms of an Asset Purchase Agreement between the Company and TES dated December 7, 2005 (the “TES Asset Purchase Agreement”), TES has agreed to pay to the Company an earnout amount as follows: |
· two percent of sales of the California Branch Offices to existing clients for the first twelve month period after the Closing Date;
| · | one percent of sales of the California Branch Offices to existing clients for the second twelve month period after the Closing Date; and |
| · | one percent of sales of the California Branch Offices to existing clients for the third twelve month period after the Closing Date. |
For purposes of calculating the amount owed by TES to us, in no event shall the aggregate annual sales to such clients exceed $25,000,000.
The consolidated financial statements for all periods presented have been restated to reflect discontinued operations of the aforementioned asset sales. The operating results of discontinued operations are summarized as follows:
| | | Year Ended | |
| | | September 30, | |
| | | 2007 | | | 2006 | | | 2005 | |
| | | | | | | | | | |
| Revenues | | $ | — | | | $ | 18,265,587 | | | $ | 118,012,289 | |
| Cost of revenues | | | — | | | | 16,218,630 | | | | 102,261,055 | |
| Gross profit | | | — | | | | 2,046,957 | | | | 15,751,234 | |
| Selling, general and administrative expenses | | | — | | | | 1,950,622 | | | | 12,807,131 | |
| Other charges | | | 125,000 | | | | — | | | | 4,002,391 | |
| Operating income (loss) | | | — | | | | 96,335 | | | | (1,058,288 | ) |
| Interest expense | | | — | | | | (205,056 | ) | | | (912,078 | ) |
| Other income (expense) | | | — | | | | (198,323 | ) | | | (3,109 | ) |
| Net income (loss) | | $ | (125,000 | ) | | $ | (307,044 | ) | | | (1,973,475 | ) |
The gain (loss) on sale of discontinued operations is summarized as follows:
| | | Year Ended September 30, | |
| | | 2007 | | | 2006 | |
| Sold to: | | | | | | |
| ALS | | $ | — | | | $ | 4,340,459 | |
| AI | | | 176,298 | | | | (10,013 | ) |
| SOP | | | 183,224 | | | | (190,879 | ) |
| TES | | | 158,417 | | | | (275,520 | ) |
| | | | 517,939 | | | | 3,864,047 | |
| | | | | | | | | |
| Other costs of sales | | $ | — | | | | (60,000 | ) |
| Gain on sale of discontinued operations | | $ | 517,939 | | | $ | 3,804,047 | |
The above gain is comprised of earnout payments in the year ended September 30, 2007 (including a $90,000 lump sum payment from SOP) and includes earnout payments of $721,466 in the year ended September 30, 2006.
| (a) | Effective as of August 2, 2007, the Company’s newly formed subsidiary, Transworld (see Note 2), purchased substantially all of the assets used by Green-Tech Assets, Inc. and its affiliate, CC Laurel, Inc. (the “Seller”) in their technology asset disposal business located in Providence, Rhode Island. The purpose of the acquisition was to generate future cash flow for the Company and provide cross-selling opportunities between the Company’s subsidiaries. |
The purchase price was comprised of $600,000 in cash, a promissory note in the principal amount of $166,828 bearing interest at 5% per year payable in equal installments of $5,000 over 36 months, and 2,000,000 shares of Stratus’ common stock held by Transworld. Transworld guaranteed the Seller that the market price of Stratus’ common stock would be $.20 per share on the third anniversary date of the transaction. Additionally, Transworld assumed approximately $817,000 of specified liabilities. The aggregate cost of the acquisition, including finders’ fees and other costs aggregated $2,163,745, which was allocated as follows:
| Accounts receivable | | $ | 245,484 | |
| Property and equipment | | | 35,000 | |
| Other assets | | | 16,925 | |
| Intangible assets | | | 100,000 | |
| Goodwill | | | 1,766,336 | |
| Total | | $ | 2,163,745 | |
The intangible assets represent a covenant not to compete which is being amortized over three years.
The unaudited proforma consolidated results of operations presented below assume that the acquisition had occurred at the beginning of fiscal 2006. This information is presented for informational purposes only and includes certain adjustments such as amortization of intangible assets resulting from the acquisition and interest expense related to the acquisition debt.
| | | Unaudited Year Ending September 30, | |
| | | 2007 | | | 2006 | |
| Revenues | | $ | 10,367,461 | | | $ | 6,274,662 | |
| | | | | | | | | |
| Net (loss) from continuing operations attributable to common stockholders | | | (755,710 | ) | | | (2,261,007 | ) |
| | | | | | | | | |
| Net (loss) per share attributable to common stockholders basic and diluted | | $ | (.01 | ) | | $ | (.05 | ) |
| (b) | Effective as of March 7, 2005, the Company purchased substantially all of the tangible and intangible assets excluding accounts receivable, of Team One Personnel Solutions, LLC (“Team One”), which was comprised of three branch offices in Northern California. These offices provide temporary light industrial and clerical staffing and had strengthened the Company’s presence in the Northern California region. The purchase price was $242, 500 of which $20,000 was paid in cash. The balance was comprised of a promissory note for $160,000, payable $7,091 per month, including interest at 6% a year, over 24 months, 50,000 shares of the Company’s Common Stock, and a net liability for unpaid workers’ compensation premium of $46,000. In addition, there was $116,000 of costs to a related party (see Note 17) in connection with the acquisition. |
The aggregate cost of $358,500 was allocated $338,500 to intangible assets and $20,000 to property and equipment.
These branches were included in the branches sold June 5, 2005 (see Note 4).
On January 3, 2006, the Company’s consolidated 51% owned joint venture, STS (see Notes 1 and 16), entered into a factoring and security agreement (the “Factoring Agreement”) with Action Capital Corporation (“Action”). The Factoring Agreement provides for the sale of up to $1,500,000 of acceptable accounts receivable of STS to Action. Action reserves and withholds an amount in a reserve account equal to 10% of the face amount of accounts receivable purchased under the Factoring Agreement. Action has full recourse against STS including, without limitation, the right to charge-back or sell back any accounts receivable, if not paid within 90 days of the date of purchase. The Factoring Agreement provides for STS to pay interest of prime plus 1% plus a monthly fee of .6% on the daily average of unpaid advances.
The prime rate at September 30, 2007 was 7.75%.
| Note 7 - | Property and Equipment |
Property and equipment consist of the following as of September 30:
| | | 2007 | | | 2006 | |
| | | | | | | |
| Furniture and fixtures | | $ | 143,912 | | | $ | 138,796 | |
| Office equipment | | | 13,230 | | | | 13,230 | |
| Computer equipment | | | 150,418 | | | | 168,592 | |
| Computer software | | | 99,142 | | | | 27,221 | |
| Machinery and equipment | | | 9,000 | | | | - | |
| Truck | | | 8,000 | | | | - | |
| | | | 423,702 | | | | 347,839 | |
| Accumulated depreciation | | | (237,423 | ) | | | (202,112 | ) |
| Net property and equipment | | $ | 186,279 | | | $ | 145,727 | |
| Note 8 - | Goodwill and Other Intangible Assets |
Intangible assets with definite lives are amortized over their estimated useful lives.
Intangible assets consist of the following as of September 30:
| | | 2007 | | | 2006 | |
| | | | | | | |
| Covenant-not-to-compete | | $ | 100,000 | | | $ | - | |
| Accumulated amortization | | | (5,556 | ) | | | - | |
| | | $ | 94,444 | | | $ | - | |
Covenant not to compete is being amortized over three years.
Estimated amortization expense related to intangible assets with definite lives is as follows:
For the Years Ending September 30, | |
| 2008 | | $ | 33,333 | |
| 2009 | | | 33,333 | |
| 2010 | | | 27,778 | |
Amortization expense of amortizable intangible assets was $5,556, $-0- and $-0-, for the years ending September 30, 2007, 2006 and 2005, respectively.
The net carrying amount of goodwill at September 30, 2007 is comprised of goodwill recorded during the year ended September 30, 2007 (See Note 5).
Loans payable consist of the following as of September 30:
| | | 2007 | | | 2006 | |
| Promissory note (i) | | $ | 53,450 | | | $ | 53,450 | |
| Promissory note (ii) | | | 10,656 | | | | 19,027 | |
| Promissory note (iii) | | | 51,890 | | | | - | |
| Promissory note (iv) | | | 50,000 | | | | - | |
| | | $ | 165,996 | | | $ | 72,477 | |
| (i) | Note is payable $1,500 per week, including interest at 5% per year. No payments have been made since September 2005. |
| (ii) | In May 2006, the Company issued 500,000 shares of its common stock to the note holder in payment of $7,500 of accrued interest due on the promissory note. The Company also agreed to pay the remaining portion of the promissory note and accrued interest at the rate of $2,221 per month including interest at 12% per year. |
| (iii) | In December 2006, the Company financed the cost of certain equipment, software and services with a note in the amount of $52,729. The note is payable in 6 monthly payments of $50 followed by 42 monthly payments of $1,706 and includes interest at 9.64% per year. |
| (iv) | In April 2007, the Company borrowed $50,000 under a note that is due on demand with interest at 12% per year. |
| The maturities on loans payable are as follows: |
| Year Ending September 30, | |
| 2008 | | $ | 130,983 | |
| 2009 | | | 18,577 | |
| 2010 | | | 16,436 | |
| | | $ | 165,996 | |
| Note 10 - | Notes Payable – Acquisitions |
The Company is obligated under three notes payable in connection with acquisitions made in December 2002, March 2005, and August 2007 (see Note 5). The note payable in connection with the December 2002 acquisition has a balance of $485,987 (net of imputed interest) at September 30, 2007 and is payable $10,000 per month, including imputed interest of 11% per year. The note is secured by all of the assets of Stratus Services Group, Inc. The note payable in connection with the March 2005 acquisition has a balance of $131,404 at September 30, 2007, and is payable $3,856 per month including interest at 6% per year. In June 2006, the Company issued 500,000 shares of its common stock in exchange for a $7,500 reduction of the balance due on the note. The note payable in connection with the August 2007 acquisition has a balance of $162,523 at September 30, 2007, and is payable $5,000 per month including interest at 5% per year.
The maturities on notes payable acquisitions are as follows:
| Year ending September 30 | | | |
| 2008 | | | 349,673 | |
| 2009 | | | 162,801 | |
| 2010 | | | 167,204 | |
| 2011 | | | 100,236 | |
| | | $ | 779,914 | |
| Note 11 - | Accounts Payable and Accrued Expenses |
Accounts payable consist of the following as of September 30:
| | | 2007 | | | 2006 | |
| Accounts payable | | $ | 3,600,815 | | | $ | 3,078,061 | |
| Accrued compensation | | | 66,929 | | | | 28,757 | |
| Workers’ compensation claims reserve | | | 258,712 | | | | 313,712 | |
| Accrued interest | | | 87,567 | | | | 36,688 | |
| Contingent portion of acquisition purchase price | | | 45,000 | | | | 45,000 | |
| Accrued other | | | 290,500 | | | | 234,178 | |
| | | $ | 4,349,523 | | | $ | 3,736,396 | |
| Note 12 - | Payroll Tax Liabilities |
During fiscal 2003, the Company was notified by both the New Jersey Department of Labor and the California Employment Development Department (the “EDD”) that, if certain payroll delinquencies were not cured, judgment would be entered against the Company. As of September 30, 2007, there was still an aggregate of $3.1 million in delinquent payroll taxes outstanding, which are included in “Payroll taxes payable” on the balance sheet. Judgment has not been entered against the Company in California. While judgment has been entered against the Company in New Jersey, no actions have been taken to enforce same.
On January 7, 2005, the Company entered into a payment plan agreement (the “Plan”) with the EDD with regard to the Company’s past due and unpaid unemployment taxes.
The Company is to continue to pay $12,500 per week to be first applied to its unpaid employment tax liability (which was fully paid as of September 30, 2007), then to interest and then to penalties. The weekly payment of $12,500 is to increase for a three month period following any quarter in which the Company’s reported income is above $200,000, based on a percentage increase tied to the amount in excess of $200,000. The Company believes that consistent with the parties’ intentions when entering into the Plan, the gain on sale of discontinued operations would be excluded from reported income.
In August 2007, after the unpaid employment tax liability was paid in full, the Company reduced its payments to $1,000 per week.
Deferred tax attributes resulting from differences between financial accounting amounts and tax bases of assets and liabilities follow:
| | | 2007 | | | 2006 | |
| Current assets and liabilities | | | | | | |
| Allowance for doubtful accounts | | $ | 80,000 | | | $ | 30,000 | |
| Valuation allowance | | | (80,000 | ) | | | (30,000 | ) |
| Net current deferred tax asset | | $ | ¾ | | | $ | ¾ | |
| | | | | | | | | |
| Non-current assets and liabilities | | | | | | | | |
| Net operating loss carry forward | | $ | 9,259,000 | | | $ | 9,212,000 | |
| Intangibles | | | (8,000 | ) | | | ¾ | |
| Valuation allowance | | | (9,251,000 | ) | | | (9,212,000 | ) |
| Net non-current deferred tax asset | | $ | ¾ | | | $ | ¾ | |
The change in valuation allowance was an increase of $89,000 for the year ended September 30, 2007, a decrease of $954,000 for the year ended September 30, 2006 and an increase of $1,014,000 for the year ended September 30, 2005.
| | | 2007 | | | 2006 | | | 2005 | |
| Income taxes (benefit) is comprised of: | | | | | | | | | |
| Current | | $ | ¾ | | | $ | ¾ | | | $ | ¾ | |
| Deferred | | | (89,000 | ) | | | 954,000 | | | | (1,014,000 | ) |
| Change in valuation allowance | | | 89,000 | | | | (954,000 | ) | | | 1,014,000 | |
| | | $ | ¾ | | | $ | ¾ | | | $ | ¾ | |
At September 30, 2007, the Company has available the following federal net operating loss carryforwards for tax purposes:
Expiration Date Year Ending September 30, | | | |
| | | | |
2012 | | $ | 122,000 | |
2018 | | | 1,491,000 | |
2019 | | | 392,000 | |
2021 | | | 4,860,000 | |
2022 | | | 4,407,000 | |
2023 | | | 6,029,000 | |
2024 | | | 2,432,000 | |
2025 | | | 3,147,000 | |
2026 | | | 149,000 | |
2027 | | | 118,000 | |
The utilization of the net operating loss carryforwards may be limited due to certain factors, including changes in control.
The effective tax rate on net earnings (loss) varies from the statutory federal income tax rate for periods ended September 30, 2007, 2006 and 2005.
| | | 2006 | | | 2005 | | | 2004 | |
| | | | | | | | | | |
| Statutory rate | | | 34.0 | % | | | (34.0 | ) % | | | (34.0 | ) % |
| State taxes net | | | 6.0 | | | | (6.0 | ) | | | (6.0 | ) |
| Other differences, net | | | | | | | ¾ | | | | ¾ | |
| Valuation allowance | | | (40.0 | ) | | | 40.0 | | | | 40.0 | |
| Benefit from net operating loss carryforwards | | | ¾ | | | | ¾ | | | | ¾ | |
| | | | ¾ | % | | | ¾ | % | | | — | % |
a. Series A
In July 2003, the Company entered into an agreement with the Series A holder pursuant to which the Company agreed to redeem the aggregate 1,458,933 shares of the Series A Preferred Stock. These shares represented all of the shares of Series A Preferred Stock then outstanding. The agreement, as amended in March 2004, provided that the Company’s obligation to redeem the Series A Preferred Stock was contingent upon the Company’s sale of not less than $1,000,000 of units in a proposed “best-efforts” public offering of the units (the “Offering”). This condition was satisfied in July 2004. As a result, the Company paid $500,000 and issued 1,750,000 shares of common stock to the Series A holder and redeemed all of the Series A Preferred Stock following the initial closing of the Offering. The Company was obligated to pay the Series A holder an additional $250,000 by January 31, 2005, or at the Company’s option, issue to the Series A holder shares of the Company’s common stock having an aggregate market value of $250,000, based upon the average closing bid prices of the common stock for 30 days preceding January 31, 2005. The Company failed to make the $250,000 payment in cash or stock. Accordingly, the Company is required to pay $300,000 in cash, plus accrued interest at the rate of 18% per year from the date of default until the date the default is cured.
b. Series E
During the year ended September 30, 2004, the Company issued an additional 11,196 shares of Series E Preferred Stock to the Series E shareholders in connection with additional penalties that accrued. On July 21, 2004, the Series E shareholders agreed to waive any further penalties with respect to the Company’s failure to register shares issuable upon conversion of the Series E Preferred Stock for public resale, and acknowledged that the penalties that accrued in March 2004 were the last penalties due and owing to the Series E shareholders.
In February 2004, the Company commenced an exchange offer pursuant to which the Company offered to exchange each outstanding share of its Series E Preferred Stock for, at the election of the holder, common stock and common stock purchase warrants or Series I Preferred Stock and common stock purchase warrants (the “Exchange Offer”).
Pursuant to the terms of the Exchange Offer, as amended, the Company offered to exchange each share of Series E Preferred Stock, at the holder’s election, for either (i) 125 shares of common stock and 250 common stock purchase warrants for each $100 of stated value and accrued dividends represented by the Series E Preferred Stock; or (ii) one share of Series I Preferred Stock having a stated value of $100 per share and 125 common stock purchase warrants for each $100 of stated value and accrued dividends represented by the Series E Preferred Stock.
Each warrant entitles its owner to purchase one share of the Company’s common stock for $.76. The warrants will be exercisable at any time during the period commencing July 14, 2005 and ending January 17, 2007, unless the Company has redeemed them. The Company may redeem the warrants, at a redemption price of $.08 per warrant, upon thirty days prior written notice beginning one year after the closing of the Exchange Offer, once the closing bid price of its common stock has been at least $1.33 for 20 consecutive trading days.
The Exchange Offer closed on August 5, 2004. The results of the Exchange Offer were as follows: 24,833 shares of Series E Preferred Stock, plus accrued dividends thereon, were exchanged for 3,274,750 shares of common stock and 6,549,500 warrants to purchase common stock, 20,585 shares of Series E Preferred Stock, plus accrued dividends thereon, were exchanged for 21,775 shares of Series I Preferred Stock and 2,721,875 warrants to purchase common stock, and 2,310 shares of Series E Preferred Stock, plus accrued dividends thereon, were not exchanged.
In August 2004, the Company issued 12 shares of Series E Preferred Stock in satisfaction of accrued dividends and in August and September 2004, the Company redeemed 1,750 shares of Series E Preferred Stock, plus accrued dividends. In October 2004, the Company redeemed 325 shares of Series E Preferred Stock, leaving 247 shares outstanding at September 30, 2005.
During the year ended September 30, 2006, the Company cancelled those shares which represented over-accrued dividends, and accordingly, transferred $24,700 to additional paid-in capital.
The Company recognized a loss of $3,948,285 as a result of the Exchange Offer. The warrants were valued at $.44 per warrant using the Black-Scholes pricing model.
c. Series F
In July 2002, the Company’s Chief Executive Officer invested $1,000,000 in the Company in exchange for 10,000 shares of newly created Series F Convertible Preferred Stock (the “Series F Preferred Stock”), which has a stated value of $100 per share.
The holder of the Series F Preferred Stock is entitled to receive, from assets legally available therefore, cumulative dividends at a rate of 7% per year, accrued daily, payable monthly, in preference and priority to any payment of any dividend on the Common Stock and on the Series F Preferred Stock. Dividends may be paid, at the Company’s option, either in cash or in shares of Common Stock, valued at the Series F Conversion Price (as defined below). Holders of Series F Preferred Stock are entitled to a liquidation preference of $100 per share, plus accrued and unpaid dividends.
The Series F Preferred Stock is convertible into Common Stock at a conversion price (the “Series F Conversion Price”) equal to $.40 per share. The number of shares issuable upon conversion is determined by multiplying the number of shares of Series F Preferred Stock to be converted by $100, and dividing the result by the Series F Conversion Price.
Except as otherwise required by law, holders of Series F Preferred Stock and holders of Common Stock shall vote together as a single class on each matter submitted to a vote of stockholders. Each outstanding share of Series F Preferred Stock shall be entitled to the number of votes equal to the number of full shares of Common Stock into which each such share of Series F Preferred Stock is then convertible on the date for determination of stockholders entitled to vote at the meeting. Holders of the Series F Preferred Stock are entitled to vote as a separate class on any proposed amendment to the terms of the Series F Preferred Stock which would increase or decrease the number of authorized shares of Series F Preferred Stock or have an adverse impact on the Series F Preferred Stock and on any proposal to create a new class of shares having rights or preferences equal to or having priority to the Series F Preferred Stock.
The Company may redeem the shares of the Series F Preferred Stock at any time prior to conversion at a redemption price of 115% of the purchase price paid for the Series F Preferred Shares plus any accrued but unpaid dividends.
During the year ended September 30, 2006, the Company’s Chief Executive Officer converted $45,000 of accrued dividends into 3,000,000 shares of Common Stock.
d. Series I
The Company was required to redeem each share of the Series I Preferred Stock for an amount equal to the stated value of $100 per share plus all accrued and unpaid dividends on August 5, 2005, the one year anniversary date of the issuance of the Series I Preferred Stock to the extent permitted by applicable law; provided, however, that the Company had the right to extend the required redemption date for an additional one year, in which case the Company was required to pay all dividends accrued through the first year of issuance in cash and issue to each holder of Series I Preferred Stock a number of shares of its common stock which then have a value equal to 10% of the stated value of the Series I Preferred Stock held. In addition, because the Company extended the redemption date, it was required to pay dividends quarterly and pay an advisory fee to an advisor designated by the holders of the Series I Preferred Stock in an amount equal to 10% of the aggregate stated value of the outstanding shares of Series I Preferred Stock, 80% of which was payable in cash and 20% of which was payable in shares of the Company’s common stock, valued at the then current market value. If the Company did not redeem the Series I Preferred Stock by the extended redemption date, the dividend rate of the Series I Preferred Stock would have increased to 24% per year and the Series I Preferred Stock would have been convertible, at the option of the holder, into either common stock at a conversion price equal to 80% of the average closing bid price of the common stock during the five trading days preceding the conversion or common stock and warrants at a rate of 125 shares of common stock and 250 warrants for each $100 of stated value and accrued and unpaid dividends represented by the Series I Preferred Stock. Holders of the Series I Preferred Stock had no voting rights, except as provided by law and with respect to certain limited matters.
Pinnacle Investment Partners, LP (“Pinnacle”), the holder of the shares of the Company’s Series I Preferred Stock (see Notes 15 and 17), notified the Company that the Company was in default of its obligations to pay $30,000 of the $174,200 cash portion of the advisory fee which was required to be paid in connection with the Company’s election to extend the date by which it was required to redeem the Series I Preferred Stock to August 5, 2006. The Company was also in default for non-payment of $40,091 of dividends on the Series I Preferred Stock that were due on September 30, 2005.
The Company permitted Pinnacle to convert 41 shares of Series I Preferred Stock into 840,000 shares of Common Stock in October 2005 as a result of the payment default.
In December 2005, the Company permitted Pinnacle to convert an aggregate of 203 shares of Series I Preferred Stock into 3,000,000 shares of Common Stock and agreed to pay to Pinnacle a default fee of $100,000.
On January 13, 2006, the Company entered into an agreement with Pinnacle, pursuant to which the Company issued to Pinnacle, effective December 28, 2005, a secured convertible promissory note (the “Convertible Note”)(see Note 15) in the aggregate principal amount of $2,356,850 in exchange for 21,531 shares of the Company’s Series I Preferred Stock held by Pinnacle. As a result of the exchange, there are no longer any shares of Series I Preferred Stock outstanding, and the Company no longer has any obligation to pay to Pinnacle any amounts owed to it under the terms of the Series I Preferred Stock, including $103,716 of unpaid dividends which had accrued through December 28, 2005.
| Note 15 - | Note Payable – Related Party |
The Convertible Note, payable to Pinnacle (see Notes 14 and 17), which is secured by substantially all of Stratus Services Group, Inc.’s assets, becomes due as follows:
| • | $1,800,000 was due and payable in cash upon the earlier of the Company’s receipt of $1,800,000 of accounts receivable or March 15, 2006. At September 30, 2006, $210,000 of this has not been paid. |
| • | $331,850 and accrued interest at a rate of 12% per annum is payable in 24 equal installments of principal and interest during the period commencing June 28, 2007 and ending on May 28, 2009. |
| • | $225,000 and accrued interest thereon at the rate of 6% per annum becomes due and payable on December 28, 2007; provided, however, that the Company has the right to pay such amount in cash or shares of its common stock (valued at $0.0072 per share). |
Pinnacle has the right to convert the principal amount of and interest accrued under the Convertible Note at any time as follows:
| • | $331,850 of the principal amount and unpaid interest accrued thereon is convertible into the Company’s Common Stock at a conversion price of $.06 per share. |
| • | $225,000 of the principal amount and unpaid accrued interest thereon is convertible into the Company’s Common Stock at a conversion price of $0.0072. During the year ended September 30, 2006, $150,000 of principal was converted into 20,833,331 shares of the Company’s Common Stock. |
During the year ended September 30, 2006, the Company issued 5,000,000 shares of its Common Stock, valued at the then market value, to Pinnacle as payment of $45,000 against the $1,800,000 portion of the Convertible Note.
Pinnacle may not convert the Convertible Note to the extent that the conversion would result in Pinnacle owning in excess of 9.999% of the then issued and outstanding shares of Common Stock of the Company. Pinnacle may waive this conversion restriction upon not less than 60 days prior notice to the Company.
| Note 16 - | Derivative Instruments |
The Company evaluated the application of SFAS No. 133 and EITF 00-19 for its financial instruments and determined that certain warrants to purchase the Company’s Common Stock are derivatives that are required to be accounted for as free-standing liability instruments in the Company’s financial statement. As a result, the Company reports the value of those warrants as current liabilities on its balance sheet and reports changes in the value of these warrants as non-operating gains or losses on its statements of operations. The value of the warrants is required to be remeasured on a quarterly basis, and is based on the Black Scholes Pricing Model.
Variables used in the Black Scholes option pricing model include (1) 4% risk-free interest rate, (2) expected warrant life is the actual remaining life of the warrants as of each period end, (3) expected volatility is 100% and (4) zero expected dividends.
Due to the nature of the required calculations and the large number of shares of the Company’s common stock involved in such calculations, changes in the Company’s common stock price may result in significant changes in the value of the warrants and resulting non-cash gains and losses on the Company’s statement of operations.
| Note 17 - | Related Party Transactions |
Consulting Fees
An entity which employs the son of the Chief Executive Officer of the Company (the “CEO”) provided consulting services to the Company. Consulting expense was $-0-, $44,000 and $186,000 for the years ended September 30, 2007, 2006 and 2005, respectively. Included in the $44,000 is a charge of $16,000 in connection with the issuance of 2,000,000 shares of the Company’s common stock to the entity. The Company has paid consulting fees to an entity whose stockholder is another son of the CEO of the Company. Consulting fees amounted to $-0-, $0- and $50,000 for the years ended September 30, 2007, 2006 and 2005, respectively.
Joint Venture
The Company provides information technology staffing services through a joint venture, STS (see Note 1), in which the Company has a 51% interest. Prior to February 13, 2007, the Company had a 50% interest. On February 13, 2007, the Company acquired from Fusion Business Services, LLC (“Fusion”) an additional 1% interest in STS in exchange for the issuance to the members of Fusion of 70,111 shares of the Company’s common stock. As a result of the transfer, which was effective as of January 1, 2007, the Company owns a 51% interest in STS and Fusion owns a 49% interest. Fusion has a right to re-acquire the 1% interest transferred to the Company upon the occurrence of certain events, including the institution of bankruptcy or insolvency proceedings against the Company, a sale of all or substantially all of the Company’s assets, a merger or consolidation of the Company with another entity, or the liquidation or dissolution of the Company. The purchase price payable by Fusion in connection with any such re-acquisition shall be a return of the shares issued to it for the 1% interest or a cash payment of $1,262. A son of the CEO of the Company has a majority interest in Fusion.
Payroll Outsourcing
The Company was a party to an Outsourcing Agreement with ALS pursuant to which ALS and its affiliate, Advantage Services Group, LLC (“Advantage”), provided payroll outsourcing services for all of the Company’s in-house staff, except for its corporate employees, and customer staffing requirements. As a result of this arrangement, all of the Company’s field personnel were employees of ALS. The Company paid agreed upon pay rates, plus burden (payroll taxes and workers’ compensation insurance) plus a fee ranging between 2% and 3% (0% - 1 ½% effective June 10, 2005) of pay rates. On June 10, 2005, the Company entered into a Second Addendum to Outsourcing Agreement with ALS, which, among other things, reduced certain rates charged by ALS to the Company. The total amount charged by ALS under this agreement and similar agreements previously in effect between the parties was $-0-, $17,326,000 and $102,825,000 in the years ended September 30, 2007, 2006 and 2005, respectively.
The Company terminated the Outsourcing Agreement effective February 3, 2006.
Due From Related Party
The amount due from related party in the attached consolidated balance sheet at September 30, 2006 is the remaining balance due from ALS in connection with the sale of the ALS Purchased Assets (see Note 4).
Loan Payable
During the year ended September 30, 2007, the CEO loaned $100,000 to the Company which was repaid in January 2007. In addition, during the year ended September 30, 2007, a significant shareholder loaned $44,500 to the Company, which was repaid at September 30, 2007. During the year ended September 30, 2005, the CEO made various loans to the Company aggregating $665,000 of which $650,000 and $15,000 was repaid during the years ended September 30, 2004 and 2005, respectively. Of the $665,000, $250,000 bore interest at 12% a year and the balance was non-interest bearing.
During the year ended September 30, 2002, a son of the CEO loaned $41,000 to the Company, which is still outstanding at September 30, 2007.
During the year ended September 30, 2003, a member of the Board of Directors of the Company (the “Board Member”) and a trust formed for the benefit of the family of another member of the Board of Directors (the “Trust”) loaned $100,000 and $116,337, respectively, to the Company. Both of these loans were unsecured and due on demand. In August 2004, the Company and the Trust executed a promissory note whereby the $116,337 is to be paid at $10,000 a month, with a final payment of $4,309 on August 15, 2005. Payment is guaranteed by the CEO. Interest of 12% a year is included in the payments. At September 30, 2007, there is an unpaid balance of $3,123. In September 2004, the Company and the Board Member executed a promissory note whereby the $100,000 was to be paid at $5,500 a month through May 2006. Interest of 12% a year is included in the payments. At September 30, 2007 there is an unpaid balance of $41,598.
Other
An entity through which the son of the CEO is employed is a consultant to AI (see Note 4).
The Company incurred fees to an entity with whom the son of the CEO is affiliated. Such amounts in the year ended September 30, 2005, aggregated $75,000 in connection with the sale of the Company’s Northern California offices (see Note 3) and $116,000 in connection with an acquisition (see Note 5).
The nephew of the CEO of the Company is affiliated with Pinnacle Investment Partners, LP, the holder of the shares of the Company’s Series I Preferred Stock (see Notes 14 and 15). The Company believes that PIP Management Inc., which was designated as the advisor to the Series I holders (see Notes 14 and 15), is also affiliated with Pinnacle Investment Partners, LP.
| Note 18 - | Commitments and Contingencies |
Office Leases
The Company leases offices under various leases expiring through 2011. Monthly payments under these leases are $5,000. The Company also leases office and warehouse space under various month-to-month leases with monthly payments aggregating $7,000 per month at September 30, 2007.
The following is a schedule by years of approximate future minimum rental payments required under operating leases that have initial or remaining non-cancelable lease terms in excess of one year, as of September 30, 2007.
| For the Years Ending September 30, | |
| 2008 | 60,000 |
| 2009 | 60,000 |
| 2010 | 59,000 |
| 2011 | 10,000 |
Rent expense was $87,000, $266,000 and $779,000 for the years ended September 30, 2007, 2006 and 2005, respectively.
Other
From time to time, the Company is involved in litigation incidental to its business including employment practices claims. There is currently no litigation that management believes will have a material impact on the Company’s financial position.
| Note 19 - | Stock Options and Warrants |
The Company currently has in place five stock option plans, the 1999 Equity Incentive Plan (“1999 Plan”), the 2000 Equity Incentive Plan (“2000 Plan”), the 2001 Equity Incentive Plan (“2001 Plan”), the 2002 Equity Incentive Plan (“2002 Plan”), and the 2006 Equity Incentive Plan (“2006 Plan”) (collectively the “Equity Incentive Plans” or the “Plans”). The terms of these Plans are substantially similar. The aggregate number of shares reserved for issuance under each of the Plans and the options issued and vested as September 30, 2007 are, respectively, as follows:
| 1999 Plan | — | 125,000 shares authorized, 24,000 issued, 24,000 vested |
| 2000 Plan | — | 125,000 shares authorized, 25,000 issued, 25,000 vested |
| 2001 Plan | — | 250,000 shares authorized, 50,000 issued, 50,000 vested |
| 2002 Plan | — | 1,250,000 shares authorized, 100,000 issued, 100,000 vested |
| 2006 Plan | — | 20,000,000 shares authorized, 2,000,000 issued, -0- vested |
In addition, the Company also issued 551,000 options, exercisable at $.26 per share, to an officer of the Company in the year ended September 30, 2005.
A summary of the Company’s stock option activity and related information for the years ended September 30 follows:
| | | Options | | | Weighted Average Exercise Price | |
| | | | | | | |
| Outstanding at September 30, 2004 | | | 1,828,583 | | | $ | 4.87 | |
| Granted | | | 1,050,000 | | | | .26 | |
| Canceled | | | (31,250 | ) | | | 7.98 | |
| Exercised | | | ¾ | | | | ¾ | |
| | | | | | | | | |
| Outstanding at September 30, 2005 | | | 2,847,333 | | | $ | 3.14 | |
| Granted | | | ¾ | | | | ¾ | |
| Canceled | | | (2,097,333 | ) | | | 4.16 | |
| Exercised | | | ¾ | | | | ¾ | |
| | | | | | | | | |
| Outstanding at September 30, 2006 | | | 750,000 | | | $ | .26 | |
| Granted | | | ¾ | | | | ¾ | |
| Canceled | | | ¾ | | | | ¾ | |
| Exercised | | | ¾ | | | | ¾ | |
| | | | | | | | | |
| Outstanding at September 30, 2007 | | | 750,000 | | | $ | .26 | |
| Exercisable at September 30, 2007 | | | 750,000 | | | $ | .26 | |
The exercise price of outstanding options is $.26 per share.
The weighted-average fair value of options granted was $.26 in the year ended September 30, 2005.
| Following is a summary of the status of stock options outstanding at September 30, 2007: |
| | | | Outstanding Options | | | | | Exercisable Options | |
Exercise Price | | | Number | | Weighted Average Remaining Contractual Life | | Weighted Weighted Average Exercise Price | | | Number | | | Weighted Average Exercise Price | |
| | | | | | | | | | | | | | | |
| $ | .26 | | | | 750,000 | | 7.5 years | | $ | .26 | | | | 750,000 | | | $ | .26 | |
The Company has issued the following outstanding warrants as of September 30, 2007:
| Number of Warrants | | | Price Per Share | | Expiring In |
| | | | | | |
| | 14,213,653 | | | $ | .50 | | 2008 |
| | 3,000,000 | | | | .05 | | 2009 |
During the year ended September 30, 2006, the Company issued 3,000,000 warrants to a consultant in exchange for services rendered to the Company. During the year ended September 30, 2004, the Company issued 4,961,028 and 9,271,375 warrants in connection with a Public Offering and the Exchange Offer (see Note 14).
A summary of the Company’s warrant activity and related information for the years ended September 30 follows:
| | | Warrants | | | Weighted Average Exercise Price | |
| | | | | | | |
| Outstanding at September 30, 2004 | | | 15,732,820 | | | $ | .87 | |
| Granted | | | ¾ | | | | ¾ | |
| Canceled | | | (23,750 | ) | | | 18.11 | |
| Exercised | | | ¾ | | | | ¾ | |
| | | | | | | | | |
| Outstanding at September 30, 2005 | | | 15,709,070 | | | $ | .84 | |
| Granted | | | 3,000,000 | | | | .05 | |
| Canceled | | | (37,500 | ) | | | 26.67 | |
| Exercised | | | ¾ | | | | ¾ | |
| | | | | | | | | |
| Outstanding at September 30, 2006 | | | 18,671,570 | | | $ | .66 | |
| Granted | | | ¾ | | | | ¾ | |
| Canceled | | | (1,439,167 | ) | | | .98 | |
| Exercised | | | (18,750 | ) | | | .50 | |
| | | | | | | | | |
| Outstanding at September 30, 2007 | | | 17,213,653 | | | $ | .42 | |
The exercise prices range from $.05 to $.50 per share.
The weighted-average fair value of warrants granted was $.05 in the year ended September 30, 2006.
STS had one customer who accounted for more than 34%, 62% and 72% of total revenues for the years ended September 30, 2007, 2006 and 2005. Major customers are those who account for more than 10% of total revenues.
GTA had two customers who accounted for 53% of its revenues for the period from August 2, 2007 (date of GTA acquisition) through September 30, 2007.
| Note 21 - | Retirement Plans |
Effective October 2006, the Company maintains a 401(k) savings plan for its employees. The terms of the plan defined qualified participants as those with at least three months of service. Employee contributions were discretionary up to a maximum of 15% of compensation. The Company could match up to 50% of the employees’ first 5% contributions. The 401(k) expense was $15,426 for the year ended September 30, 2007.
| Note 22 - | Selected Quarterly Financial Data (unaudited) |
| | | First Quarter | | | Second Quarter | | | Third Quarter | | | Fourth Quarter | |
| | | | | | | | | | | | | |
| Year ended September 30, 2007: | | | | | | | | | | | | |
| Revenues from continuing operations | | $ | 1,862,854 | | | $ | 1,810,705 | | | $ | 2,079,589 | | | $ | 2,456,416 | |
| Gross profit from continuing operations | | | 589,051 | | | | 559,604 | | | | 599,384 | | | | 744,228 | |
| Net earnings (loss) from discontinued operations | | | 175,859 | | | | 100,635 | | | | 183,653 | | | | (67,208 | ) |
| Net earnings (loss) from continuing operations | | | (143,383 | ) | | | (186,617 | ) | | | (143,638 | ) | | | (203,144 | ) |
| Net (loss) from continuing operations attributable to common stockholders | | | (153,883 | ) | | | (197,117 | ) | | | (154,138 | ) | | | (213,644 | ) |
| Net earnings (loss) attributable to common stockholders | | | 21,976 | | | | (96,482 | ) | | | 29,515 | | | | (280,852 | ) |
| | | | | | | | | | | | | | | | | |
| Basic earnings (loss) per share attributable to common stockholders | | | | | | | | | | | | | | | | |
Continuing operations | | | ¾ | | | | ¾ | | | | ¾ | | | | ¾ | |
Discontinued operations | | | ¾ | | | | ¾ | | | | ¾ | | | | ¾ | |
Total | | | ¾ | | | | ¾ | | | | ¾ | | | | ¾ | |
| | | | | | | | | | | | | | | | | |
Diluted earnings (loss) per share attributable | | | | | | | | | | | | | | | | |
to common stockholders | | | | | | | | | | | | | | | | |
Continuing operations | | | ¾ | | | | ¾ | | | | ¾ | | | | ¾ | |
Discontinued operations | | | ¾ | | | | ¾ | | | | ¾ | | | | ¾ | |
Total | | | ¾ | | | | ¾ | | | | ¾ | | | | ¾ | |
| | | First Quarter | | | Second Quarter | | | Third Quarter | | | Fourth Quarter | |
| Year ended September 30, 2006: | | | | | | | | | | | | |
| Revenues from continuing operations | | $ | 1,233,858 | | | $ | 1,190,086 | | | $ | 1,282,074 | | | $ | 1,425,063 | |
| Gross profit from continuing operations | | | 411,602 | | | | 318,518 | | | | 371,498 | | | | 424,219 | |
| Net earnings from discontinued operations | | | 3,049,398 | | | | 20,284 | | | | 215,425 | | | | 211,896 | |
| Net (loss) from continuing operations | | | (1,188,956 | ) | | | (488,838 | ) | | | (195,938 | ) | | | (181,610 | ) |
| Net (loss) from continuing operations attributable to common stockholders | | | (1,199,456 | ) | | | (499,338 | ) | | | (206,438 | ) | | | (192,110 | ) |
| Net earnings (loss) attributable to common stockholders | | | 1,849,942 | | | | (479,054 | ) | | | 8,987 | | | | 19,786 | |
| | | | | | | | | | | | | | | | | |
| Basic earnings (loss) per share attributable to common stockholders | | | | | | | | | | | | | | | | |
| Continuing operations | | | (.06 | ) | | | (.01 | ) | | | — | | | | — | |
| Discontinued operations | | | .15 | | | | — | | | | — | | | | — | |
| Total | | | (.09 | ) | | | (.01 | ) | | | — | | | | — | |
| | | | | | | | | | | | | | | | | |
| Diluted earnings (loss) per share attributable to common stockholders | | | | | | | | | | | | | | | | |
| Continuing operations | | | (.06 | ) | | | (.01 | ) | | | — | | | | — | |
| Discontinued operations | | | .14 | | | | — | | | | — | | | | — | |
| Total | | | .08 | | | | (.01 | ) | | | — | | | | — | |
| | | First Quarter | | | Second Quarter | | | Third Quarter | | | Fourth Quarter | |
| | | | | | | | | | | | | |
| Year ended September 30, 2005: | | | | | | | | | | | | |
| Revenues from continuing operations | | $ | 1,112,846 | | | $ | 1,121,881 | | | $ | 1,180,222 | | | $ | 1,105,694 | |
| Gross profit from continuing operations | | | 326,962 | | | | 312,005 | | | | 340,665 | | | | 338,295 | |
| Net earnings (loss) from discontinued operations | | | 1,024,992 | | | | 218,900 | | | | 2,464,295 | | | | (3,442,554 | ) |
| Net earnings (loss) from continuing operations | | | (1,295,896 | ) | | | 3,366,069 | | | | (372,998 | ) | | | (2,331,369 | ) |
Net earnings (loss) from continuing operations attributable to common stockholders | | | (1,306,396 | ) | | | 3,355,569 | | | | (383,498 | ) | | | (2,341,869 | ) |
| Net earnings (loss) attributable to common stockholders | | | (281,404 | ) | | | 3,574,469 | | | | 2,080,797 | | | | (5,784,423 | ) |
| | | | | | | | | | | | | | | | | |
| Basic earnings (loss) per share attributable to common stockholders: | | | | | | | | | | | | | | | | |
Continuing operations | | | (.08 | ) | | | .20 | | | | (.02 | ) | | | (.13 | ) |
Discontinued operations | | | .06 | | | | .01 | | | | .14 | | | | (.20 | ) |
Total | | | (.02 | ) | | | .21 | | | | .12 | | | | (.33 | ) |
| | | | | | | | | | | | | | | | | |
Diluted earnings (loss) per share attributable to common stockholders: | | | | | | | | | | | | | | | | |
Continuing operations | | | (.08 | ) | | | .17 | | | | (.02 | ) | | | (.13 | ) |
Discontinued operations | | | .06 | | | | .01 | | | | .12 | | | | (.20 | ) |
Total | | | (.02 | ) | | | .18 | | | | .10 | | | | (.33 | ) |
Stratus Services Group, Inc.
Schedule II – Valuation and Qualifying Accounts
| Allowance for Doubtful Accounts | | Balance at beginning of period | | | Charged to bad debt expense | | | Other | | | Deductions (Write-offs of bad debts) | | | Balance at end of period | |
| | | | | | | | | | | | | | | | |
| September 30: | | | | | | | | | | | | | | | |
| 2007 | | $ | 75,000 | | | $ | 125,000 | | | $ | ¾ | | | $ | ¾ | | | $ | 200,000 | |
| 2006 | | | 3,039,000 | | | | 75,000 | | | | 8,000 | | | | (3,047,000 | ) | | | 75,000 | |
| 2005 | | | 2,038,000 | | | | 1,000,000 | | | | 3,000 | | | | (2,000 | ) | | | 3,039,000 | |
| Valuation Allowance for Deferred Taxes | | Balance at beginning of period | | | Charged to costs and expenses (1) | | | Other | | | Deductions | | | Balance at end of period | |
| | | | | | | | | | | | | | | | |
| September 30: | | | | | | | | | | | | | | | |
| 2007 | | $ | 9,242,000 | | | $ | 89,000 | | | $ | ¾ | | | $ | ¾ | | | $ | 9,331,000 | |
| 2006 | | | 10,196,000 | | | | (954,000 | ) | | | | | | | | | | | 9,242,000 | |
| 2005 | | | 9,182,000 | | | | 1,014,000 | | | | ¾ | | | | ¾ | | | | 10,196,000 | |
___________________________
| (1) | Reflects the increase (decrease) in the valuation allowance associated with net operating losses of the Company. |