W. R. Grace & Co. Second Quarter 2013 Follow Up Discussion New York Investor Meetings August 1, 2013 © 2013. R. Grace & Co.

2 © 2013 W. R. Grace & Co. Disclaimer Safe Harbor Statement under the Private Securities Litigation Reform Act of 1995 This presentation contains forward-looking statements, that is, statements related to future, not past, events. Such statements generally include the words “believes,” “plans,” “intends,” “targets,” “will,” “expects,” “suggests,” “anticipates,” “outlook,” “continues” or similar expressions. Forward-looking statements include, without limitation, all statements regarding Grace’s Chapter 11 case; expected financial positions; results of operations; cash flows; financing plans; business strategy; budgets; capital and other expenditures; competitive positions; growth opportunities for existing products; benefits from new technology and cost reduction initiatives, plans and objectives; and markets for securities. For these statements, Grace claims the protection of the safe harbor for forward-looking statements contained in the Private Securities Litigation Reform Act of 1995. Like other businesses, Grace is subject to risks and uncertainties that could cause its actual results to differ materially from its projections or that could cause other forward-looking statements to prove incorrect. Factors that could cause actual results to materially differ from those contained in the forward-looking statements include, without limitation: developments affecting Grace’s bankruptcy, proposed plan of reorganization and settlements with certain creditors, the cost and availability of raw materials (including rare earth) and energy, developments affecting Grace’s underfunded and unfunded pension obligations, risks related to foreign operations, especially in emerging regions, acquisitions and divestitures of assets and gains and losses from dispositions or impairments, the effectiveness of its research and development and growth investments, its legal and environmental proceedings, costs of compliance with environmental regulation and those factors set forth in Grace’s most recent Annual Report on Form 10-K, quarterly report on Form 10-Q and current reports on Form 8-K, which have been filed with the Securities and Exchange Commission and are readily available on the Internet at www.sec.gov. Reported results should not be considered as an indication of future performance. Readers are cautioned not to place undue reliance on Grace’s projections and forward-looking statements, which speak only as of the date thereof. Grace undertakes no obligation to publicly release any revisions to the forward-looking statements contained in this presentation, or to update them to reflect events or circumstances occurring after the date of this presentation. Non-GAAP Financial Terms These slides contain certain “non-GAAP financial terms” which are defined in the Appendix. Reconciliations of non-GAAP terms to the closest GAAP term (i.e., net income) are provided in the Appendix.

3 © 2013 W. R. Grace & Co. Discussion Outline FCC Catalyst Business: • Industry structure very attractive • Growth drivers • New technology introductions Q2 Earnings Recap: • FCC catalyst pricing update • 2013 Outlook • Risks to 2014 Adjusted EBITDA Goal Return of Capital Strategy: • Adjusted Free Cash Flow • Capital investment framework

4 © 2013 W. R. Grace & Co. © 2012 W. R. Grace & Co. Competitive Rivalry Threat of New Entry Buyer Power Threat of Substitution Supplier Power FCC Catalyst Industry Structure Very Attractive

5 © 2013 W. R. Grace & Co. FCC Catalyst – Growth Drivers Demand for transportation fuel: Global demand for transportation fuels growing ~2-3% annually Refining capacity, crude slate, regulation: 70+ new FCC units planned through 2018, primarily resid focused Heavier feedstocks to grow ~5% annually, primarily in emerging regions Environmental regulation and legislation Demand for petrochemical feedstocks: Growth in emerging regions driving demand for propylene FCC units a primary source of propylene supply Sources: U.S. Energy Information Administration/International Energy Outlook, IMF, Grace internal estimates 2012 2013 2014 2015 2016 2017 2018 Advanced Regions Emerging Regions Global FCC Catalyst Demand Demand growth driving tighter FCC supply conditions

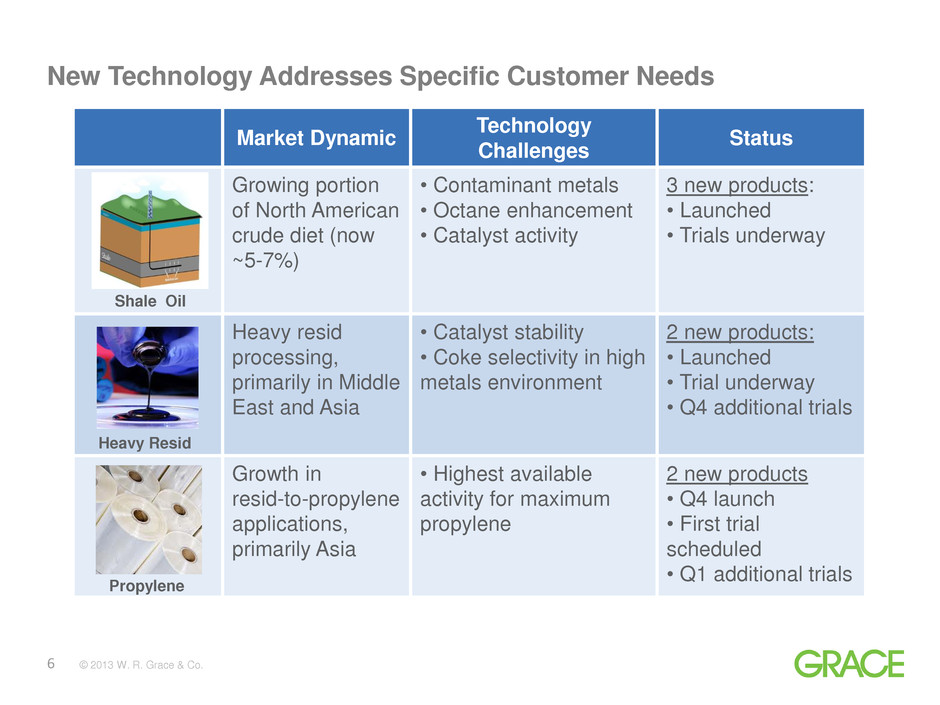
6 © 2013 W. R. Grace & Co. New Technology Addresses Specific Customer Needs Market Dynamic Technology Challenges Status Growing portion of North American crude diet (now ~5-7%) • Contaminant metals • Octane enhancement • Catalyst activity 3 new products: • Launched • Trials underway Heavy resid processing, primarily in Middle East and Asia • Catalyst stability • Coke selectivity in high metals environment 2 new products: • Launched • Trial underway • Q4 additional trials Growth in resid-to-propylene applications, primarily Asia • Highest available activity for maximum propylene 2 new products • Q4 launch • First trial scheduled • Q1 additional trials Shale Oil Heavy Resid Propylene

7 © 2013 W. R. Grace & Co. FCC Catalyst Pricing Update • Competitive sales volume losses at annualized rate of $60 million • Response: • Introducing new product technologies targeted for specific customer needs • Closing manufacturing capacity for older technology • View on 2013 • Q3: Lower volumes due to lost sales; unfavorable operating leverage and lower ART earnings; earnings below Q1 • FY: Sales down due to lower rare earth surcharges, volumes and base pricing; 41% gross margin; segment operating income down more than 10% • View on 2014 • Tight supply hypothesis intact due to view on refinery start ups and propylene production • Pricing opportunity as industry dynamics improve • Position new products for sales volume recovery Pricing initiative: Right direction, Too early

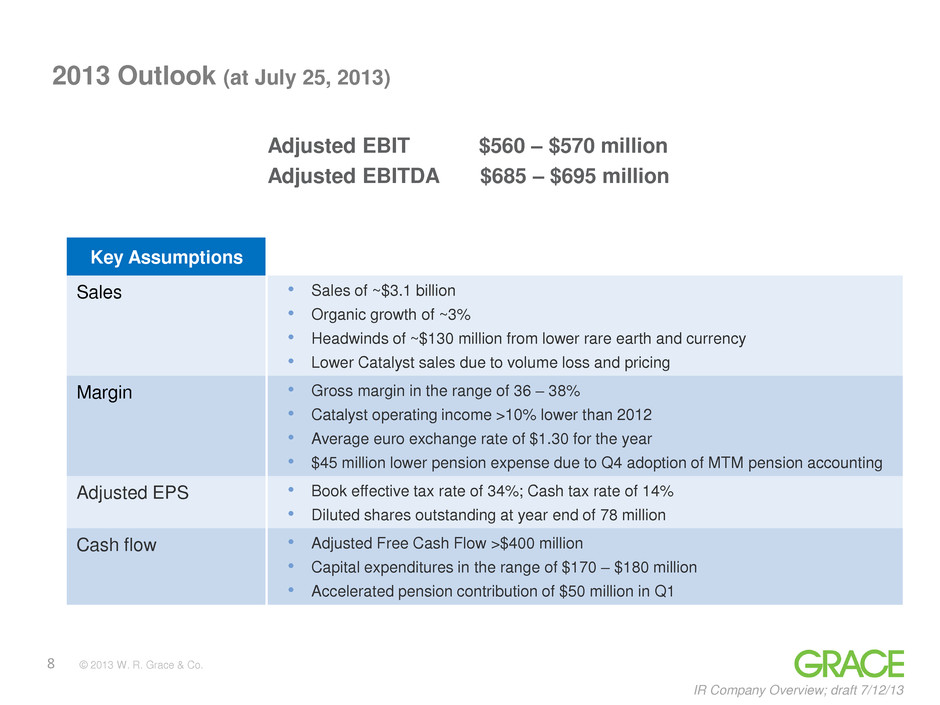
8 © 2013 W. R. Grace & Co. IR Company Overview; draft 7/12/13 2013 Outlook (at July 25, 2013) Key Assumptions Sales • Sales of ~$3.1 billion • Organic growth of ~3% • Headwinds of ~$130 million from lower rare earth and currency • Lower Catalyst sales due to volume loss and pricing Margin • Gross margin in the range of 36 – 38% • Catalyst operating income >10% lower than 2012 • Average euro exchange rate of $1.30 for the year • $45 million lower pension expense due to Q4 adoption of MTM pension accounting Adjusted EPS • Book effective tax rate of 34%; Cash tax rate of 14% • Diluted shares outstanding at year end of 78 million Cash flow • Adjusted Free Cash Flow >$400 million • Capital expenditures in the range of $170 – $180 million • Accelerated pension contribution of $50 million in Q1 Adjusted EBIT $560 – $570 million Adjusted EBITDA $685 – $695 million

9 © 2013 W. R. Grace & Co. Organic Growth Assumes 4% volume growth New FCC catalyst product introductions and catalyst volume recovery Growth Programs Focused technology-driven growth programs Pricing FCC catalyst pricing Pricing actions in Materials Technologies and Construction Products Productivity 100 bps annual margin improvement Additional cost reduction through productivity programs Acquisitions Synergistic bolt-ons within the current portfolio Up to $30-40 Million of Risk to 2014 Adjusted EBITDA Goal 2013 2014 Risks from lower catalyst sales, weaker global macro-environment Organic Growth and Growth Programs Productivity and Pricing $35+ Adjusted EBITDA (in millions) $40-60 $685-695 Outlook Goal Acquisitions = 2013 Outlook as of July 25, 2013; includes adoption of mark-to-market pension accounting $50-60 $810–850 with acquisitions $775–815 ex acquisitions

10 © 2013 W. R. Grace & Co. Strong Free Cash Flow (in millions of dollars) 2013 Outlook (July 25, 2013) 2014 Adjusted EBITDA $685-695 $775-815 Capital Expenditures (170-180) Roughly flat Working Capital Change 0-20 Working capital investment in line with 2014 sales growth Pension* 0 0 Cash Interest (5-10) Cash interest expense based on: exit financing, acquisitions, return of capital Cash Taxes (60-70) 14% cash tax rate Other (20-30) Roughly flat Adjusted FCF >$400 >$400 AFCF Yield >7%** >7%** * Pension contributions approximate pension expense under mark-to-market pension accounting ** Based on current $5.8 billion market capitalization

11 © 2013 W. R. Grace & Co. Cash from Operations and Additional Leverage Reinvest in the business Return cash to shareholders: >$1 billion Strategic capital Acquisitions Dividends Share repurchases High return opportunities in each segment ~ 5–7% of Sales Catalysts: ~70% Materials: ~15% Construction: ~15% Considerations ● Flexibility ● Valuation ● Investor preference ● Tax efficiency Recent acquisitions: Catalysts: $55M (2 deals) Materials: -0- Construction: $115M (5 deals) Financial Strength to Grow Top Line and Increase Total Shareholder Return Cash settle warrant $490 million within one year of emergence Strong Free Cash Flow and Significant Debt Capacity

12 © 2013 W. R. Grace & Co. For additional information, please visit www.grace.com or contact: J. Mark Sutherland Vice President, Investor Relations +1 410.531.4590 Mark.Sutherland@grace.com


