
Investor Day Presentation January 26, 2016 Innovative. Performance Driven. Focused.
Safe Harbor Statement under the Private Securities Litigation Reform Act of 1995 This presentation contains forward-looking statements, that is, information related to future, not past, events. Such statements generally include the words “believes,” “plans,” “intends,” “targets,” “will,” “expects,” “suggests,” “anticipates,” “outlook,” “continues,” or similar expressions. Forward- looking statements include, without limitation, expected financial positions; results of operations; cash flows; financing plans; business strategy; operating plans; capital and other expenditures; competitive positions; growth opportunities for existing products; benefits from new technology and cost reduction initiatives, plans and objectives; and markets for securities. For these statements, Grace claims the protection of the safe harbor for forward-looking statements contained in Section 27A of the Securities Act and Section 21E of the Exchange Act. Like other businesses, Grace is subject to risks and uncertainties that could cause its actual results to differ materially from its projections or that could cause other forward-looking statements to prove incorrect. Factors that could cause actual results to materially differ from those contained in the forward-looking statements include, without limitation: risks related to foreign operations, especially in emerging regions; the cost and availability of raw materials and energy; the effectiveness of its research and development and growth investments; acquisitions and divestitures of assets and gains and losses from dispositions; developments affecting Grace’s outstanding indebtedness; developments affecting Grace's funded and unfunded pension obligations; its legal and environmental proceedings; uncertainties that may delay or negatively impact the separation transaction or cause the separation transaction to not occur at all; uncertainties related to Grace’s ability to realize the anticipated benefits of the separation transaction; the inability to establish or maintain certain business relationships and relationships with customers and suppliers or the inability to retain key personnel during the period leading up to and following the separation transaction; costs of compliance with environmental regulation; and those additional factors set forth in Grace's most recent Annual Report on Form 10-K, quarterly report on Form 10-Q and current reports on Form 8-K, which have been filed with the Securities and Exchange Commission and are readily available on the Internet at www.sec.gov. Reported results should not be considered as an indication of future performance. Readers are cautioned not to place undue reliance on Grace's projections and forward-looking statements, which speak only as the date on which such projections or statements are made. Grace undertakes no obligation to publicly release any revision to the projections and forward-looking statements contained in this announcement, or to update them to reflect events or circumstances occurring after the date of this presentation. Non-GAAP Financial Terms These slides contain certain “non-GAAP financial terms” which are defined in the Appendix. 2 © 2016 W. R. Grace & Co. Disclaimer
Agenda 10:00 a.m. Welcome and Introductions Tania Almond Investor Relations Officer 10:05 W. R. Grace & Co. Fred Festa Chairman and Chief Executive Officer Hudson La Force Senior Vice President and Chief Financial Officer 12:00 p.m. Lunch 1:00 GCP Applied Technologies Inc. Gregory E. Poling President and Chief Executive Officer Dean P. Freeman Vice President and Chief Financial Officer 3:00 Adjourn 3 © 2016 W. R. Grace & Co.

Separation Transaction 4 © 2016 W. R. Grace & Co.
Separation Transaction 5 © 2016 W. R. Grace & Co. Construction Products and Darex Packaging Technologies Leading global provider of specialty construction chemicals, specialty building materials, and packaging sealants and coatings Capitalize on independent company platform and strong cash flow to support its growth in global industries, while maintaining a balanced financial policy Sales and marketing focus with strong technical sales and service component Less capital intensive, simpler manufacturing operations Creating Two Industry-Leading Public Companies Catalysts Technologies and Materials Technologies Global leader in process catalysts and specialty silicas High margin, technologically advanced business focused on growth, margin expansion, and strong cash flow Manufacturing and technology focus with strong technical sales and service component More capital intensive, complex manufacturing operations Sharpened strategic focus, simplified operating structures, and more efficient capital allocation and capital structures

Separation Transaction 6 © 2016 W. R. Grace & Co. Separation is the next step in shareholder value creation Strong Track Record of Shareholder Value Creation Since 2003… Increased market cap by more than $6.0 billion Grew sales and gross margin: Upgraded the quality of our business portfolio Successfully completed 22 acquisitions and 7 divestitures Tripled sales in emerging regions Significantly improved profitability, cash flow and ROIC: 2015P Adjusted EBITDA margins of 24.6% 2015P Adjusted Free Cash Flow of >$430 million 2015P Adjusted EBIT ROIC 32.2% Returned $1.3 billion of capital in last two years: Repurchased ~$800 million of stock, reducing share count by over 10% Completed $490 million warrant settlement, effectively buying 10 million shares at $66 Expect to begin regular quarterly cash dividend 1,848 2,590 3,052 29.7% 34.1% 39.6% 0% 10% 20% 30% 40% $0 $1,000 $2,000 $3,000 $4,000 2003* 2009 2015P** A d j G ros s M a rgi n N e t Sales ($MM ) 252 379 750 13.6% 13.4% 24.6% 0% 5% 10% 15% 20% 25% $0 $200 $400 $600 $800 2003 2009 2015P** A dj E B IT D A Margi n A dj E B IT D A ($MM ) 14.6% 23.3% 32.2% 0% 5% 10% 15% 20% 25% 30% 2003 2009 2015P** A dj E B IT R O IC * Excludes sales from ART JV which was deconsolidated in December 2009 ** 2015 preliminary data
Separation Transaction 7 © 2016 W. R. Grace & Co. Grace shares have outperformed the S&P Chemical Index by 12% since announcing the separation (2/4/15 to 1/22/16) Compelling Rationale for Spin-Off Simplified Operating Structure Compelling growth and margin profiles Simplified operating structures: Improved management focus Cost productivity and optimized functional support Strong leadership teams focused on value creation Strong Financial Profiles Optimized capital structures Financial flexibility to pursue growth and M&A opportunities Two unique and compelling investment opportunities: Simpler investor thesis Distinct investment identity Enhanced Strategic Focus Two strong, focused, operating companies: Industry-leading market and technology positions Strong free cash flow High returns on invested capital Positioned to capture distinct growth opportunities More efficient capital allocation: Investment decisions optimized at each company
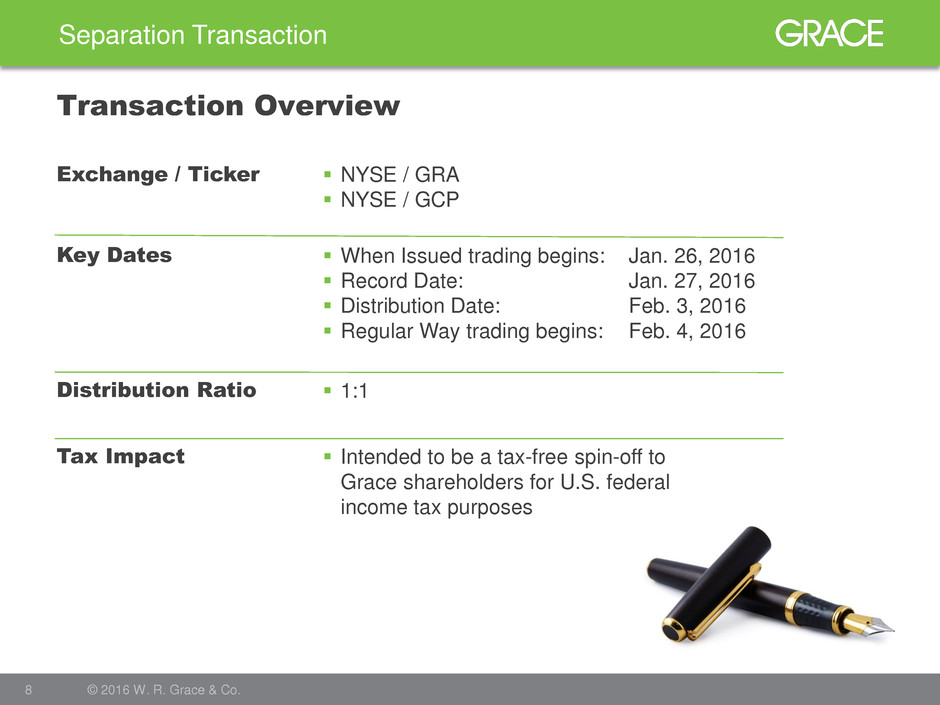
Separation Transaction 8 © 2016 W. R. Grace & Co. Transaction Overview Exchange / Ticker Key Dates Distribution Ratio Tax Impact NYSE / GRA NYSE / GCP When Issued trading begins: Jan. 26, 2016 Record Date: Jan. 27, 2016 Distribution Date: Feb. 3, 2016 Regular Way trading begins: Feb. 4, 2016 1:1 Intended to be a tax-free spin-off to Grace shareholders for U.S. federal income tax purposes

2016 Outlook And Valuation 9 © 2016 W. R. Grace & Co.
Focused. Performance Driven. Innovative. 10 © 2016 W. R. Grace & Co. 2016 Outlook and Valuation
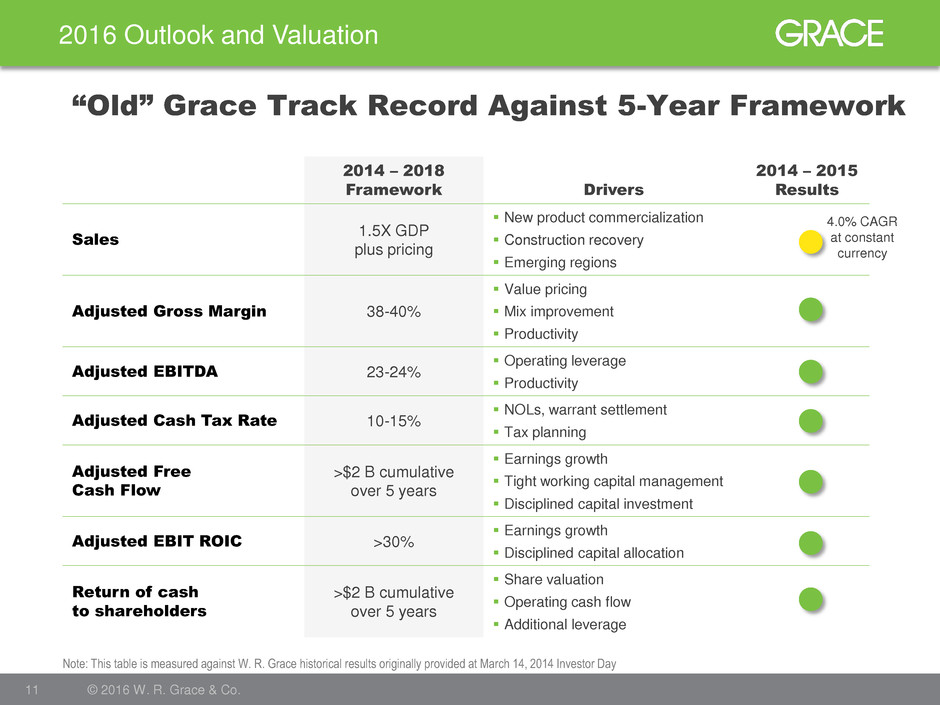
2016 Outlook and Valuation 11 © 2016 W. R. Grace & Co. “Old” Grace Track Record Against 5-Year Framework 2014 – 2018 Framework Drivers 2014 – 2015 Results Sales 1.5X GDP plus pricing New product commercialization Construction recovery Emerging regions Adjusted Gross Margin 38-40% Value pricing Mix improvement Productivity Adjusted EBITDA 23-24% Operating leverage Productivity Adjusted Cash Tax Rate 10-15% NOLs, warrant settlement Tax planning Adjusted Free Cash Flow >$2 B cumulative over 5 years Earnings growth Tight working capital management Disciplined capital investment Adjusted EBIT ROIC >30% Earnings growth Disciplined capital allocation Return of cash to shareholders >$2 B cumulative over 5 years Share valuation Operating cash flow Additional leverage 4.0% CAGR at constant currency Note: This table is measured against W. R. Grace historical results originally provided at March 14, 2014 Investor Day
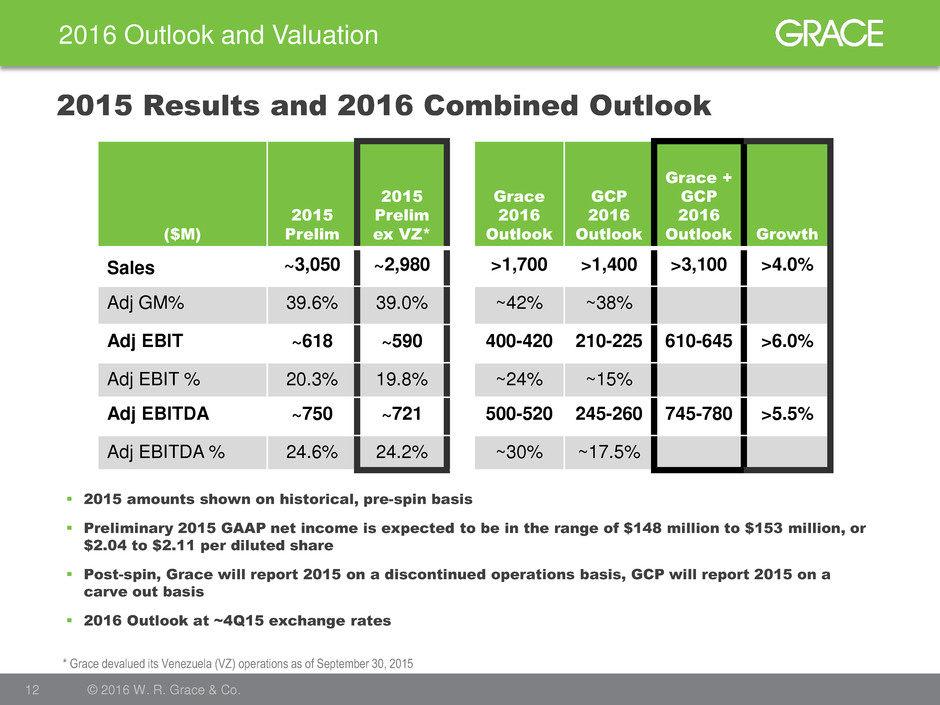
2016 Outlook and Valuation 12 © 2016 W. R. Grace & Co. 2015 Results and 2016 Combined Outlook ($M) 2015 Prelim 2015 Prelim ex VZ* Grace 2016 Outlook GCP 2016 Outlook Grace + GCP 2016 Outlook Growth Sales ~3,050 ~2,980 >1,700 >1,400 >3,100 >4.0% Adj GM% 39.6% 39.0% ~42% ~38% Adj EBIT ~618 ~590 400-420 210-225 610-645 >6.0% Adj EBIT % 20.3% 19.8% ~24% ~15% Adj EBITDA ~750 ~721 500-520 245-260 745-780 >5.5% Adj EBITDA % 24.6% 24.2% ~30% ~17.5% 2015 amounts shown on historical, pre-spin basis Preliminary 2015 GAAP net income is expected to be in the range of $148 million to $153 million, or $2.04 to $2.11 per diluted share Post-spin, Grace will report 2015 on a discontinued operations basis, GCP will report 2015 on a carve out basis 2016 Outlook at ~4Q15 exchange rates * Grace devalued its Venezuela (VZ) operations as of September 30, 2015
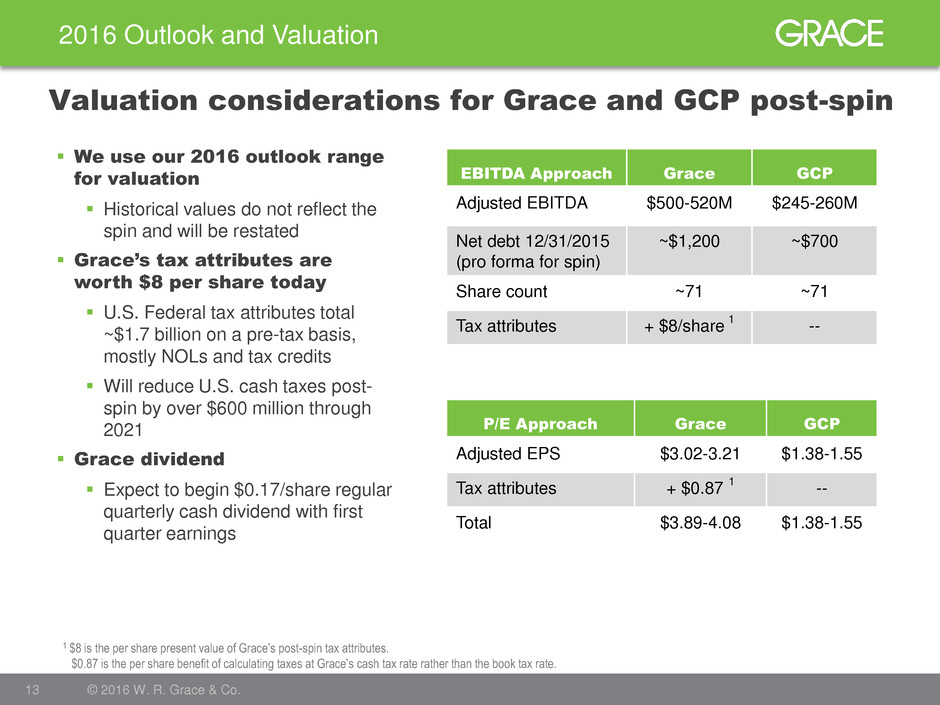
2016 Outlook and Valuation 13 © 2016 W. R. Grace & Co. We use our 2016 outlook range for valuation Historical values do not reflect the spin and will be restated Grace’s tax attributes are worth $8 per share today U.S. Federal tax attributes total ~$1.7 billion on a pre-tax basis, mostly NOLs and tax credits Will reduce U.S. cash taxes post- spin by over $600 million through 2021 Grace dividend Expect to begin $0.17/share regular quarterly cash dividend with first quarter earnings Valuation considerations for Grace and GCP post-spin EBITDA Approach Grace GCP Adjusted EBITDA $500-520M $245-260M Net debt 12/31/2015 (pro forma for spin) ~$1,200 ~$700 Share count ~71 ~71 Tax attributes + $8/share 1 -- P/E Approach Grace GCP Adjusted EPS $3.02-3.21 $1.38-1.55 Tax attributes + $0.87 1 -- Total $3.89-4.08 $1.38-1.55 1 $8 is the per share present value of Grace’s post-spin tax attributes. $0.87 is the per share benefit of calculating taxes at Grace’s cash tax rate rather than the book tax rate.

Strategic Direction 14 © 2016 W. R. Grace & Co.
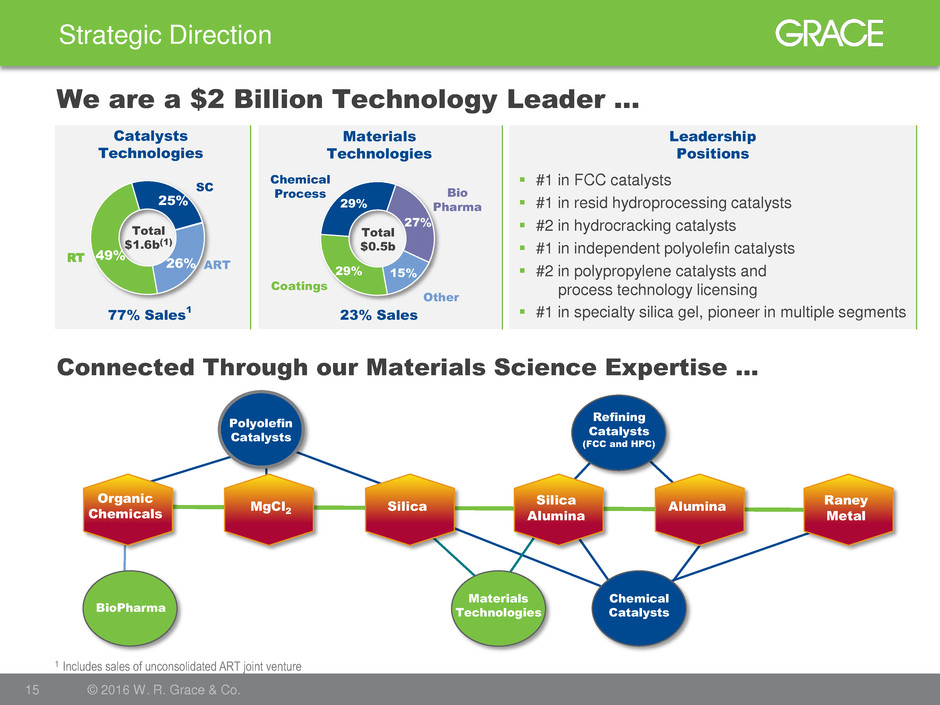
Strategic Direction 15 © 2016 W. R. Grace & Co. We are a $2 Billion Technology Leader … SC RT 25% 49% 26% Total $1.6b(1) 29% 29% 27% 15% Total $0.5b Coatings Other Bio Pharma Chemical Process Catalysts Technologies Materials Technologies 77% Sales 1 23% Sales 1 Includes sales of unconsolidated ART joint venture #1 in FCC catalysts #1 in resid hydroprocessing catalysts #2 in hydrocracking catalysts #1 in independent polyolefin catalysts #2 in polypropylene catalysts and process technology licensing #1 in specialty silica gel, pioneer in multiple segments Leadership Positions Connected Through our Materials Science Expertise … Organic Chemicals MgCl2 Silica Silica Alumina Alumina Raney Metal BioPharma Chemical Catalysts Materials Technologies Polyolefin Catalysts Refining Catalysts (FCC and HPC) ART Polyolefin Catalysts
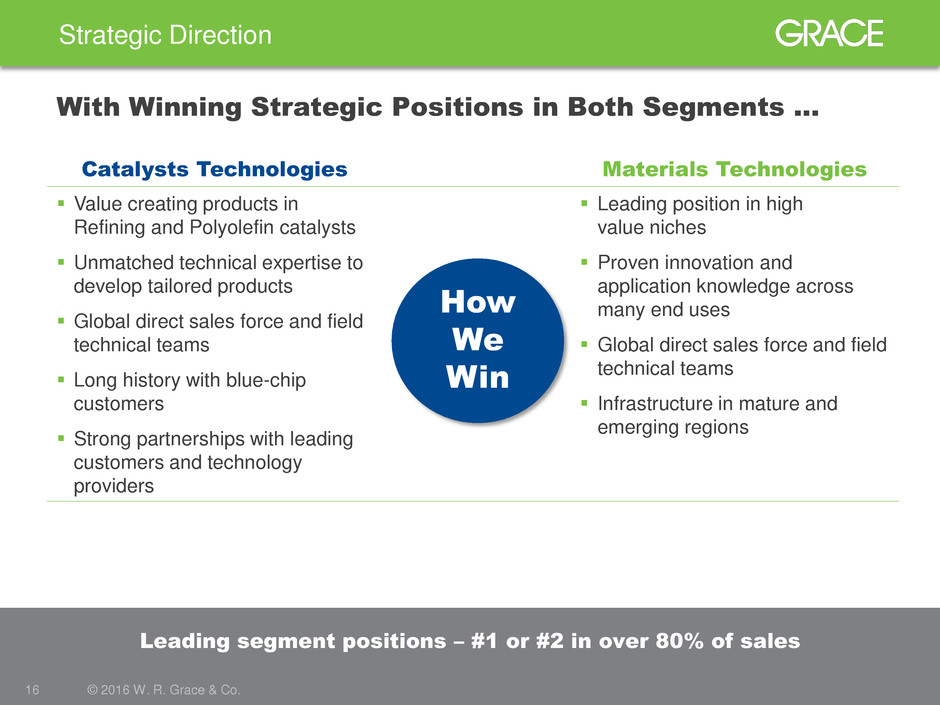
Catalysts Technologies Materials Technologies Value creating products in Refining and Polyolefin catalysts Unmatched technical expertise to develop tailored products Global direct sales force and field technical teams Long history with blue-chip customers Strong partnerships with leading customers and technology providers Leading position in high value niches Proven innovation and application knowledge across many end uses Global direct sales force and field technical teams Infrastructure in mature and emerging regions Strategic Direction 16 © 2016 W. R. Grace & Co. Leading segment positions – #1 or #2 in over 80% of sales With Winning Strategic Positions in Both Segments … How We Win
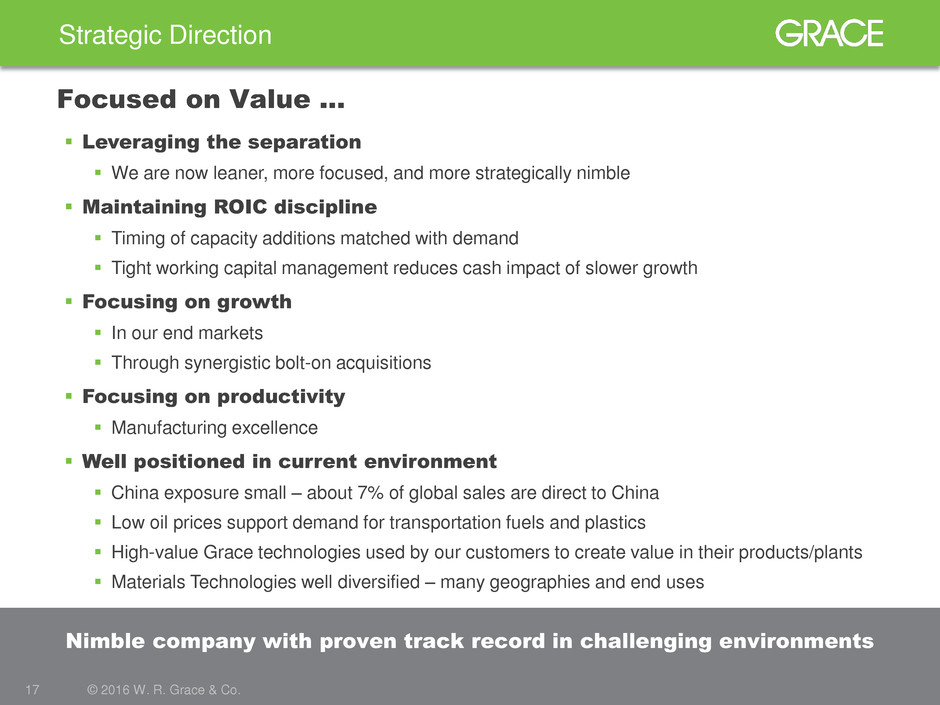
Nimble company with proven track record in challenging environments Strategic Direction 17 © 2016 W. R. Grace & Co. Focused on Value … Leveraging the separation We are now leaner, more focused, and more strategically nimble Maintaining ROIC discipline Timing of capacity additions matched with demand Tight working capital management reduces cash impact of slower growth Focusing on growth In our end markets Through synergistic bolt-on acquisitions Focusing on productivity Manufacturing excellence Well positioned in current environment China exposure small – about 7% of global sales are direct to China Low oil prices support demand for transportation fuels and plastics High-value Grace technologies used by our customers to create value in their products/plants Materials Technologies well diversified – many geographies and end uses
Strategic Direction 18 © 2016 W. R. Grace & Co. Adapting to Global Operating Environment … Catalysts Technologies Fully capture the benefits of FCC catalysts Grow sales with technology-oriented customers Continue investments in new products Continue focus on growth regions North America, Middle East, Asia Build first FCC catalyst plant in Middle East Develop new FCC profit pools MTO – adjacent application leveraging FCC technology and assets Exploring opportunities to create new value for customers and deepen relationships Curtail least efficient capacity Current pricing does not support bottom 10,000 tons of our volume Reduced 10,000 tons of capacity this month Focusing ART on hydrocracking and resid hydrotreating Strong growth drivers Bottom-of-the-barrel upgrading Sulfur reduction in transportation fuels Leadership position Recognized technology leader in hydrocracking and resid catalysts Leverage licensing success of Chevron Lummus Global (CLG) for first fills and refills Demand-driven capacity addition Tracking progress of all new unit builds Timing of capacity addition will be paced with demand
Strategic Direction 19 © 2016 W. R. Grace & Co. Adapting to Global Operating Environment … Catalysts Technologies Grow new applications in high margin end uses Materials Technologies Exciting new product pipeline to sustain above-market growth rate High performance additive for architectural paints Specialty material for custom catalyst applications Sustainable materials to replace plastic micro beads in personal care Build or buy for growth Target acquisitions to expand product portfolio, add capacity, and penetrate new end uses Continue to expand geographic and end use diversification Capitalize on regulatory changes driving growth in sustainable technologies Aggressively grow polyolefin catalysts Exciting new product pipeline to sustain above-market growth rate Non-phthalate CONSISTA® polypropylene catalyst Single-site polyethylene catalysts Support customer investment decisions with product and process technology Licensing in Asia and North America Build or buy required growth capacity ROIC decision-making discipline
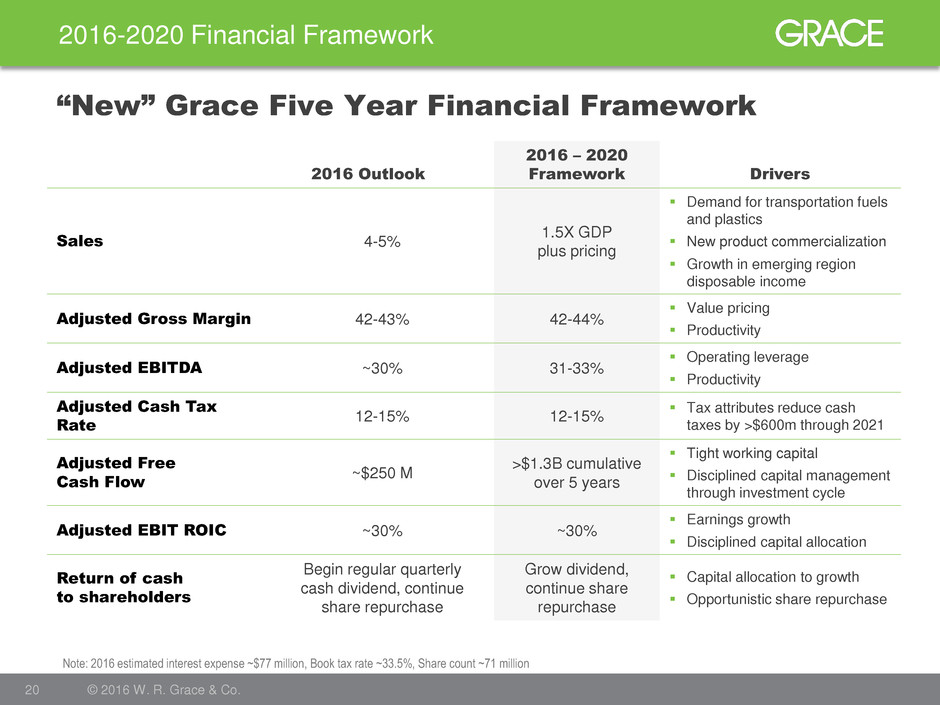
2016-2020 Financial Framework 20 © 2016 W. R. Grace & Co. “New” Grace Five Year Financial Framework 2016 Outlook 2016 – 2020 Framework Drivers Sales 4-5% 1.5X GDP plus pricing Demand for transportation fuels and plastics New product commercialization Growth in emerging region disposable income Adjusted Gross Margin 42-43% 42-44% Value pricing Productivity Adjusted EBITDA ~30% 31-33% Operating leverage Productivity Adjusted Cash Tax Rate 12-15% 12-15% Tax attributes reduce cash taxes by >$600m through 2021 Adjusted Free Cash Flow ~$250 M >$1.3B cumulative over 5 years Tight working capital Disciplined capital management through investment cycle Adjusted EBIT ROIC ~30% ~30% Earnings growth Disciplined capital allocation Return of cash to shareholders Begin regular quarterly cash dividend, continue share repurchase Grow dividend, continue share repurchase Capital allocation to growth Opportunistic share repurchase Note: 2016 estimated interest expense ~$77 million, Book tax rate ~33.5%, Share count ~71 million

Business Overview 21 © 2016 W. R. Grace & Co.
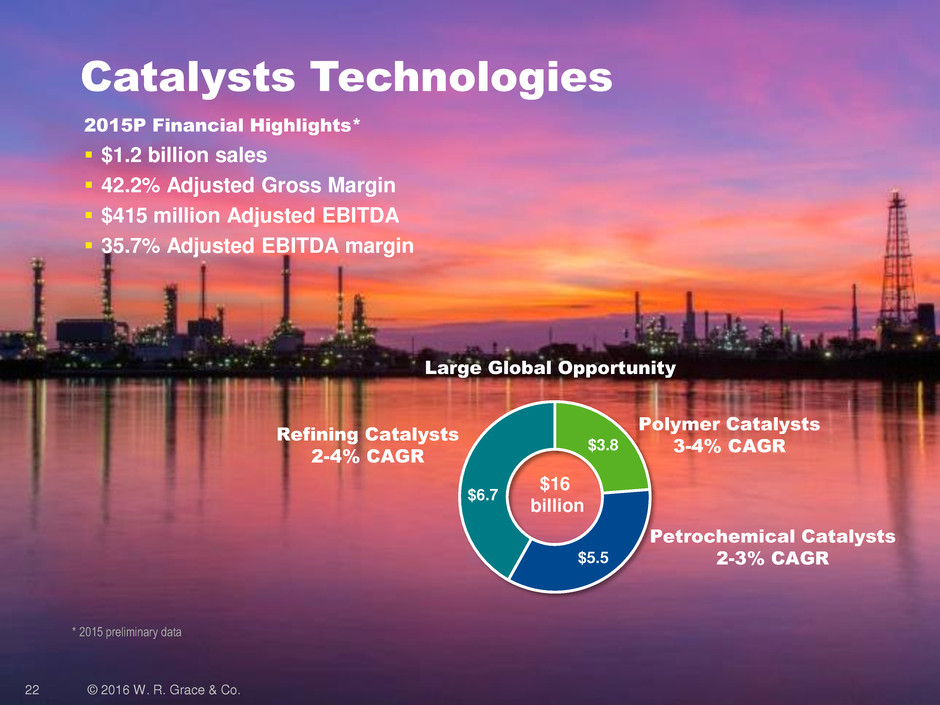
22 © 2016 W. R. Grace & Co. Catalysts Technologies $3.8 $5.5 $6.7 Polymer Catalysts 3-4% CAGR Refining Catalysts 2-4% CAGR Petrochemical Catalysts 2-3% CAGR $16 billion 2015P Financial Highlights* $1.2 billion sales 42.2% Adjusted Gross Margin $415 million Adjusted EBITDA 35.7% Adjusted EBITDA margin * 2015 preliminary data Large Global Opportunity
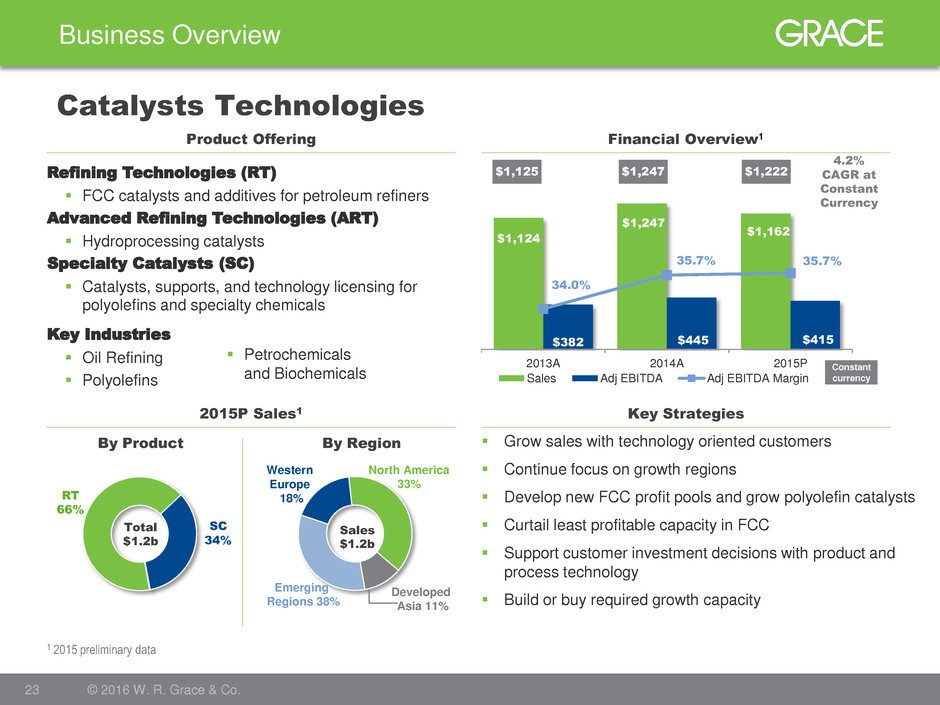
$1,124 $1,247 $1,162 $382 $445 $415 34.0% 35.7% 35.7% 2013A 2014A 2015P Sales Adj EBITDA Adj EBITDA Margin Key Industries Oil Refining Polyolefins SC 34% RT 66% North America 33% Emerging Regions 38% Developed Asia 11% Western Europe 18% Business Overview 23 © 2016 W. R. Grace & Co. Catalysts Technologies Financial Overview1 Product Offering 2015P Sales1 Key Strategies Grow sales with technology oriented customers Continue focus on growth regions Develop new FCC profit pools and grow polyolefin catalysts Curtail least profitable capacity in FCC Support customer investment decisions with product and process technology Build or buy required growth capacity By Product By Region 1 2015 preliminary data Total $1.2b Refining Technologies (RT) FCC catalysts and additives for petroleum refiners Advanced Refining Technologies (ART) Hydroprocessing catalysts Specialty Catalysts (SC) Catalysts, supports, and technology licensing for polyolefins and specialty chemicals Petrochemicals and Biochemicals Sales $1.2b $1,125 $1,247 $1,222 4.2% CAGR at Constant Currency Constant currency

72% 64% 60% 28% 36% 40% 2009 2015P 2020E Refining Technologies Specialty Catalysts A strong portfolio getting stronger with a more diversified earnings base Business Overview 24 © 2016 W. R. Grace & Co. Catalysts Technologies Application 2009 2015 R e fi n in g FCC HPC EB Resid HPC FB Resid HPC Distillate HPC Hydrocracking S p e c ia lt y Polyethylene (PE) Catalyst PE Catalyst Support Polypropylene (PP) Catalyst PP Process Technology Licensing - PE / PP Single Site Catalyst Chemical Catalysts F u tur e Zeolite Technology MTO Catalysts - Technology Leader Developing Position Strong Position Segment earnings mixing toward high growth Specialty Catalysts ~13% CAGR ~8-9% CAGR
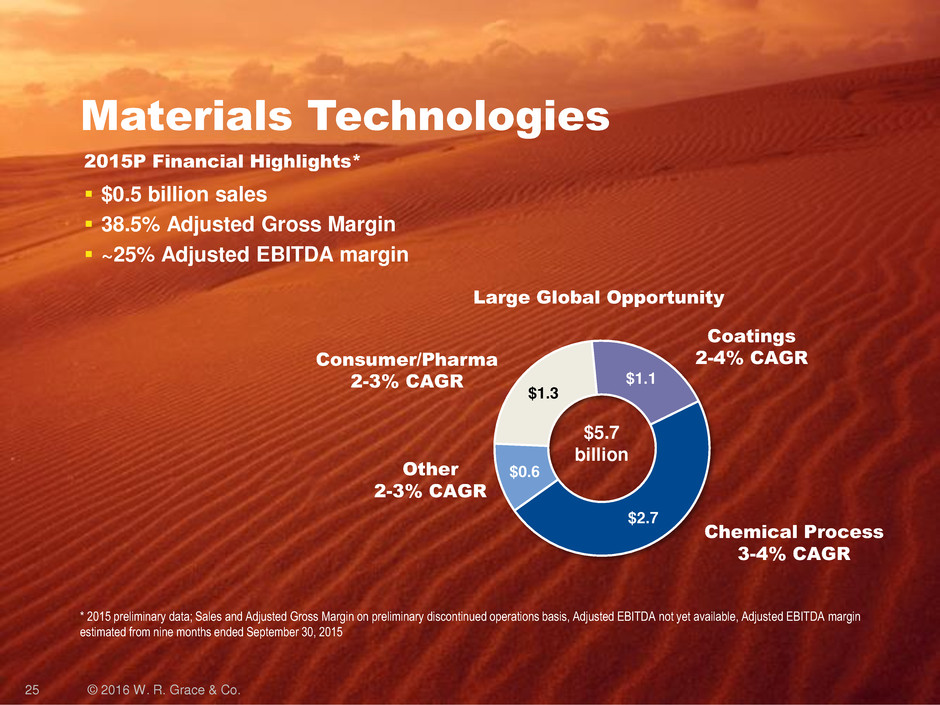
25 © 2016 W. R. Grace & Co. Materials Technologies Consumer/Pharma 2-3% CAGR Chemical Process 3-4% CAGR 2015P Financial Highlights* $0.5 billion sales 38.5% Adjusted Gross Margin ~25% Adjusted EBITDA margin $2.7 $0.6 $1.3 $1.1 $5.7 billion Other 2-3% CAGR Coatings 2-4% CAGR * 2015 preliminary data; Sales and Adjusted Gross Margin on preliminary discontinued operations basis, Adjusted EBITDA not yet available, Adjusted EBITDA margin estimated from nine months ended September 30, 2015 Large Global Opportunity
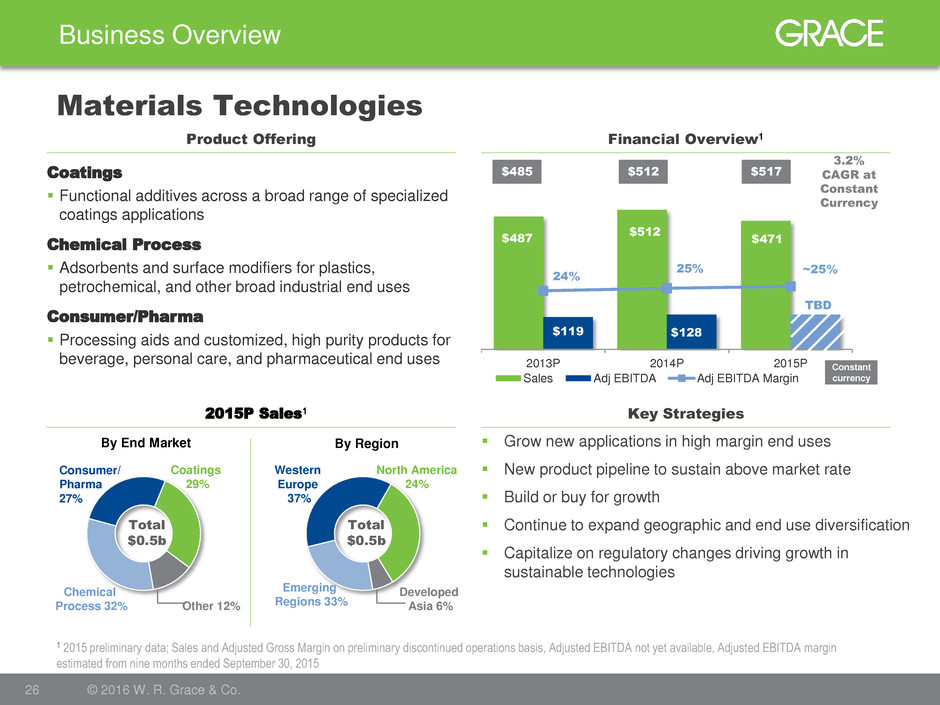
$487 $512 $471 $119 $128 $128 24% 25% ~25% 2013P 2014P 2015P Sales Adj EBITDA Adj EBITDA Margin Coatings 29% Chemical Process 32% Other 12% Consumer/ Pharma 27% North America 24% Emerging Regions 33% Developed Asia 6% Western Europe 37% Business Overview 26 © 2016 W. R. Grace & Co. Materials Technologies Financial Overview1 Product Offering Key Strategies Grow new applications in high margin end uses New product pipeline to sustain above market rate Build or buy for growth Continue to expand geographic and end use diversification Capitalize on regulatory changes driving growth in sustainable technologies Coatings Functional additives across a broad range of specialized coatings applications Chemical Process Adsorbents and surface modifiers for plastics, petrochemical, and other broad industrial end uses Consumer/Pharma Processing aids and customized, high purity products for beverage, personal care, and pharmaceutical end uses 2015P Sales1 By End Market By Region Total $0.5b Total $0.5b 1 2015 preliminary data; Sales and Adjusted Gross Margin on preliminary discontinued operations basis, Adjusted EBITDA not yet available, Adjusted EBITDA margin estimated from nine months ended September 30, 2015 $485 $512 $517 3.2% CAGR at Constant Currency TBD Constant currency
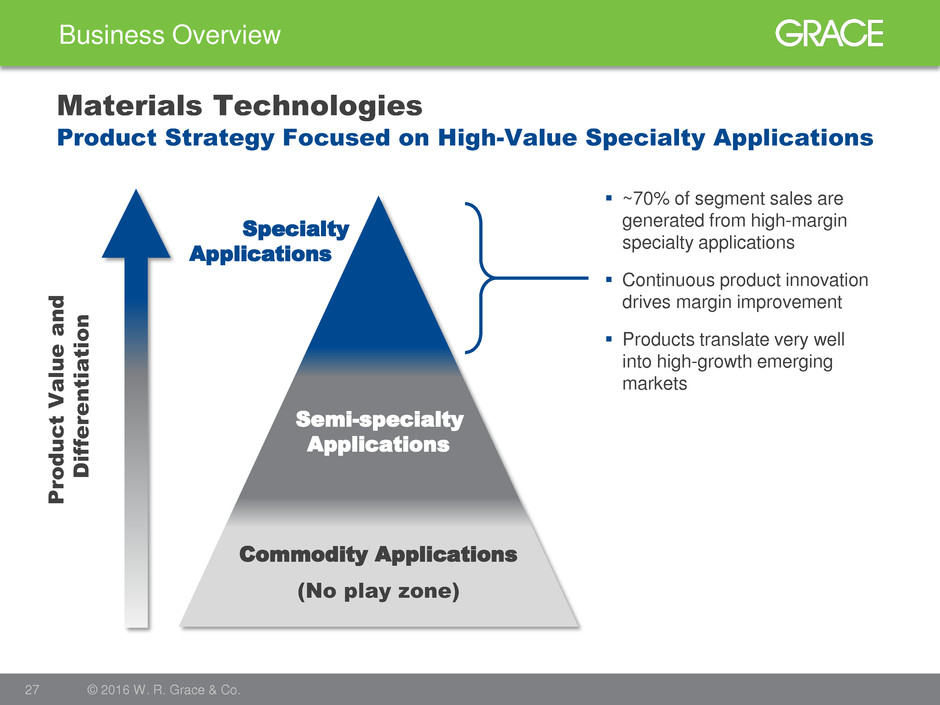
Business Overview 27 © 2016 W. R. Grace & Co. Materials Technologies Specialty Applications Semi-specialty Applications Commodity Applications Pro d u c t V alu e a n d D iff e re n tiatio n ~70% of segment sales are generated from high-margin specialty applications Continuous product innovation drives margin improvement Products translate very well into high-growth emerging markets (No play zone) Product Strategy Focused on High-Value Specialty Applications

Business Overview 28 © 2016 W. R. Grace & Co. Applications Basic Science Organic Chemicals MgCl2 Silica Silica Alumina Alumina Raney Metal BioPharma Chemical Catalysts Materials Technologies Polyolefin Catalysts Refining Catalysts Pharmaceutical Intermediates Molecular Sieve Adsorbents Coatings Additives Reinforcement / Binder Agents Chromatography Products Food/Beverage/Personal Care Processing Aids Surface Modifiers Catalyst Carriers Hydrogenation Catalysts Zeolite Catalysts Ebullating Bed Distillate Hydroprocessing Catalysts Fixed Bed Hydrocracking Fluid Cracking Catalysts FCC Additives Light Olefins Environmental UNIPOL® Licensing Chromium Catalysts Ziegler Natta Catalysts Single Site Catalysts Organometallic Components Polypropylene Catalysts Catalysts Technologies Materials Technologies Businesses Connected Through Materials Science
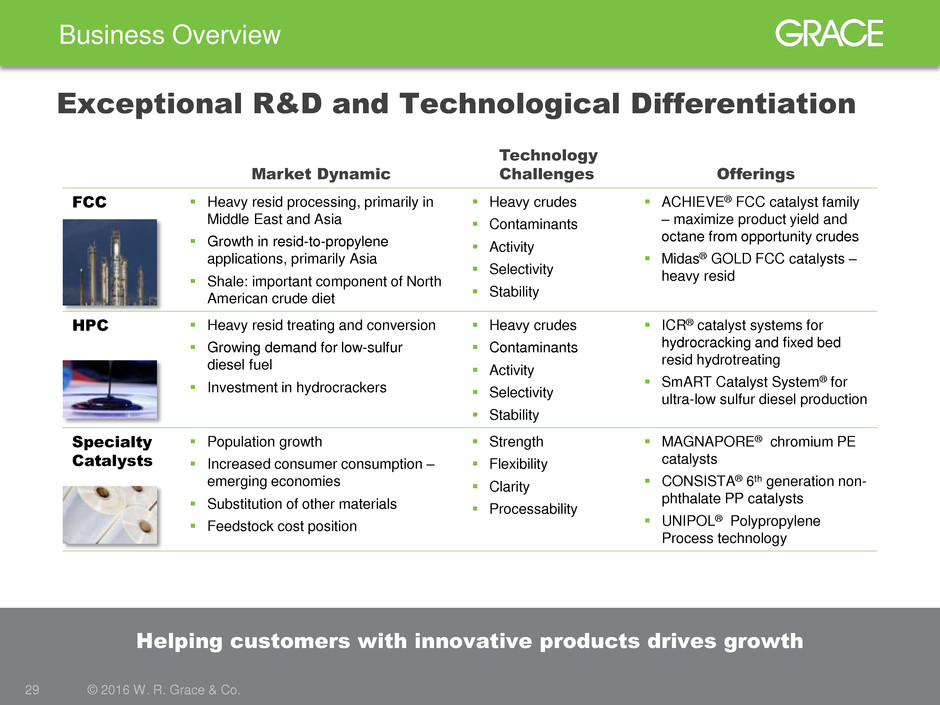
Business Overview 29 © 2016 W. R. Grace & Co. Exceptional R&D and Technological Differentiation Market Dynamic Technology Challenges Offerings FCC Heavy resid processing, primarily in Middle East and Asia Growth in resid-to-propylene applications, primarily Asia Shale: important component of North American crude diet Heavy crudes Contaminants Activity Selectivity Stability ACHIEVE® FCC catalyst family – maximize product yield and octane from opportunity crudes Midas® GOLD FCC catalysts – heavy resid HPC Heavy resid treating and conversion Growing demand for low-sulfur diesel fuel Investment in hydrocrackers Heavy crudes Contaminants Activity Selectivity Stability ICR® catalyst systems for hydrocracking and fixed bed resid hydrotreating SmART Catalyst System® for ultra-low sulfur diesel production Specialty Catalysts Population growth Increased consumer consumption – emerging economies Substitution of other materials Feedstock cost position Strength Flexibility Clarity Processability MAGNAPORE® chromium PE catalysts CONSISTA® 6th generation non- phthalate PP catalysts UNIPOL® Polypropylene Process technology Helping customers with innovative products drives growth
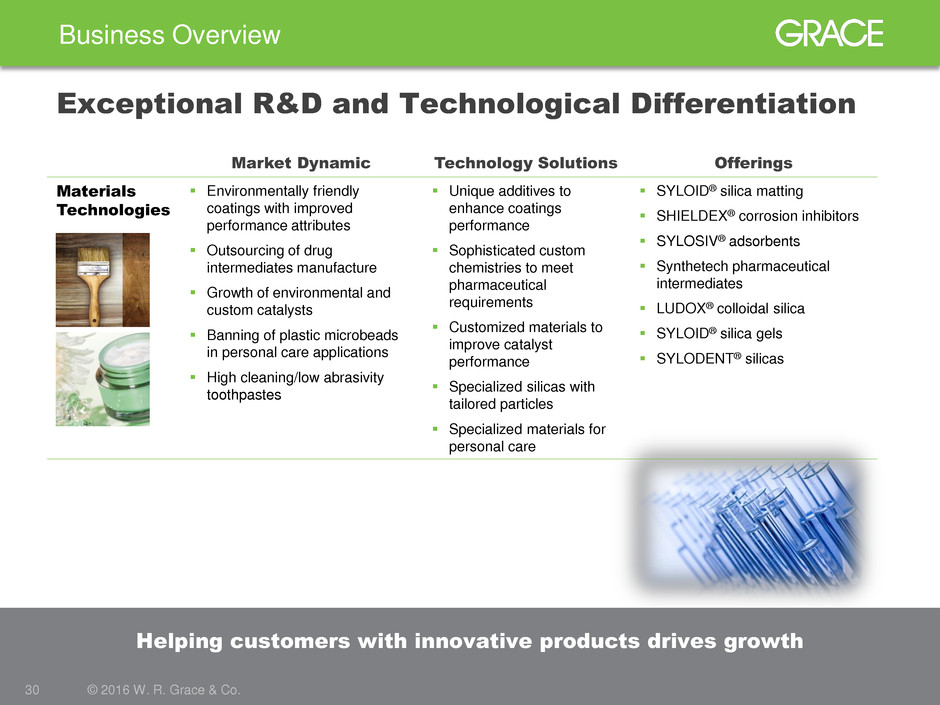
Business Overview 30 © 2016 W. R. Grace & Co. Market Dynamic Technology Solutions Offerings Materials Technologies Environmentally friendly coatings with improved performance attributes Outsourcing of drug intermediates manufacture Growth of environmental and custom catalysts Banning of plastic microbeads in personal care applications High cleaning/low abrasivity toothpastes Unique additives to enhance coatings performance Sophisticated custom chemistries to meet pharmaceutical requirements Customized materials to improve catalyst performance Specialized silicas with tailored particles Specialized materials for personal care SYLOID® silica matting SHIELDEX® corrosion inhibitors SYLOSIV® adsorbents Synthetech pharmaceutical intermediates LUDOX® colloidal silica SYLOID® silica gels SYLODENT® silicas Helping customers with innovative products drives growth Exceptional R&D and Technological Differentiation
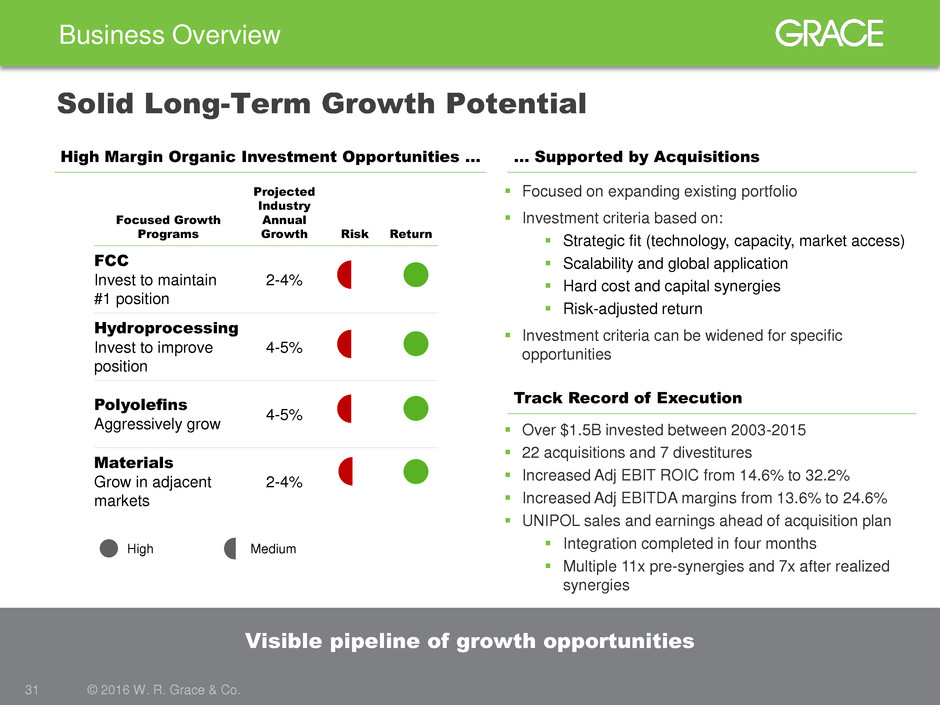
High Margin Organic Investment Opportunities … Business Overview 31 © 2016 W. R. Grace & Co. Visible pipeline of growth opportunities Focused Growth Programs Projected Industry Annual Growth Risk Return FCC Invest to maintain #1 position 2-4% Hydroprocessing Invest to improve position 4-5% Polyolefins Aggressively grow 4-5% Materials Grow in adjacent markets 2-4% … Supported by Acquisitions High Medium Focused on expanding existing portfolio Investment criteria based on: Strategic fit (technology, capacity, market access) Scalability and global application Hard cost and capital synergies Risk-adjusted return Investment criteria can be widened for specific opportunities Track Record of Execution Over $1.5B invested between 2003-2015 22 acquisitions and 7 divestitures Increased Adj EBIT ROIC from 14.6% to 32.2% Increased Adj EBITDA margins from 13.6% to 24.6% UNIPOL sales and earnings ahead of acquisition plan Integration completed in four months Multiple 11x pre-synergies and 7x after realized synergies Solid Long-Term Growth Potential
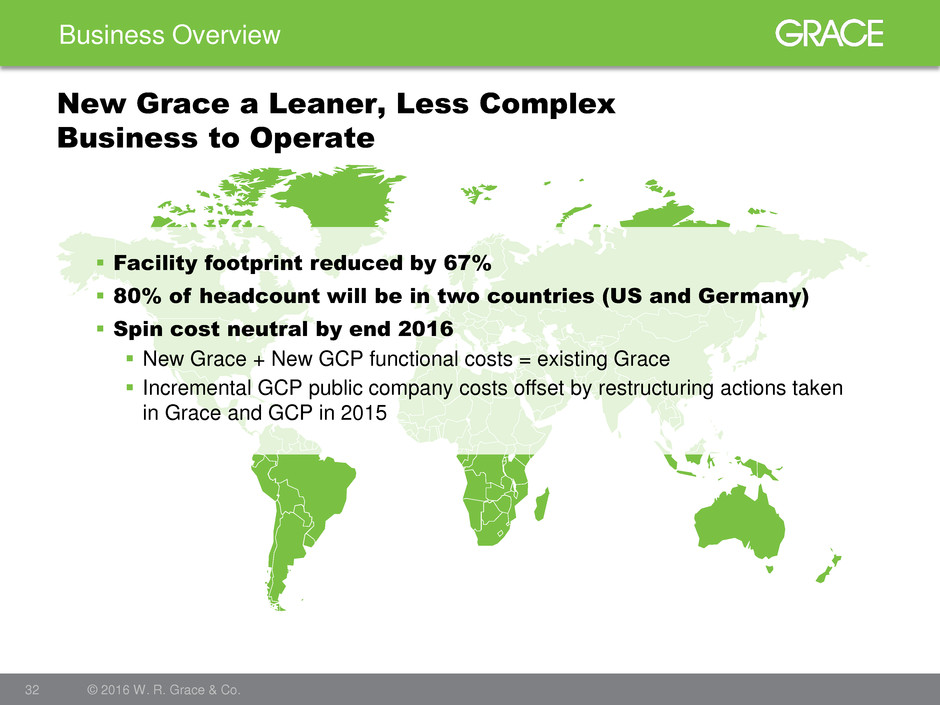
Business Overview 32 © 2016 W. R. Grace & Co. New Grace a Leaner, Less Complex Business to Operate Facility footprint reduced by 67% 80% of headcount will be in two countries (US and Germany) Spin cost neutral by end 2016 New Grace + New GCP functional costs = existing Grace Incremental GCP public company costs offset by restructuring actions taken in Grace and GCP in 2015

Capital Allocation and Structure 33 © 2016 W. R. Grace & Co.
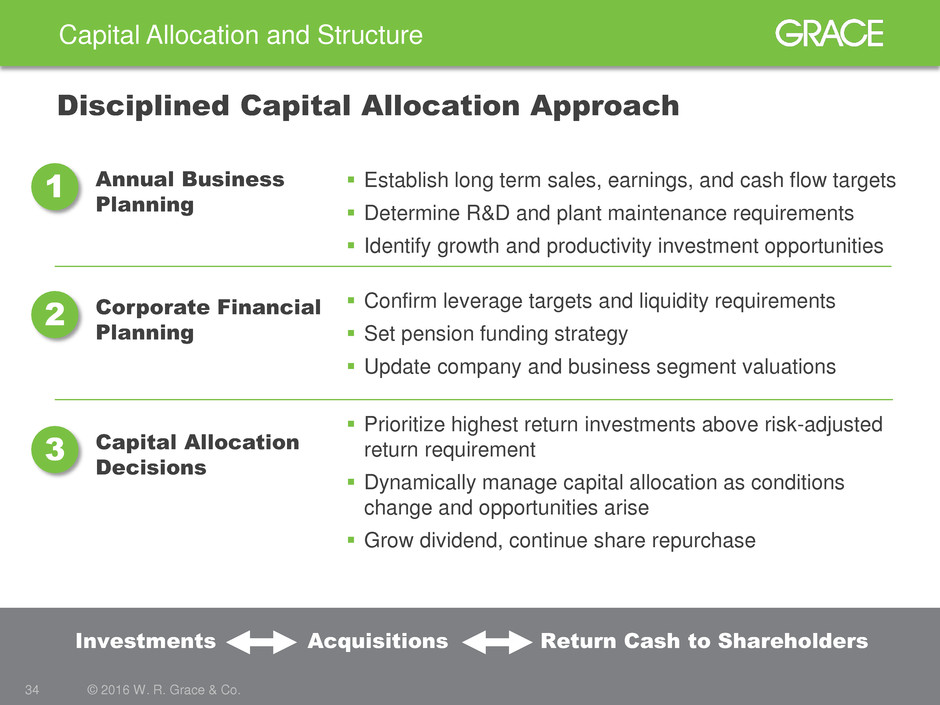
Capital Allocation and Structure 34 © 2016 W. R. Grace & Co. Disciplined Capital Allocation Approach Annual Business Planning Corporate Financial Planning Capital Allocation Decisions Confirm leverage targets and liquidity requirements Set pension funding strategy Update company and business segment valuations Establish long term sales, earnings, and cash flow targets Determine R&D and plant maintenance requirements Identify growth and productivity investment opportunities Prioritize highest return investments above risk-adjusted return requirement Dynamically manage capital allocation as conditions change and opportunities arise Grow dividend, continue share repurchase Investments Acquisitions Return Cash to Shareholders 1 2 3

Capital Allocation and Structure 35 © 2016 W. R. Grace & Co. Capital allocation focused on the highest expected return opportunities High Return Opportunities for Capital Allocation Synergistic, Bolt-on Acquisitions Small bolt-ons: Returns as good as internal investments Larger bolt-ons: Returns above risk- adjusted return requirement Share Repurchases Framed as an investment opportunity with an expected return requirement Returned $1.3 billion to shareholders since 2014 $490 million warrant settlement equivalent to buying 10 million shares at $66 Growth and Productivity Investments Typically our best opportunities High return projects in both segments Large projects with returns >2x WACC
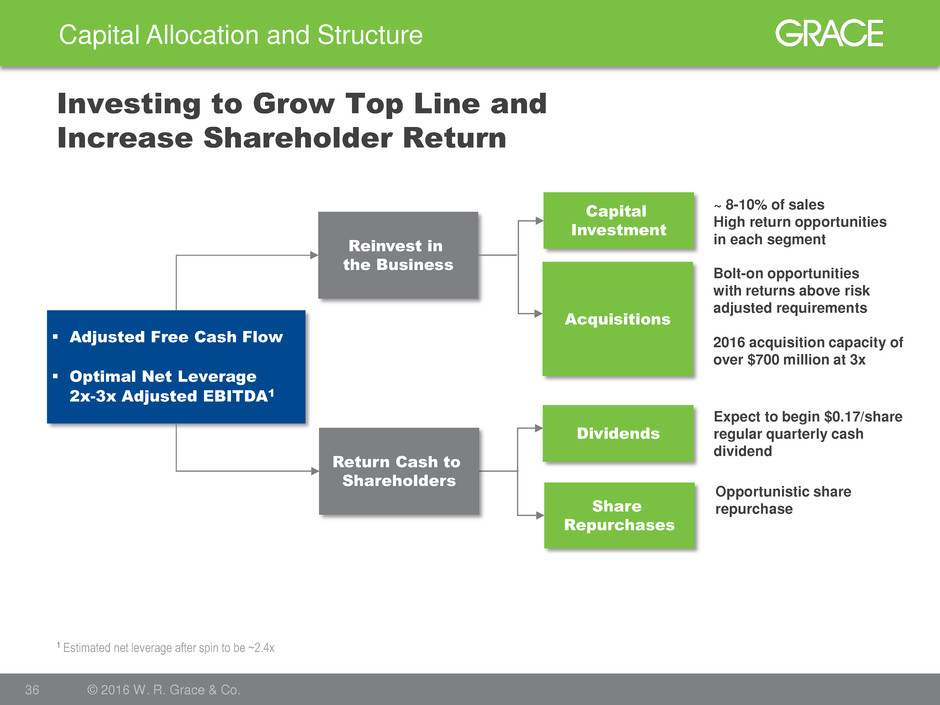
Capital Allocation and Structure 36 © 2016 W. R. Grace & Co. Investing to Grow Top Line and Increase Shareholder Return Adjusted Free Cash Flow Optimal Net Leverage 2x-3x Adjusted EBITDA1 Reinvest in the Business Capital Investment Acquisitions Share Repurchases Dividends ~ 8-10% of sales High return opportunities in each segment Bolt-on opportunities with returns above risk adjusted requirements 2016 acquisition capacity of over $700 million at 3x Return Cash to Shareholders Opportunistic share repurchase Expect to begin $0.17/share regular quarterly cash dividend 1 Estimated net leverage after spin to be ~2.4x
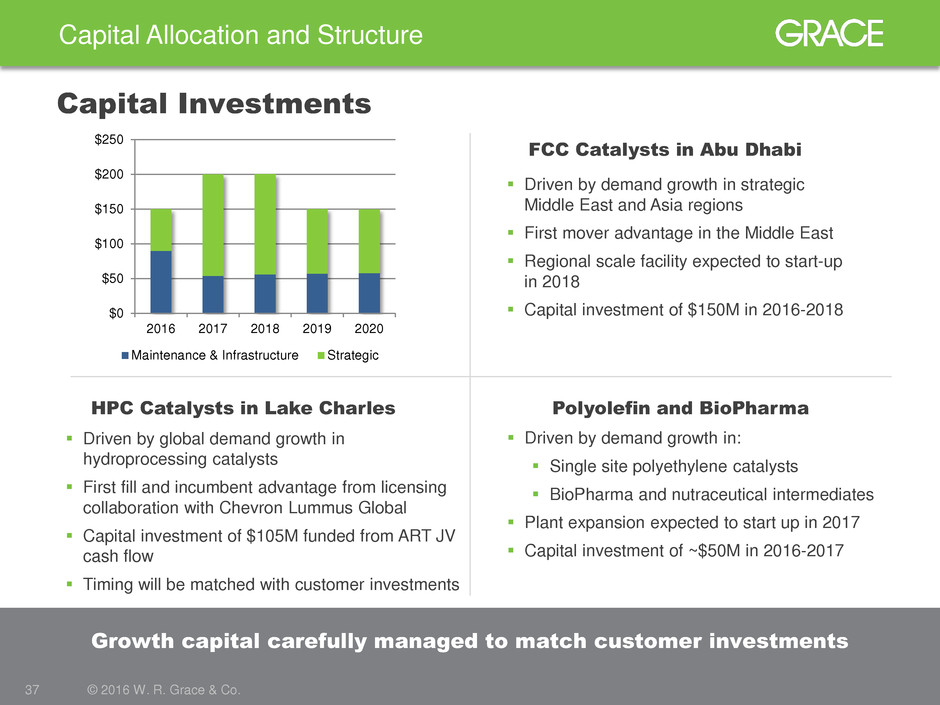
Capital Allocation and Structure 37 © 2016 W. R. Grace & Co. Growth capital carefully managed to match customer investments Capital Investments Driven by demand growth in strategic Middle East and Asia regions First mover advantage in the Middle East Regional scale facility expected to start-up in 2018 Capital investment of $150M in 2016-2018 FCC Catalysts in Abu Dhabi Driven by demand growth in: Single site polyethylene catalysts BioPharma and nutraceutical intermediates Plant expansion expected to start up in 2017 Capital investment of ~$50M in 2016-2017 Polyolefin and BioPharma Driven by global demand growth in hydroprocessing catalysts First fill and incumbent advantage from licensing collaboration with Chevron Lummus Global Capital investment of $105M funded from ART JV cash flow Timing will be matched with customer investments HPC Catalysts in Lake Charles $0 $50 $100 $150 $200 $250 2016 2017 2018 2019 2020 Maintenance & Infrastructure Strategic
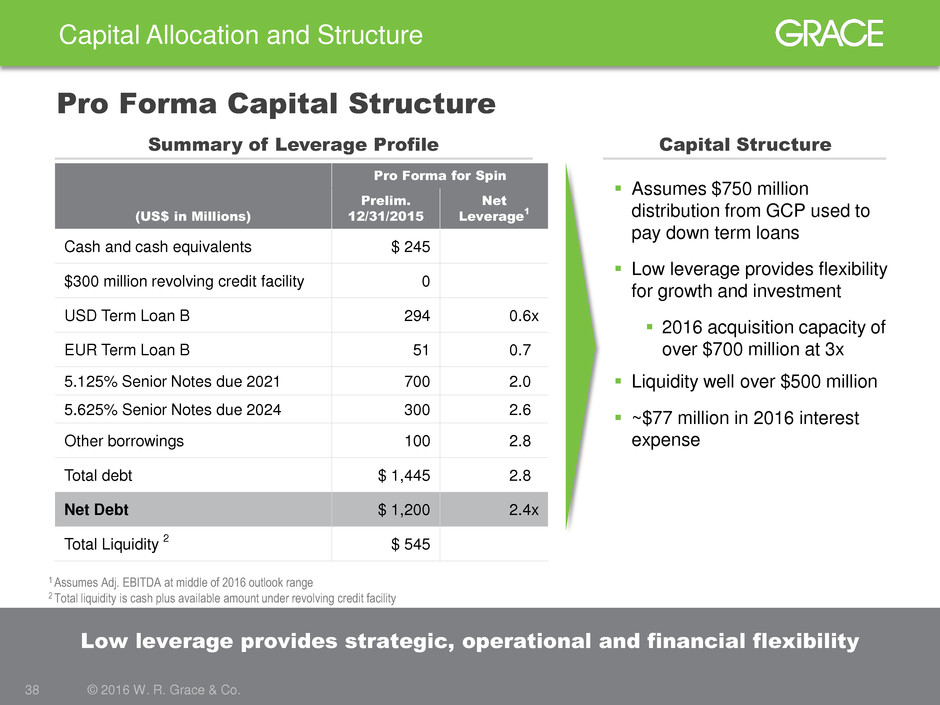
Capital Allocation and Structure 38 © 2016 W. R. Grace & Co. Low leverage provides strategic, operational and financial flexibility Pro Forma Capital Structure Summary of Leverage Profile Assumes $750 million distribution from GCP used to pay down term loans Low leverage provides flexibility for growth and investment 2016 acquisition capacity of over $700 million at 3x Liquidity well over $500 million ~$77 million in 2016 interest expense Capital Structure 1 Assumes Adj. EBITDA at middle of 2016 outlook range 2 Total liquidity is cash plus available amount under revolving credit facility (US$ in Millions) Pro Forma for Spin Prelim. 12/31/2015 Net Leverage 1 Cash and cash equivalents $ 245 $300 million revolving credit facility 0 USD Term Loan B 294 0.6x EUR Term Loan B 51 0.7x 5.125% Senior Notes due 2021 700 2.0x 5.625% Senior Notes due 2024 300 2.6x Other borrowings 100 2.8x Total debt $ 1,445 2.8x Net Debt $ 1,200 2.4x Total Liquidity 2 $ 545
39 © 2016 W. R. Grace & Co. Strong, Clean Balance Sheet All asbestos personal injury liability has been fully resolved Asbestos property damage liability resolved with no probable additional liability $30 million payment to PD Trust in February 2017 accrued at emergence Contingent PD liability not probable Cash requirement for environmental remediation has been less than $10 million per year Does not include cost to remediate Libby mine which is currently not estimable Capital Allocation and Structure Pension plans funded and significantly de-risked US defined benefit plans approximately 90% funded as of 12/31/15 Glide path de-risking strategy in place; no cash contributions required in 2016 Annual cash requirement approximately $10 million for all non- US plans German plan pay-as you go with very long duration
Summary 40 © 2016 W. R. Grace & Co.
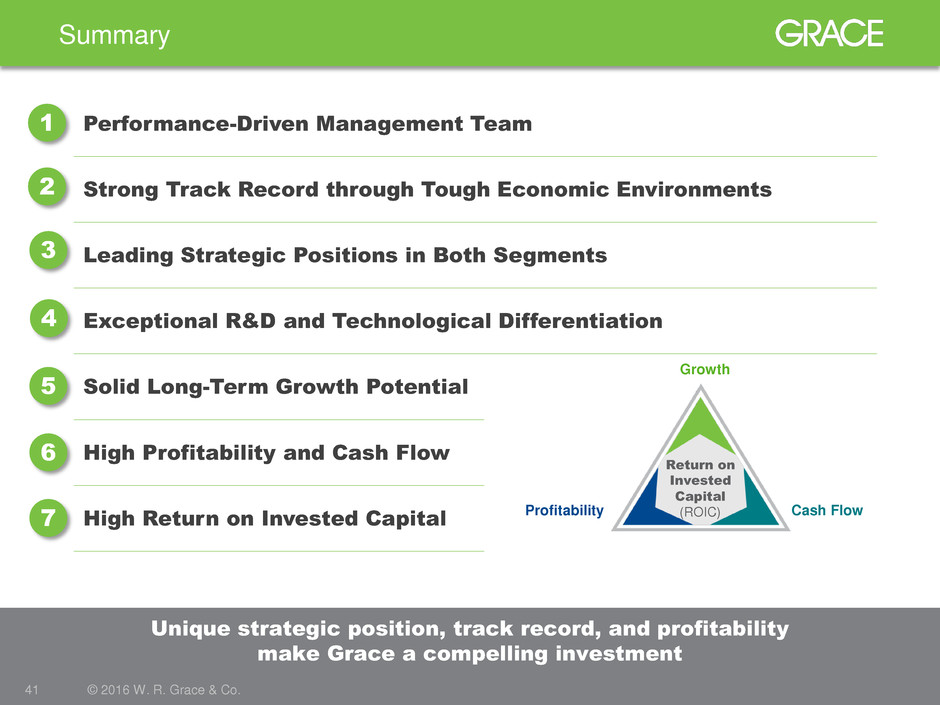
Performance-Driven Management Team Strong Track Record through Tough Economic Environments Leading Strategic Positions in Both Segments Exceptional R&D and Technological Differentiation Solid Long-Term Growth Potential High Profitability and Cash Flow High Return on Invested Capital Summary 41 © 2016 W. R. Grace & Co. 1 2 3 4 5 6 7 Unique strategic position, track record, and profitability make Grace a compelling investment Return on Invested Capital (ROIC) Growth Cash Flow Profitability
Focused. Performance Driven. Innovative. 42 © 2016 W. R. Grace & Co.
43 © 2016 W. R. Grace & Co. For more information visit grace.com or contact: Tania Almond Investor Relations Officer +1 410.531.4590 Tania.Almond@grace.com

Appendix 44 © 2016 W. R. Grace & Co.
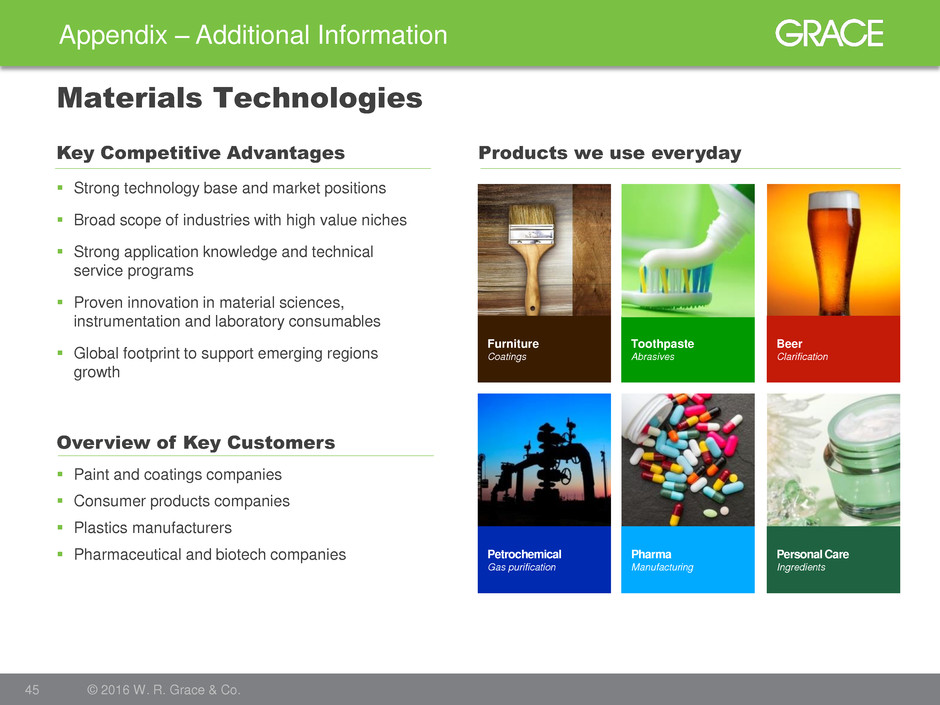
Appendix – Additional Information 45 © 2016 W. R. Grace & Co. Materials Technologies Strong technology base and market positions Broad scope of industries with high value niches Strong application knowledge and technical service programs Proven innovation in material sciences, instrumentation and laboratory consumables Global footprint to support emerging regions growth Overview of Key Customers Key Competitive Advantages Products we use everyday Paint and coatings companies Consumer products companies Plastics manufacturers Pharmaceutical and biotech companies Toothpaste Abrasives Furniture Coatings Beer Clarification Petrochemical Gas purification Personal Care Ingredients Pharma Manufacturing
Appendix – Additional Information 46 © 2016 W. R. Grace & Co. Materials Technologies – End Uses Functional additives that provide matting effects in a variety of specialty coatings such as: In wood coatings, to provide matting without impacting clarity or applications properties In coil coatings, to provide matting without impact on film properties such as durability or chemical resistance In high-performance architectural coatings, to provide superior film smoothness, burnish, and stain resistance Environmentally friendly corrosion inhibitors providing corrosion protection for metal surface coatings Specialty additives to enhance print quality in ink jet coatings applied to paper Desiccant or moisture adsorption protection for moisture sensitive paints In consumer applications: In food and personal care products, as processing aids as free-flow agent or carrier In edible oils, for purification; and in beer and other beverages, for stabilization In toothpaste, as an abrasive or thickener that can carry medicinal ingredients In Pharma applications, such as: In chromatography, to provide chemical purification in drug discovery and production In custom pharmaceutical intermediates, for oncology and other drug therapies Surface modifiers for thin polymer films, to prevent inter-film adhesion without impacting clarity of food and consumer materials packaging Molecular sieve adsorbents to remove moisture in a range of industrial gases including natural gas, cracked gas, and ethanol; also as a specialty desiccant in glass Colloidal dispersions of silica which provide chemical inertness and heat resistance in precision investment castings and industrial catalysts Processing aid in the production of edible oils and bio-diesel Coatings Chemical Process Consumer/Pharma
Appendix – Additional Information 47 © 2016 W. R. Grace & Co. Trademark Notices GRACE®, ACHIEVE®, MIDAS® GOLD, MAGNAPORE®, CONSISTA®, SmART Catalyst System® (Stylized), SYLOID®, SYLOBLOC®, LUDOX®, SYLOBEAD®, CBA®, ADVA®, HEA2®, DCI®, are trademarks, registered in the United States and/or other countries, of W. R. Grace & Co.-Conn. VYDAC® and REVELERIS® are trademarks, registered in the United States and/or other countries, of Alltech Associates, Inc. TALENT | TECHNOLOGY | TRUST™ is a trademark of W. R. Grace & Co.-Conn. UNIPOL® is a trademark of The Dow Chemical Company or an affiliated company of Dow. W. R. Grace & Co.- Conn. and/or its affiliates are licensed to use the UNIPOL trademark in the area of polypropylene. SIX SIGMA® is a trademark, registered in the United States and/or other countries, of Motorola, Inc. This trademark list has been compiled using available published information as of the publication date of this brochure and may not accurately reflect current trademark ownership or status. © Copyright 2016 W. R. Grace & Co.-Conn. All rights reserved.
Appendix – Additional Information 48 © 2016 W. R. Grace & Co. Definition of Non-GAAP Financial Measures We define Adjusted EBIT (a non-GAAP financial measure) to be net income adjusted for interest income and expense; income taxes; costs related to Chapter 11 and asbestos; restructuring and repositioning expenses and asset impairments; pension costs other than service and interest costs, expected returns on plan assets, and amortization of prior service costs/credits; income and expense items related to divested businesses, product lines, and certain other investments; gains and losses on sales of businesses, product lines, and certain other investments; and certain other unusual or infrequent items that are not representative of underlying trends. We define Adjusted EBITDA (a non-GAAP financial measure) to be Adjusted EBIT adjusted for depreciation and amortization. We define Adjusted Earnings Per Share (EPS) (a non-GAAP financial measure) to be diluted EPS adjusted for costs related to Chapter 11 and asbestos; restructuring and repositioning expenses and asset impairments; pension costs other than service and interest costs, expected returns on plan assets, and amortization of prior service costs/credits; income and expense items related to divested businesses, product lines, and certain other investments; gains and losses on sales of businesses, product lines and certain other investments; certain other unusual or infrequent items that are not representative of underlying trends; and certain discrete tax items. We define Adjusted EBIT Return On Invested Capital (a non-GAAP financial measure) to be Adjusted EBIT (on a trailing four quarters basis) divided by the sum of net working capital, properties and equipment and certain other assets and liabilities. We define Adjusted Gross Margin (a non-GAAP financial measure) to be gross margin adjusted for pension-related costs and loss in Venezuela included in cost of goods sold. We use Adjusted EBIT as a performance measure in significant business decisions and in determining certain incentive compensation. We use Adjusted EBIT as a performance measure because it provides improved period-to-period comparability for decision making and compensation purposes, and because it better measures the ongoing earnings results of our strategic and operating decisions by excluding the earnings effects of our Chapter 11 proceedings, asbestos liabilities, restructuring and repositioning activities, and divested businesses. Adjusted EBIT, Adjusted EBITDA, Adjusted EPS, Adjusted EBIT Return On Invested Capital and Adjusted Gross Margin do not purport to represent income measures as defined under U.S. GAAP, and should not be used as alternatives to such measures as an indicator of our performance. These measures are provided to investors and others to improve the period-to-period comparability and peer-to-peer comparability of our financial results, and to ensure that investors understand the information we use to evaluate the performance of our businesses. Adjusted EBIT has material limitations as an operating performance measure because it excludes costs related to Chapter 11 and asbestos and may exclude income and expenses from restructuring and repositioning activities and divested businesses, which historically have been material components of our net income. Adjusted EBITDA also has material limitations as an operating performance measure because it excludes the impact of depreciation and amortization expense. Our business is substantially dependent on the successful deployment of capital, and depreciation and amortization expense is a necessary element of our costs. We compensate for the limitations of these measurements by using these indicators together with net income as measured under U.S. GAAP to present a complete analysis of our results of operations. Adjusted EBIT and Adjusted EBITDA should be evaluated together with net income measured under U.S. GAAP for a complete understanding of our results of operations. Adjusted Cash Tax Rate means cash paid for income taxes, net of refunds, excluding cash paid for separation-related taxes, divided by Adjusted EBIT plus interest expense.


