Exhibit 99.1
© 2009 W. R. Grace & Co. W. R. Grace & Co. Company Overview April 27, 2009 |
© 2009 W. R. Grace & Co. 2 Disclaimer Safe Harbor Statement under the Private Securities Litigation Reform Act of 1995 This presentation contains forward-looking statements, that is, information related to future, not past, events. Such information generally includes the words “believes,” “plans,” “intends,” “targets,” “will,” “expects,” “anticipates,” “continues” or similar expressions. For these statements, Grace claims the protection of the safe harbor for forward-looking statements contained in the Private Securities Litigation Reform Act of 1995. Grace is subject to risks and uncertainties that could cause actual results to differ materially from those projected in the forward-looking statements or that could cause other forward-looking information to prove incorrect. Factors that could cause actual results to materially differ from those contained in the forward-looking statements include: Grace’s bankruptcy and proposed plan of reorganization, the availability of financing for Grace’s proposed plan of reorganization, Grace’s legal proceedings (especially the Montana criminal proceeding and environmental proceedings), the cost and availability of raw materials and energy, Grace’s unfunded pension liabilities, costs of environmental compliance, risks related to foreign operations, especially security, regulation and currency risks, and those factors set forth in Grace’s most recent Annual Report on Form 10-K, quarterly report on Form 10-Q and current reports on Form 8-K, which have been filed with the Securities and Exchange Commission and are readily available on the Internet at www.sec.gov. Reported results should not be considered as an indication of future performance. Readers are cautioned not to place undue reliance on forward-looking statements, which speak only as of the date thereof. Grace undertakes no obligation to publicly release any revisions to the forward-looking statements contained in this presentation, or to update them to reflect events or circumstances occurring after the date of this presentation. Non-GAAP Financial Terms These slides contain certain “non-GAAP financial terms” which are defined in the Appendix. Reconciliations of non-GAAP terms to the closest GAAP term (i.e., net income and net cash provided by operating activities) are provided in the Appendix. |
© 2009 W. R. Grace & Co. 3 W. R. Grace & Co. As one of the world’s leading specialty chemical and materials companies, we apply innovative technologies, and provide value-added solutions globally. We are dedicated to our customers. They trust us to provide products, knowledge, technologies, services and the people to make their products work better. Enriching Lives, Everywhere.™ Grace Founded 1854 1865 W. R. Grace & Co. relocates from Peru to New York City. 1890 Grace inaugurates steamship service between New York and South America. 1953 Grace lists on New York Stock Exchange with ticker symbol GRA. 1954 Grace acquires Davison Chemical Company and Dewey & Almy Chemical Company, establishing the basis for the Company’s catalysts, packaging, silicas and construction product lines. 1972 Grace builds its first European manufacturing facility for catalysts and silica products in Worms, Germany. 1987 Grace becomes the first wholly foreign-owned company to do business in The People’s Republic of China with a can sealant plant in Shanghai. 2001 Grace files for protection under Chapter 11 of the U.S. bankruptcy code to address its asbestos liabilities. 2003 Fred Festa joins Grace. 2007 Grace opens a new facility in India, and expands R&D capabilities in Poland and China. 2008 Grace expands presence in Middle East with new regional office in Dubai. |
Why Grace? Robust performance record built on delivering value to customers Balanced business profile with opportunities in large global industry segments Steady growth driven by innovation and geographic expansion Experienced management team focused on execution and committed to our shareholders, customers and employees © 2009 W. R. Grace & Co. 4 |
© 2009 W. R. Grace & Co. 5 14.5% CAGR Grace Core EBIT* Core EBIT is presented in public reports as “Pre-tax income from core operations”. Amounts have been restated to reflect a change from LIFO to FIFO, where applicable. Performance Record Grace Core EBIT Return On Invested Capital* 10.9% CAGR Grace Sales 22.2% CAGR Operating Free Cash Flow* *Definitions of non-GAAP financial terms and reconciliations to the closest GAAP term are provided in the Appendix. |
© 2009 W. R. Grace & Co. 6 Delivering Value to Customers Grace is known for its technology, product performance and customer service We are a company dedicated to our customers. They trust us to provide the products, knowledge, technologies, services and people needed to make their products work better and help them succeed. Our products are highly integrated into our customers’ manufacturing processes and formulations By working closely with our customers, we help them react quickly to the changing needs of their customers Our products are a small part of our customers’ overall costs, but are critical to product quality and performance Our multi-tiered technical service support is built on local and regional analytical services, backed by central research and development centers We have a high-touch approach to customer service: 25% of our employees are in customer-facing roles |
© 2009 W. R. Grace & Co. 7 Balanced Business Profile $1.3 billion Europe/Africa $1.2 billion North America $0.6 billion Asia Pacific $0.2 billion Latin America 17% 36% 40% 7% $1.1 billion Grace Construction Products $1.1 billion Grace Davison Refining Technologies $0.7 billion Grace Davison Materials Technologies $0.4 billion Grace Davison Specialty Technologies 35% 11% 33% 21% 2008 Grace (Sales by Product Group) 2008 Grace (Sales by Region) |
© 2009 W. R. Grace & Co. 8 Large Global Industry Segments Energy and Refining Consumer, Industrial and Packaging Plastics, Petrochemicals and Biochemical Building and Infrastructure Industry Segments Industry Size (2008) We serve very large industries with significant growth potential Refining Technologies Materials Technologies Specialty Technologies Construction Products Sales (2008) Grace Product Group Pharma, Life Science and Analytical $2.9 trillion $9 trillion $3+ trillion $780 billion $6.5 trillion $1.1 billion $0.7 billion $0.4 billion $1.1 billion |
© 2009 W. R. Grace & Co. 9 Growth Drivers Refining Technologies Materials Technologies Specialty Technologies Growth Drivers We serve very large industries with significant growth potential Sales (2008) Grace Product Group $1.1 billion $0.7 billion $0.4 billion Construction Products $1.1 billion Global demand for energy Government regulations / legislation Technology Emerging economies Lifestyle and consumer spending habits Sustainability “Green” / renewables GDP / population growth Government regulations / legislation Economic development Economic development Population growth Energy / environmental conservation Government regulations / legislation |
© 2009 W. R. Grace & Co. 10 Innovation Grace is a market-driven company that provides technically advanced solutions to customer challenges. Our goal is to provide products and services that make our customers successful. History of innovation and industry-leading technology Over 150 years of material science expertise Over 75 years in construction products New products added and existing products adapted to new opportunities Internal innovation processes Collaborative programs with customers, suppliers and universities |
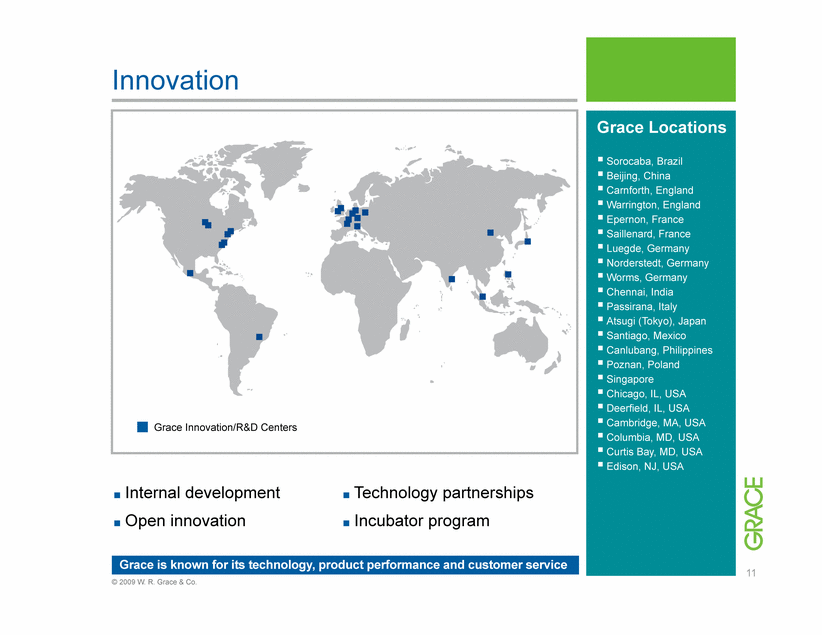
© 2009 W. R. Grace & Co. 11 Innovation Grace is known for its technology, product performance and customer service Internal development Open innovation Grace Locations Sorocaba, Brazil Beijing, China Carnforth, England Warrington, England Epernon, France Saillenard, France Luegde, Germany Norderstedt, Germany Worms, Germany Chennai, India Passirana, Italy Atsugi (Tokyo), Japan Santiago, Mexico Canlubang, Philippines Poznan, Poland Singapore Chicago, IL, USA Deerfield, IL, USA Cambridge, MA, USA Columbia, MD, USA Curtis Bay, MD, USA Edison, NJ, USA Grace Innovation/R&D Centers Technology partnerships Incubator program |
© 2009 W. R. Grace & Co. 12 Geographic Expansion Tremendous opportunities in emerging markets 2003 $2.0 billion 2008 $3.3 billion Grace Sales Grace Sales to Advanced Economies* Grace Sales to Emerging and Developing Economies* 22% 78% 29% 71% *As defined by IMF 17.0% CAGR 10.7% CAGR |
© 2009 W. R. Grace & Co. 13 Fred Festa Chairman, President and Chief Executive Officer, W. R. Grace & Co. Joined the company as president and chief operating officer in November 2003 and assumed the CEO responsibilities in June 2005 Former CEO of ICG Commerce; held general management and finance positions at AlliedSignal (now Honeywell) and General Electric Greg Poling President, Grace Davison Responsible for Grace Davison’s Refining Technologies, Materials Technologies, Specialty Technologies product groups Joined Grace in 1977; held leadership positions in sales, marketing, and business development in a variety of Grace businesses; named President of Grace Davison in 2004 Hudson La Force Senior Vice President and Chief Financial Officer, W. R. Grace & Co. Joined Grace in April 2008, after serving as Chief Operating Officer at the U.S. Department of Education Prior general management and finance positions at Dell, AlliedSignal (now Honeywell) and Emerson Electric Co. Andrew Bonham President, Grace Construction Products Responsible for Grace’s global constructions products group Joined Grace in 2005; twenty-five years of management experience including positions held with AlliedSignal (now Honeywell) and General Electric Management Team |
© 2009 W. R. Grace & Co. 14 |
© 2009 W. R. Grace & Co. 15 $2.2B Grace Davison $1.1B Grace Construction Products $1.1B Refining Technologies $0.7B Materials Technologies $0.4B Specialty Technologies 32% 51% 17% 65% 35% Business Profile Grace Davison Specialty chemicals, materials and formulation technologies for: Energy and Refining Consumer, Industrial and Packaging Plastics, Petrochemical and Biochemical Pharmaceutical, Life Sciences and Analytical Chemistry 2008 Grace (Sales) 2008 Grace Davison Grace Davison (Sales by Product Groups) |
© 2009 W. R. Grace & Co. 16 Fluid cracking catalysts and additives that enable petroleum refiners to improve yields and quality of transportation fuels (gasoline, diesel) and other petrochemical products Hydroprocessing catalysts that upgrade heavy oil and remove sulfur and other contaminants from petroleum Refining Technologies Grace Davison Products that enhance the quality of life and provide value Catalysts and additives |
© 2009 W. R. Grace & Co. 17 Grace Davison Refining Technologies Industry Segments Energy and Refining Industry Segment Size $2.9 trillion Product group: World’s leading supplier of FCC catalysts and additives to the petroleum refining industry ART (a joint venture with Chevron Products Company) – a leading supplier of hydroprocessing catalysts to the petroleum refining industry Opportunities: Deliver solutions and value to customers Commercialize new products tailored to industry trends of dieselization, clean fuels and heavy oil processing Optimize capacity utilization and manufacturing flexibility Solve raw material challenges through supply chain initiatives and focus Grace Growth Grace Davison Refining Technologies Sales Petroleum Refining Catalyst Demand 13% CAGR 4% CAGR Grace Davison Refining Technologies Sales Petroleum Refining Catalyst Demand |
© 2009 W. R. Grace & Co. 18 Materials Technologies Consumer Goods Additives and Process Aids Free-flow and functional additives for food, cosmetics and life science products Toothpaste thickeners and high-cleaning abrasives Processing aids for edible oils and beer Packaging Products Sealants and coatings for rigid metal food, beverage and consumer packaging Closure sealants and coatings for metal caps and crowns, plastic caps and drum/pail closures Oxygen and water scavenging products for active packagings Coatings and Print Media Additives Pigments providing matting, scavenging or extender functionality Additives and formulations for high-resolution print and ink jet media Non-toxic heavy metal-free anticorrosion products Industrial Applications Reinforcement for green tires and rubbers Drying agents for dual pane windows and various other applications High temperature binders for metal casting processes Multifunctional additives, process aids, and packaging products Grace Davison Products that enhance the quality of life and provide value |
© 2009 W. R. Grace & Co. 19 Grace Davison Materials Technologies Industry Segments Consumer, Industrial and Packaging Industry Segment Size $9 trillion Product group: Leading supplier of material-based specialty products and formulations for a variety of food/beverage, consumer, coatings and industrial markets Opportunities: Leverage growth in emerging regions Launch new high-value products for specific niche markets such as sustainable coating technologies, high-resolution print media, high cleaning toothpaste formulations, green tires, EHS-friendly sealants and active packagings Leverage global manufacturing and supply chain capabilities Provide high-level global technical service support Grace Growth Grace Davison Materials Technologies Sales Global Gross Domestic Product Grace Davison Materials Technologies Sales Global GDP Index (2003 = 100) 6% CAGR 4% CAGR $9 trillion = Grace estimate based on data from Standard & Poor’s Industry Reports (2007) for paper, household nondurable and durable, appliances, furniture, food, Beverages, electronics, auto and auto parts, and home improvement. |
© 2009 W. R. Grace & Co. 20 Specialty Technologies Products that enhance the quality of life and provide value Grace Davison Specialty Catalysts and Process Technologies Catalyst systems, supports and process technologies for the petrochemical industry including processing plastic resins for high performance plastic pipes, plastic films, household containers, automobile and appliance parts Renewables Technologies Specialty catalysts and adsorbents for enhanced renewable fuels (biodiesel and bioethanol) production Discovery Sciences High performance silica media, chromatography systems and accessories for analytical chemistry applications, including drug discovery and purification Specialized applications in high-growth industries |
© 2009 W. R. Grace & Co. 21 Grace Davison Specialty Technologies Industry Segments Plastics, Petrochemicals and Biochemicals Industry Segment Size $3+ trillion Industry Segments Pharma, Life Science and Analytical Industry Segment Size $780 billion Product group: Specialty Catalysts and Process Technologies: wide range of specially-designed catalysts, supports and process technologies for the petrochemical industry and renewable segments Discovery Sciences: Provider of material-based value-added solutions for life sciences and analytical sciences applications Opportunities: Invest in new technologies and products in: polypropylene, polyethylene, and single site catalysts, and specialty media and flash systems Build renewables product line for fuels and petrochemicals based on materials and catalysts Leverage global manufacturing capability Continue acquisition strategy Grace Growth World Polyolefin Demand World Polyolefin Demand (million metric tonnes) 14% CAGR 4% CAGR Grace Davison Specialty Technologies Sales Grace Davison Specialty Technologies Sales |
© 2009 W. R. Grace & Co. 22 Worldwide Leader in Materials Science Silica gel for World War I gas masks – to adsorb vapors and gases Alumina used in the production of the world’s first fluid cracking catalyst for gasoline Polyolefin catalysts to manufacture plastic resins – used for hula hoops History Innovation Today Grace Davison New materials New technology Applications knowledge Process expertise Materials and new technologies leading to new industry segments, value-added applications, and performance-enhancing attributes |
© 2009 W. R. Grace & Co. 23 |
© 2009 W. R. Grace & Co. 24 2008 Grace Construction Products $0.4 billion Europe/Africa $0.6 billion Americas $0.1 billion Asia Pacific 52% 35% 13% Business Profile Leading provider of specialty construction materials, systems and services that strengthen, enhance and protect structures Products include: Concrete admixtures Structural fibers Cement, concrete, and masonry processing additives Products for architectural concrete Air and vapor barriers Roofing underlayments Waterproofing systems Fire protection products 2008 Grace (Sales) $2.2B Grace Davison $1.1B Grace Construction Products Grace Construction Products 65% 35% (Sales by Product Lines) $0.7 billion Construction Chemicals $0.4 billion Building Materials 66% 34% Grace Construction Products (Sales by Region) |
Infrastructure Applications Concrete Admixtures Corrosion inhibitors, superplasticizers, self-consolidating concrete, set accelerators, shrinkage reducers, structural fibers, water reducers Bridge Deck Waterproofing Systems To view our infrastructure applications animation, click here > http://www.grace. com/Media/MediaKit/ProductVideo/Bridge.aspx Products that strengthen, protect and enhance structures 25 © 2009 W.R. Grace & Co. 25 |
Commercial Building Applications Grace Construction Products Concrete Admixtures Superplasticizers, self-consolidating concrete, set accelerators, shrinkage reducers, structural fibers, water reducers Decorative Concrete Color pigments and surface retarders Foundation Waterproofing Pre-applied blindside sheet waterproofing, post-applied sheet and spray-applied membranes Cementitious Fireproofing Fire Stopping Materials, Wall and Window Flashing Membranes Spray-Applied Wall Membranes and Vapor Barriers To view our commercial applications animation, click here > http://www.drace.com/Media/MediaKit/ProductVideo/Building.aspx Products that strengthen, protect and enhance structures © 2009 W.R. Grace & Co. 26 |
Residential Applications Grace Construction Products Concrete Admixtures Self-consolidating concrete, set accelerators, shrinkage reducers, structural fibers, water reducers Decorative Concrete Color pigments and surface retarders Foundation Waterproofing Spray-applied and sheet-applied Window and Door Flashings Roofing Membranes Roof detail membranes, roofing underlayments To view our residential applications animation, click here > http://www.grace.com/Media/MediaKit/ProductVideo/House.aspx Products that strengthen, protect and enhance structures 27 © 2009 W. R. Grace & Co. |
© 2009 W. R. Grace & Co. 28 Grace Construction Products Industry Segments Building and Infrastructure Industry Segment Size $6.5 trillion Product group: Construction chemicals include a full line of specialty additives used by producers of cement and concrete products Building products include specialized products for waterproofing commercial and residential structures, plus air and vapor barriers and fire protection products used in commercial buildings Opportunities: Develop new market niches to address customer needs Increase presence in repair and renovation markets Localize appropriate business models for emerging markets and drive applicable technology transfer Leverage R&D and geographic footprint to drive differentiated technology solutions Grace Growth Grace Construction Products Sales Construction Products Grace Construction Products Sales World Construction Spending 11% CAGR World Construction Spending 9% CAGR |
© 2009 W. R. Grace & Co. 29 History Innovation Today Culture of Innovation Protecting the world’s most important structures Grace Construction Products High performance cement additives, concrete admixtures, innovative waterproofing and air barrier systems and fire protection products give flexibility to architects, engineers and contractors via productivity, aesthetics and performance. Dewey & Almy (acquired by Grace in 1954) pioneered the use of additives as processing aids in cement production Grace was a leader in developing chemical admixtures to enhance the strength and durability of concrete Grace developed waterproofing systems for protection of commercial structures and extended their use into residential applications Grace R&D teams continually evaluate building materials and practices around the world and have solved some of the industry’s most difficult challenges |
© 2009 W. R. Grace & Co. 30 |
Why Grace? Strong performance even while in Chapter 11 • Double-digit revenue growth 2003-2007 • 2008 revenue growth driven by improved pricing in a challenging market • Core EBIT growth every year 2003-2008; CAGR 14.5% • Proven leadership position in attractive industry segments • Balanced business portfolio; global reach Opportunities Post-Emergence • Upside valuation potential without Chapter 11 “overhang” - and associated expenses • Emphasis on innovation and investment in R&D as cornerstone of growth • Further investment in global footprint • Greater ability to capture opportunities in our large global industry segments © 2009 W. R. Grace & Co. |
W. R. Grace & Co. Contact Us 7500 Grace Drive Columbia, Maryland 21044 USA Investor Relations +1 410.531.4167 investor.relations@grace.com www.grace.com GRACE Enriching Lives, Everywhere.TM © 2009 W. R. Grace & Co. 32 |
© 2009 W. R. Grace & Co. 33 Appendix Non-GAAP Financial Terms Core EBIT (Earnings Before Interest and Taxes) or pre-tax income from core operations, is net income adjusted for income taxes, Chapter 11 expenses, interest income and expense, and pre-tax loss from noncore activities. We use core EBIT as a profitability factor in all significant business decisions and as a performance factor in determining certain incentive compensation. Return on Invested Capital is pre-tax income from core operations divided by the sum of net working capital, properties and equipment and other assets and liabilities. We use return on invested capital as a performance measure in evaluating operating results, in making operating and investment decisions and in balancing the growth and profitability of our operations. Operating Free Cash Flow is pre-tax income from core operations before depreciation and amortization plus pension expense plus or minus the change in net working capital and specified other assets and liabilities of our core operations minus capital expenditures. We use operating free cash flow as the cash flow measure in evaluating our operating results. For 2009, operating free cash flow is a performance factor in determining certain incentive compensation. |
© 2009 W. R. Grace & Co. 34 Appendix Core EBIT, operating free cash flow, and return on invested capital do not purport to represent income or cash flow measures as defined under U.S. generally accepted accounting principles, and you should not consider them an alternative to such measures as an indicator of our performance. We provide these measures so you can distinguish the operating results of our current business base from the income and expenses of our past businesses, discontinued products, and corporate legacies, and the effect of our Chapter 11 proceedings, and to ensure that you understand the key data that management uses to evaluate our results of operations. These measures have material limitations as operating performance measures because they exclude income, expenses, assets and liabilities that comprise our noncore activities, which include, among other things, provisions for asbestos-related litigations and environmental remediation, income from insurance settlements, and legal costs, which have been material. We compensate for the limitations of these measurements by using these indicators together with net income and net cash provided by operating activities as measured under U.S. generally accepted accounting principles to present a complete analysis of our operating performance. You should evaluate these measures in conjunction with our Consolidated Financial Statements as presented in our annual reports on Form 10-K for a more complete analysis of our financial results. |
© 2009 W. R. Grace & Co. 35 Appendix Reconciliation of Non-GAAP Financial Measures |
© 2009 W. R. Grace & Co. 36 Appendix Reconciliation of Non-GAAP Financial Measures |