UNITED STATES
SECURITIES AND EXCHANGE COMMISSION
WASHINGTON, D.C. 20549
FORM 10-Q
(Mark One)
| x | Quarterly Report Pursuant to Section 13 or 15(d) of the Securities Exchange Act of 1934 |
For the quarterly period ended March 31, 2007
or
| ¨ | Transition Report Pursuant to Section 13 or 15(d) of the Securities Exchange Act of 1934 |
For the transition period from to
Commission file number 1-14760
RAIT FINANCIAL TRUST
(Exact name of registrant as specified in its charter)
| | |
| Maryland | | 23-2919819 |
State or other jurisdiction of incorporation or organization | | (I.R.S. Employer Identification No.) |
| | |
| 2929 Arch Street, 17th Floor, Philadelphia, PA | | 19104 |
| (Address of principal executive offices) | | (Zip Code) |
(215) 861-7900
Registrant’s telephone number
Indicate by check mark whether the registrant (1) has filed all reports required to be filed by Section 13 or 15(d) of the Securities Exchange Act of 1934 during the preceding 12 months (or for such shorter period that the registrant was required to file such reports), and (2) has been subject to such filing requirements for the past 90 days. x Yes ¨ No
Indicate by check mark whether the registrant is a large accelerated filer, an accelerated filer, or a non-accelerated filer. See definition of “accelerated filer and large accelerated filer” in Rule 12b-2 of the Exchange Act (Check one):
x Large Accelerated Filer ¨ Accelerated Filer ¨ Non-Accelerated Filer
Indicate by check mark whether the registrant is a shell company (as defined in Rule 12b-2 of the Exchange Act). ¨ Yes x No
A total of 63,685,413 common shares of beneficial interest, par value $0.01 per share, of the registrant were outstanding as of May 1, 2007.
RAIT FINANCIAL TRUST
TABLE OF CONTENTS
PART I - FINANCIAL INFORMATION
| Item 1. | - Financial Statements |
RAIT Financial Trust
Consolidated Balance Sheets
As of March 31, 2007 and December 31, 2006
(Unaudited and dollars in thousands, except share and per share information)
| | | | | | | | |
| | | March 31,
2007 | | | December 31,
2006 | |
| Assets | | | | | | | | |
Investments in securities | | | | | | | | |
Available-for-sale securities | | $ | 4,743,748 | | | $ | 3,978,999 | |
Security-related receivables | | | 1,378,843 | | | | 1,159,312 | |
| | | | | | | | |
Total investments in securities | | | 6,122,591 | | | | 5,138,311 | |
Investments in mortgages and loans, at amortized cost | | | | | | | | |
Residential mortgages and mortgage-related receivables | | | 4,495,796 | | | | 4,676,950 | |
Commercial mortgages, mezzanine loans and other loans | | | 1,864,727 | | | | 1,250,945 | |
Allowance for losses | | | (8,716 | ) | | | (5,345 | ) |
| | | | | | | | |
Total investments in mortgages and loans | | | 6,351,807 | | | | 5,922,550 | |
Investments in real estate interests | | | 163,866 | | | | 139,132 | |
Real estate interests held for sale | | | 13,254 | | | | — | |
Cash and cash equivalents | | | 169,681 | | | | 99,367 | |
Restricted cash | | | 209,463 | | | | 292,869 | |
Accrued interest receivable | | | 115,269 | | | | 111,238 | |
Warehouse deposits | | | 56,510 | | | | 44,618 | |
Other assets | | | 41,848 | | | | 42,274 | |
Deferred financing costs, net of accumulated amortization of $2,515 and $1,709, respectively | | | 25,445 | | | | 16,729 | |
Intangible assets, net of accumulated amortization of $17,464 and $3,175, respectively | | | 106,757 | | | | 121,046 | |
Goodwill | | | 129,611 | | | | 132,372 | |
| | | | | | | | |
Total assets | | $ | 13,506,102 | | | $ | 12,060,506 | |
| | | | | | | | |
| Liabilities and shareholders’ equity | | | | | | | | |
Indebtedness | | | | | | | | |
Repurchase agreements and other indebtedness | | $ | 1,983,123 | | | $ | 1,255,518 | |
Mortgage-backed securities issued | | | 3,568,889 | | | | 3,697,291 | |
Trust preferred obligations | | | 592,013 | | | | 643,639 | |
CDO notes payable | | | 5,373,447 | | | | 4,855,743 | |
| | | | | | | | |
Total indebtedness | | | 11,517,472 | | | | 10,452,191 | |
Accrued interest payable | | | 65,596 | | | | 67,393 | |
Accounts payable and accrued expenses | | | 19,785 | | | | 22,930 | |
Liabilities related to real estate interests held for sale | | | 250 | | | | — | |
Deferred taxes, borrowers’ escrows and other liabilities | | | 212,660 | | | | 158,197 | |
Distributions payable | | | 50,938 | | | | 39,118 | |
| | | | | | | | |
Total liabilities | | | 11,866,701 | | | | 10,739,829 | |
Minority interest | | | 123,517 | | | | 124,273 | |
Shareholders’ equity | | | | | | | | |
Preferred shares, $0.01 par value per share, 25,000,000 shares authorized; 7.75% Series A cumulative redeemable preferred shares, liquidation preference $25.00 per share, 2,760,000 shares issued and outstanding | | | 28 | | | | 28 | |
8.375% Series B cumulative redeemable preferred shares, liquidation preference $25.00 per share, 2,258,300 shares issued and outstanding | | | 23 | | | | 23 | |
Common shares, $0.01 par value per share, 200,000,000 shares authorized, 63,672,700 and 52,151,412 issued and outstanding, including 379,247 and 430,516 unvested restricted share awards, respectively | | | 632 | | | | 517 | |
Additional paid in capital | | | 1,589,631 | | | | 1,218,667 | |
Accumulated other comprehensive income (loss) | | | (24,094 | ) | | | (3,085 | ) |
Retained earnings (deficit) | | | (50,336 | ) | | | (19,746 | ) |
| | | | | | | | |
Total shareholders’ equity | | | 1,515,884 | | | | 1,196,404 | |
| | | | | | | | |
Total liabilities and shareholders’ equity | | $ | 13,506,102 | | | $ | 12,060,506 | |
| | | | | | | | |
The accompanying notes are an integral part of these consolidated financial statements.
1
RAIT Financial Trust
Consolidated Statements of Income
For the Three-Month Periods Ended March 31, 2007 and 2006
(Unaudited and dollars in thousands, except share and per share information)
| | | | | | | | |
| | | For the Three-Month Periods Ended March 31 | |
| | | 2007 | | | 2006 | |
| Revenue: | | | | | | | | |
Investment interest income | | $ | 202,679 | | | $ | 20,764 | |
Investment interest expense | | | (159,131 | ) | | | (5,375 | ) |
Provision for losses | | | (3,718 | ) | | | — | |
Change in fair value of free-standing derivatives | | | 3,196 | | | | — | |
| | | | | | | | |
Net investment income | | | 43,026 | | | | 15,389 | |
Rental income | | | 2,412 | | | | 3,553 | |
Fee and other income | | | 7,881 | | | | 5,661 | |
| | | | | | | | |
Total revenue | | | 53,319 | | | | 24,603 | |
| Expenses: | | | | | | | | |
Compensation expense | | | 8,376 | | | | 1,878 | |
Real estate operating expenses | | | 2,588 | | | | 1,966 | |
General and administrative | | | 6,283 | | | | 1,172 | |
Depreciation | | | 768 | | | | 304 | |
Amortization of intangible assets | | | 14,289 | | | | — | |
| | | | | | | | |
Total expenses | | | 32,304 | | | | 5,320 | |
| | | | | | | | |
Income before interest and other income (expense), minority interest, income taxes, and income from discontinued operations | | | 21,015 | | | | 19,283 | |
Interest and other income | | | 6,953 | | | | 349 | |
Unrealized gain on interest rate hedges | | | 88 | | | | — | |
Equity in loss of equity method investments | | | (4 | ) | | | — | |
Minority interest | | | (5,764 | ) | | | (4 | ) |
| | | | | | | | |
Income before taxes and discontinued operations | | | 22,288 | | | | 19,628 | |
Income tax benefit | | | 423 | | | | — | |
| | | | | | | | |
Income from continuing operations | | | 22,711 | | | | 19,628 | |
Income from discontinued operations | | | 156 | | | | 942 | |
| | | | | | | | |
Net income | | | 22,867 | | | | 20,570 | |
Income allocated to preferred shares | | | (2,519 | ) | | | (2,519 | ) |
| | | | | | | | |
Net income available to common shares | | $ | 20,348 | | | $ | 18,051 | |
| | | | | | | | |
Earnings per share—Basic: | | | | | | | | |
Continuing operations | | $ | 0.34 | | | $ | 0.62 | |
Discontinued operations | | | — | | | | 0.03 | |
| | | | | | | | |
Total earnings per share—Basic | | $ | 0.34 | | | $ | 0.65 | |
| | | | | | | | |
Weighted-average shares outstanding—Basic | | | 60,143,844 | | | | 27,900,276 | |
| | | | | | | | |
Earnings per share—Diluted: | | | | | | | | |
Continuing operations | | $ | 0.34 | | | $ | 0.61 | |
Discontinued operations | | | — | | | | 0.03 | |
| | | | | | | | |
Total earnings per share—Diluted | | $ | 0.34 | | | $ | 0.64 | |
| | | | | | | | |
Weighted-average shares outstanding—Diluted | | | 60,616,721 | | | | 28,121,735 | |
| | | | | | | | |
Distributions declared per common share | | $ | 0.80 | | | $ | 0.61 | |
| | | | | | | | |
The accompanying notes are an integral part of these consolidated financial statements.
2
RAIT Financial Trust
Consolidated Statements of Other Comprehensive Income (Loss)
For the Three-Month Periods Ended March 31, 2007 and 2006
(Unaudited and dollars in thousands)
| | | | | | | |
| | | For the Three-Month Periods Ended March 31 |
| | | 2007 | | | 2006 |
Net income | | $ | 22,867 | | | $ | 20,570 |
Other comprehensive income (loss) | | | | | | | |
Change in the fair value of cash-flow hedges | | | (11,859 | ) | | | — |
Reclassification adjustments associated with unrealized gains from cash flow hedges included in net income | | | (88 | ) | | | — |
Realized (gain) loss on cash-flow hedges reclassified to earnings | | | (1,207 | ) | | | — |
Change in fair value of available-for-sale securities | | | 1,110 | | | | — |
| | | | | | | |
Total other comprehensive loss before minority interest allocation | | | (12,044 | ) | | | — |
Allocation to minority interest | | | (8,965 | ) | | | — |
| | | | | | | |
Total other comprehensive income (loss) | | | (21,009 | ) | | | — |
| | | | | | | |
Comprehensive income | | $ | 1,858 | | | $ | 20,570 |
| | | | | | | |
The accompanying notes are an integral part of these consolidated financial statements.
3
RAIT Financial Trust
Consolidated Statements of Cash Flows
For the Three-Month Periods Ended March 31, 2007 and 2006
(Unaudited and dollars in thousands)
| | | | | | | | |
| | | For the Three-Month Periods Ended March 31 | |
| | | 2007 | | | 2006 | |
| Operating activities: | | | | | | |
Net income | | $ | 22,867 | | | $ | 20,570 | |
Adjustments to reconcile net income to cash flow from operating activities: | | | | | | | | |
Minority interest | | | 5,764 | | | | 4 | |
Provision for losses | | | 3,718 | | | | — | |
Amortization of deferred compensation | | | 2,956 | | | | 38 | |
Equity in loss of equity method investments | | | 4 | | | | — | |
Depreciation and amortization | | | 15,057 | | | | 536 | |
Amortization of deferred financing costs | | | 6,739 | | | | 401 | |
Accretion of loan discounts | | | (2,762 | ) | | | (6 | ) |
Unrealized gain on interest rate hedges | | | (88 | ) | | | — | |
Foreign currency adjustment | | | (782 | ) | | | — | |
Changes in assets and liabilities: | | | | | | | | |
Accrued interest receivable | | | (4,031 | ) | | | (1,904 | ) |
Other assets | | | (13,755 | ) | | | (489 | ) |
Accrued interest payable | | | (1,797 | ) | | | 169 | |
Accounts payable and accrued expenses | | | (3,145 | ) | | | 1,183 | |
Deferred taxes, borrowers’ escrows and other liabilities | | | 25,303 | | | | 589 | |
| | | | | | | | |
Cash flow from operating activities | | | 56,048 | | | | 21,091 | |
Investing activities: | | | | | | | | |
Purchase and origination of investments in securities | | | (970,246 | ) | | | — | |
Purchase and origination of investments in loans | | | (678,886 | ) | | | (226,941 | ) |
Principal repayments on loans | | | 248,524 | | | | 89,645 | |
Investment in real estate interests | | | (37,992 | ) | | | (2,291 | ) |
Proceeds from dispositions of real estate interests | | | — | | | | 198 | |
Decrease in restricted cash | | | 104,829 | | | | — | |
Increase in warehouse deposits | | | (11,892 | ) | | | — | |
| | | | | | | | |
Cash flow from investing activities | | | (1,345,663 | ) | | | (139,389 | ) |
Financing activities: | | | | | | | | |
Repayments on repurchase agreements and other indebtedness | | | (68,854 | ) | | | (22,700 | ) |
Proceeds from repurchase agreements and other indebtedness | | | 795,903 | | | | 85,000 | |
Repayments on residential mortgage-backed securities | | | (132,148 | ) | | | — | |
Repayments on TruPS obligations | | | (47,962 | ) | | | — | |
Proceeds from issuance of CDO notes payable | | | 511,607 | | | | — | |
Acquisition of minority interest in CDOs | | | (8,685 | ) | | | — | |
Distributions to minority interest holders in CDOs | | | (6,800 | ) | | | — | |
Payments for deferred costs | | | (8,720 | ) | | | — | |
Common share issuance, net of costs incurred | | | 367,029 | | | | 145 | |
Distributions paid to preferred shares | | | (2,523 | ) | | | (2,519 | ) |
Distributions paid to common shares | | | (38,918 | ) | | | — | |
| | | | | | | | |
Cash flow from financing activities | | | 1,359,929 | | | | 59,926 | |
| | | | | | | | |
Net change in cash and cash equivalents | | | 70,314 | | | | (58,372 | ) |
Cash and cash equivalents at the beginning of the period | | | 99,367 | | | | 71,420 | |
| | | | | | | | |
Cash and cash equivalents at the end of the period | | $ | 169,681 | | | $ | 13,048 | |
| | | | | | | | |
Supplemental cash flow information: | | | | | | | | |
Cash paid for interest | | $ | 147,458 | | | $ | 7,465 | |
Cash paid for taxes | | | 1,426 | | | | — | |
Non-cash decrease in goodwill | | | (2,761 | ) | | | — | |
Stock issued under dividend reinvestment plan | | | 196 | | | | — | |
Distributions payable | | | 50,938 | | | | — | |
The accompanying notes are an integral part of these consolidated financial statements.
4
RAIT Financial Trust
Notes to Consolidated Financial Statements
As of March 31, 2007
(Unaudited and dollars in thousands, except share and per share amounts)
NOTE 1: RAIT FINANCIAL TRUST
RAIT Financial Trust is a specialty finance company that provides a comprehensive set of debt financing options to the real estate industry. References to “RAIT”, “we”, “us”, and “our” refer to RAIT Financial Trust and its subsidiaries, unless the context otherwise requires. We originate and invest in real estate-related assets that are underwritten through our integrated investment process. We conduct our business through our subsidiaries, RAIT Partnership, L.P., or RAIT Partnership, and Taberna Realty Finance Trust, or Taberna, as well as through their respective subsidiaries. We and Taberna are self-managed and self-advised Maryland real estate investment trusts, or REITs. Our objective is to provide our shareholders with total returns over time, including quarterly distributions and capital appreciation, while seeking to manage the risks associated with our investment strategy.
NOTE 2: SUMMARY OF SIGNIFICANT ACCOUNTING POLICIES
a. Basis of Presentation
The accompanying unaudited interim consolidated financial statements have been prepared by management in accordance with U.S. generally accepted accounting principles, or GAAP. Certain information and footnote disclosures normally included in annual consolidated financial statements prepared in accordance with GAAP have been condensed or omitted pursuant to such rules and regulations, although we believe that the included disclosures are adequate to make the information presented not misleading. The unaudited interim consolidated financial statements should be read in conjunction with our audited financial statements as of and for the year ended December 31, 2006 included in our Annual Report on Form 10-K. In the opinion of management, all adjustments, consisting only of normal recurring adjustments, necessary to present fairly our consolidated financial position and consolidated results of operations and cash flows are included. The results of operations for the interim periods presented are not necessarily indicative of the results for the full year. Certain prior period amounts have been reclassified to conform with the current period presentation.
b. Principles of Consolidation
The consolidated financial statements reflect our accounts and those accounts of our majority-owned and/or controlled subsidiaries. We also consolidate entities that are variable interest entities, or VIEs, where we have determined that we are the primary beneficiary of such entities. The portions of these entities that we do not own are presented as minority interest as of the dates and for the periods presented in the consolidated financial statements. All intercompany accounts and transactions have been eliminated in consolidation.
c. Use of Estimates
The preparation of financial statements in conformity with GAAP requires management to make estimates and assumptions that affect the reported amounts of assets and liabilities, the disclosure of contingent assets and liabilities at the date of the financial statements and the reported amounts of revenue and expenses during the reporting periods. Actual results could differ from those estimates.
d. Investments
We invest in debt securities, residential mortgages and mortgage-related receivables, commercial mortgages, mezzanine loans and other types of real estate-related assets. We account for our investments in securities under Statement of Financial Accounting Standards No. 115, “Accounting for Certain Investments in Debt and Equity Securities,” as amended and interpreted, or SFAS No. 115, and designate each investment as a trading security, an available-for-sale security, or a held-to-maturity security based on our intent at the time of acquisition. Under SFAS No. 115, trading securities are recorded at their fair value each reporting period with fluctuations in fair value reported as a component of earnings. Available-for-sale securities are recorded at fair value with changes in fair value reported as a component of other comprehensive income (loss). Fair value is based primarily on quoted market prices from independent
5
RAIT Financial Trust
Notes to Consolidated Financial Statements
As of March 31, 2007
(Unaudited and dollars in thousands, except share and per share amounts)
pricing sources when available for actively traded securities or discounted cash flow analyses developed by management using current interest rates and other market data for securities without an active market. Our estimate of fair value is subject to a high degree of variability based upon market conditions and management assumptions. Upon the sale of an available-for-sale security, the realized gain or loss on the sale will be recorded as a component of earnings in the respective period. Held-to-maturity investments are carried at amortized cost at each reporting period.
We account for our investments in subordinated debentures owned by trust VIEs that we consolidate as available-for-sale securities. These VIEs have no ability to sell, pledge, transfer or otherwise encumber the trust or the assets of the trust until such subordinated debenture’s maturity. We account for investments in securities where the transfer meets the criteria as a financing under Statement of Financial Accounting Standards No. 140, “Accounting for Transfers and Servicing of Financial Assets and Extinguishments of Liabilities”, or SFAS No. 140, at amortized cost. Our investments in security-related receivables represent securities that were transferred to issuers of collateralized debt obligations, or CDO, in which the transferors maintained some level of continuing involvement.
We account for our investments in residential mortgages and mortgage-related receivables, commercial mortgages, mezzanine loans and other loans at amortized cost. The carrying value of these investments is adjusted for origination discounts/premiums, nonrefundable fees and direct costs for originating loans which are amortized into income on a level yield basis over the terms of the loans. Mortgage-related receivables represent loan receivables secured by residential mortgages, the legal title to which is held by our trust subsidiaries. These residential mortgages were transferred to the trust subsidiaries in transactions accounted for as financings under SFAS No. 140. Mortgage-related receivables maintain all of the economic attributes of the underlying residential mortgages and all benefits or risks of that ownership inure to the trust subsidiary.
We use our judgment to determine whether an investment has sustained an other-than-temporary decline in value. If management determines that an investment has sustained an other-than-temporary decline in its value, the investment is written down to its fair value by a charge to earnings, and we establish a new cost basis for the investment. Our evaluation of an other-than-temporary decline is dependent on the specific facts and circumstances. Factors that we consider in determining whether an other-than-temporary decline in value has occurred include: the estimated fair value of the investment in relation to our cost basis; the financial condition of the related entity; and the intent and ability to retain the investment for a sufficient period of time to allow for recovery in the fair value of the investment.
We maintain an allowance for losses on our investments in residential mortgages and mortgage-related receivables, commercial mortgages, mezzanine loans and other loans. Our allowance for losses is based on management’s evaluation of known losses and inherent risks, for example, historical and industry loss experience, economic conditions and trends, estimated fair values, the quality of collateral and other relevant factors. Specific allowances for losses are established for impaired loans based on a comparison of the recorded carrying value of the loan to either the present value of the loan’s expected cash flow, the loan’s estimated market price or the estimated fair value of the underlying collateral. The allowance is increased by charges to operations and decreased by charge-offs (net of recoveries).
e. Transfers of Financial Assets
We account for transfers of financial assets under SFAS No. 140 as either sales or financings. Transfers of financial assets that result in sales accounting are those in which (1) the transfer legally isolates the transferred assets from the transferor, (2) the transferee has the right to pledge or exchange the transferred assets and no condition both constrains the transferee’s right to pledge or exchange the assets and provides more than a trivial benefit to the transferor, and (3) the transferor does not maintain effective control over the transferred assets. If the transfer does not meet these criteria, the transfer is accounted for as a financing. Financial assets that are treated as sales are removed from our accounts with any realized gain (loss) reflected in earnings during the period of sale. Financial assets that are treated as financings are maintained on the balance sheet with proceeds received from the legal transfer reflected as securitized borrowings.
6
RAIT Financial Trust
Notes to Consolidated Financial Statements
As of March 31, 2007
(Unaudited and dollars in thousands, except share and per share amounts)
f. Revenue Recognition
| | 1) | Net investment income—We recognize interest income from investments in debt and other securities, residential mortgages, commercial mortgages and mezzanine loans on a yield to maturity basis. Upon the acquisition of a loan at a discount, we assess the portions of the discount that constitute accretable yields and non-accretable differences. The accretable yield represents the excess of our expected cash flows from the loan over the amount we paid for the loan. That amount, the accretable yield, is accreted to interest income over the remaining life of the loan. Many of our commercial mortgages and mezzanine loans provide for the accrual of interest at specified rates which differ from current payment terms. Interest income is recognized on such loans at the accrual rate subject to management’s determination that accrued interest and outstanding principal are ultimately collectible. Origination fees and direct loan origination costs are deferred and amortized to net investment income, using the effective interest method, over the contractual life of the underlying loan security or loan, in accordance with SFAS No. 91. We recognize interest income from interests in certain securitized financial assets on an estimated effective yield to maturity basis. Management estimates the current yield on the amortized cost of the investment based on estimated cash flows after considering prepayment and credit loss experience. |
| | 2) | Structuring fees—We receive structuring fees for services rendered in connection with the formation of CDO securitization entities. The structuring fee is a contractual fee paid when the related services are completed. The structuring fee is a negotiated fee with the investment bank acting as placement agent for the CDO securities and is capitalized by the CDO securitization entity as a deferred financing cost. We may decide to invest in the debt or equity securities issued by CDO securitization entities. We evaluate our investment in these entities under FIN 46R to determine whether the entity is a VIE, and, if so, whether or not we are the primary beneficiary. If we are determined to be the primary beneficiary, we will consolidate the accounts of the CDO securitization entity and upon consolidation, we eliminate intercompany transactions, specifically the structuring fees and deferred financing costs paid. Structuring fees totaling $5,625 were eliminated for the three month period ended March 31, 2007 upon the consolidation of Taberna Preferred Funding VIII. |
| | 3) | Fee and other income—we generate fee and other income, through our various subsidiaries, by providing (a) ongoing asset management services to CDO investment portfolios under cancelable management agreements, (b) providing or arranging to provide financing to our borrowers, and (c) providing financial consulting to our borrowers. We recognize revenue for these activities when the fees are fixed or determinable, evidenced by an arrangement, collection is reasonably assured and the services under the arrangement have been provided. CDO asset management fees are an administrative cost of a CDO entity and are paid by the CDO administrative trustee on behalf of its investors. These asset management fees are recognized when earned and are paid quarterly. Asset management fees from consolidated CDOs are eliminated in consolidation. During the three-month period ended March 31, 2007, we earned $5,650 of asset management fees, of which we eliminated $4,488 upon consolidation of CDOs of which we are the primary beneficiary. |
g. Off-Balance Sheet Arrangements
We maintain warehouse financing arrangements with various investment banks and engage in CDO securitizations. Prior to the completion of a CDO securitization, our warehouse providers acquire investments in accordance with the terms of the warehouse facilities. We are paid the difference between the interest earned on the investments and the interest charged by the warehouse providers from the dates on which the respective investments were acquired. We bear the first dollar risk of loss, up to our warehouse deposit amount, if (i) an investment funded through the warehouse facility becomes impaired or (ii) a CDO is not completed by the end of the warehouse period, and in either case, the warehouse provider
7
RAIT Financial Trust
Notes to Consolidated Financial Statements
As of March 31, 2007
(Unaudited and dollars in thousands, except share and per share amounts)
is required to liquidate the securities at a loss. These off-balance sheet arrangements are not consolidated because our risk of loss is generally limited to the cash collateral held by the warehouse providers and our warehouse facilities are not special purpose vehicles. However, since we hold an implicit variable interest in many entities funded under our warehouse facilities, we often consolidate the Trust VIEs while the trust preferred securities, or TruPS, they issue are held on the warehouse lines. The economic return earned from these warehouse facilities is considered a non-hedge derivative and is recorded at fair value in our financial statements. Changes in fair value are reflected in earnings in the respective period.
h. Derivative Instruments
We may use derivative financial instruments to hedge all or a portion of the interest rate risk associated with our borrowings. Certain of the techniques used to hedge exposure to interest rate fluctuations may also be used to protect against declines in the market value of assets that result from general trends in debt markets. The principal objective of such agreements is to minimize the risks and/or costs associated with our operating and financial structure as well as to hedge specific anticipated transactions.
In accordance with Statement of Financial Accounting Standards No. 133, “Accounting for Derivative Instruments and Hedging Activities,” as amended and interpreted, or SFAS No. 133, we measure each derivative instrument (including certain derivative instruments embedded in other contracts) at fair value and record such amounts in its consolidated balance sheet as either an asset or liability. For derivatives designated as fair value hedges or for derivatives not designated as hedges, the changes in fair value of both the derivative instrument and the hedged item are recorded in earnings. For derivatives designated as cash flow hedges, the changes in the fair value of the effective portions of the derivative are reported in other comprehensive income. Changes in the ineffective portions of cash flow hedges are recognized in earnings.
i. Income Taxes
RAIT and Taberna have each elected to be taxed as a REIT and to comply with the related provisions of the Internal Revenue Code of 1986, as amended or, the Internal Revenue Code. Accordingly, we generally will not be subject to U.S. federal income tax to the extent of our distributions to shareholders and as long as certain asset, income and share ownership tests are met. If we were to fail to meet these requirements, we would be subject to U.S. federal income tax, which could have a material adverse impact on our results of operations and amounts available for distributions to our shareholders. Management believes that all of the criteria to maintain RAIT’s and Taberna’s REIT qualification have been met for the applicable periods, but, there can be no assurances that these criteria will continue to be met in subsequent periods.
We maintain various taxable REIT subsidiaries, or TRSs, which may be subject to U.S. federal, state and local income taxes. From time to time, these TRSs generate taxable income from intercompany transactions. The TRS entities generate taxable revenue from fees for services provided to CDO entities. Some of these fees paid to the TRS entities are capitalized as deferred financing costs by the CDO entities. Certain CDO entities may be consolidated in our financial statements pursuant to FIN 46R. In consolidation, these fees are eliminated when the CDO entity is included in the consolidated group. Nonetheless, all income taxes are accrued by the TRSs in the year in which the taxable revenue is received. These income taxes are not eliminated when the related revenue is eliminated in consolidation.
j. Goodwill and Intangible assets
On December 11, 2006, we acquired all of the outstanding common shares of Taberna Realty Finance Trust. Refer to our Annual Report on Form 10-K for additional information regarding this acquisition. As part of purchase accounting, we allocated the purchase price consideration to the net assets acquired, including identifiable intangible assets. As of December 31, 2006, we were finalizing the
8
RAIT Financial Trust
Notes to Consolidated Financial Statements
As of March 31, 2007
(Unaudited and dollars in thousands, except share and per share amounts)
purchase price accounting allocation and were in the process of obtaining appraisals from third party valuation specialists. During the three month period ended March 31, 2007, we reallocated approximately $2,761 of the original purchase price amongst Taberna’s investments in securities and goodwill. Ultimately, these reallocations caused a reduction in goodwill and an increased amortized cost basis of the investment in securities by $2,761.
k. Recent Accounting Pronouncements
In February 2006, the FASB issued SFAS No. 155,Accounting for Certain Hybrid Financial Instruments, or SFAS No. 155. Key provisions of SFAS No. 155 include: (1) a broad fair value measurement option for certain hybrid financial instruments that contain an embedded derivative that would otherwise require bifurcation; (2) clarification that only the simplest separations of interest payments and principal payments qualify for the exception afforded to interest-only strips and principal-only strips from derivative accounting under paragraph 14 of SFAS No. 133,Accounting for Derivative Instruments and Hedging Activities, thereby narrowing such exception; (3) a requirement that beneficial interests in securitized financial assets be analyzed to determine whether they are freestanding derivatives or whether they are hybrid instruments that contain embedded derivatives requiring bifurcation; (4) clarification that concentrations of credit risk in the form of subordination are not embedded derivatives; and (5) elimination of the prohibition on a qualified special purpose entity, or QSPE, holding passive derivative financial instruments that pertain to beneficial interests that are or contain a derivative financial instrument. In general, these changes will reduce the operational complexity associated with bifurcating embedded derivatives, and increase the number of beneficial interests in securitization transactions, including interest-only strips and principal-only strips, required to be accounted for in accordance with SFAS No. 133. We adopted SFAS No. 155 in the first quarter of 2007 and the adoption of SFAS No. 155 did not have a material effect on our consolidated financial statements.
In September 2006, the FASB issued Interpretation No. 48,Accounting for Uncertainty in Income Taxes—an interpretation of FASB Statement No. 109 , or FIN 48. FIN 48 clarifies the accounting for uncertainty in income taxes recognized in an enterprise’s financial statements in accordance with FASB Statement No. 109,Accounting for Income Taxes. FIN 48 prescribes a recognition threshold and measurement attribute for the financial statement recognition and measurement of a tax position taken or expected to be taken in a tax return. We adopted FIN 48 in the first quarter of 2007 and the adoption of FIN 48 did not have an effect on our consolidated financial statements as we do not maintain any uncertain tax contingencies.
In September 2006, the FASB issued SFAS No. 157,Fair Value Measurements, or SFAS 157. SFAS 157 defines fair value, establishes a framework for measuring fair value in GAAP, and requires enhanced disclosures about fair value measurements. SFAS 157 applies when other accounting pronouncements require or permit fair value measurements; it does not require new fair value measurements. SFAS 157 is effective for financial statements issued for fiscal years beginning after November 15, 2007, and interim periods within those years. Management is currently evaluating the impact that this statement may have on our financial statements.
In February 2007, the FASB issued SFAS No. 159,The Fair Value Option for Financial Assets and Financial Liabilities. This statement provides entities with an irrevocable option to report most financial assets and liabilities at fair value, with subsequent changes in fair value reported in earnings. The election can be applied on an instrument-by-instrument basis. The statement establishes presentation and measurement attributes for similar types of assets and liabilities. The statement is effective for fiscal years beginning after November 15, 2007. Management is currently evaluating the impact that this statement may have on our financial statements.
9
RAIT Financial Trust
Notes to Consolidated Financial Statements
As of March 31, 2007
(Unaudited and dollars in thousands, except share and per share amounts)
NOTE 3: INVESTMENTS IN SECURITIES
The following table summarizes our investments in available-for-sale securities as of March 31, 2007:
| | | | | | | | | | | | | | | | | | |
Investment Description | | Amortized Cost | | Gross Unrealized Gains | | Gross Unrealized
Losses | | | Estimated Fair Value | | Weighted
Average
Coupon | | | Weighted
Average
Years to
Maturity |
TruPS and subordinated debentures | | $ | 4,083,942 | | $ | 1,167 | | $ | (28,510 | ) | | $ | 4,056,599 | | 7.9 | % | | 28.0 |
Other securities | | | 693,383 | | | 198 | | | (6,432 | ) | | | 687,149 | | 6.1 | % | | 28.4 |
| | | | | | | | | | | | | | | | | | |
Total available-for-sale securities | | $ | 4,777,325 | | $ | 1,365 | | $ | (34,942 | ) | | $ | 4,743,748 | | 7.6 | % | | 28.1 |
| | | | | | | | | | | | | | | | | | |
TruPS included above as available-for-sale securities include (a) investments in TruPS issued by VIEs of which we are not the primary beneficiary and which we do not consolidate and (b) transfers of investments in TruPS securities to us that were accounted for as a sale pursuant to SFAS No. 140. Subordinated debentures included above represent the primary assets of VIEs that we consolidate pursuant to FIN 46R. Management believes that none of these securities are other than temporarily impaired at March 31, 2007.
The following table summarizes our investments in security-related receivables, as of March 31, 2007:
| | | | | | | | | | | |
Investment Description | | Amortized Cost | | Weighted
Average
Coupon | | | Weighted
Average Years to
Maturity | | Estimated Fair Value |
TruPS and subordinated debenture receivables | | $ | 770,876 | | 8.0 | % | | 25.4 | | $ | 784,991 |
Unsecured REIT note receivables | | | 393,766 | | 5.6 | % | | 10.1 | | | 390,584 |
CMBS receivables(1) | | | 214,201 | | 5.6 | % | | 35.5 | | | 208,898 |
| | | | | | | | | | | |
Total | | $ | 1,378,843 | | 6.9 | % | | 22.6 | | $ | 1,384,473 |
| | | | | | | | | | | |
| (1) | Commercial mortgage-backed securities, or CMBS, receivables include securities with a fair value totaling $180,237 that are rated “BBB+” and “BBB-” by Standard & Poor’s and securities with a fair value totaling $28,661 that are rated between “AA” and “A-” by Standard & Poor’s. |
Our investments in security-related receivables represent securities owned by CDO entities that we account for as financings under SFAS No. 140.
The unrealized losses on our securities are primarily the result of market interest rate factors rather than credit impairment, and we believe that the carrying values are fully realizable over the securities’ expected holding period.
Some of our investments in securities collateralize debt issued through CDO entities. Our TruPS CDO entities are static pools and prohibit, in most cases, the sale of such securities until the mandatory auction call period, typically 10 years from the CDO entity’s inception. At and subsequent to the mandatory auction call date, remaining securities will be offered in the general market and the proceeds
10
RAIT Financial Trust
Notes to Consolidated Financial Statements
As of March 31, 2007
(Unaudited and dollars in thousands, except share and per share amounts)
from sales of such securities will be used to repay outstanding indebtedness and liquidate the CDO entity. The assets of our consolidated CDOs collateralize the debt of such entities and are not available to our creditors. As of March 31, 2007, CDO notes payable related to investment in securities were collateralized by $4,251,400 of principal amount of TruPS and subordinated debentures and $609,013 of principal amount of unsecured REIT note receivables and CMBS receivables. Some of these investments were eliminated upon the consolidation of various VIEs that we consolidate and the corresponding subordinated debentures of the VIEs are included as assets in our consolidated balance sheet.
11
RAIT Financial Trust
Notes to Consolidated Financial Statements
As of March 31, 2007
(Unaudited and dollars in thousands, except share and per share amounts)
NOTE 4: INVESTMENTS IN LOANS
Our investments in mortgages and loans are accounted for at amortized cost.
(a) Investments in residential mortgages and mortgage- related receivables:
The following tables summarize our investments in residential mortgages and mortgage-related receivables as of March 31, 2007:
| | | | | | | | | | | | | | | | | |
| | | Unpaid
Principal
Balance | | Unamortized
(Discount) | | | Carrying
Amount | | Number of Loans
and Mortgage-
Related
Receivables | | Average
Interest
Rate | | | Average
Contractual
Maturity date |
3/1 Adjustable rate | | $ | 136,215 | | $ | (2,071 | ) | | $ | 134,144 | | 345 | | 5.6 | % | | August 2035 |
5/1 Adjustable rate | | | 3,725,239 | | | (20,010 | ) | | | 3,705,229 | | 7,604 | | 5.6 | % | | September 2035 |
7/1 Adjustable rate | | | 594,210 | | | (4,819 | ) | | | 589,391 | | 1,295 | | 5.7 | % | | July 2035 |
10/1 Adjustable rate | | | 67,723 | | | (691 | ) | | | 67,032 | | 75 | | 5.7 | % | | June 2035 |
| | | | | | | | | | | | | | | | | |
Total | | $ | 4,523,387 | | $ | (27,591 | ) | | $ | 4,495,796 | | 9,319 | | 5.6 | % | | |
| | | | | | | | | | | | | | | | | |
As of March 31, 2007, approximately 44% of our residential mortgage loans were in the state of California.
As of March 31, 2007, $3,825,177 of our residential mortgages and mortgage-related receivables were pledged as collateral with mortgage securitizations. These mortgage securitizations have issued mortgage backed securities with a principal balance outstanding of $3,610,231.
(b) Investments in commercial mortgages, mezzanine loans, and other loans:
The following tables summarize our investments in commercial mortgages, mezzanine loans and other loans as of March 31, 2007:
| | | | | | | | | | | | | | | | | | | |
| | | Unpaid Principal Balance | | | Unamortized (Discounts) Premiums | | | Carrying Amount | | | Number of Loans | | Weighted Average Interest Rate | | | Range of Maturity Dates |
Commercial mortgages | | $ | 1,179,677 | | | $ | — | | | $ | 1,179,677 | | | 80 | | 8.2 | % | | Apr. 2007 to
Nov. 2015 |
Mezzanine loans | | | 532,322 | | | | (3,386 | ) | | | 528,936 | | | 163 | | 10.7 | % | | Apr. 2007 to
Aug. 2021 |
Other loans | | | 168,614 | | | | 1,316 | | | | 169,930 | | | 9 | | 7.5 | % | | May 2010
to Oct. 2016 |
| | | | | | | | | | | | | | | | | | | |
Total | | | 1,880,613 | | | | (2,070 | ) | | | 1,878,543 | | | 252 | | 8.9 | % | | |
| | | | | | | | | | | | | | | | | | | |
Unearned fees | | | (13,816 | ) | | | — | | | | (13,816 | ) | | | | | | | |
| | | | | | | | | | | | | | | | | | | |
Total | | $ | 1,866,797 | | | $ | (2,070 | ) | | $ | 1,864,727 | | | | | | | | |
| | | | | | | | | | | | | | | | | | | |
(c) Allowance for losses:
We maintain an allowance for losses on our investments in residential mortgages and mortgage-related receivables, commercial mortgages, mezzanine loans and other real estate related assets. Specific allowances for losses are established for impaired loans based on a comparison of the recorded carrying value of the loan to either the present value of the loan’s expected cash flow, the loan’s estimated market price or the estimated fair value of the underlying collateral. The allowance is increased by charges to
12
RAIT Financial Trust
Notes to Consolidated Financial Statements
As of March 31, 2007
(Unaudited and dollars in thousands, except share and per share amounts)
operations and decreased by charge-offs (net of recoveries). Management’s periodic evaluation of the adequacy of the allowance is based upon expected and inherent risks in the portfolio, historical trends in adjustable rate residential mortgages (if applicable), the estimated value of underlying collateral, and current and expected future economic conditions. As of March 31, 2007, our allowance for losses was $8,716, net of charge-offs of $338 during the three months ended March 31, 2007.
NOTE 5: INDEBTEDNESS
We maintain various forms of short-term and long-term financing arrangements. Generally, these financing agreements are collateralized by assets within CDOs or mortgage securitizations. The following table summarizes our indebtedness as of March 31, 2007:
| | | | | | | | | | | | | | | | |
Description | | Principal | | Unamortized
Premium
(Discount) | | | Carrying
Amount | | Interest Rate
Terms | | Current
Weighted-
Average
Interest Rate | | Contractual
Maturity |
Repurchase agreements and other indebtedness | | $ | 1,983,123 | | $ | — | | | $ | 1,983,123 | | 5.4% to
7.7% | | 5.9% | | Apr. 2007
to 2037 (1) |
Mortgage-backed securities issued(2) | | | 3,610,231 | | | (41,342 | ) | | | 3,568,889 | | 4.6% to 5.5%(3) | | 5.0% | | 2035 |
Trust preferred obligations | | | 592,013 | | | — | | | | 592,013 | | 6.8% to 9.1% | | 7.3% | | 2036 |
CDO notes payable(2) | | | 5,493,107 | | | (119,660 | ) | | | 5,373,447 | | 4.7% to 10.4% | | 6.2% | | 2035 to 2046 |
| | | | | | | | | | | | | | | | |
Total indebtedness | | $ | 11,678,474 | | $ | (161,002 | ) | | $ | 11,517,472 | | | | | | |
| | | | | | | | | | | | | | | | |
| (1) | We intend to re-negotiate and extend our repurchase agreements as they mature. |
| (2) | Excludes mortgage-backed securities and CDO notes payable purchased by us which are eliminated in consolidation. |
| (3) | Rates generally follow the terms of the underlying mortgages, which are fixed for a period of time and variable thereafter. |
Financing arrangements we entered into during the three months ended March 31, 2007 were as follows:
| | (a) | Repurchase agreements and other indebtedness: |
On February 12, 2007, we formed Taberna Funding Capital Trust I which issued $25,000 of trust preferred securities to investors and $100 of common securities to us. The combined proceeds were used by Taberna Funding Capital Trust I to purchase $25,100 of junior subordinated notes issued by us. The junior subordinated notes are the sole assets of Taberna Capital Trust I and mature on April 30, 2037, but are callable on or after April 30, 2012. Interest on the junior subordinated notes is payable quarterly at a fixed rate of 7.69% through April 2012 and thereafter at a floating rate equal to three-month LIBOR plus 2.50%.
On February 15, 2007, we entered into a repurchase agreement with an investment bank to provide up to $750,000 of financing to accumulate commercial loan investments in commercial mortgages and mezzanine loans on a short-term basis pending a CDO issuance. The agreement terminates on February 14, 2008 and bears interest at various rates over LIBOR ranging from 0.30% to 1.35%, depending on the types and ratings of assets financed. As of March 31, 2007, this repurchase agreement had $307,677 outstanding collateralized by commercial mortgage and mezzanine loans with a principal amount of $354,354.
On March 29, 2007, we closed Taberna Preferred Funding VIII, Ltd., a $772,000 CDO transaction that provides financing for investments consisting of TruPS issued by REITs and real estate operating companies, senior and subordinated notes issued by real estate entities, commercial mortgage-backed securities, other real estate interests, senior loans and CDOs issued by special purpose issuers that own a portfolio of commercial real estate loans. The investments that are owned by Taberna Preferred Funding VIII are pledged as collateral to secure its debt and, as a result, are not available to us, our creditors or our shareholders. Taberna Preferred Funding VIII issued a total of $471,000 of notes at par to investors. In addition, we retained $111,000 of the senior notes, $50,000 of the junior notes and $60,000 of the preference shares. The notes issued to investors bear interest at rates ranging from LIBOR plus 0.34% to
13
RAIT Financial Trust
Notes to Consolidated Financial Statements
As of March 31, 2007
(Unaudited and dollars in thousands, except share and per share amounts)
LIBOR plus 4.90%. All of the notes mature in 2037, although Taberna Preferred Funding VIII may call the notes at par at any time after May 2017. The senior notes retained by us bear interest at rates ranging from LIBOR plus 0.34% to LIBOR plus 0.53% and the junior notes retained by us bear interest at rates ranging from LIBOR plus 2.85% to LIBOR plus 4.90%. We financed our investment in the senior notes through $103,710 of borrowings under our existing repurchase agreements bearing interest at rates ranging from LIBOR plus 0.05% to LIBOR plus 0.10%.
The assets of our consolidated CDOs collateralize the debt of such entities and are not available to our creditors. As of March 31, 2007, the CDO notes payable are collateralized by $4,251,400 of principal amount of TruPS and subordinated debentures, $609,013 of principal amount of unsecured REIT note receivables and CMBS receivables and $1,098,683 in principal amount of commercial mortgages, mezzanine loans and other loans. A portion of the TruPS that collateralize CDO notes payable are eliminated upon the consolidation of various Trust VIE entities that we consolidate. The corresponding subordinated debentures of the Trust VIE entities are included as investments in securities in our consolidated balance sheet.
NOTE 6: DERIVATIVE FINANCIAL INSTRUMENTS
Cash Flow Hedges
We have entered into various interest rate swap contracts to hedge interest rate exposure on CDO notes payable and repurchase agreements.
We designate interest rate hedge agreements at inception and determine whether or not the interest rate hedge agreement is highly effective in offsetting interest rate fluctuations associated with the identified indebtedness. At designation, certain of these interest rate swaps had a fair value not equal to zero. However, we concluded, at designation, that these hedging arrangements were highly effective during their term using regression analysis and determined that the hypothetical derivative method would be used in measuring any ineffectiveness. At each reporting period, we update our regression analysis and, as of March 31, 2007, we concluded that these hedging arrangements were highly effective during their remaining term and used the hypothetical derivative method in measuring the ineffective portions of these hedging arrangements.
14
RAIT Financial Trust
Notes to Consolidated Financial Statements
As of March 31, 2007
(Unaudited and dollars in thousands, except share and per share amounts)
The interest rate hedge agreements are summarized as of March 31, 2007:
| | | | | | | | | | | | | | | | | | | | | |
Hedge Product | | Hedged Item | | Aggregate
Notional | | Strike | | Maturity | | Fair Value
as of
March 31,
2007 | | | Amounts
Reclassified
to Earnings
for
Effective
Hedges—
Gains
(Losses) | | | Amounts
Reclassified
to Earnings
for
Ineffective
Hedges—
Gains
(Losses) | |
Interest rate swaps | | CDO notes payable | | $ | 653,750 | | 3.9% to 5.2% | | Aug. 2010 to Nov. 2015 | | $ | 11,218 | | | $ | (718 | ) | | $ | 519 | |
Interest rate swaps | | CDO notes payable | | | 450,500 | | 4.6% to 5.6% | | Nov. 2010 to Nov. 2015 | | | 3,446 | | | | (151 | ) | | | 27 | |
Interest rate and basis swaps | | CDO notes payable | | | 396,625 | | 4.9% to 5.6% | | February 2016 | | | (4,364 | ) | | | 42 | | | | (143 | ) |
Interest rate swaps | | CDO notes payable | | | 300,000 | | 5.1% to 5.3% | | Feb. 2011 to Feb. 2016 | | | (2,323 | ) | | | 76 | | | | (28 | ) |
Interest rate swaps | | CDO notes payable | | | 502,860 | | 5.1% to 5.9% | | Oct. 2011 to Oct. 2016 | | | (14,905 | ) | | | 598 | | | | (11 | ) |
Interest rate swaps | | CDO notes payable | | | 480,000 | | 5.4% to 5.9% | | July 2016 to Aug. 2016 | | | (9,761 | ) | | | 415 | | | | (141 | ) |
Interest rate cap | | CDO notes payable | | | 15,000 | | 8.5% | | August 2031 | | | 191 | | | | — | | | | (47 | ) |
Interest rate swaps | | CDO notes payable | | | 346,000 | | 5.0% | | August 2017 | | | 2,323 | | | | 59 | | | | — | |
Interest rate swaps | | CDO notes payable | | | 768,722 | | 4.8% to 5.3% | | Jan. 2010 to June 2016 | | | (6,249 | ) | | | 34 | | | | — | |
Interest rate swap | | Repurchase agreements | | | 733,570 | | 5.3% | | July 2011 | | | (8,862 | ) | | | 877 | | | | (146 | ) |
Interest rate swaps | | Repurchase agreements | | | 94,478 | | 4.6% to 4.9% | | Oct. 2010 to Dec. 2012 | | | 584 | | | | (47 | ) | | | 44 | |
Interest rate swaps | | Other indebtedness | | | 121,833 | | 5.0% | | Nov. 2011 to Dec. 2011 | | | (642 | ) | | | 25 | | | | — | |
Interest rate swaps | | Other indebtedness | | | 31,450 | | 5.2% to 5.3% | | Feb. 2009 to Feb. 2017 | | | (332 | ) | | | (3 | ) | | | (36 | ) |
Currency option | | EUR-USD exchange rate | | | 8,633 | | 1.2633
EUR-USD | | May 2007 to May 2009 | | | 50 | | | | — | | | | 50 | |
| | | | | | | | | | | | | | | | | | | | | |
Total Portfolio/ Weighted Average | | | | $ | 4,903,421 | | | | | | $ | (29,626 | ) | | $ | 1,207 | | | $ | 88 | |
| | | | | | | | | | | | | | | | | | | | | |
Amounts reclassified to earnings associated with effective cash flow hedges are reported in investment interest expense and the fair value of these hedge agreements is included in other assets and liabilities.
Free-Standing Derivatives
We maintain arrangements with various investment banks regarding CDO securitizations and warehouse facilities. Prior to the completion of a CDO securitization, investments are acquired by the warehouse providers in accordance with the warehouse facilities. Pursuant to the terms of the warehouse agreements, we receive the difference between the interest earned on the investments under the warehouse facilities and the interest charged by the warehouse facilities from the dates on which the respective securities are acquired. Under the warehouse agreements, we are required to deposit cash collateral with the warehouse provider and as a result, we bear the first dollar risk of loss, and in some cases share the first dollar risk of loss, up to our warehouse deposit, if (i) an investment funded through the warehouse facility becomes impaired or (ii) a CDO is not completed by the end of the warehouse period, and in either case, if the warehouse facility is required to liquidate the securities at a loss. Upon the completion of a CDO securitization, the cash collateral held by the warehouse provider is returned to us. The terms of the warehouse facilities are generally at least nine months. As of March 31, 2007, we had approximately $56,510 of cash collateral held by warehouse providers pursuant to warehouse facilities. These arrangements are deemed to be derivative financial instruments and are recorded at fair value each accounting period with the change in fair value recorded in earnings.
A summary of these arrangements is as follows:
| | | | | | | | | | | |
Warehouse Facility | | Warehouse
Availability | | Funding as of
March 31,
2007 | | Remaining
Availability | | Maturity |
Merrill Lynch International | | $ | 700,053 | | $ | 400,419 | | $ | 299,634 | | June 2007 to February 2008 |
Bear, Stearns & Co. Inc. | | | 700,000 | | | 395,188 | | | 304,812 | | September 2007 to March 2008 |
| | | | | | | | | | | |
Total | | $ | 1,400,053 | | $ | 795,607 | | $ | 604,446 | | |
| | | | | | | | | | | |
15
RAIT Financial Trust
Notes to Consolidated Financial Statements
As of March 31, 2007
(Unaudited and dollars in thousands, except share and per share amounts)
The financing costs of these warehouse facilities are based on one-month LIBOR plus 50 basis points.
NOTE 7: SHAREHOLDERS’ EQUITY
On January 23, 2007, our board of trustees awarded 408,517 phantom units, valued at $14,997 using our closing stock price of $36.71, to various employees and trustees. The awards generally vest over four year periods.
On January 23, 2007, our board of trustees declared a first quarter 2007 cash dividend of $0.484375 per share on our 7.75% Series A Cumulative Redeemable Preferred Shares and $0.5234375 per share on our 8.375% Series B Cumulative Redeemable Preferred Shares. The dividends were paid on April 2, 2007 to holders of record on March 1, 2007 and totaled $2,519.
On January 24, 2007, 6,010 of our phantom unit awards were redeemed for our common shares. These phantom units were fully vested at the time of redemption.
On January 24, 2007, we issued 11,500,000 common shares in a public offering at an offering price of $34.00 per share. After deducting offering costs, including the underwriter’s discount, and expenses of approximately $24,070, we received approximately $366,894 of net proceeds.
On March 15, 2007, our board of trustees declared a quarterly distribution of $0.80 per common share totaling $50,938 that was paid on April 13, 2007 to shareholders of record as of March 29, 2007.
16
RAIT Financial Trust
Notes to Consolidated Financial Statements
As of March 31, 2007
(Unaudited and dollars in thousands, except share and per share amounts)
NOTE 8: EARNINGS PER SHARE
The following table presents a reconciliation of basic and diluted earnings per share for the three month periods ended March 31, 2007 and 2006:
| | | | | | | | |
| | | For the three month periods ended March 31 | |
| | | 2007 | | | 2006 | |
Income from continuing operations | | $ | 22,711 | | | $ | 19,628 | |
Income allocated to preferred shares | | | (2,519 | ) | | | (2,519 | ) |
| | | | | | | | |
Income from continuing operations available to common shares | | | 20,192 | | | | 17,109 | |
Income from discontinued operations | | | 156 | | | | 942 | |
| | | | | | | | |
Net income available to common shares | | $ | 20,348 | | | $ | 18,051 | |
| | | | | | | | |
Weighted-average shares outstanding—Basic | | | 60,143,844 | | | | 27,900,276 | |
Dilutive securities under the treasury stock method | | | 472,877 | | | | 221,459 | |
| | | | | | | | |
Weighted-average shares outstanding—Diluted | | | 60,616,721 | | | | 28,121,735 | |
| | | | | | | | |
Earnings per share—Basic: | | | | | | | | |
Continuing operations | | $ | 0.34 | | | $ | 0.62 | |
Discontinued operations | | | — | | | | 0.03 | |
| | | | | | | | |
Total earnings per share—Basic | | $ | 0.34 | | | $ | 0.65 | |
| | | | | | | | |
Earnings per share—Diluted: | | | | | | | | |
Continuing operations | | $ | 0.34 | | | $ | 0.61 | |
Discontinued operations | | | — | | | | 0.03 | |
| | | | | | | | |
Total earnings per share—Diluted | | $ | 0.34 | | | $ | 0.64 | |
| | | | | | | | |
NOTE 9: RELATED PARTY TRANSACTIONS
In the ordinary course of our business operations, we have ongoing relationships and have engaged in transactions with several related entities described below. All of these relationships and transactions were approved or ratified by a majority of our independent board of trustees as being on terms comparable to those available on an arm’s-length basis from an unaffiliated third party or otherwise not creating a conflict of interest.
Our Chief Executive Officer, Daniel G. Cohen, holds controlling positions in various companies with which the Company conducts business. Daniel G. Cohen is the majority member of Cohen Brothers LLC d/b/a Cohen & Company, or Cohen & Company, a registered broker-dealer. Each transaction with Cohen & Company is described below:
a).Shared Services—we share office space and related resources with Cohen & Company. For services relating to structuring and managing our investments in CMBS and RMBS, we pay an annual fee ranging from 2 to 20 basis points on the amount of the investments, based on the rating of the security. For investments in residential whole loans, we pay an annual fee of 1.5 basis points on the amount of the investments. In respect of other administrative services, we pay an amount equal to the cost of providing those services plus 10% of such cost. During the three-month period ended March 31, 2007, we incurred total shared service expenses of approximately $300, which has been included in general and administrative expense in the accompanying statement of income.
b).OfficeLease—We maintain a separate five-year sub-lease agreement for shared office space and facilities commencing April 1, 2006 and expiring March 31, 2011. Rent expense during the three-month period ended March 31, 2007 relating to this lease was $17 and has been included in general and administrative expense in the accompanying statement of income. Future minimum lease payments due over the remaining term of the lease is approximately $290.
17
RAIT Financial Trust
Notes to Consolidated Financial Statements
As of March 31, 2007
(Unaudited and dollars in thousands, except share and per share amounts)
c).Origination Fees—during the three-month period ended March 31, 2007, Cohen & Company provided origination services for our investments and placement services for certain debt and equity securities issued by our CDO securitizations. For these services, Cohen & Company received approximately $390 in origination fees and $1,500 in placement fees. In February 2007, we engaged an affiliate of Cohen & Company for the placement of debt securities to be issued by a future CDO transaction. Fees to be paid are 50 basis points of the total expected final collateral balance of the CDO.
d).Non-Competition Agreement—As part of the spin-off of Taberna from Cohen & Company, Taberna and Cohen & Company entered into a three-year non-competition agreement ending in April 2008. As part of this agreement, Cohen & Company agreed not to engage in purchasing from, or acting as a placement agent for, issuers of TruPS or other preferred equity securities of real estate investment trusts and other real estate operating companies. Cohen & Company agreed to refrain from acting as asset manager for any such securities. As part of our acquisition of Taberna, we valued this non-competition agreement as an amortizing intangible asset. As of March 31, 2007, the balance of the intangible asset, net of accumulated amortization, was $11,706.
e).Strategos Capital Management—Strategos Capital Management, or Strategos, is an affiliate of Cohen & Company. In October 2006, Taberna engaged Strategos to create and manage a $1.0 billion high-grade asset backed CDO. For its services, Strategos, upon completion of the CDO, will receive an upfront structuring fee of 15 basis points, or approximately $1,500 and ongoing management fees of 10 basis points, or $1,000 per year.
The Bancorp, Inc.—Betsy Z. Cohen, our Chairman, is the Chairman of the Board and Chief Executive Officer of The Bancorp Bank (“Bancorp”), a commercial bank. Daniel G. Cohen, our Chief Executive Officer and Trustee is the Vice-Chairman of the Board of Bancorp. We maintain checking and demand deposit accounts at Bancorp. As of March 31, 2007 and December 31, 2006, we had $88,819 and $117,123, respectively, on deposit. During the three-month periods ended March 31, 2007 and 2006, we received $267 and $311, respectively, of interest income from Bancorp. During the three-month periods ended March 31, 2007 and 2006, we paid fees of $20 and $15, respectively, to Bancorp for information system technical support services. We sublease a portion of our downtown Philadelphia office space from Bancorp at an annual rental expense based upon the amount of square footage occupied. The sub-lease expires in August 2010 and there are two five-year renewal options. Rent paid to Bancorp Inc. was approximately $124 and $84 for the three-month periods ended March 31, 2007 and 2006, respectively.
We have a $3,369 first mortgage loan secured by Pennsview Apartments that has junior lien against it that is held by an entity controlled by Daniel Cohen. Our loan bears interest at a fixed rate of 8%, matures on March 29, 2008 and is paying in accordance with its terms.
Eton Park Fund, L.P. and its affiliates—Eton Park Fund, L.P., or Eton Park, owns approximately 6.4% of our common shares based on the most recent Form 13-G they filed with the SEC. In connection with the Taberna Euro CDO I we sponsored, we paid Eton Park a standby equity commitment fee of $1,000. In exchange for this fee, they agreed to purchase up to €5,500 of the Class F subordinated notes issued by Taberna Euro CDO I.
Mercury Real Estate Advisors LLC—Mercury Real Estate Advisors LLC, or Mercury, and its affiliates own approximately 6.9% of our common shares based on the most recent form 13-G they filed with the SEC. In March 2007, we purchased approximately $9,000 in par amount of preference shares issued by various CDOs sponsored by Taberna from Mercury for a purchase price of approximately $8,685.
Brandywine Construction & Management, Inc., or Brandywine is an affiliate of the spouse of Betsy Z. Cohen, our Chairman, and father of Daniel G. Cohen, our Chief Executive Officer. Brandywine provided real estate management services to three and six properties underlying our real estate interests as of March 31, 2007 and 2006, respectively. Management fees of $37 and $164 were paid to Brandywine for the three-month periods ended March 31, 2007 and 2006, respectively, relating to those interests.
18
RAIT Financial Trust
Notes to Consolidated Financial Statements
As of March 31, 2007
(Unaudited and dollars in thousands, except share and per share amounts)
NOTE 10: DISCONTINUED OPERATIONS
The following table summarizes the single asset held for sale and the liabilities related to the asset held for sale as of March 31, 2007:
| | | |
Investment in real estate, net of accumulated depreciation | | $ | 12,720 |
Prepaids and other assets | | | 534 |
| | | |
Total assets held for sale | | | 13,254 |
| | | |
Accounts payable and accrued expenses | | $ | 250 |
| | | |
Total liabilities related to assets held for sale | | $ | 250 |
| | | |
The following table summarizes revenue and expense information for the four properties sold since January 1, 2006 and the one property held for sale as of March 31, 2007:
| | | | | | |
| | | For the three month period ended March 31 |
| | | 2007 | | 2006 |
Rental income | | $ | 483 | | $ | 4,444 |
Expenses: | | | | | | |
Real estate operating expenses | | | 276 | | | 3,271 |
Depreciation | | | 51 | | | 231 |
| | | | | | |
Total expenses | | | 327 | | | 3,502 |
| | | | | | |
Income from discontinued operations | | $ | 156 | | $ | 942 |
| | | | | | |
Discontinued operations have not been segregated in the consolidated statements of cash flows. Therefore, amounts for certain captions will not agree with respective data in the consolidated statements of operations.
NOTE 11: SUBSEQUENT EVENTS
On April 16, 2007, we terminated our $335,000 secured line of credit led by KeyBanc Capital Markets, as syndication agent. As of March 31, 2007, we had $20,000 outstanding under this facility and all amounts were repaid prior to April 16, 2007. We expensed $2,985 of deferred financing costs associated with the line of credit upon termination.
On April 18, 2007, we issued and sold in a private offering to qualified institutional buyers, $425,000 aggregate principal amount of 6.875% convertible senior notes due 2027. After deducting the initial purchaser’s discount and the estimated offering expenses, we received approximately $414,250 of net proceeds. Interest on the notes is paid semi-annually and the notes mature on April 15, 2027. In April 2007, our board of trustees authorized the repurchase of approximately $106,250 of our common shares. We used a portion of the net proceeds from the offering to repurchase 2,717,600 of our common shares at a price of $27.34 per share (the closing price on April 12, 2007, the date we entered into the purchase agreement relating to the offering) for an aggregate purchase price, including commission costs, of $74,381.
Prior to April 20, 2012, the notes will not be redeemable at RAIT’s option, except to preserve RAIT’s status as a REIT. On or after April 20, 2012, RAIT may redeem all or a portion of the notes at a
19
RAIT Financial Trust
Notes to Consolidated Financial Statements
As of March 31, 2007
(Unaudited and dollars in thousands, except share and per share amounts)
redemption price equal to the principal amount plus accrued and unpaid interest (including additional interest), if any. Note holders may require RAIT to repurchase all or a portion of the notes at a purchase price equal to the principal amount plus accrued and unpaid interest (including additional interest), if any, on the notes on April 15, 2012, April 15, 2017, and April 15, 2022, or upon the occurrence of certain change in control transactions prior to April 20, 2012.
Prior to April 15, 2026, upon the occurrence of specified events, the notes will be convertible at the option of the holder at an initial conversion rate of 28.6874 shares per $1,000 principal amount of notes. The initial conversion price of $34.86 represents a 27.5% premium to the per share closing price of $27.34 on the date the offering was priced. Upon conversion of notes by a holder, the holder will receive cash up to the principal amount of such notes and, with respect to the remainder, if any, of the conversion value in excess of such principal amount, at the option of RAIT in cash or RAIT’s common shares. The initial conversion rate is subject to adjustment in certain circumstances.
20
REPORT OF INDEPENDENT REGISTERED PUBLIC ACCOUNTING FIRM
Board of Trustees and Shareholders RAIT Financial Trust
We have reviewed the accompanying consolidated balance sheet of RAIT Financial Trust and subsidiaries as of March 31, 2007 and the related consolidated statements of income, comprehensive income and cash flows for the three-month periods ended March 31, 2007 and 2006. These interim financial statements are the responsibility of the Company’s management.
We conducted our review in accordance with standards of the Public Company Accounting Oversight Board (United States). A review of interim financial information consists principally of applying analytical procedures and making inquiries of persons responsible for financial and accounting matters. It is substantially less in scope than an audit conducted in accordance with generally accepted auditing standards, the objective of which is the expression of an opinion regarding the financial statements taken as a whole. Accordingly, we do not express such an opinion.
Based on our review, we are not aware of any material modifications that should be made to the accompanying financial statements for them to be in conformity with accounting principles generally accepted in the United States of America.
We have previously audited, in accordance with the standards of the Public Company Accounting Oversight Board (United States), the consolidated balance sheet as of December 31, 2006, and the related consolidated statements of income, comprehensive income, changes in shareholders’ equity and cash flows for the year then ended (not presented herein); and in our report dated February 28, 2007 (which contains an explanatory paragraph relating to the initial adoption of financial accounting Board Statement No. 123RStock Based Compensation as discussed in note 11 to the consolidated financial statements) we expressed an unqualified opinion on those consolidated financial statements. In our opinion, the information set forth in the accompanying consolidated balance sheet as of December 31, 2006 is fairly stated, in all material respects, in relation to the consolidated balance sheet from which it has been derived.
/s/ Grant Thornton LLP
Philadelphia, Pennsylvania
May 3, 2007
21
| Item 2. | Management’s Discussion and Analysis of Financial Condition and Results of Operations |
Forward-Looking Statements
In addition to historical information, this discussion and analysis contains forward-looking statements. These statements can be identified by the use of forward-looking terminology including “may,” “believe,” “will,” “expect,” “anticipate,” “estimate,” “continue” or similar words. These forward-looking statements are subject to risks and uncertainties, as more particularly set forth in our filings with the Securities and Exchange Commission, including those described in the “Risk Factors” section of our Annual Report on Form 10-K for the year ended December 31, 2006, that could cause actual results to differ materially from those projected in the forward-looking statements. Readers are cautioned not to place undue reliance on these forward-looking statements, which reflect management’s analysis only as of the date hereof. We undertake no obligation to publicly revise or update these forward-looking statements to reflect events or circumstances that arise after the date of this report, except as may be required by applicable law.
Overview
We are a diversified real estate finance company that provides a comprehensive set of financing options to the real estate industry. We originate and invest in real estate-related assets that are underwritten through an integrated investment process. We conduct our business through our subsidiaries, RAIT Partnership and Taberna, as well as through their respective subsidiaries. RAIT and Taberna are self-managed and self-advised Maryland REITs. Our objective is to provide our shareholders with total returns over time, including quarterly distributions and capital appreciation, while seeking to manage the risks associated with our investment strategy.
In the three months ended March 31, 2007, we generated income for distribution to our shareholders primarily from a combination of the interest and dividend income from our investment portfolio and the fees from originating, structuring and managing the assets collateralizing CDOs we sponsored. We provide financing in the form of TruPS and subordinated debentures to real estate and real estate finance companies in the United States and Europe and commercial mortgages and mezzanine loans to real estate operators throughout the United States.
We continued to increase our investment in our targeted asset classes during the three months ended March 31, 2007. Our net increase in investments in this period was $1.5 billion.
We focus on maximizing the net spread we can generate on our match-funded portfolios financed primarily by CDOs. The difference, or net spread, between the yield on our investment portfolio and the cost to finance our investment portfolio generates our net investment income. In the three months ended March 31, 2007, our net investment income was $43.0 million. We also generated substantial fees in the three months ended March 31, 2007, primarily through our taxable REIT subsidiaries.
Commercial mortgages, mezzanine loans and TruPS and subordinated debentures are our primary asset classes. We expect these asset classes to be the primary sources for growth in returns generated by our investment portfolio. In the quarter ended March 31, 2007, we completed two CDOs – our eighth domestic CDO primarily collateralized by $750 million of TruPS and subordinated debentures from domestic real estate companies and our first European CDO collateralized primarily by approximately €600 million of subordinated debt to European real estate companies. We completed an equity offering in January 2007 and a convertible notes offering in April 2007 which we believe provide us additional liquidity to invest in our pipeline of opportunities and support our continued growth.
During the three months ended March 31, 2007, we developed certain financial and operating measures relating to our performance. Those measures are adjusted earnings, total fees generated and assets under management, or AUM. The following defines these measures and describes their relevence to our financial and operating performance:
| | • | | Adjusted Earnings – Adjusted earnings reflects net income available to common shares determined in accordance with GAAP adjusted for the following items: real estate depreciation, amortization of intangible assets, stock-based compensation, allowance for loan losses, unrealized gains (losses) on hedges, deferred fee revenue and the deferred tax provision. Refer to the section titled “Adjusted Earnings” below for more information on this measure and a reconciliation of this measure to our GAAP net income available to common shares. |
22
| | • | | Total Fees Generated – Total fees generated represents the total fees generated, without consideration for the deferral of fees, as yield adjustments, in accordance with GAAP. This data is useful to management as a gauge of our cash revenue as it drives earnings at our taxable REIT subsidiaries for distribution to us and ultimately to our shareholders. During the three months ended March 31, 2007, we had total fees generated of $30.4 million reconciled to our GAAP fees and other income as follows: |
| | | |
| | | For the three
months ended
March 31, 2007 |
Fees and other income, as reported | | $ | 7,881 |
Add (deduct): | | | |
Asset management fees, eliminated | | | 4,488 |
Deferred structuring fees | | | 5,625 |
Deferred origination fees, net of amortization | | | 12,384 |
| | | |
Total fees generated | | $ | 30,378 |
| | | |
| | • | | Assets Under Management – AUM represents the total assets that we own or are managing for third parties. While not all AUM generates fee income to our TRS’s, it is an important operating measure to gauge our asset growth, volume of originations, size and scale of our operations and our financial performance. As of March 31, 2007, our total AUM was $14.0 billion and includes our total investment portfolio described below and assets associated with unconsolidated CDOs for which we derive asset management fees. As of March 31, 2007, we did not consolidate our Taberna Preferred Funding I CDO with total assets of $688.0 million and Taberna Euro CDO I, with total assets of €600.0 million. |
Investors should read the Management’s Discussion and Analysis of Financial Condition and Results of Operations in our Annual Report on Form 10-K for the fiscal year ended December 31, 2006 for a detailed discussion of the following items:
| | • | | rates of prepayment on mortgages underlying our mortgage portfolio, |
| | • | | other market developments. |
23
Our Investment Portfolio
Please refer to our Annual Report on Form 10-K for additional information regarding each asset class. The table below summarizes our investment portfolio as of March 31, 2007:
| | | | | | | | | | | | |
| | | Amortized
Cost(1) | | Estimated
Fair Value(2) | | Percentage
of Total
Portfolio | | | Weighted-
Average
Coupon(3) | |
| | | (dollars in thousands) | |
| Investment in Securities: | | | | | | | | | | | | |
TruPS and subordinated debentures | | $ | 4,854,818 | | $ | 4,841,590 | | 38.2 | % | | 7.9 | % |
Unsecured REIT note receivables(4) | | | 393,766 | | | 390,584 | | 3.1 | % | | 5.6 | % |
CMBS receivables | | | 214,201 | | | 208,898 | | 1.7 | % | | 5.6 | % |
Other securities | | | 693,383 | | | 687,149 | | 5.5 | % | | 6.1 | % |
| | | | | | | | | | | | |
Total investment in securities | | | 6,156,168 | | | 6,128,221 | | 48.5 | % | | 7.5 | % |
| Investment in Mortgages and Loans | | | | | | | | | | | | |
Residential mortgages and mortgage-related receivables(4) | | | 4,495,796 | | | 4,497,130 | | 35.4 | % | | 5.6 | % |
Commercial mortgages and mezzanine loans | | | 1,878,543 | | | 1,864,850 | | 14.8 | % | | 8.9 | % |
| | | | | | | | | | | | |
Total investment in mortgages and loans | | | 6,374,339 | | | 6,361,980 | | 50.2 | % | | 6.6 | % |
| Investment in consolidated and unconsolidated real estate interests | | | 163,866 | | | 163,866 | | 1.3 | % | | N/A | |
| | | | | | | | | | | | |
Total Portfolio/Weighted Average | | $ | 12,694,373 | | $ | 12,654,067 | | 100.0 | % | | 7.0 | % |
| | | | | | | | | | | | |
| (1) | Amortized cost reflects the cost incurred by us to acquire or originate the asset, net of origination discount. |
| (2) | The fair value of our investments represents our management’s estimate of the price that a willing buyer would pay a willing seller for such assets. Our management bases this estimate on the underlying interest rates and credit spreads for fixed-rate securities and, to the extent available, quoted market prices. The amortized cost of our consolidated and unconsolidated real estate interests approximates fair value. |
| (3) | Weighted average coupon is calculated on the unpaid principal amount of the underlying instruments which does not necessarily correspond to amortized cost or estimated fair value. |
| (4) | Our investments in residential mortgages and mortgage-related receivables at December 31, 2006 consisted of investments in adjustable rate residential mortgages. These mortgages bear interest rates that are fixed for three, five, seven and ten year periods, respectively, and reset annually thereafter and are referred to as 3/1, 5/1, 7/1 and 10/1 ARMs, respectively. We financed our investment in these assets through short-term repurchase agreements and long-term securitizations. |
A summary of each asset class is as follows:
Commercial real estate loans, including mortgage loans and mezzanine loans.
The tables below describe certain characteristics of our commercial mortgages, mezzanine loans and other loans as of March 31, 2007 (dollars in thousands):
| | | | | | | | | | | | | | | | | | |
| | | Carrying
Amount | | Estimated
Fair Value | | Range of
Loan Yields | | Weighted
Average
Coupon | | | Range of Maturities | | Number
of Loans | | % of
Total
Loan
Portfolio | |
Commercial mortgages | | $ | 1,179,677 | | $ | 1,175,672 | | 6.9% –13.0% | | 8.2 | % | | April 2007 – Nov. 2015 | | 80 | | 62.8 | % |
Mezzanine loans | | | 528,936 | | | 522,313 | | 5.2% –16.0% | | 10.7 | % | | April 2007 –August 2021 | | 163 | | 28.2 | % |
Other loans | | | 169,930 | | | 166,865 | | 6.9% –7.9% | | 7.5 | % | | May 2010 –October 2016 | | 9 | | 9.0 | % |
| | | | | | | | | | | | | | | | | | |
Total | | $ | 1,878,543 | | $ | 1,864,850 | | | | 8.9 | % | | | | 252 | | 100.0 | % |
| | | | | | | | | | | | | | | | | | |
24
The charts below describe the property types and the geographic breakdown of our commercial mortgages, mezzanine loans and other loans as of March 31, 2007:
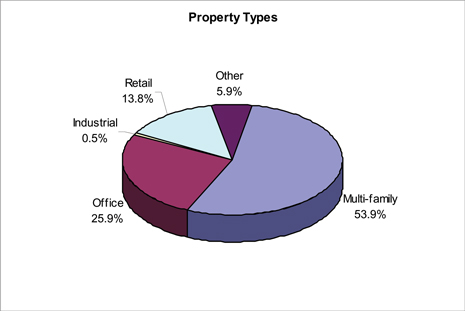

TruPS and subordinated debentures.We originate TruPS and subordinated debentures and finance those investments through CDOs. As of March 31, 2007, we had invested in $4.8 billion of TruPS and subordinated debentures through CDOs that we consolidate. These TruPS and subordinated debentures had a weighted average interest rate of 7.9% as of March 31, 2007. The issuers from whom we purchased our TruPS and subordinated debentures had a weighted average S&P credit rating of BB-, a weighted average ratio of debt to total capitalization of 77.0% and a weighted average interest coverage ratio of 2.1 times. As of March 31, 2007, approximately 81% of our issuers of TruPS and subordinated debentures were publicly traded companies.
“Weighted Average S&P Credit Rating” refers to the average, unpublished corporate credit ratings assigned at our request by Standard & Poor’s for the TruPS issuers based upon due diligence information compiled by us and provided to Standard & Poor’s. “Interest Coverage Ratio” represents a financial measure that we use in underwriting issuers of TruPS. We generally calculate this ratio as earnings before interest expense, taxes and depreciation and amortization (EBITDA) divided by interest expense.
25
The chart below describes the industry sector breakdown of our investments in TruPS and subordinated debentures by issuer industry as of March 31, 2007:
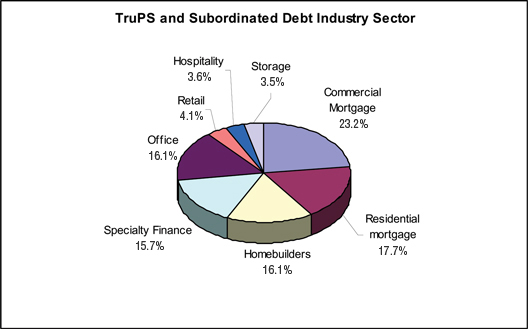
Residential mortgage loans.We acquire residential mortgage loans with the intention of holding them for investment, rather than for sale. These mortgage loans have an average FICO score of 738, an average principal balance of approximately $482,000 and an average loan-to-value ratio of approximately 73.8%. A FICO score is a credit score developed by Fair Isaac & Co., or Fair Isaac, for rating the credit risk of borrowers. FICO scores range from 300-850 and a higher score indicates a lower credit risk. Fair Isaac’s website states that the median FICO score in the United States is 723.
Set forth below is certain information with respect to the residential mortgage loans owned as of March 31, 2007 (dollar amounts in thousands).
| | | | | | | | | | | | | | | | | |
| | | Carrying
Amount | | Average
Interest
Rate | | | Average Next
Adjustment Date | | Average Contractual Maturity | | Average
FICO
Score | | Number of Loans | | % | |
3/1 ARM | | $ | 134,144 | | 5.6 | % | | 08/15/08 | | August 2035 | | 733 | | 345 | | 3.0 | % |
5/1 ARM | | | 3,705,229 | | 5.6 | % | | 07/29/10 | | September 2035 | | 738 | | 7,604 | | 82.4 | % |
7/1 ARM | | | 589,391 | | 5.7 | % | | 09/06/11 | | July 2035 | | 737 | | 1,295 | | 13.1 | % |
10/1 ARM | | | 67,032 | | 5.7 | % | | 06/27/15 | | June 2035 | | 749 | | 75 | | 1.5 | % |
| | | | | | | | | | | | | | | | | |
Total | | $ | 4,495,796 | | 5.6 | % | | | | | | 738 | | 9,319 | | 100.0 | % |
| | | | | | | | | | | | | | | | | |
The chart below describes the geographic breakdown of the residential mortgage loans we own as of March 31, 2007:
26
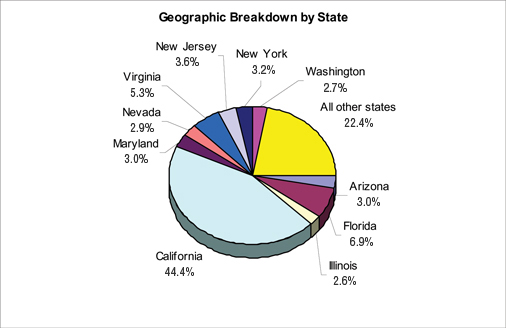
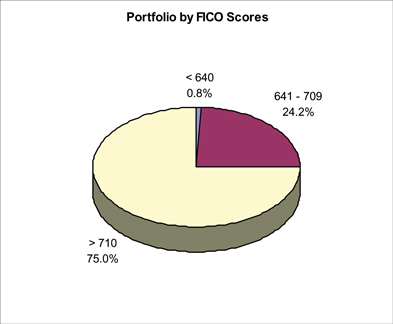
Mortgage-backed securities, including RMBS, CMBS, unsecured REIT notes and other real estate-related debt securities.
The table and the chart below describe certain characteristics of our mortgage-backed securities and other real estate-related debt securities as of March 31, 2007 (dollars in thousands):
| | | | | | | | | | | |
Investment Description | | Amortized Cost | | Weighted
Average
Coupon | | | Weighted
Average Years to
Maturity | | Estimated Fair Value |
RMBS | | $ | 508,070 | | 5.7 | % | | 27.3 | | $ | 503,307 |
CMBS and receivables | | | 214,201 | | 5.6 | % | | 35.5 | | | 208,898 |
Unsecured REIT notes | | | 393,766 | | 5.6 | % | | 10.1 | | | 390,584 |
Other securities | | | 185,313 | | 7.1 | % | | 31.5 | | | 183,842 |
| | | | | | | | | | | |
Total | | $ | 1,301,350 | | 5.9 | % | | 24.0 | | $ | 1,286,631 |
| | | | | | | | | | | |
27
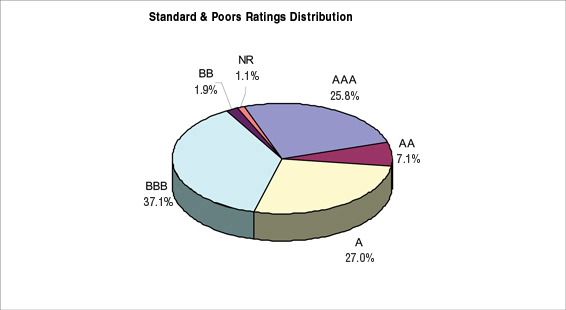
Real estate investments and preferred equity interests.As of March 31, 2007, we had approximately $163.9 million of investments in real estate interests, excluding $13.3 million of an investment made in one property designated as held for sale as of March 31, 2007.
Adjusted Earnings
We define adjusted earnings as net income available to common shares, determined in accordance with GAAP, adjusted for the following items: real estate depreciation, amortization of intangible assets, stock-based compensation, allowance for loan losses, unrealized gains (losses) on hedges, deferred fee revenue and the deferred tax provision. Adjusted Earnings is a non-GAAP financial measurement, and does not purport to be an alternative to reported net income, determined in accordance with GAAP, as a measure of operating performance or to cash flows from operating activities, determined in accordance with GAAP, as a measure of liquidity.
Management views adjusted earnings as a useful and appropriate supplement to net income and earnings per share. The measure serves as an additional measure of our operating performance because it facilitates evaluation of us without the effects of certain adjustments in accordance with GAAP that may not necessarily be indicative of current operating performance. Adjusted earnings should be reviewed in connection with net income and cash flows from operating, investing and financing activities in our consolidated financial statements, to help analyze how our business is performing. Adjusted earnings and other supplemental performance measures are defined in various ways throughout the REIT industry. Investors should consider these differences when comparing our adjusted earnings to other REITs.
The table below reconciles the differences between reported net income and adjusted earnings for the three-month periods ended March 31, 2007 and 2006 (dollar amounts in thousands):
| | | | | | | |
| | | For the Three-Month Period
Ended March, 31 |
| | | 2007 | | | 2006 |
Net income available to common shares, as reported | | $ | 20,348 | | | $ | 18,051 |
Add (deduct): | | | | | | | |
Depreciation on real estate investments | | | 768 | | | | 304 |
Amortization of intangible assets | | | 14,289 | | | | — |
Provision for losses | | | 3,718 | | | | — |
Unrealized (gains) losses on interest rate hedges | | | (88 | ) | | | — |
Share-based compensation | | | 2,956 | | | | — |
Fee income deferred | | | 18,009 | | | | — |
Deferred tax provision | | | (8,113 | ) | | | — |
| | | | | | | |
Adjusted earnings | | $ | 51,887 | | | $ | 18,355 |
| | | | | | | |
28
REIT Taxable Income
To qualify as a REIT, we are required to annually make distributions to our shareholders in an amount at least equal to 90% of our REIT taxable income, determined without regard to the deduction for dividends paid and excluding net capital gains. In addition, to avoid certain U.S. federal excise taxes, we are required to annually make distributions to our shareholders in an amount at least equal to certain designated percentages of our net taxable income. Because we expect to make distributions based on the foregoing requirements, and not based on our earnings computed in accordance with GAAP, we expect that our distributions may at times be more or less than our reported earnings as computed in accordance with GAAP.
Total taxable income and REIT taxable income are non-GAAP financial measurements, and do not purport to be an alternative to reported net income determined in accordance with GAAP as a measure of operating performance or to cash flows from operating activities determined in accordance with GAAP as a measure of liquidity. Our total taxable income represents the aggregate amount of taxable income generated by us and by our domestic and foreign TRSs. REIT taxable income is calculated under U.S. federal tax laws in a manner that, in certain respects, differs from the calculation of net income pursuant to GAAP. REIT taxable income excludes the undistributed taxable income of our domestic TRSs, which is not included in REIT taxable income until distributed to us. Subject to certain TRS value limitations, there is no requirement that our domestic TRSs distribute their earnings to us. REIT taxable income, however, generally includes the taxable income of our foreign TRSs because we will generally be required to recognize and report our taxable income on a current basis. Since we are structured as a REIT and the Internal Revenue Code requires that we distribute substantially all of our net taxable income in the form of distributions to our shareholders, we believe that presenting investors with the information management uses to calculate our net taxable income is useful to investors in understanding the amount of the minimum distributions that we must make to our shareholders so as to comply with the rules set forth in the Internal Revenue Code. Because not all companies use identical calculations, this presentation of total taxable income and REIT taxable income may not be comparable to other similarly titled measures prepared and reported by other companies.
The table below reconciles the differences between reported net income and total taxable income and REIT taxable income for the three month period ended March 31, 2007 and 2006 (dollar amounts in thousands):
| | | | | | | | |
| | | For the three months ended
March 31 | |
| | | 2007 | | | 2006 | |
Net income available to common shares, as reported | | $ | 20,348 | | | $ | 18,051 | |
Add (deduct): | | | | | | | | |
Provision for losses | | | 3,718 | | | | — | |
Domestic TRS book-to-total taxable income differences: | | | | | | | | |
Income tax benefit | | | (423 | ) | | | — | |
Fees deferred or eliminated in consolidation | | | 18,009 | | | | — | |
Amortization of intangible assets | | | 14,289 | | | | — | |
Stock compensation and other temporary tax differences | | | 1,003 | | | | — | |
CDO investments aggregate book-to-taxable income differences(1) | | | (1,789 | ) | | | — | |
Accretion of loan discounts | | | 575 | | | | — | |
Other book to tax differences | | | (123 | ) | | | (820 | ) |
| | | | | | | | |
Total taxable income | | | 55,607 | | | | 17,231 | |
Less: Taxable income attributable to domestic TRS entities | | | (21,818 | ) | | | — | |
Plus: Dividends paid by domestic TRS entities | | | 16,250 | | | | — | |
| | | | | | | | |
Estimated REIT taxable income (prior to deduction for dividends paid) | | $ | 50,039 | | | $ | 17,231 | |
| | | | | | | | |
| (1) | Amounts reflect the aggregate book-to-total taxable income differences and are primarily comprised of (a) unrealized gains on interest rate hedges within CDO entities that Taberna consolidated, (b) amortization of original issue discounts and debt issuance costs and (c) differences in tax year-ends between Taberna and its CDO investments. |
29
Results of Operations
On December 11, 2006, we acquired Taberna upon the completion of our stock-for-stock merger. As a result of this merger, the results of our operations for the three month period ended March 31, 2007 are not directly comparable to the results of operations for the three month period ended March 31, 2006.
Three-Month Period Ended March 31, 2007 Compared to the Three-Month Period Ended March 31, 2006
Revenue
Investment interest income increased approximately $181.9 million, or 876%, to approximately $202.7 million for the three month period ended March 31, 2007 from approximately $20.8 million for the three month period ended March 31, 2006. Of the increase, $166.8 million was attributable to the interest earning assets acquired from Taberna with the remaining increase associated with the increase in our commercial and mezzanine loans from March 31, 2006.
Investment interest expense increased approximately $153.7 million to approximately $159.1 million for the three month period ended March 31, 2007 from approximately $5.4 million for the three month period ended March 31, 2007. Of this increase, $143.8 million was attributable to the interest bearing liabilities assumed from Taberna with the remaining increase attributable to our increased borrowings under our lines of credit and the issuance of our CDO notes payable in November 2006, through our first CDO, RAIT CRE CDO I, Ltd.
Our provision for loan loss relates primarily to investments in residential mortgages and mortgage-related receivables acquired from Taberna on December 11, 2006. The provision for loan loss increased to approximately $3.7 million for the three month period ended March 31, 2007 as compared to zero for the the three month period ended March 31, 2006. We maintain an allowance for loss on our investments in residential mortgages and mortgage-related receivables, commercial mortgages, mezzanine loans and other
30
loans. Specific allowances for losses are established for impaired loans based on a comparison of the recorded carrying value of the loan to either the present value of the loan’s expected cash flow, the loan’s estimated market price or the estimated fair value of the underlying collateral. Our provision for losses associated with our residential mortgages acquired from Taberna on December 11, 2006 is based on statistical evidence of historical losses on homogenous pools of residential mortgages.
The change in fair value of free-standing derivatives represents the earnings on our first-dollar risk of loss associated with our warehouse facilities. Our free-standing derivatives during 2007 were acquired from Taberna on December 11, 2006. As of March 31, 2007, our first dollar risk of loss in our warehouses, identified as warehouse deposits on our consolidated balance sheet, was $56.5 million. The change in fair value of these free-standing derivative instruments was $3.2 million. Our first dollar risk of loss, or warehouse deposit, requirement associated with our warehouse facilities range from 5% to 10%.
Rental income decreased approximately $1.2 million, or 32%, to approximately $2.4 million for the three month period ended March 31, 2007 from approximately $3.6 million for the three month period ended March 31, 2006. This decrease was attributable to the timing of the 2005 annual reconciliation of amounts due from a major tenant during the three months ended March 31, 2006 and decreased occupied square feet during the three months ended March 31, 2007 relating to this major tenant.
Fee income and other increased approximately $2.2 million, or 39%, to approximately $7.9 million for the three month period ended March 31, 2007 from approximately $5.7 million for the three month period ended March 31, 2006. This increase was primarily due to the structuring fee of $5.6 million that we received in connection with the completion of Taberna Euro CDO I, Ltd. in January 2007 partially offset by decreased fees on commercial and mezzanine loans. Historically, we received fees from our borrowers simultaneously or subsequently obtaining third party-financing for their projects. In first quarter 2007, the majority of our borrowers did not seek third-party financings and rather financed their projects with us.
Expenses
Compensation expense. Compensation expense increased approximately $6.5 million, or 346%, to approximately $8.4 million for the three month period ended March 31, 2007 from approximately $1.9 million for the three month period ended March 31, 2006. This increase is due to the following: (i) $2.7 million of compensation-related expenses associated with the Taberna employees, (ii) $1.8 million of amortization expense associated with restricted shares assumed from Taberna that did not fully vest on December 11, 2006, (iii) $1.2 million of amortization expense associated with our January 2007 phantom unit grant and (iv) $0.8 million of increased compensation costs for our historical employees and new employees hired since March 31, 2006.
General and administrative expenses. General and administrative expenses increased approximately $5.1 million, or 436%, to approximately $6.3 million for the three month period ended March 31, 2007 from approximately $1.2 million for the three month period ended March 31, 2006. This increase is primarily due to the following: (i) $2.5 million of general and administrative expenses related to the operations acquired from Taberna, (ii) a $1.0 million fee paid to Eton Park Capital Management for providing a standby commitment to purchase equity in the Taberna Euro CDO I, Ltd. transaction that we closed in January 2007, (iii) $0.6 million of increased legal, accounting, and other professional fees, (iv) $0.2 million of servicing and trustee fees associated with RAIT CRE CDO I, and (v) increased other general and administrative costs, including travel and entertainment.
Real estate operating expenses; Depreciation.Real estate operating expenses increased approximately $0.6 million, or 32%, to approximately $2.6 million for the three month period ended March 31, 2007 from approximately $2.0 million for the three month period ended March 31, 2006. This increase is due primarily to interest paid on $30.0 million of financing obtained during 2006 relating to one real estate investment and $0.3 million of additional real estate operating expenses from a property consolidated in February 2007.
Depreciation expense increased approximately $0.5 million, or 153%, to approximately $0.8 million for the three month period ended March 31, 2007 from approximately $0.3 million for the three month period ended March 31, 2006.
31
Intangible amortization. Intangible amortization represents the amortization of intangible assets acquired from Taberna on December 11, 2006. The total intangibles acquired were approximately $124.2 million and have useful lives ranging from 1 to 10 years. Amortization for the period from January 1, 2007 through March 31, 2007 was approximately $14.3 million.
Other Income (Expenses)
Interest and other income. Interest and other income increased approximately $6.7 million to approximately $7.0 million for the three month period ended March 31, 2007 from approximately $0.3 million for the three month period ended March 31, 2006. This increase is due primarily to $3.8 million of interest and other income associated with restricted cash balances acquired from Taberna and higher average cash balances invested with financial institutions with higher yielding interest bearing accounts during the three month period ended March 31, 2007 as compared to the three month period ended March 31, 2006.
Unrealized gain on interest rate hedges. Unrealized gains on interest rate hedges was approximately $0.1 million for the three month period ended March 31, 2007 and entirely related to interest rate hedges assumed from Taberna on December 11, 2006. At acquisition, we designated the interest rate swaps assumed from Taberna that were associated with CDO notes payable and repurchase agreements as hedges pursuant to SFAS No. 133. At designation, these interest rate swaps had a fair value not equal to zero. However, we concluded, at designation, that these hedging arrangements were highly effective during their term using regression analysis and determined that the hypothetical derivative method would be used in measuring any ineffectiveness. At March 31, 2007, we updated our regression analysis and concluded that these hedging arrangements were still highly effective during their remaining term and used the hypothetical derivative method in measuring the ineffective portions of these hedging arrangements. As a result, we recorded a gain of approximately $0.1 million associated with the ineffective portions of these hedging arrangements. Management cannot ensure that these off-market interest rate swaps will be highly effective in the future and further ineffectiveness, either unrealized gains or unrealized losses, may be recorded in earnings.
Equity in loss of equity method investments. Equity in loss of equity method investments was a loss of approximately $4,000 for the three month period ended March 31, 2007.
Minority interest. Minority interest represents the earnings of consolidated entities allocated to third parties. Minority interest increased approximately $5.8 million to approximately $5.8 million for the three month period ended March 31, 2007. This increase is primarily attributable to the minority interests assumed from Taberna. Our ownership of consolidated CDOs ranged from 52.8% to 100.0% of the preferred shares issued by each CDO.
Provision for income taxes. We maintain several domestic TRS entities that are subject to U.S. federal and state and local income taxes. For the three month period ended March 31, 2007, the provision for income taxes was a benefit of $0.4 million.
Income from discontinued operations
Income from discontinued operations represents the revenue, expenses, and gains from the sale of properties either held for sale or sold during the three month period ended March 31, 2007 and 2006. Income from discontinued operations decreased $0.7 million, or 83%, to approximately $0.2 million for the three-month period ended March 31, 2007 from approximately $0.9 million for the three-month period ended March 31, 2006. The decrease is due to the number of properties that were either designated as held for sale or sold subsequent to March 31, 2006.
Liquidity and Capital Resources
Liquidity is a measure of our ability to meet potential cash requirements, including ongoing commitments to repay borrowings, fund and maintain investments, pay distributions and other general business needs. We believe our available cash balances, funds available under our warehouse facilities and other financing arrangements, and cash flows from operations will be sufficient to fund our liquidity requirements for the next 12 months. We may use short-term repurchase agreements, lines of credit, term
32
debt and other forms of financing to finance our operations. Should our liquidity needs exceed our available sources of liquidity, we believe that our CDO and investment securities could be sold directly or as part of CDO transactions or other securitizations to raise additional cash. We expect to continue to expand our business and may have to arrange for additional sources of capital through the issuance of debt or equity or additional bank borrowings to fund that growth. We may not be able to obtain any additional financing when we desire to do so, or may not be able to obtain desired financing on terms and conditions acceptable to us. If we fail to obtain additional financing, the pace of our growth could be reduced.
Our primary cash requirements are as follows:
| | • | | to distribute a minimum of 90% of our net taxable income and to make investments in a manner that enables us to maintain our qualification as a REIT; |
| | • | | to provide cash collateral for our warehouse agreements; |
| | • | | to make investments in CDOs or other securities; |
| | • | | to repay our indebtedness under our repurchase agreements; |
| | • | | to pay costs associated with future borrowings, including interest, incurred to finance our investment strategies; |
| | • | | to pay employee salaries and incentive compensation; and |
| | • | | to pay U.S. federal, state, and local taxes of our TRSs. |
We intend to meet these short-term liquidity requirements through the following:
| | • | | the use of our cash and cash equivalent balances of $169.7 million as of March 31, 2007; |
| | • | | cash generated from operating activities, including net investment income from our investment portfolio, fee income received by Taberna Capital and RAIT Partnership through their collateral management agreements and CDO structuring fees, and origination fees received by Taberna Securities. The collateral management fees as well as the structuring fees paid by CDO entities, although eliminated for financial reporting purposes with respect to the consolidated CDOs, represent cash inflows to us, and, after the payment of income taxes, the remaining cash may be used for our operating expenses or distributions; and |
| | • | | proceeds from future borrowings or offerings of our common and preferred shares and debt securities. |
Cash Flows
As of March 31, 2007 and March 31, 2006, we maintained cash and cash equivalents of approximately $169.7 million and $13.0 million, respectively. Our cash and cash equivalents were generated from the following activities (dollar amounts in thousands):
| | | | | | | | |
| | | For the Three-Month Period
Ended March 31 | |
| | | 2007 | | | 2006 | |
Cash flows from operating activities | | $ | 56,048 | | | $ | 21,091 | |
Cash flows from investing activities | | | (1,345,663 | ) | | | (139,389 | ) |
Cash flows from financing activities | | | 1,359,929 | | | | 59,926 | |
| | | | | | | | |
Net change in cash and cash equivalents | | | 70,314 | | | | (58,372 | ) |
Cash and cash equivalents at beginning of period | | | 99,367 | | | | 71,420 | |
| | | | | | | | |
Cash and cash equivalents at end of period | | $ | 169,681 | | | $ | 13,048 | |
| | | | | | | | |
33
Our principal source of cash flows is from our financing activities, specifically the issuance of CDO notes to finance our investments in securities and loans and our January 2007 issuance of 11,500,000 of our common shares. Our increased cash flow from operating activities is primarily the result of our increased investment portfolio when compared to our 2006 investment portfolio.
The increased cash outflow from our investing activities in 2007 as compared to 2006 is primarily attributable to our investments in securities.
Capitalization
Debt Financing.
We maintain various forms of short-term and long-term financing arrangements. Generally, these financing agreements are collateralized by assets within CDOs or mortgage securitizations. The following table summarizes our indebtedness and debt financing sources as of March 31, 2007 (dollar amounts in thousands):
| | | | | | | | | | | | | | | | |
Description | | Principal | | Unamortized
Premium
(Discount) | | | Carrying
Amount | | Interest Rate
Terms | | Current
Weighted-
Average
Interest Rate | | Contractual
Maturity |
Repurchase agreements and other indebtedness | | $ | 1,983,123 | | $ | — | | | $ | 1,983,123 | | 5.4% to 7.7% | | 5.9% | | Apr. 2007
to 2037 (1) |
Mortgage-backed securities issued(2) | | | 3,610,231 | | | (41,342 | ) | | | 3,568,889 | | 4.6% to 5.5%(3) | | 5.0% | | 2035 |
Trust preferred obligations | | | 592,013 | | | — | | | | 592,013 | | 6.8% to 9.1% | | 7.3% | | 2036 |
CDO notes payable(2) | | | 5,493,107 | | | (119,660 | ) | | | 5,373,447 | | 4.7% to 10.4% | | 6.2% | | 2035 to 2046 |
| | | | | | | | | | | | | | | | |
Total indebtedness | | $ | 11,678,474 | | $ | (161,002 | ) | | $ | 11,517,472 | | | | | | |
| | | | | | | | | | | | | | | | |
| (1) | We intend to re-negotiate and extend our repurchase agreements as they mature. |
| (2) | Excludes mortgage-backed securities and CDO notes payable purchased by us which are eliminated in consolidation. |
| (3) | Rates generally follow the terms of the underlying mortgages, which are fixed for a period of time and variable thereafter. |
| (a) | Repurchase agreements and other indebtedness: |
On February 15, 2007, we entered into a repurchase agreement with an investment bank to provide up to $750.0 million of financing to accumulate commercial loan investments in commercial mortgages and mezzanine loans on a short-term basis pending a CDO issuance. The agreement terminates on February 14, 2008 and bears interest at various rates over LIBOR ranging from 0.30% to 1.35%, depending on the types and ratings of assets financed. As of March 31, 2007, this repurchase agreement had $307.7 million outstanding collateralized by commercial mortgage and mezzanine loans with a principal amount of $354.4 million.
On February 12, 2007, we formed Taberna Funding Capital Trust I which issued $25.0 million of trust preferred securities to investors and $100,000 of common securities to us. The combined proceeds were used by Taberna Funding Capital Trust I to purchase $25.1 million of junior subordinated notes issued by us. The junior subordinated notes are the sole assets of Taberna Capital Trust I and mature on April 30, 2037, but are callable on or after April 30, 2012. Interest on the junior subordinated notes is payable quarterly at a fixed rate of 7.69% through April 2012 and thereafter at a floating rate equal to three-month LIBOR plus 2.50%.
On April 16, 2007, we terminated our $335.0 million secured line of credit led by KeyBanc Capital Markets, as syndication agent. As of March 31, 2007, we had $20.0 million outstanding under this facility as of March 31, 2007 and all amounts were repaid prior to April 16, 2007.
34
On March 29, 2007, we closed Taberna Preferred Funding VIII, Ltd., a $772.0 million CDO transaction that provides financing for investments consisting of TruPS issued by REITs and real estate operating companies, senior and subordinated notes issued by real estate entities, commercial mortgage-backed securities, other real estate interests, senior loans and CDOs issued by special purpose issuers that own a portfolio of commercial real estate loans. The investments that are owned by Taberna Preferred Funding VIII are pledged as collateral to secure its debt and, as a result, are not available to us, our creditors or our shareholders. Taberna Preferred Funding VIII issued a total of $471.0 million of notes at par to investors. In addition, we retained $111.0 million of the senior notes, $50.0 million of the junior notes and $60.0 million of the preference shares. The notes issued to investors bear interest at rates ranging from LIBOR plus 0.34% to LIBOR plus 4.90%. All of the notes mature in 2037, although Taberna Preferred Funding VIII may call the notes at par at any time after May 2017. The senior notes retained by us bear interest at rates ranging from LIBOR plus 0.34% to LIBOR plus 0.53% and the junior notes retained by us bear interest at rates ranging from LIBOR plus 2.85% to LIBOR plus 4.90%. We financed our investment in the senior notes through $103.7 million of borrowings under our existing repurchase agreements bearing interest at rates ranging from LIBOR plus 0.05% to LIBOR plus 0.10%.
| (c) | Convertible Senior Notes: |
On April 18, 2007, we issued and sold in a private offering to qualified institutional buyers, $425.0 million aggregate principal amount of 6.875% convertible senior notes due 2027. After deducting the initial purchaser’s discount and the estimated offering expenses, we received approximately $414.3 million of net proceeds. Interest on the notes is paid semi-annually and the notes mature on April 15, 2027. In April 2007, our board of trustees authorized the repurchase of approximately $106.3 million of our common shares. We used a portion of the net proceeds from the offering to repurchase 2,717,600 of our common shares at a price of $27.34 per share (the closing price on April 12, 2007 the date we entered into the purchase agreement relating to the offering) for an aggregate purchase price, including commission costs, of $74.4 million.
Prior to April 20, 2012, the notes will not be redeemable at RAIT’s option, except to preserve RAIT’s status as a REIT. On or after April 20, 2012, RAIT may redeem all or a portion of the notes at a redemption price equal to the principal amount plus accrued and unpaid interest (including additional interest), if any. Note holders may require RAIT to repurchase all or a portion of the notes at a purchase price equal to the principal amount plus accrued and unpaid interest (including additional interest), if any, on the notes on April 15, 2012, April 15, 2017, and April 15, 2022, or upon the occurrence of certain change in control transactions prior to April 20, 2012.
Prior to April 15, 2026, upon the occurrence of specified events, the notes will be convertible at the option of the holder at an initial conversion rate of 28.6874 shares per $1,000 principal amount of notes. The initial conversion price of $34.86 represents a 27.5 percent premium to the per share closing price of $27.34 on the date the offering was priced. Upon conversion of notes by a holder, the holder will receive cash up to the principal amount of such notes and, with respect to the remainder, if any, of the conversion value in excess of such principal amount, at the option of RAIT in cash or RAIT’s common shares. The initial conversion rate is subject to adjustment in certain circumstances.
Equity.
On January 23, 2007, our board of trustees awarded 408,517 phantom units, valued at $15.0 million using our closing stock price of $36.71, to various employees and trustees. The awards generally vest over four year periods.
On January 23, 2007, our board of trustees declared a first quarter 2007 cash dividend of $0.484375 per share on our 7.75% Series A Cumulative Redeemable Preferred Shares and $0.5234375 per share on our 8.375% Series B Cumulative Redeemable Preferred Shares. The dividends were paid on April 2, 2007 to holders of record on March 1, 2007 and totaled $2.5 million.
On January 24, 2007, 6,010 of our phantom unit awards were redeemed for our common shares. These phantom units were fully vested at the time of redemption.
35
On January 24, 2007, we issued 11,500,000 common shares in a public offering at an offering price of $34.00 per share. After deducting offering costs, including the underwriter’s discount, and expenses of approximately $24.1 million, we received approximately $366.9 million of net proceeds.
On March 15, 2007, our board of trustees declared a quarterly distribution of $0.80 per common share totaling $50.9 million that was paid on April 13, 2007 to shareholders of record as of March 29, 2007.
On April 18, 2007, in connection with our convertible senior notes offering referred to above, we used a portion of the net proceeds to repurchase 2,717,600 of our common shares at a price of $27.34 per share (the closing price on April 12, 2007) for an aggregate purchase price of $74.4 million.
Off-Balance Sheet Arrangements and Commitments
We maintain arrangements with various investment banks regarding CDO securitizations and warehouse facilities. Prior to the completion of a CDO securitization, investments are acquired by the warehouse providers in accordance with the warehouse facilities. Pursuant to the terms of the warehouse agreements, we receive the difference between the interest earned on the investments under the warehouse facilities and the interest charged by the warehouse facilities from the dates on which the respective securities are acquired. Under the warehouse agreements, we are required to deposit cash collateral with the warehouse provider and as a result, we bear the first dollar risk of loss, and in some cases share the first dollar risk of loss, up to our warehouse deposit, if (i) an investment funded through the warehouse facility becomes impaired or (ii) a CDO is not completed by the end of the warehouse period, and in either case, if the warehouse facility is required to liquidate the securities at a loss. Upon the completion of a CDO securitization, the cash collateral held by the warehouse provider is returned to us. The terms of the warehouse facilities are generally at least nine months. As of March 31, 2007, we had approximately $56.5 million of cash collateral held by warehouse providers pursuant to warehouse facilities. These arrangements are deemed to be derivative financial instruments and are recorded by us at fair value each accounting period with the change in fair value recorded in earnings. These arrangements represent our only off-balance sheet arrangements.
A summary of these arrangements is as follows (dollars in thousands):
| | | | | | | | | | | |
Warehouse Facility | | Warehouse
Availability | | Funding as of
March 31,
2007 | | Remaining
Availability | | Maturity |
Merrill Lynch International | | $ | 700,053 | | $ | 400,419 | | $ | 299,634 | | June 2007 to February 2008 |
Bear, Stearns & Co. Inc. | | | 700,000 | | | 395,188 | | | 304,812 | | September 2007 to March 2008 |
| | | | | | | | | | | |
Total | | $ | 1,400,053 | | $ | 795,607 | | $ | 604,446 | | |
| | | | | | | | | | | |
The financing costs of these warehouse facilities are based on one-month LIBOR plus 50 basis points.
Critical Accounting Estimates and Policies
Our Annual Report on Form 10-K for the year ended December 31, 2006 contains a discussion of our critical accounting policies. There have been no material changes in our critical accounting policies since December 31, 2006. See also Note 2 in our unaudited consolidated financial statements for the three-month period ended March 31, 2007, as set forth herein. Management discusses our critical accounting policies and management’s judgments and estimates with our Audit Committee.
| Item 3. | Quantitative and Qualitative Disclosures about Market Risk |
Market risk is the exposure to loss resulting from changes in interest rates, commodity prices and equity prices. In pursuing our business plan, the primary market risk to which we are exposed is interest rate risk. Changes in the general level of interest rates prevailing in the financial markets may affect the spread between our yield on invested assets and cost of funds and, in turn, our ability to make distributions or payments to our shareholders. While we have not experienced any significant credit losses, in the event of a significant rising interest rate environment and/or economic downturn, defaults could increase and result in losses to us which adversely affect our operating results and liquidity.
36
There have been no material changes in Quantitative and Qualitative disclosures in 2007 from the disclosures included in our Annual Report on Form 10-K for the year ended December 31, 2006. Reference is made to Item 7A included in our Annual Report on Form 10-K for the year ended December 31, 2006.
| Item 4. | Controls and Procedures |
Disclosure Controls and Procedures
We maintain disclosure controls and procedures that are designed to ensure that information required to be disclosed in our reports under the Securities Exchange Act of 1934, as amended, or the Exchange Act, is recorded, processed, summarized, and reported within the time periods specified in the SEC’s rules and forms, and that such information is accumulated and communicated to our management, including our chief executive officer and our chief financial officer, as appropriate, to allow timely decisions regarding required disclosure. In designing and evaluating the disclosure controls and procedures, our management recognized that any controls and procedures, no matter how well designed and operated, can provide only reasonable assurance of achieving the desired control objectives, and our management necessarily was required to apply its judgment in evaluating the cost-benefit relationship of possible controls and procedures.
Under the supervision of our chief executive officer and chief financial officer and with the participation of our disclosure committee, we have carried out an evaluation of the effectiveness of our disclosure controls and procedures as of the end of the period covered by this report. Based upon that evaluation, our chief executive officer and chief financial officer concluded that our disclosure controls and procedures are effective at the reasonable assurance level.
Changes in Internal Control Over Financial Reporting
There has been no change in our internal control over financial reporting that occurred during the three months ended March 31, 2007 that has materially affected, or is reasonably likely to materially affect, our internal control over financial reporting.
Part II. OTHER INFORMATION
As part of our business, we acquire and dispose of real estate investments and, as a result, expect that we will engage in routine litigation in the ordinary course of that business. Management does not expect that any such litigation will have a material adverse effect on our consolidated financial position or results of operations.
The following risk factors supplement the risk factors previously disclosed by us in our Form 10-K for the fiscal year ended December 31, 2006.
37
The realizable value of some of our investments, and our ability to finance those investments at acceptable rates, or at all, may be affected by factors in the residential mortgage market that are beyond our control.
We invest in various securities that have direct or indirect exposure to the U.S. residential mortgage market, including the “subprime” sectors of that market. Through our CDOs that invest in TruPS, we hold a direct investment in one issuer whose business is primarily origination of subprime mortgages. We also hold interests in a private partnership that has invested in CDO equity and debt securities which are partly backed by collateral issued by subprime mortgage originators. We also hold investments, or may in the future make investments, in companies whose businesses have or will have exposure, directly or indirectly, to the subprime or other components of the U.S. residential mortgage market. Moreover, we also hold investment grade and non-investment grade mortgage-backed securities representing interests in pools of residential mortgage loans, some of which may be characterized as subprime loans. While we believe that we have properly recorded the carrying value of all of our investments, third parties may value these investments differently than us, which may affect our cost of financing these investments.
To the extent that the credit quality of any of these investments is adversely affected by exposure to the subprime or other aspects of the U.S. residential real estate market, and we or (if we rely upon or are affected by a third party valuation) a third party determine to mark down the estimated value of that investment, we may be required to repay some portion or all of any related financing as a result of requirements to maintain specified levels of asset value, provisions relating to the amount of permissible borrowings to asset value or otherwise. Also, we finance some of our investments in mortgage-backed securities and residential mortgages through repurchase agreement facilities which contain “mark-to market” provisions. If a repurchase agreement counterparty marks down the value of our investment, we may be required to provide additional collateral to the counterparty. Failure to do so could result in the sale of the assets subject to the repurchase agreement by the counterparty and the loss of some or all of our investment.
If companies in which we invest are themselves directly or indirectly invested in U.S. residential mortgage loans and are thereby exposed to changes in the value of residential mortgage loans, the value of our investment in those companies may be temporarily or permanently impaired by movements in the market for residential mortgage loans or securities backed by such loans.
| Item 2. | Unregistered Sales of Equity Securities and Use of Proceeds |
Not applicable.
| Item 3. | Defaults Upon Senior Securities |
Not applicable.
| Item 4. | Submission of Matters to a Vote of Security Holders |
Not applicable.
Not applicable.
38
The exhibits filed as part of this quarterly report on Form 10-Q are identified in the exhibit index immediately following the signature page of this Report. Such Exhibit Index is incorporated herein by reference.
39
SIGNATURES OF REGISTRANT
Pursuant to the requirements of the Securities Exchange Act of 1934, the Registrant has duly caused this report to be signed on its behalf by the undersigned thereunto duly authorized.
| | | | |
| | RAIT FINANCIAL TRUST |
| | (Registrant) |
| | |
| Date: May 4, 2007 | | By: | | /s/ Daniel G. Cohen |
| | | | Daniel G. Cohen, Chief Executive Officer and Trustee |
| | | | (Principal Executive Officer) |
| | | | |
| Date: May 4, 2007 | | By: | | /s/ Jack E. Salmon |
| | | | Jack E. Salmon, Chief Financial Officer and Treasurer |
| | | | (Principal Financial Officer) |
| | | | |
| Date: May 4, 2007 | | By: | | /s/ Ellen J. DiStefano |
| | | | Ellen J. DiStefano, Chief Accounting Officer |
| | | | (Principal Accounting Officer) |
EXHIBIT INDEX
| | |
Exhibit
Number | | Description of Documents |
| 3.1 | | Amended and Restated Declaration of Trust. (1) |
| |
| 3.1.1 | | Articles of Amendment to Amended and Restated Declaration of Trust. (2) |
| |
| 3.1.2 | | Articles of Amendment to Amended and Restated Declaration of Trust. (3) |
| |
| 3.1.3 | | Certificate of Correction to the Amended and Restated Declaration of Trust. (4) |
| |
| 3.1.4 | | Articles of Amendment to Amended and Restated Declaration of Trust. (5) |
| |
| 3.1.5 | | Articles Supplementary relating to the 7.75% Series A Cumulative Redeemable Preferred Shares of Beneficial Interest (the “Series A Articles Supplementary”). (6) |
| |
| 3.1.6 | | Certificate of Correction to the Series A Articles Supplementary. (6) |
| |
| 3.1.7 | | Articles Supplementary relating to the 8.375% Series B Cumulative Redeemable Preferred Shares of Beneficial
Interest. (7) |
| |
| 3.2 | | By-laws. (1) |
| |
| 4.1 | | Form of Certificate for Common Shares of Beneficial Interest. (5) |
| |
| 4.2 | | Form of Certificate for 7.75% Series A Cumulative Redeemable Preferred Shares of Beneficial Interest. (8) |
| |
| 4.3 | | Form of Certificate for 8.375% Series B Cumulative Redeemable Preferred Shares of Beneficial Interest. (7) |
| |
| 4.4 | | Indenture dated as of April 18, 2007 among RAIT Financial Trust, as issuer, or RAIT, RAIT Partnership, L.P. and RAIT Asset Holdings, LLC, as guarantors, and Wells Fargo Bank, N.A., as trustee. (9) |
| |
| 4.5 | | Registration Rights Agreement dated as of April 18, 2007 between RAIT and Bear, Stearns & Co. Inc. (9) |
| |
| 10.1 | | RAIT 2005 Equity Compensation Plan, or ECP, Form of Unit Award to Cover Grants to Employees adopted January 24, 2007. (10) |
| |
| 10.2 | | ECP Form of Unit Award to Cover Grants to Section 16 Officers adopted January 24, 2007. (10) |
| |
| 10.3 | | Purchase Agreement dated April 12, 2007 Between RAIT and Bear, Stearns & Co. Inc. (9) |
| |
| 10.4 | | Notation of Guarantee by RAIT Partnership, L.P. and RAIT Asset Holdings, LLC, as guarantors. (9) |
| |
| 15.1 | | Awareness Letter from Independent Accountants. |
| |
| 31.1 | | Certification Pursuant to 13a-14 (a) under the Securities Exchange Act of 1934. |
| |
| 31.2 | | Certification Pursuant to 13a-14 (a) under the Securities Exchange Act of 1934. |
| |
| 32.1 | | Certification Pursuant to 18 U.S.C. Section 1350. |
| |
| 32.2 | | Certification Pursuant to 18 U.S.C. Section 1350. |
| (1) | Incorporated by reference to RAIT’s Registration Statement on Form S-11 (Registration No. 333-35077). |
| (2) | Incorporated by reference to RAIT’s Registration Statement on Form S-11 (Registration No. 333-53067). |
| (3) | Incorporated by reference to RAIT’s Registration Statement on Form S-2 (Registration No. 333-55518). |
| (4) | Incorporated by reference to RAIT’s Form 10-Q for the Quarterly Period ended March 31, 2002 (File No. 1-14760). |
| (5) | Incorporated herein by reference to RAIT’s Form 8-K as filed with the SEC on December 15, 2006 (File No. 1-14760). |
| (6) | Incorporated herein by reference to RAIT’s Form 8-K as filed with the SEC on March 18, 2004 (File No. 1-14760). |
| (7) | Incorporated herein by reference to RAIT’s Form 8-K as filed with the SEC on October 1, 2004 (File No. 1-14760). |
| (8) | Incorporated herein by reference to RAIT’s Form 8-K as filed with the SEC on March 22, 2004 (File No. 1-14760). |
| (9) | Incorporated by reference to RAIT’s Form 8-K as filed with the SEC on April 18, 2007 (File No. 1-14760). |
| (10) | Incorporated by reference to RAIT’s Form 8-K as filed with the SEC on January 27, 2007 (File No. 1-14760). |