Exhibit 99.1

Fourth Quarter 2017
Supplemental Information
1

TABLE OF CONTENTS
Company Information | 3 |
Financial Highlights | 5 |
Balance Sheets | |
Consolidated by quarter | 6 |
Statements of Operations, FFO & CORE FFO | |
Consolidated | 7 |
Consolidated – Trailing 5 Quarters | 8 |
| |
Adjusted EBITDA and Coverage Ratios | 9 |
Portfolio Data: | |
Loan Portfolio Data | 10 |
Real Estate Portfolio Data | 11 |
Real Estate Portfolio, Changes in the portfolio | 12 |
Indebtedness Overview | 13 |
Definitions | 14 |
2

RAIT Financial Trust
December 31, 2017
Company Information:
RAIT Financial Trust is an internally-managed real estate investment trust focused on managing a portfolio of commercial real estate (CRE) loans and properties.
Corporate Headquarters | Two Logan Square 100 N. 18th Street, 23rd Floor Philadelphia, Pa 19103 215.207.2100 |
Trading Symbol | NYSE: “RAS” |
Investor Relations Contact | Andres Viroslav Two Logan Square 100 N. 18th Street, 23rd Floor Philadelphia, Pa 19103 215.207.2100 |
3
Common and Preferred Stock Information:
| For the Three Months Ended | |
| December 31, 2017 | | | September 30, 2017 | | | June 30, 2017 | | | March 31, 2017 | | | December 31, 2016 | |
Common: | | | | | | | | | | | | | | | | | | | |
Share Price, period end | $ | 0.38 | | | $ | 0.73 | | | $ | 2.19 | | | $ | 3.20 | | | $ | 3.36 | |
Share Price, high | $ | 0.72 | | | $ | 2.25 | | | $ | 3.18 | | | $ | 3.91 | | | $ | 3.45 | |
Share Price, low | $ | 0.29 | | | $ | 0.55 | | | $ | 1.90 | | | $ | 2.80 | | | $ | 2.41 | |
Dividends declared | $ | - | | | $ | - | | | $ | 0.05 | | | $ | 0.09 | | | $ | 0.09 | |
Dividend yield, period end | | 0.0 | % | | | 0.0 | % | | | 9.1 | % | | | 11.3 | % | | | 10.7 | % |
Common shares outstanding | | 93,045,152 | | | | 93,046,621 | | | | 93,105,742 | | | | 92,691,743 | | | | 92,295,478 | |
Weighted Average common shares, basic | | 91,579,654 | | | | 91,559,636 | | | | 91,453,415 | | | | 91,300,812 | | | | 91,203,955 | |
Weighted Average common shares, diluted | | 91,579,654 | | | | 91,559,636 | | | | 91,453,415 | | | | 91,300,812 | | | | 91,971,817 | |
| | | | | | | | | | | | | | | | | | | |
Preferred: | | | | | | | | | | | | | | | | | | | |
Series A | | | | | | | | | | | | | | | | | | | |
Shares outstanding | | 5,344,353 | | | | 5,344,353 | | | | 5,344,353 | | | | 5,344,353 | | | | 5,344,353 | |
Share price, period end | $ | 12.15 | | | $ | 14.30 | | | $ | 20.60 | | | $ | 21.47 | | | $ | 20.28 | |
Par, per share | $ | 25.00 | | | $ | 25.00 | | | $ | 25.00 | | | $ | 25.00 | | | $ | 25.00 | |
Par | $ | 133,608,825 | | | $ | 133,608,825 | | | $ | 133,608,825 | | | $ | 133,608,825 | | | $ | 133,608,825 | |
Dividend | $ | 0.484375 | | | $ | 0.484375 | | | $ | 0.484375 | | | $ | 0.484375 | | | $ | 0.484375 | |
Yield | | 15.9 | % | | | 13.5 | % | | | 9.4 | % | | | 9.0 | % | | | 9.6 | % |
Series B | | | | | | | | | | | | | | | | | | | |
Shares outstanding | | 2,340,969 | | | | 2,340,969 | | | | 2,340,969 | | | | 2,340,969 | | | | 2,340,969 | |
Share price, period end | $ | 12.59 | | | $ | 15.17 | | | $ | 22.90 | | | $ | 22.85 | | | $ | 21.26 | |
Par, per share | $ | 25.00 | | | $ | 25.00 | | | $ | 25.00 | | | $ | 25.00 | | | $ | 25.00 | |
Par | $ | 58,524,225 | | | $ | 58,524,225 | | | $ | 58,524,225 | | | $ | 58,524,225 | | | $ | 58,524,225 | |
Dividend | $ | 0.5234375 | | | $ | 0.5234375 | | | $ | 0.5234375 | | | $ | 0.5234375 | | | $ | 0.5234375 | |
Yield | | 16.6 | % | | | 13.8 | % | | | 9.1 | % | | | 9.2 | % | | | 9.8 | % |
Series C | | | | | | | | | | | | | | | | | | | |
Shares outstanding | | 1,640,425 | | | | 1,640,425 | | | | 1,640,425 | | | | 1,640,425 | | | | 1,640,425 | |
Share price, period end | $ | 13.24 | | | $ | 15.74 | | | $ | 23.98 | | | $ | 24.00 | | | $ | 22.56 | |
Par, per share | $ | 25.00 | | | $ | 25.00 | | | $ | 25.00 | | | $ | 25.00 | | | $ | 25.00 | |
Par | $ | 41,010,625 | | | $ | 41,010,625 | | | $ | 41,010,625 | | | $ | 41,010,625 | | | $ | 41,010,625 | |
Dividend | $ | 0.5546875 | | | $ | 0.5546875 | | | $ | 0.5546875 | | | $ | 0.5546875 | | | $ | 0.5546875 | |
Yield | | 16.8 | % | | | 14.1 | % | | | 9.3 | % | | | 9.2 | % | | | 9.8 | % |
Series D (not publicly traded) | | | | | | | | | | | | | | | | | | | |
Shares outstanding | | 3,133,720 | | | | 3,133,720 | | | | 3,133,720 | | | | 3,536,000 | | | | 3,536,000 | |
Par, per share | $ | 25.00 | | | $ | 25.00 | | | $ | 25.00 | | | $ | 25.00 | | | $ | 25.00 | |
Par | $ | 78,343,000 | | | $ | 78,343,000 | | | $ | 78,343,000 | | | $ | 88,400,000 | | | $ | 88,400,000 | |
Coupon | | 8.50 | % | | | 8.50 | % | | | 8.50 | % | | | 8.50 | % | | | 8.50 | % |
4
FINANCIAL HIGHLIGHTS
($'s in 000's) | | For the Three Months Ended | |
| | December 31, 2017 | | | September 30, 2017 | | | June 30, 2017 | | | March 31, 2017 | | | December 31, 2016 | |
OPERATING DATA: | | | | | | | | | | | | | | | | | | | | |
Lending: | | | | | | | | | | | | | | | | | | | | |
Investments in loans | | $ | 1,270,607 | | | $ | 1,260,346 | | | $ | 1,267,705 | | | $ | 1,315,539 | | | $ | 1,292,639 | |
Gross loan production | | $ | 87,460 | | | $ | 100,585 | | | $ | 154,675 | | | $ | 120,040 | | | $ | 67,540 | |
Weighted average interest rate of loan production (a) | | | 5.3 | % | | | 5.4 | % | | | 5.7 | % | | | 5.6 | % | | | 5.6 | % |
| | | | | | | | | | | | | | | | | | | | |
Real estate portfolio: | | | | | | | | | | | | | | | | | | | | |
Gross real estate investments | | $ | 274,672 | | | $ | 399,674 | | | $ | 470,249 | | | $ | 694,230 | | | $ | 854,646 | |
Property dispositions | | $ | 124,296 | | | $ | 63,260 | | | $ | 73,153 | | | $ | 138,326 | | | $ | 146,068 | |
Property income | | $ | 12,161 | | | $ | 15,012 | | | $ | 16,946 | | | $ | 20,065 | | | $ | 23,501 | |
Operating expenses | | $ | 8,742 | | | $ | 8,313 | | | $ | 9,509 | | | $ | 10,634 | | | $ | 13,084 | |
Net operating income | | $ | 3,419 | | | $ | 6,699 | | | $ | 7,437 | | | $ | 9,431 | | | $ | 10,417 | |
NOI margin | | | 28.1 | % | | | 44.6 | % | | | 43.9 | % | | | 47.0 | % | | | 44.3 | % |
| | | | | | | | | | | | | | | | | | | | |
EARNINGS & DIVIDENDS: | | | | | | | | | | | | | | | | | | | | |
Earnings (loss) per share from continuing operations - diluted | | $ | (0.05 | ) | | $ | (0.26 | ) | | $ | (1.38 | ) | | $ | (0.33 | ) | | $ | (0.37 | ) |
Earnings (loss) per share from discontinued operations - diluted | | $ | - | | | $ | - | | | $ | - | | | $ | - | | | $ | 0.54 | |
Earnings (loss) per share -- diluted | | $ | (0.05 | ) | | $ | (0.26 | ) | | $ | (1.38 | ) | | $ | (0.33 | ) | | $ | 0.17 | |
FFO per share | | $ | 0.04 | | | $ | (0.18 | ) | | $ | (0.54 | ) | | $ | (0.30 | ) | | $ | 0.05 | |
CAD per share (b) | | $ | (0.03 | ) | | $ | (0.01 | ) | | $ | (0.04 | ) | | $ | 0.06 | | | $ | 0.07 | |
Dividends per share | | $ | - | | | $ | - | | | $ | 0.05 | | | $ | 0.09 | | | $ | 0.09 | |
CAD payout ratio | | | 0.0 | % | | | 0.0 | % | | | -125.0 | % | | | 150.0 | % | | | 128.6 | % |
| | | | | | | | | | | | | | | | | | | | |
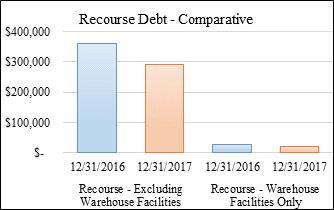
RECOURSE DEBT REDUCTIONS: | | | | | | | | | | | | | | | | | | | | |
Reductions of recourse debt, excluding warehouse facilities | | $ | 12,712 | | | $ | 10,160 | | | $ | 14,500 | | | $ | 32,000 | | | $ | 2,000 | |
| | | | | | | | | | | | | | | | | | | | |
CAPITALIZATION AND COVERAGE RATIOS: | | | | | | | | | | | | | | | | | | | | |
Recourse/Non-Recourse Debt: | | | | | | | | | | | | | | | | | | | | |
Recourse | | $ | 296,001 | | | $ | 410,042 | | | $ | 328,858 | | | $ | 439,733 | | | $ | 365,921 | |
Non-Recourse | | | 1,053,232 | | | | 976,996 | | | | 1,218,329 | | | | 1,142,815 | | | | 1,361,246 | |
Total Recourse/Non-Recourse debt | | | 1,349,233 | | | | 1,387,038 | | | | 1,547,187 | | | | 1,582,548 | | | | 1,727,167 | |
Preferred shares (par) | | | 311,487 | | | | 311,487 | | | | 311,487 | | | | 321,544 | | | | 321,544 | |
Common shares (market capitalization) | | | 35,357 | | | | 67,924 | | | | 203,902 | | | | 296,669 | | | | 310,113 | |
Noncontrolling interests, at carrying value | | | 3,632 | | | | 3,880 | | | | 3,880 | | | | 5,506 | | | | 5,386 | |
Total capitalization | | $ | 1,699,709 | | | $ | 1,770,329 | | | $ | 2,066,456 | | | $ | 2,206,268 | | | $ | 2,364,209 | |
| | | | | | | | | | | | | | | | | | | | |
Total Liabilities/Total Gross Assets | | | 84.1 | % | | | 84.4 | % | | | 84.3 | % | | | 76.3 | % | | | 76.2 | % |
Total Liabilities + Preferred/Total Gross Assets | | | 101.1 | % | | | 100.8 | % | | | 99.2 | % | | | 90.0 | % | | | 88.8 | % |
| | | | | | | | | | | | | | | | | | | | |
Interest Coverage (c) | | | 1.09 | x | | | 1.20 | x | | | 0.96 | x | | | 1.34 | x | | | 1.40 | x |
Interest + Preferred Coverage (d) | | | 0.76 | x | | | 0.85 | x | | | 0.68 | x | | | 0.94 | x | | | 1.00 | x |
| | | | | | | | | | | | | | | | | | | | |
OTHER KEY BENCHMARKS: | | | | | | | | | | | | | | | | | | | | |
Total Assets Under Management (AUM) | | $ | 2,772,545 | | | $ | 2,929,378 | | | $ | 3,170,495 | | | $ | 3,390,885 | | | $ | 3,575,224 | |
Total Gross Assets | | $ | 1,824,712 | | | $ | 1,902,295 | | | $ | 2,081,631 | | | $ | 2,347,452 | | | $ | 2,556,302 | |
| (a) | At the time of loan origination. |
| (b) | For the three months ended June 30, 2017, CAD includes the non-cash effect of a $3,636 write-off of accrued interest receivable related to a loan that was determined to be impaired during the period. CAD would have been $0.00 per share without the effect of this non-cash write-off. |
| (c) | For the three months ended June 30, 2017, Interest Coverage includes the non-cash effect of a $3,636 write-off of accrued interest receivable related to a loan that was determined to be impaired during the period. Interest Coverage would have been 1.19x without the effect of this non-cash write-off. |
| (d) | For the three months ended June 30, 2017, Interest + Preferred Coverage includes the non-cash effect of a $3,636 write-off of accrued interest receivable related to a loan that was determined to be impaired during the period. Interest + Preferred Coverage would have been 0.84x without the effect of this non-cash write-off. |
5
BALANCE SHEETS
CONSOLIDATED, by quarter
($'s in 000's) | | As of | | |
| | December 31, 2017 | | | September 30, 2017 | | | June 30, 2017 | | | March 31, 2017 | | | December 31, 2016 | | |
Assets | | | | | | | | | | | | | | | | | | | | | |
Investments in loans: | | | | | | | | | | | | | | | | | | | | | |
Investment in loans | | $ | 1,270,607 | | | $ | 1,260,346 | | | $ | 1,267,705 | | | $ | 1,315,539 | | | $ | 1,292,639 | | |
Allowance for loan losses | | | (14,883 | ) | | | (25,140 | ) | | | (23,514 | ) | | | (13,531 | ) | | | (12,354 | ) | |
Investments in loans, net | | | 1,255,724 | | | | 1,235,206 | | | | 1,244,191 | | | | 1,302,008 | | | | 1,280,285 | | |
Investments in real estate: | | | | | | | | | | | | | | | | | | | | | |
Investments in real estate at cost | | | 274,672 | | | | 399,674 | | | | 470,249 | | | | 694,230 | | | | 854,646 | | |
Accumulated depreciation | | | (28,768 | ) | | | (30,974 | ) | | | (35,359 | ) | | | (114,179 | ) | | | (138,214 | ) | |
Investments in real estate, net | | | 245,904 | | | | 368,700 | | | | 434,890 | | | | 580,051 | | | | 716,432 | | |
Investments in securities, at fair value | | | - | | | | - | | | | - | | | | - | | | | - | | |
Cash and cash equivalents | | | 53,380 | | | | 46,019 | | | | 89,317 | | | | 96,432 | | | | 110,531 | | |
Restricted cash | | | 157,914 | | | | 142,489 | | | | 193,580 | | | | 141,610 | | | | 190,179 | | |
Accrued interest receivable | | | 29,664 | | | | 32,307 | | | | 32,141 | | | | 36,176 | | | | 36,271 | | |
Other assets | | | 43,871 | | | | 34,905 | | | | 36,753 | | | | 49,080 | | | | 53,878 | | |
Intangible assets, net | | | 5,376 | | | | 8,062 | | | | 10,901 | | | | 17,258 | | | | 19,267 | | |
Total assets | | $ | 1,791,833 | | | $ | 1,867,688 | | | $ | 2,041,773 | | | $ | 2,222,615 | | | $ | 2,406,843 | | |
| | | | | | | | | | | | | | | | | | | | | |
Liabilities and Equity | | | | | | | | | | | | | | | | | | | | | |
Indebtedness, net | | $ | 1,390,188 | | | $ | 1,427,947 | | | $ | 1,588,067 | | | $ | 1,623,133 | | | $ | 1,751,082 | | |
Accrued interest payable | | | 4,688 | | | | 10,780 | | | | 9,229 | | | | 9,591 | | | | 8,347 | | |
Accounts payable and accrued expenses | | | 9,641 | | | | 15,201 | | | | 15,157 | | | | 14,033 | | | | 20,016 | | |
Derivative liabilities | | | - | | | | - | | | | - | | | | - | | | | - | | |
Borrowers' escrows | | | 117,070 | | | | 113,996 | | | | 104,197 | | | | 101,805 | | | | 107,183 | | |
Deferred taxes and other liabilities | | | 12,116 | | | | 38,217 | | | | 37,535 | | | | 43,572 | | | | 60,864 | | |
Total liabilities | | | 1,533,703 | | | | 1,606,141 | | | | 1,754,185 | | | | 1,792,134 | | | | 1,947,492 | | |
| | | | | | | | | | | | | | | | | | | | | |
Series D preferred stock | | | 78,343 | | | | 77,653 | | | | 75,654 | | | | 83,505 | | | | 81,581 | | |
| | | | | | | | | | | | | | | | | | | | | |
Equity: | | | | | | | | | | | | | | | | | | | | | |
Shareholders' Equity: | | | | | | | | | | | | | | | | | | | | | |
7.75% Series A Preferred shares | | | 53 | | | | 53 | | | | 53 | | | | 53 | | | | 53 | | |
8.375% Series B Preferred shares | | | 23 | | | | 23 | | | | 23 | | | | 23 | | | | 23 | | |
8.875% Series C Preferred shares | | | 17 | | | | 17 | | | | 17 | | | | 17 | | | | 17 | | |
Common shares, $0.03 par value per share | | | 2,791 | | | | 2,791 | | | | 2,793 | | | | 2,781 | | | | 2,769 | | |
Additional paid in capital | | | 2,094,804 | | | | 2,094,035 | | | | 2,093,270 | | | | 2,092,695 | | | | 2,093,257 | | |
Accumulated other comprehensive income (loss) | | | - | | | | - | | | | - | | | | - | | | | - | | |
Retained earnings (deficit) | | | (1,921,533 | ) | | | (1,916,905 | ) | | | (1,888,102 | ) | | | (1,754,099 | ) | | | (1,723,735 | ) | |
Total shareholders' equity | | | 176,155 | | | | 180,014 | | | | 208,054 | | | | 341,470 | | | | 372,384 | | |
Noncontrolling interests - continuing operations | | | 3,632 | | | | 3,880 | | | | 3,880 | | | | 5,506 | | | | 5,386 | | |
Noncontrolling interests - discontinued operations | | | - | | | | - | | | | - | | | | - | | | | - | | |
Total noncontrolling interests | | | 3,632 | | | | 3,880 | | | | 3,880 | | | | 5,506 | | | | 5,386 | | |
Total equity | | | 179,787 | | | | 183,894 | | | | 211,934 | | | | 346,976 | | | | 377,770 | | |
Total liabilities and equity | | $ | 1,791,833 | | | $ | 1,867,688 | | | $ | 2,041,773 | | | $ | 2,222,615 | | | $ | 2,406,843 | | |
6
STATEMENTS OF OPERATIONS, FFO & CAD
CONSOLIDATED – THREE AND TWELVE MONTHS ENDED DECEMBER 31, 2017
| | For the Three Months Ended December 31, | | | For the Year Ended December 31, | |
| | 2017 | | | 2016 | | | 2017 | | | 2016 | |
Revenue: | | | | | | | | | | | | | | | | |
Net interest margin | | | | | | | | | | | | | | | | |
Investment interest income | | $ | 19,568 | | | $ | 19,693 | | | $ | 70,215 | | | $ | 89,203 | |
Investment interest expense | | | (10,377 | ) | | | (8,849 | ) | | | (40,932 | ) | | | (35,806 | ) |
Net interest margin | | | 9,191 | | | | 10,844 | | | | 29,283 | | | | 53,397 | |
Property income | | | 12,161 | | | | 23,501 | | | | 64,184 | | | | 112,836 | |
Fee and other income | | | 1,347 | | | | 1,400 | | | | 6,251 | | | | 7,374 | |
Total revenue | | | 22,699 | | | | 35,745 | | | | 99,718 | | | | 173,607 | |
| | | | | | | | | | | | | | | | |
Expenses: | | | | | | | | | | | | | | | | |
Interest expense | | | 7,862 | | | | 11,914 | | | | 35,544 | | | | 55,049 | |
Real estate operating expenses | | | 8,742 | | | | 13,084 | | | | 37,198 | | | | 56,894 | |
Property management expenses | | | 2,081 | | | | 2,240 | | | | 8,853 | | | | 9,479 | |
General and administrative expenses: | | | | | | | | | | | | | | | | |
Compensation expenses | | | 3,216 | | | | 6,275 | | | | 13,426 | | | | 18,437 | |
Other general and administrative expenses | | | 3,189 | | | | 3,300 | | | | 11,816 | | | | 13,273 | |
Total general and administrative expenses | | | 6,405 | | | | 9,575 | | | | 25,242 | | | | 31,710 | |
Acquisition and integration expenses | | | 159 | | | | 248 | | | | 455 | | | | 624 | |
Provision for loan losses | | | 17,700 | | | | 3,848 | | | | 45,614 | | | | 8,050 | |
Depreciation and amortization expense | | | 4,461 | | | | 12,031 | | | | 28,173 | | | | 51,304 | |
IRT internalization and management transition expenses | | | — | | | | 6,271 | | | | 736 | | | | 6,271 | |
Shareholder activism expenses | | | - | | | | — | | | | 2,464 | | | | — | |
Employee separation expenses | | | - | | | | — | | | | 575 | | | | — | |
Total expenses | | | 47,410 | | | | 59,211 | | | | 184,854 | | | | 219,381 | |
Operating Income | | | (24,711 | ) | | | (23,466 | ) | | | (85,136 | ) | | | (45,774 | ) |
Other income (expense) | | | (44 | ) | | | (457 | ) | | | 100 | | | | (427 | ) |
Gains (loss) on assets | | | 644 | | | | 29,461 | | | | 23,439 | | | | 53,272 | |
Asset impairment | | | (6,136 | ) | | | (11,127 | ) | | | (102,490 | ) | | | — | |
Goodwill impairment | | | - | | | | — | | | | (8,342 | ) | | | — | |
Gain (loss) on deconsolidation of properties | | | 25,837 | | | | — | | | | 5,855 | | | | 1,331 | |
Gain (loss) on debt extinguishment | | | (456 | ) | | | 333 | | | | 488 | | | | (37,785 | ) |
Change in fair value of financial instruments | | | 6,729 | | | | 1,109 | | | | 13,422 | | | | (5,946 | ) |
Income (loss) before taxes | | | 1,863 | | | | (4,147 | ) | | | (152,664 | ) | | | (35,329 | ) |
Income tax benefit (provision) | | | 600 | | | | (20,601 | ) | | | 861 | | | | (2,550 | ) |
Income from continuing operations | | | 2,463 | | | | (24,748 | ) | | | (151,803 | ) | | | (37,879 | ) |
Discontinued operations: | | | | | | | | | | | | | | | | |
Income (loss) from discontinued operations | | | — | | | | 1,671 | | | | — | | | | 40,144 | |
Net income (loss) | | | 2,463 | | | | (23,077 | ) | | | (151,803 | ) | | | 2,265 | |
Income allocated to preferred shares | | | (7,086 | ) | | | (9,310 | ) | | | (32,816 | ) | | | (35,160 | ) |
(Income) loss allocated to noncontrolling interests | | | - | | | | 187 | | | | (76 | ) | | | (24,733 | ) |
Net income (loss) available to common shares | | $ | (4,623 | ) | | $ | (32,200 | ) | | $ | (184,695 | ) | | $ | (57,628 | ) |
| | | | | | | | | | | | | | | | |
Amount attributable to common shares: | | | | | | | | | | | | | | | | |
Net income (loss) available to common shares from continuing operations | | $ | (4,623 | ) | | $ | (34,078 | ) | | $ | (184,695 | ) | | $ | (69,604 | ) |
Net income (loss) available to common shares from discontinued operations | | | - | | | | 49,686 | | | | — | | | | 59,784 | |
Net income (loss) available to common shares | | $ | (4,623 | ) | | $ | 15,608 | | | $ | (184,695 | ) | | $ | (9,820 | ) |
| | | | | | | | | | | | | | | | |
EPS - BASIC: | | | | | | | | | | | | | | | | |
Earnings (loss) per share from continuing operations | | $ | (0.05 | ) | | $ | (0.37 | ) | | $ | (2.02 | ) | | $ | (0.77 | ) |
Earnings (loss) per share from discontinued operations | | | — | | | | 0.54 | | | | — | | | | 0.66 | |
Earnings per share - BASIC | | $ | (0.05 | ) | | $ | (0.35 | ) | | $ | (2.02 | ) | | $ | (0.11 | ) |
| | | | | | | | | | | | | | | | |
EPS - DILUTED: | | | | | | | | | | | | | | | | |
Earnings (loss) per share from continuing operations | | $ | (0.05 | ) | | $ | (0.37 | ) | | $ | (2.02 | ) | | $ | (0.77 | ) |
Earnings (loss) per share from discontinued operations | | | — | | | | 0.54 | | | | — | | | | 0.66 | |
Earnings per share - DILUTED | | $ | (0.05 | ) | | $ | 0.17 | | | $ | (2.02 | ) | | $ | (0.11 | ) |
Weighted-average shares outstanding - Basic | | | 91,579,654 | | | | 91,971,817 | | | | 91,479,533 | | | | 91,137,041 | |
Weighted-average shares outstanding - Diluted | | | 91,579,654 | | | | 91,971,817 | | | | 91,479,533 | | | | 91,137,041 | |
| | | | | | | | | | | | | | | | |
FUNDS FROM OPERATIONS (FFO): | | | | | | | | | | | | | | | | |
Net Income (loss) available to common shares | | $ | (4,623 | ) | | $ | 15,608 | | | $ | (184,695 | ) | | $ | (9,820 | ) |
Add-Back (Deduct): | | | | | | | | | | | | | | | | |
Depreciation | | | 3,252 | | | | 7,031 | | | | 20,423 | | | | 35,570 | |
(Gains) Losses on the sale of real estate | | | (644 | ) | | | (29,461 | ) | | | (23,439 | ) | | | (53,272 | ) |
Asset impairment | | | 6,136 | | | | 11,127 | | | | 98,126 | | | | 37,785 | |
Adjustments related to discontinued operations | | | — | | | | 65 | | | | — | | | | (1,747 | ) |
FFO | | $ | 4,121 | | | $ | 4,370 | | | $ | (89,585 | ) | | $ | 8,516 | |
FFO per share--basic | | $ | 0.04 | | | $ | 0.05 | | | $ | (0.98 | ) | | $ | 0.09 | |
Weighted-average shares outstanding | | | 91,579,654 | | | | 91,971,817 | | | | 91,479,533 | | | | 91,137,041 | |
| | | | | | | | | | | | | | | | |
CASH AVAILABLE FOR DISTRIBUTION (CAD): | | | | | | | | | | | | | | | | |
Net Income (loss) available to common shares | | $ | (4,623 | ) | | $ | 15,608 | | | $ | (184,695 | ) | | $ | (9,820 | ) |
Add-Back (Deduct): | | | | | | | | | | | | | | | | |
Depreciation and amortization expense | | | 4,461 | | | | 12,031 | | | | 28,173 | | | | 51,304 | |
Change in fair value of financial instruments | | | (6,729 | ) | | | (1,109 | ) | | | (13,422 | ) | | | 5,946 | |
(Gains) losses on assets | | | (644 | ) | | | (29,461 | ) | | | (23,439 | ) | | | (53,272 | ) |
(Gains) losses on deconsolidation of properties | | | (25,837 | ) | | | — | | | | (5,855 | ) | | | — | |
(Gains) losses on debt extinguishment | | | 456 | | | | (333 | ) | | | (488 | ) | | | (1,331 | ) |
Deferred income tax (benefit) provision | | | (600 | ) | | | 20,303 | | | | (577 | ) | | | 2,213 | |
Straight-line rental adjustments | | | (163 | ) | | | (187 | ) | | | (449 | ) | | | (1,369 | ) |
Equity based compensation | | | 778 | | | | 555 | | | | 2,611 | | | | 3,396 | |
Acquisition and integration expenses | | | 159 | | | | 248 | | | | 455 | | | | 624 | |
Origination fees and other deferred items | | | 5,905 | | | | 12,686 | | | | 32,559 | | | | 34,063 | |
Provision for loan losses | | | 17,700 | | | | 3,848 | | | | 45,614 | | | | 8,050 | |
IRT internalization and management transition expenses | | | — | | | | 6,271 | | | | 736 | | | | 6,271 | |
Asset impairment | | | 6,136 | | | | 11,127 | | | | 102,490 | | | | 37,785 | |
Goodwill impairment | | | — | | | | — | | | | 8,342 | | | | — | |
Shareholder activism expenses | | | — | | | | — | | | | 2,464 | | | | — | |
Employee separation expenses | | | — | | | | — | | | | 575 | | | | — | |
Net expenses associated with deconsolidated properties | | | 293 | | | | — | | | | 2,329 | | | | — | |
Discontinued operations and noncontrolling interest effect of certain adjustments | | | — | | | | (45,034 | ) | | | — | | | | (43,272 | ) |
CAD (a) | | $ | (2,708 | ) | | $ | 6,553 | | | $ | (2,577 | ) | | $ | 40,588 | |
CAD per share (a) | | $ | (0.03 | ) | | $ | 0.07 | | | $ | (0.03 | ) | | $ | 0.45 | |
Weighted-average shares outstanding | | | 91,579,654 | | | | 91,971,817 | | | | 91,479,533 | | | | 91,137,041 | |
| (a) | For the year ended December 31, 2017, CAD includes the non-cash effect of a $3,636 write-off of accrued interest receivable related to a loan that was determined to be impaired during the second quarter. For the year ended December 31, 2017, CAD would have been $1,059 or $0.01 per share, without the effect of this non-cash write-off. |
7
STATEMENT OF OPERATIONS, FFO & CAD
CONSOLIDATED – by quarter
($'s in 000's, except per share amounts) | | For the Three Months Ended | |
| | December 31, 2017 | | | September 30, 2017 | | | June 30, 2017 | | | March 31, 2017 | | | December 31, 2016 | |
Revenue: | | | | | | | | | | | | | | | | | | | | |
Net interest margin | | | | | | | | | | | | | | | | | | | | |
Investment interest income | | $ | 19,568 | | | $ | 18,115 | | | $ | 14,882 | | | $ | 17,650 | | | $ | 19,693 | |
Investment interest expense | | | (10,377 | ) | | | (10,236 | ) | | | (10,546 | ) | | | (9,773 | ) | | | (8,849 | ) |
Net interest margin | | | 9,191 | | | | 7,879 | | | | 4,336 | | | | 7,877 | | | | 10,844 | |
Property income | | | 12,161 | | | | 15,012 | | | | 16,946 | | | | 20,065 | | | | 23,501 | |
Fee and other income | | | 1,347 | | | | 1,712 | | | | 1,531 | | | | 1,661 | | | | 1,400 | |
Total revenue | | | 22,699 | | | | 24,603 | | | | 22,813 | | | | 29,603 | | | | 35,745 | |
Expenses: | | | | | | | | | | | | | | | | | | | | |
Interest expense | | | 7,862 | | | | 8,656 | | | | 8,883 | | | | 10,143 | | | | 11,914 | |
Real estate operating expenses | | | 8,742 | | | | 8,313 | | | | 9,509 | | | | 10,634 | | | | 13,084 | |
Property management expenses | | | 2,081 | | | | 1,908 | | | | 2,651 | | | | 2,213 | | | | 2,240 | |
General and administrative expenses: | | | | | | | | | | | | | | | | | | | | |
Compensation expenses | | | 3,216 | | | | 3,194 | | | | 3,529 | | | | 3,487 | | | | 6,275 | |
General and administrative expenses | | | 3,189 | | | | 3,233 | | | | 2,689 | | | | 2,705 | | | | 3,300 | |
Total general and administrative expenses | | | 6,405 | | | | 6,427 | | | | 6,218 | | | | 6,192 | | | | 9,575 | |
Acquisition and integration expenses | | | 159 | | | | 57 | | | | 67 | | | | 172 | | | | 248 | |
Provision for loan losses | | | 17,700 | | | | 5,516 | | | | 20,863 | | | | 1,535 | | | | 3,848 | |
Depreciation and amortization expense | | | 4,461 | | | | 6,139 | | | | 7,819 | | | | 9,754 | | | | 12,031 | |
IRT internalization and management transition expenses | | | - | | | | - | | | | - | | | | 736 | | | | 6,271 | |
Shareholder activism expense | | | - | | | | 155 | | | | 1,615 | | | | 694 | | | | — | |
Employee separation expenses | | | - | | | | 575 | | | | — | | | | — | | | | — | |
Total expenses | | | 47,410 | | | | 37,746 | | | | 57,625 | | | | 42,073 | | | | 59,211 | |
Operating Income | | | (24,711 | ) | | | (13,143 | ) | | | (34,812 | ) | | | (12,470 | ) | | | (23,466 | ) |
Other income (expense) | | | (44 | ) | | | 283 | | | | (153 | ) | | | 14 | | | | (457 | ) |
Gains (losses) on assets | | | 644 | | | | 30 | | | | 10,759 | | | | 12,006 | | | | 29,461 | |
Asset impairment | | | (6,136 | ) | | | (3,121 | ) | | | (85,809 | ) | | | (7,424 | ) | | | (11,127 | ) |
Goodwill impairment | | | — | | | | — | | | | (8,342 | ) | | | — | | | | — | |
Gains (losses) on deconsolidation of properties | | | 25,837 | | | | (4,035 | ) | | | — | | | | (15,947 | ) | | | — | |
Gains (losses) on debt extinguishment | | | (456 | ) | | | (644 | ) | | | (1,598 | ) | | | 3,186 | | | | 333 | |
Change in fair value of financial instruments | | | 6,729 | | | | 4,753 | | | | 3,093 | | | | (1,153 | ) | | | 1,109 | |
Income (loss) before taxes | | | 1,863 | | | | (15,877 | ) | | | (116,862 | ) | | | (21,788 | ) | | | (4,147 | ) |
Income tax benefit (provision) | | | 600 | | | | 34 | | | | (22 | ) | | | 249 | | | | (20,601 | ) |
Income (loss) from continuing operations | | | 2,463 | | | | (15,843 | ) | | | (116,884 | ) | | | (21,539 | ) | | | (24,748 | ) |
Discontinued operations: | | | | | | | | | | | | | | | | | | | | |
Income (loss) from discontinued operations | | | — | | | | — | | | | — | | | | — | | | | 1,671 | |
Gain (loss) on disposal of discontinued operations | | | — | | | | — | | | | — | | | | — | | | | 47,808 | |
Net income (loss) | | | 2,463 | | | | (15,843 | ) | | | (116,884 | ) | | | (21,539 | ) | | | 24,731 | |
Income allocated to preferred shares | | | (7,086 | ) | | | (8,387 | ) | | | (8,817 | ) | | | (8,526 | ) | | | (9,310 | ) |
(Income) loss allocated to noncontrolling interests | | | - | | | | - | | | | (56 | ) | | | (20 | ) | | | 187 | |
Net income (loss) available to common shares | | $ | (4,623 | ) | | $ | (24,230 | ) | | $ | (125,757 | ) | | $ | (30,085 | ) | | $ | 15,608 | |
| | | | | | | | | | | | | | | | | | | | |
Amount attributable to common shares: | | | | | | | | | | | | | | | | | | | | |
Net income (loss) available to common shares from continuing operations | | $ | (4,623 | ) | | $ | (24,230 | ) | | $ | (24,230 | ) | | $ | (30,085 | ) | | $ | (34,078 | ) |
Net income (loss) available to common shares from discontinued operations | | | - | | | | - | | | | - | | | | - | | | | 49,686 | |
Net income (loss) available to common shares | | $ | (4,623 | ) | | $ | (24,230 | ) | | $ | (24,230 | ) | | $ | (30,085 | ) | | $ | 15,608 | |
| | | | | | | | | | | | | | | | | | | | |
EPS - Basic: | | | | | | | | | | | | | | | | | | | | |
Earnings (loss) per share from continuing operations | | $ | (0.05 | ) | | $ | (0.26 | ) | | $ | (0.26 | ) | | $ | (0.27 | ) | | $ | (0.37 | ) |
Earnings (loss) per share from discontinued operations | | | — | | | | - | | | | - | | | | - | | | | 0.54 | |
Earnings Per Share - Basic | | $ | (0.05 | ) | | $ | (0.26 | ) | | $ | (1.38 | ) | | $ | (0.33 | ) | | $ | 0.17 | |
| | | | | | | | | | | | | | | | | | | | |
EPS - Diluted: | | | | | | | | | | | | | | | | | | | | |
Earnings (loss) per share from continuing operations | | $ | (0.05 | ) | | $ | (0.26 | ) | | $ | (0.26 | ) | | $ | (0.27 | ) | | $ | (0.37 | ) |
Earnings (loss) per share from discontinued operations | | | — | | | | - | | | | - | | | | - | | | | 0.54 | |
Earnings Per Share - Diluted | | $ | (0.05 | ) | | $ | (0.26 | ) | | $ | (1.38 | ) | | $ | (0.33 | ) | | $ | 0.17 | |
| | | | | | | | | | | | | | | | | | | | |
Weighted-average shares outstanding - Basic | | | 91,579,654 | | | | 91,559,636 | | | | 91,453,415 | | | | 91,300,812 | | | | 91,971,817 | |
Weighted-average shares outstanding - Diluted | | | 91,579,654 | | | | 91,559,636 | | | | 91,453,415 | | | | 91,300,812 | | | | 91,971,817 | |
| | | | | | | | | | | | | | | | | | | | |
Funds From Operations (FFO): | | | | | | | | | | | | | | | | | | | | |
Net Income (loss) available to common shares | | $ | (4,623 | ) | | $ | (24,230 | ) | | $ | (125,757 | ) | | $ | (30,085 | ) | | $ | 15,608 | |
Add-Back (Deduct): | | | | | | | | | | | | | | | | | | | | |
Depreciation | | | 3,252 | | | | 4,657 | | | | 5,630 | | | | 6,884 | | | | 7,031 | |
(Gains) Losses on the sale of real estate | | | (644 | ) | | | (30 | ) | | | (10,759 | ) | | | (12,006 | ) | | | (29,461 | ) |
Asset impairment | | | 6,136 | | | | 3,121 | | | | 81,444 | | | | 7,424 | | | | 11,127 | |
Adjustments related to discontinued operations | | | — | | | | — | | | | — | | | | - | | | | 65 | |
FFO | | $ | 4,121 | | | $ | (16,482 | ) | | $ | (49,442 | ) | | $ | (27,783 | ) | | $ | 4,370 | |
FFO per share | | $ | 0.04 | | | $ | (0.18 | ) | | $ | (0.54 | ) | | $ | (0.30 | ) | | $ | 0.05 | |
Weighted average shares | | | 91,579,654 | | | | 91,559,636 | | | | 91,453,415 | | | | 91,300,812 | | | | 91,971,817 | |
| | | | | | | | | | | | | | | | | | | | |
Cash Available for Distribution (CAD): | | | | | | | | | | | | | | | | | | | | |
Net Income (loss) available to common shares | | $ | (4,623 | ) | | $ | (24,230 | ) | | $ | (125,757 | ) | | $ | (30,085 | ) | | $ | 15,608 | |
Add-Back (Deduct): | | | | | | | | | | | | | | | | | | | | |
Depreciation and amortization expense | | | 4,461 | | | | 6,139 | | | | 7,819 | | | | 9,754 | | | | 12,031 | |
Change in fair value of financial instruments | | | (6,729 | ) | | | (4,753 | ) | | | (3,093 | ) | | | 1,153 | | | | (1,109 | ) |
(Gains) losses on assets | | | (644 | ) | | | (30 | ) | | | (10,759 | ) | | | (12,006 | ) | | | (29,461 | ) |
(Gain) loss on deconsolidation of properties | | | (25,837 | ) | | | 4,035 | | | | — | | | | 15,947 | | | | — | |
(Gain) loss on debt extinguishment | | | 456 | | | | 644 | | | | 1,598 | | | | (3,186 | ) | | | (333 | ) |
Deferred income tax (benefit) provision | | | (600 | ) | | | — | | | | 22 | | | | — | | | | 20,303 | |
Straight-line rental adjustments | | | (163 | ) | | | (463 | ) | | | 58 | | | | 119 | | | | (187 | ) |
Equity based compensation | | | 778 | | | | 779 | | | | 710 | | | | 344 | | | | 555 | |
Acquisition and integration expenses | | | 159 | | | | 57 | | | | 67 | | | | 172 | | | | 248 | |
Origination fees and other deferred items | | | 5,905 | | | | 6,490 | | | | 8,476 | | | | 11,688 | | | | 12,686 | |
Provision for loan losses | | | 17,700 | | | | 5,516 | | | | 20,863 | | | | 1,535 | | | | 3,848 | |
IRT internalization and management transition expenses | | | — | | | | - | | | | — | | | | 736 | | | | 6,271 | |
Shareholder activism expenses | | | - | | | | 155 | | | | 1,615 | | | | 694 | | | | — | |
Employee separation expenses | | | - | | | | 575 | | | | — | | | | — | | | | — | |
Asset impairment | | | 6,136 | | | | 3,121 | | | | 85,809 | | | | 7,424 | | | | 11,127 | |
Goodwill impairment | | | - | | | | - | | | | 8,342 | | | | - | | | | - | |
Net expenses associated with deconsolidated properties | | | 293 | | | | 689 | | | | — | | | | 873 | | | | — | |
Discontinued operations and noncontrolling interest effect of certain adjustments | | | — | | | | - | | | | 475 | | | | - | | | | (45,034 | ) |
CAD (a) | | $ | (2,708 | ) | | $ | (1,276 | ) | | $ | (3,755 | ) | | $ | 5,162 | | | $ | 6,553 | |
CAD per share (a) | | $ | (0.03 | ) | | $ | (0.01 | ) | | $ | (0.04 | ) | | $ | 0.06 | | | $ | 0.07 | |
Weighted average shares | | | 91,579,654 | | | | 91,559,636 | | | | 91,453,415 | | | | 91,300,812 | | | | 91,971,817 | |
| (a) | For the three months ended June 30, 2017, CAD includes the non-cash effect of a $3,636 write-off of accrued interest receivable related to a loan that was determined to be impaired during the period. CAD would have been $0.00 per share without the effect of this non-cash write-off. |
8
RECONCILIATION OF NET INCOME TO ADJUSTED EBITDA AND COVERAGE RATIOS
($'s in 000's) | | Three Months Ended | | | | Twelve Months Ended | |
| | December 31, 2017 | | | September 30, 2017 | | | June 30, 2017 | | | March 31, 2017 | | | December 31, 2016 | | | | December 31, 2017 | | | December 31, 2016 | |
ADJUSTED EBITDA: | | | | | | | | | | | | | | | | | | | | | | | | | | | | | |
Net income (loss) | | $ | 2,463 | | | $ | (15,843 | ) | | $ | (116,884 | ) | | $ | (21,539 | ) | | $ | 24,731 | | | | $ | (151,803 | ) | | $ | 50,073 | |
Add (deduct): | | | | | | | | | | | | | | | | | | | | | | | | | | | | | |
Investment interest expense | | | 10,377 | | | | 10,236 | | | | 10,546 | | | | 9,773 | | | | 8,849 | | | | | 40,932 | | | | 37,230 | |
Interest expense | | | 7,862 | | | | 8,656 | | | | 8,883 | | | | 10,143 | | | | 11,914 | | | | | 35,544 | | | | 53,625 | |
Acquisition and integration expenses | | | 159 | | | | 57 | | | | 67 | | | | 172 | | | | 248 | | | | | 455 | | | | 624 | |
Depreciation and amortization | | | 4,461 | | | | 6,139 | | | | 7,819 | | | | 9,754 | | | | 12,031 | | | | | 28,173 | | | | 51,304 | |
Provision for loan losses | | | 17,700 | | | | 5,516 | | | | 20,863 | | | | 1,535 | | | | 3,848 | | | | | 45,614 | | | | 8,050 | |
IRT internalization and management transition expenses | | | - | | | | - | | | | - | | | | 736 | | | | 6,271 | | | | | 736 | | | | 6,271 | |
Shareholder activism expenses | | | - | | | | 155 | | | | 1,615 | | | | 694 | | | | - | | | | | 2,464 | | | | - | |
Employee separation expenses | | | - | | | | 575 | | | | - | | | | - | | | | - | | | | | 575 | | | | - | |
(Gains) losses on assets | | | (644 | ) | | | (30 | ) | | | (10,759 | ) | | | (12,006 | ) | | | (29,461 | ) | | | | (23,439 | ) | | | (53,272 | ) |
(Gain) loss on deconsolidation of properties | | | (25,837 | ) | | | 4,035 | | | | - | | | | 15,947 | | | | - | | | | | (5,855 | ) | | | - | |
Asset impairment | | | 6,136 | | | | 3,121 | | | | 85,809 | | | | 7,424 | | | | 11,127 | | | | | 102,490 | | | | 37,785 | |
Goodwill impairment | | | - | | | | - | | | | 8,342 | | | | - | | | | - | | | | | 8,342 | | | | - | |
(Gain) loss on debt extinguishment | | | 456 | | | | 644 | | | | 1,598 | | | | (3,186 | ) | | | (333 | ) | | | | (488 | ) | | | (1,331 | ) |
Change in fair value of financial instruments | | | (6,729 | ) | | | (4,753 | ) | | | (3,093 | ) | | | 1,153 | | | | (1,109 | ) | | | | (13,422 | ) | | | 5,946 | |
Income tax (benefit) provision | | | (600 | ) | | | (34 | ) | | | 22 | | | | (249 | ) | | | 20,601 | | | | | (861 | ) | | | 2,550 | |
Net expenses associated with deconsolidated properties | | | - | | | | - | | | | 475 | | | | 873 | | | | - | | | | | 1,348 | | | | - | |
Additions (deductions) from discontinued operations | | | - | | | | - | | | | - | | | | - | | | | (44,794 | ) | | | | - | | | | (22,680 | ) |
Adjusted EBITDA (a): | | $ | 15,804 | | | $ | 18,474 | | | $ | 15,303 | | | $ | 21,224 | | | $ | 23,923 | | | | $ | 70,805 | | | $ | 176,175 | |
| | | | | | | | | | | | | | | | | | | | | | | | | | | | | |
INTEREST COST: | | | | | | | | | | | | | | | | | | | | | | | | | | | | | |
Investment interest expense | | $ | 10,377 | | | $ | 10,236 | | | $ | 10,546 | | | $ | 9,773 | | | $ | 8,849 | | | | | 40,932 | | | | 37,230 | |
Interest expense | | | 7,862 | | | | 8,656 | | | | 8,883 | | | | 10,143 | | | | 11,914 | | | | | 35,544 | | | | 53,625 | |
Interest expense - IRT | | | - | | | | - | | | | - | | | | - | | | | 482 | | | | | - | | | | 27,937 | |
Total Interest Expense | | | 18,239 | | | | 18,892 | | | | 19,429 | | | | 19,916 | | | | 21,245 | | | | | 76,476 | | | | 118,792 | |
Less: Amortization of deferred financing costs and debt discounts | | | (3,788 | ) | | | (3,537 | ) | | | (3,508 | ) | | | (4,018 | ) | | | (4,181 | ) | | | | (14,851 | ) | | | (20,383 | ) |
Interest Cost | | $ | 14,451 | | | $ | 15,355 | | | $ | 15,921 | | | $ | 15,898 | | | $ | 17,064 | | | | $ | 61,625 | | | $ | 98,409 | |
| | | | | | | | | | | | | | | | | | | | | | | | | | | | | |
PREFERRED COST: | | | | | | | | | | | | | | | | | | | | | | | | | | | | | |
Net income allocated to preferred shares | | $ | 7,086 | | | $ | 8,387 | | | $ | 8,817 | | | $ | 8,526 | | | $ | 9,310 | | | | | 32,816 | | | | 18,025 | |
Less: preferred share discount amortization | | | (690 | ) | | | (1,998 | ) | | | (2,207 | ) | | | (1,923 | ) | | | (2,453 | ) | | | | (6,819 | ) | | | (7,786 | ) |
Preferred cost | | $ | 6,396 | | | $ | 6,389 | | | $ | 6,610 | | | $ | 6,603 | | | $ | 6,857 | | | | $ | 25,997 | | | $ | 10,239 | |
| | | | | | | | | | | | | | | | | | | | | | | | | | | | | |
INTEREST COVERAGE (b): | | | 1.09 | x | | | 1.20 | x | | | 0.96 | x | | | 1.34 | x | | | 1.40 | x | | | | 1.15 | x | | | 1.79 | x |
INTEREST + PREFERRED COVERAGE (c): | | | 0.76 | x | | | 0.85 | x | | | 0.68 | x | | | 0.94 | x | | | 1.00 | x | | | | 0.81 | x | | | 1.62 | x |
| (a) | For the three months ended June 30, 2017, Adjusted EBITDA includes the non-cash effect of a $3,636 write-off of accrued interest receivable related to a loan that was determined to be impaired during the period. Adjusted EBITDA would have been $18,939 without the effect of this non-cash write-off. For the year ended December 31, 2017, Adjusted EBITDA includes the non-cash effect of a $3,636 write-off of accrued interest receivable related to a loan that was determined to be impaired during the period. Adjusted EBITDA would have been $74,441 without the effect of this non-cash write-off. |
| (b) | For the three months ended June 30, 2017, Interest Coverage includes the non-cash effect of a $3,636 write-off of accrued interest receivable related to a loan that was determined to be impaired during the period. Interest Coverage would have been 1.19x without the effect of this non-cash write-off. For the year ended December 31, 2017, Interest Coverage includes the non-cash effect of a $3,636 write-off of accrued interest receivable related to a loan that was determined to be impaired during the period. Interest Coverage would have been 1.21x without the effect of this non-cash write-off |
| (c) | For the three months ended June 30, 2017, Interest + Preferred Coverage includes the non-cash effect of a $3,636 write-off of accrued interest receivable related to a loan that was determined to be impaired during the period. Interest + Preferred Coverage would have been 0.84x without the effect of this non-cash write-off. For the year ended December 31, 2017, Interest + Preferred Coverage includes the non-cash effect of a $3,636 write-off of accrued interest receivable related to a loan that was determined to be impaired during the period. Interest + Preferred Coverage would have been 0.85x without the effect of this non-cash write-off. |
9
Loan Portfolio Data, as of December 31, 2017 | | | | | | | | | | | | | | | | | | | | | | | |
($'s in 000's) | | | | | | | | | | | | | | | | | | | | | | | | | | |
Loan Type | | Unpaid Principal Balance | | | Weighted Average Coupon | | | Remaining Life, Years (weighted average) | | | # of Loans | | | | | | | | | | | |
Bridge loans | | $ | 1,178,090 | | | | 6.3 | % | | | 1.6 | | | | 94 | | | | | | | | | | | |
Conduit loans | | | 16,645 | | | | 4.8 | % | | | 7.9 | | | | 1 | | | | | | | | | | | |
Mezzanine loans | | | 45,488 | | | | 11.2 | % | | | 4.2 | | | | 13 | | | | | | | | | | | |
Preferred equity investments | | | 33,284 | | | | 9.1 | % | | | 8.9 | | | | 15 | | | | | | | | | | | |
Total | | | 1,273,507 | | | | 6.5 | % | | | 2.0 | | | | 123 | | | | | | | | | | | |
Unamortized discounts, fees and costs | | | (2,899 | ) | | | | | | | | | | | | | | | | | | | | | | |
Aggregate carrying amount | | $ | 1,270,608 | | | | | | | | | | | | | | | | | | | | | | | |
| | | | | | | | | | | | | | | | | | | | | | | | | | |
| | | | | | | | | | | | | | | | | | | | | | | | | | |
Loan Portfolio Data Trends | | | | | | | | | | | | | | | | | | | | | | | | | | |
($'s on 000's) | | | | | | | | | | | | | | | | | | | | | | | | | | |
| | For the Three Months Ended | | | | | | | |
| | December 31, 2017 | | | September 30, 2017 | | | June 30, 2017 | | | March 31, 2017 | | | December 31, 2016 | | | | | | | |
Bridge First Mortgage loans: | | | | | | | | | | | | | | | | | | | | | | | | | | |
Origination volume | | $ | 87,460 | | | $ | 100,585 | | | $ | 154,675 | | | $ | 120,040 | | | $ | 67,540 | | | | | | | |
# of loans originated | | | 9 | | | | 9 | | | | 12 | | | | 5 | | | | 6 | | | | | | | |
Loan payoffs | | $ | 61,520 | | | $ | 106,932 | | | $ | 174,147 | | | $ | 85,523 | | | $ | 106,523 | | | | | | | |
Unpaid principal balance (period end) | | $ | 1,178,090 | | | $ | 1,141,365 | | | $ | 1,141,703 | | | $ | 1,169,558 | | | $ | 1,142,052 | | | | | | | |
Weighted average coupon (period end) | | | 6.3 | % | | | 5.5 | % | | | 6.1 | % | | | 5.9 | % | | | 5.8 | % | | | | | | |
| | | | | | | | | | | | | | | | | | | | | | | | | | |
Conduit First Mortgage loans: | | | | | | | | | | | | | | | | | | | | | | | | | | |
Unpaid principal balance (period end) | | $ | 16,645 | | | $ | 16,725 | | | $ | 16,801 | | | $ | 20,088 | | | $ | 20,181 | | | | | | | |
Weighted average coupon (period end) | | | 4.8 | % | | | 4.8 | % | | | 4.8 | % | | | 4.8 | % | | | 4.8 | % | | | | | | |
| | | | | | | | | | | | | | | | | | | | | | | | | | |
Mezzanine and Preferred Equity Investments: | | | | | | | | | | | | | | | | | | | | | | | |
Loan payoffs | | $ | 7,684 | | | $ | 3,019 | | | $ | 10,229 | | | $ | 4,242 | | | $ | 2,960 | | | | | | | |
Unpaid principal balance (period end) | | | 78,772 | | | | 105,839 | | | | 112,749 | | | | 128,399 | | | | 132,641 | | | | | | | |
Weighted average coupon (period end) | | | 10.3 | % | | | 9.6 | % | | | 9.5 | % | | | 9.5 | % | | | 9.4 | % | | | | | | |
| | | | | | | | | | | | | | | | | | | | | | | | | | |
Non-accrual loans (period end): | | | | | | | | | | | | | | | | | | | | | | | | | | |
Bridge loans | | $ | 81,443 | | | $ | 98,474 | | | $ | 104,723 | | | $ | 106,737 | | | $ | 113,509 | | | | | | | |
Mezzanine and preferred equity | | | 17,160 | | | | 37,160 | | | | 17,331 | | | | 9,029 | | | | 7,529 | | | | | | | |
Total non-accrual loans | | $ | 98,603 | | | $ | 135,634 | | | $ | 122,054 | | | $ | 115,766 | | | $ | 121,038 | | | | | | | |
| | | | | | | | | | | | | | | | | | | | | | | | | | |
Credit status (period end): | | | | | | | | | | | | | | | | | | | | | | | | | | |
Satisfactory | | $ | 1,124,729 | | | $ | 1,105,120 | | | $ | 1,100,273 | | | $ | 1,156,410 | | | $ | 1,142,467 | | | | | | | |
Watchlist -- expecting full recovery | | | 57,246 | | | | 24,554 | | | | 55,725 | | | | 92,975 | | | | 32,748 | | | | | | | |
Watchlist -- with reserves | | | 91,532 | | | | 134,254 | | | | 115,255 | | | | 68,660 | | | | 119,659 | | | | | | | |
Total | | $ | 1,273,507 | | | $ | 1,263,928 | | | $ | 1,271,253 | | | $ | 1,318,045 | | | $ | 1,294,874 | | | | | | | |
| | | | | | | | | | | | | | | | | | | | | | | | | | |
Loan loss reserves: | | | | | | | | | | | | | | | | | | | | | | | | | | |
Beginning balance | | $ | 25,140 | | | $ | 23,514 | | | $ | 13,531 | | | $ | 12,354 | | | $ | 18,655 | | | | | | | |
Provision | | | 17,700 | | | | 5,516 | | | | 20,863 | | | | 1,535 | | | | 3,848 | | | | | | | |
Charge-offs, net of recoveries | | | (27,957 | ) | | | (3,890 | ) | | | (10,880 | ) | | | (358 | ) | | | (10,149 | ) | | | | | | |
Ending balance | | $ | 14,883 | | | $ | 25,140 | | | $ | 23,514 | | | $ | 13,531 | | | $ | 12,354 | | | | | | | |
| | | | | | | | | | | | | | | | | | | | | | | | | | |
Statistics as a % of Total Loans (period end): | | | | | | | | | | | | | | | | | | | | | | | |
Non-accrual loans | | | 7.7 | % | | | 10.7 | % | | | 9.6 | % | | | 8.8 | % | | | 9.3 | % | | | | | | |
Watchlist -- expecting full recovery | | | 4.5 | % | | | 1.9 | % | | | 4.4 | % | | | 7.1 | % | | | 2.5 | % | | | | | | |
Watchlist -- with reserves | | | 7.2 | % | | | 11.0 | % | | | 8.9 | % | | | 5.2 | % | | | 9.2 | % | | | | | | |
Loan loss reserves | | | 1.2 | % | | | 2.0 | % | | | 1.8 | % | | | 1.0 | % | | | 1.0 | % | | | | | | |
10
REAL ESTATE PORTFOLIO DATA
Real Estate Portfolio Summary, as of December 31, 2017 | | | | | | | | | | | | | | | | | | | |
($'s in 000's) | | | | | | | | | | | | | | | | | | | | | | | | | | |
Property Type | | Gross Cost | | | # of Properties | | | Units / Square Feet / Acres | | | Weighted Average Occupancy | | | Weighted Average Rental Rate | | | | | | | |
Multifamily | | $ | 17,163 | | | | 1 | | | | 220 | | | | 94.1 | % | | $ | 899 | | | per unit, per month |
Office | | | 130,125 | | | | 5 | | | | 1,291,283 | | | | 79.4 | % | | $ | 19.74 | | | per square foot, per year |
Retail | | | 106,817 | | | | 6 | | | | 1,674,674 | | | | 63.2 | % | | $ | 15.46 | | | per square foot, per year |
Land | | | 20,567 | | | | 4 | | | | 9.2 | | | | | | | | | | | | | | | |
Total | | | 274,672 | | | | 16 | | | | | | | | | | | | | | | | | | | |
Accumulated depreciation | | | (28,768 | ) | | | | | | | | | | | | | | | | | | | | | | |
Carrying Amount | | $ | 245,904 | | | | | | | | | | | | | | | | | | | | | | | |
Real Estate Portfolio Summary, as of December 31, 2017 | |
($'s in 000's) | | | | | | | | | | | | | | | | | | | | | | | | | | | | | | | | | | |
Property Type | | # of Properties | | | Units/ Square Feet/ Acres | | | Gross Cost | | | Accumulated Depreciation | | | | | Net Carrying Value | | | Occupancy (Period End) | | | Average Occupancy (a) | | | Rental Rate (b) | |
| | | | | | | | | | | | | | | | | | | | | | | | | | | | | | | | | | |
HELD FOR DISPOSITION | |
| | | | | | | | | | | | | | | | | | | | | | | | | | | | | | | | | | |
TOTAL MULTIFAMILY: | | | 1 | | | | 220 | | | $ | 17,163 | | | $ | (4,016 | ) | | | | $ | 13,147 | | | | 95.9 | % | | | 94.1 | % | | $ | 899 | |
| | | | | | | | | | | | | | | | | | | | | | | | | | | | | | | | | | |
TOTAL OFFICE: | | | 2 | | | | 921,094 | | | $ | 57,036 | | | $ | (305 | ) | | | | $ | 56,731 | | | | 45.1 | % | | | 45.1 | % | | $ | 22.81 | |
| | | | | | | | | | | | | | | | | | | | | | | | | | | | | | | | | | |
TOTAL RETAIL: | | | 5 | | | | 1,559,681 | | | $ | 82,642 | | | $ | (5,112 | ) | | | | $ | 77,530 | | | | 65.0 | % | | | 63.7 | % | | $ | 13.16 | |
| | | | | | | | | | | | | | | | | | | | | | | | | | | | | | | | | | |
TOTAL LAND: | | | 2 | | | | 8.2 | | | $ | 19,953 | | | $ | - | | | | | $ | 19,953 | | | | | | | | | | | | | |
| | | | | | | | | | | | | | | | | | | | | | | | | | | | | | | | | | |
TOTAL HELD FOR DISPOSITION | | | 10 | | | | | | | $ | 176,794 | | | $ | (9,433 | ) | | | | $ | 167,361 | | | | | | | | | | | | | |
| | | | | | | | | | | | | | | | | | | | | | | | | | | | | | | | | | |
HELD FOR INVESTMENT | |
| | | | | | | | | | | | | | | | | | | | | | | | | | | | | | | | | | |
TOTAL OFFICE: | | | 3 | | | | 370,189 | | | $ | 73,089 | | | $ | (18,971 | ) | | | | $ | 54,118 | | | | 87.5 | % | | | 86.3 | % | | $ | 20.01 | |
| | | | | | | | | | | | | | | | | | | | | | | | | | | | | | | | | | |
TOTAL RETAIL: | | | 1 | | | | 114,993 | | | $ | 24,175 | | | $ | (364 | ) | | | | $ | 23,811 | | | | 11.4 | % | | | 43.1 | % | | $ | 29.16 | |
| | | | | | | | | | | | | | | | | | | | | | | | | | | | | | | | | | |
TOTAL LAND: | | | 2 | | | | 1.0 | | | $ | 614 | | | $ | — | | | | | $ | 614 | | | | | | | | | | | | | |
| | | | | | | | | | | | | | | | | | | | | | | | | | | | | | | | | | |
TOTAL HELD FOR INVESTMENT | | 6 | | | | | | | $ | 97,878 | | | $ | (19,335 | ) | | | | $ | 78,543 | | | | | | | | | | | | | |
| | | | | | | | | | | | | | | | | | | | | | | | | | | | | | | | | | |
TOTAL REAL ESTATE OWNED | | | | | | | | | | $ | 274,672 | | | $ | (28,768 | ) | | | | $ | 245,904 | | | | | | | | | | | | | |
(a) Average occupancy represents the daily average occupancy for the three-month period ended December 31, 2017.
(b) | Multifamily rental rate data is per unit, per month. Office and Retail are per square foot, per year. |
11
REAL ESTATE PORTFOLIO
CHANGES IN THE PORTFOLIO – YEAR-TO-DATE DECEMBER 31, 2017:
($'s in 000's) | | City & State | | Square Feet / Units/Acres | | | Month Sold / Disposed / Acquired | | Transaction | | Value | |
SALES: | | | | | | | | | | | | | | |
Office: | | | | | | | | | | | | | | |
Executive Center | | Milwaukee, WI | | | 102,017 | | | March | | Sale | | | 10,600 | |
Tiffany Square | | Colorado Springs, CO | | | 184,219 | | | March | | Sale | | | 12,175 | |
100 East Lancaster Avenue | | Downingtown, PA | | | 37,963 | | | April | | Sale | | | 4,575 | |
UBS Tower | | St. Paul, MN | | | 228,882 | | | May | | Sale | | | 14,150 | |
Rutherford | | Woodlawn, MD | | | 85,806 | | | September | | Sale | | | 5,700 | |
McDowell | | Scottsdale, AZ | | | 255,573 | | | October | | Sale | | | 53,150 | |
Four Resource Square | | Charlotte, NC | | | 151,916 | | | December | | Sale | | | 17,500 | |
Reuss | | Milwaukee, WI | | | 578,104 | | | December | | Sale | | | 19,500 | |
Total Office | | | | | 1,624,480 | | | | | | | | 137,350 | |
| | | | | | | | | | | | | | |
Multifamily: | | | | | | | | | | | | | | |
Tuscany Bay | | Orlando, FL | | | 396 | | | January | | Sale | | | 36,650 | |
Oyster Point | | Newport News, VA | | | 278 | | | March | | Sale | | | 11,500 | |
Emerald Bay | | Las Vegas, NV | | | 337 | | | March | | Sale | | | 23,750 | |
South Terrace | | Durham, NC | | | 328 | | | June | | Sale | | | 42,950 | |
Trails at Northpoint | | Jackson, MS | | | 144 | | | July | | Sale | | | 6,450 | |
Total Multifamily | | | | | 1,483 | | | | | | | | 121,300 | |
| | | | | | | | | | | | | | |
Retail: | | | | | | | | | | | | | | |
South Plaza (Parcel Sale) | | Nashville, TN | | | 284,697 | | | May | | Parcel Sale | | | 11,478 | |
South Plaza | | Nashville, TN | | | - | | | September | | Sale | | | 11,000 | |
May's Crossing | | Round Rock, TX | | | 64,084 | | | November | | Sale | | | 8,150 | |
Total Retail | | | | | 284,697 | | | | | | | | 30,628 | |
| | | | | | | | | | | | | | |
Land: | | | | | | | | | | | | | | |
Treasure Island & Sunny Shores | | Daytona Beach, FL | | | 3.5 | | | October | | Sale | | | 12,125 | |
MGS Gift Shop | | Daytona Beach, FL | | | 1.0 | | | March | | Sale | | | 300 | |
Total Land | | | | | 4.5 | | | | | | | | 12,425 | |
| | | | | | | | | | | | | | |
Total Sales: | | | | | | | | | | | | $ | 301,703 | |
| | | | | | | | | | | | | | |
OTHER DISPOSITIONS: | | | | | | | | | | | | | | |
Industrial | | | | | | | | | | | | | | |
East Glendale | | Sparks, NV | | | 31,976 | | | February | | Deconsolidation | | | 1,091 | |
Rex Boulevard | | Auburn Hills, MI | | | 151,200 | | | February | | Deconsolidation | | | 7,209 | |
Adams Aircraft | | Englewood, CO | | | 48,490 | | | March | | Deconsolidation | | | 4,557 | |
Perry Avenue | | Attleboro, MA | | | 456,000 | | | March | | Deconsolidation | | | 25,529 | |
Interstate Drive | | West Springfield, MA | | | 143,025 | | | March | | Deconsolidation | | | 4,965 | |
South Midco | | Marysville, OH | | | 130,044 | | | August | | Deconsolidation | | | 3,480 | |
Fondorf Drive | | Columbus, OH | | | 151,685 | | | August | | Deconsolidation | | | 5,076 | |
Kirby Circle | | Palm Bay, FL | | | 231,313 | | | September | | Deconsolidation | | | 15,773 | |
Lake Avenue | | Fort Wayne, IN | | | 25,200 | | | September | | Deconsolidation | | | 2,876 | |
Moreau Court | | South Bend, IN | | | 82,396 | | | September | | Deconsolidation | | | 5,636 | |
Hunt Valley Circle | | New Kensington, PA | | | 198,000 | | | November | | Deconsolidation | | | 9,015 | |
Square Drive | | Marysville, OH | | | 130,044 | | | November | | Deconsolidation | | | 4,856 | |
Total Industrial | | | | | 1,779,373 | | | | | | | | 90,063 | |
| | | | | | | | | | | | | | |
Office: | | | | | | | | | | | | | | |
Gettysburg Pike 6930 | | Fort Wayne, IN | | | 161,000 | | | September | | Deconsolidation | | | 5,069 | |
Gettysburg Pike 6932 | | Fort Wayne, IN | | | 63,804 | | | September | | Deconsolidation | | | 2,200 | |
Total Office | | | | | 224,804 | | | | | | | | 7,269 | |
| | | | | | | | | | | | | | |
Total Other Dispositions: | | | | | | | | | | | | $ | 97,332 | |
| | | | | | | | | | | | | | |
Total Sales and Other Dispositions | | | | | | | | | | | | $ | 399,035 | |
| | | | | | | | | | | | | | |
ADDITIONS: | | | | | | | | | | | | | | |
Retail: | | | | | | | | | | | | | | |
Erieview Galleria | | Cleveland, OH | | | 93,663 | | | March | | Loan Conversion | | | 1,636 | |
Total Retail | | | | | 93,663 | | | | | | | | 1,636 | |
| | | | | | | | | | | | | | |
Total Additions: | | | | | | | | | | | | $ | 1,636 | |
12
Indebtedness oVERVIEW
As of DECEMBER 31, 2017
| | As of December 31, 2016 | | | As of December 31, 2017 |
($'S in 000's) | | Unpaid Principal | | | Unpaid Principal | | | Unamortized Discount and Debt Issuance Costs | | | Carrying Amount | | | Rate | | | Maturity Date | |
RAIT Indebtedness: | | | | | | | | | | | | | | | | | | | | | | | |
Recourse debt | | | | | | | | | | | | | | | | | | | | | | | |
7% convertible senior notes | | $ | 871 | | | $ | 871 | | | $ | (38 | ) | | $ | 833 | | | | 7.0 | % | | 04/2031 | |
4% convertible senior notes | | | 126,098 | | | | 110,513 | | | | (3,713 | ) | | | 106,800 | | | | 4.0 | % | | 10/2033 | (a) |
7.625% senior notes | | | 57,287 | | | | 56,324 | | | | (1,457 | ) | | | 54,867 | | | | 7.6 | % | | 04/2024 | |
7.125% senior notes | | | 70,731 | | | | 68,408 | | | | (934 | ) | | | 67,474 | | | | 7.1 | % | | 08/2019 | |
Senior secured notes | | | 62,000 | | | | 11,500 | | | | (437 | ) | | | 11,063 | | | | 7.3 | % | | 04/2019 | |
Lending warehouse facilities | | | | | | | | | | | | | | | | | | | | | | | |
Conduit loans | | | - | | | | - | | | | (117 | ) | | | (117 | ) | | | 0.00 | % | | 07/2018 | |
Floating rate loans | | | 26,421 | | | | 22,313 | | | | (453 | ) | | | 21,860 | | | | 3.5 | % | | 01/2018-7/2018 | |
Total | | | 26,421 | | | | 22,313 | | | | (570 | ) | | | 21,743 | | | | 3.5 | % | | | |
Junior subordinated notes, at fair value | | | 18,671 | | | | 18,671 | | | | (10,550 | ) | | | 8,121 | | | | 5.3 | % | | 03/2035 | |
Junior subordinated notes, at amortized cost | | | 25,100 | | | | 25,100 | | | | - | | | | 25,100 | | | | 3.9 | % | | 04/2037 | |
Total Recourse Debt | | | 387,179 | | | | 313,700 | | | | (17,699 | ) | | | 296,001 | | | | 5.5 | % | | | |
Non-Recourse debt | | | | | | | | | | | | | | | | | | | | | | | |
Securitization notes payable: | | | | | | | | | | | | | | | | | | | | | | | |
CRE CDO I | | | 376,089 | | | | 235,349 | | | | (2,464 | ) | | | 232,885 | | | | 2.0 | % | | 11/2046 | |
CRE CDO II | | | 166,227 | | | | 22,714 | | | | (875 | ) | | | 21,839 | | | | 3.7 | % | | 06/2045 | |
FL3 | | | 57,942 | | | | - | | | | - | | | | - | | | | 0.0 | % | | - | |
FL4 | | | 107,998 | | | | - | | | | - | | | | - | | | | 0.0 | % | | - | |
FL5 | | | 265,304 | | | | 133,895 | | | | - | | | | 133,895 | | | | 5.1 | % | | 01/2031 | |
FL6 | | | 216,677 | | | | 120,248 | | | | (1,306 | ) | | | 118,942 | | | | 3.9 | % | | 11/2031 | |
FL7 | | | - | | | | 276,867 | | | | (3,276 | ) | | | 273,591 | | | | 2.8 | % | | 06/2037 | |
FL8 | | | - | | | | 213,753 | | | | (3,595 | ) | | | 210,158 | | | | 2.7 | % | | 12/2037 | |
Total securitization notes payable | | | 1,190,237 | | | | 1,002,826 | | | | (11,516 | ) | | | 991,310 | | | | 3.1 | % | | | |
Loans payable on real estate | | | 186,237 | | | | 62,297 | | | | (375 | ) | | | 61,922 | | | | 5.2 | % | | 05/2021-12/2021 | |
Total Non-recourse debt | | | 1,376,474 | | | | 1,065,123 | | | | (11,891 | ) | | | 1,053,232 | | | | 3.2 | % | | | |
Other Indebtedness | | | 24,321 | | | | 40,830 | | | | 125 | | | | 40,955 | | | | - | | | - | |
Total RAIT Indebtedness | | $ | 1,787,974 | | | $ | 1,419,653 | | | $ | (29,465 | ) | | $ | 1,390,188 | | | | 3.7 | % | | | |
Recourse Non-recourse

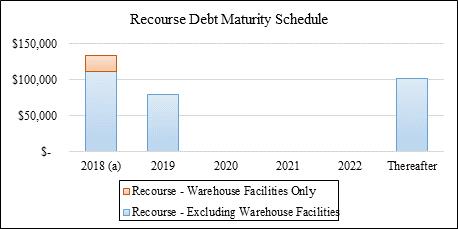
| (a) | Includes the $110,513 of 4% convertible senior notes that may be put in October 2018. |
13
DEFINITIONS
Adjusted EBITDA
Adjusted Earnings before Interest, Taxes, Depreciation and Amortization, is a non-GAAP financial measure. We calculate Adjusted EBITDA as Net Income, before the effects of investment interest expense, interest expense, acquisition and integration expenses, depreciation and amortization, provision for loan losses (gains) losses on assets, asset impairments, (gains) losses on debt extinguishments, change in fair value of financial instruments, and income tax (benefit) provision as well as similar items and other non-recurring items such as (gains) losses on acquisitions related to discontinued operations. We believe Adjusted EBITDA provides useful information to investors to ascertain our interest coverage and interest plus preferred dividends coverage ratios.
Assets Under Management
Assets under management, or AUM, is an operating measure representing the total assets that we own or are managing for third parties. While not all AUM generates fee income, it is an important operating measure to gauge our asset growth, volume of originations, size and scale of our operations and our performance. AUM includes our total investment portfolio, assets associated with unconsolidated securitizations for which we derive asset management fees and real estate properties we manage on behalf of third parties.
Cash Available for Distribution
Cash available for distribution, or CAD, is a non-GAAP financial measure. We believe that CAD provides investors and management with a meaningful indicator of operating performance. Management also uses CAD, among other measures, to evaluate profitability and our board of trustees considers CAD in determining our quarterly cash distributions. We also believe that CAD is useful because it adjusts for a variety of noncash items (such as depreciation and amortization, equity-based compensation, provision for loan losses and non-cash interest income and expense items). In addition, the compensation committee of our board of trustees used CAD as a metric in establishing quantitative performance based awards for certain of our executive officers beginning in 2015.
We calculate CAD by subtracting from or adding to net income (loss) attributable to common shareholders the following items: depreciation and amortization items including depreciation and amortization expense, straight-line rental income or expense, amortization of deferred financing costs, and amortization of discounts on financings; origination fees; equity-based compensation; changes in the fair value of our financial instruments; realized gains (losses) on assets; provision for loan losses; asset impairments; acquisition gains or losses and transaction costs; deferred income tax benefit (provision); certain fee income eliminated in consolidation that is attributable to third parties; and one-time events pursuant to changes in U.S. GAAP and certain other non-routine items.
CAD should not be considered as an alternative to net income (loss) or cash generated from operating activities, determined in accordance with U.S. GAAP, as an indicator of operating performance. For example, CAD does not adjust for the accrual of income and expenses that may not be received or paid in cash during the associated periods. Please refer to our consolidated financial statements prepared in accordance with U.S. GAAP in our most recent report on Form 10-K or Form 10-Q filed with the Securities and Exchange Commission. In addition, our methodology for calculating CAD may differ from the methodologies used by other comparable companies, including other REITs, when calculating the same or similar supplemental financial measures and may not be comparable with these companies.
Funds from Operations
We believe that funds from operations, or FFO, which is a non-GAAP financial measure, is an additional appropriate measure of the operating performance of a REIT. We compute FFO in accordance with the standards established by the National Association of Real Estate Investment Trusts, or NAREIT, as net income or loss allocated to common shares (computed in accordance with GAAP), excluding real estate-related depreciation expense, gains or losses on sales of real estate, asset impairment and the cumulative effect of changes in accounting principles. Our management utilizes FFO as a measure of our operating performance. FFO is not an equivalent to net income or cash generated from operating activities determined in accordance with U.S. GAAP. Furthermore, FFO does not represent amounts available for management’s discretionary use because of needed capital replacement or expansion, debt service obligations or other commitments or uncertainties. FFO should not be considered as an alternative to net income as an indicator of our operating performance or as an alternative to cash flow from operating activities as a measure of our liquidity.
14
Gross Real Estate Investments
Gross real estate investments equal investments in real estate, net plus accumulated depreciation as it appears on the consolidated balance sheet. The following table provides a reconciliation of investments in real estate, net to total gross real estate investments.
| As of | |
| December 31, 2017 | | | September 30, 2017 | | | June 30, 2017 | | | March 31, 2017 | | | December 31, 2016 | |
Investments in real estate, net | $ | 245,904 | | | $ | 368,700 | | | $ | 434,890 | | | $ | 580,051 | | | $ | 716,432 | |
Plus: Accumulated depreciation | | 28,768 | | | | 30,974 | | | | 35,359 | | | | 114,179 | | | | 138,214 | |
Gross real estate investments | $ | 274,672 | | | $ | 399,674 | | | $ | 470,249 | | | $ | 694,230 | | | $ | 854,646 | |
Interest Coverage
Interest coverage is computed as Adjusted EBITDA divided by interest costs (excluding amortization of deferred financing costs and debt discounts)
Interest + Preferred Coverage
Interest + Preferred coverage is computed as Adjusted EBITDA divided by the sum of interest costs (excluding amortization of deferred financing costs and debt discounts) and preferred costs (excluding amortization of preferred share discounts).
Net Operating Income
Net Operating Income (“NOI”), a non-GAAP financial measure, is a useful measure of the operating performance of its real estate portfolio. NOI is defined as total property revenue less total property operating expenses, excluding depreciation and amortization and interest expense. Other REITs may use different methodologies for calculating NOI, and accordingly, our NOI may not be comparable to other REITs. We believe that this measure provides an operating perspective not immediately apparent from GAAP operating income or net income. We use NOI to evaluate our real estate portfolio performance on a same store and non-same store basis because NOI measures the core operations of property performance by excluding corporate level expenses and other items not related to property operating performance and captures trends in rental rates and property operating expenses. A reconciliation of our net operating income to net income is as follows for each of the periods presented below:
($'s in 000's) | | For the Three Months Ended | | | | | For the Year Ended | |
| | December 31, 2017 | | | September 30, 2017 | | | June 30, 2017 | | | March 31, 2017 | | | | | December 31, 2016 | | | | | December 31, 2017 | | | | | December 31, 2016 | |
Net operating income | | $ | 3,419 | | | $ | 6,699 | | | $ | 7,437 | | | $ | 9,431 | | | | | $ | 10,417 | | | | | $ | 26,986 | | | | | $ | 55,942 | |
Net interest margin | | | 9,191 | | | | 7,879 | | | | 4,336 | | | | 7,877 | | | | | | 10,844 | | | | | | 29,283 | | | | | | 53,397 | |
Fee and other income | | | 1,347 | | | | 1,712 | | | | 1,531 | | | | 1,661 | | | | | | 1,400 | | | | | | 6,251 | | | | | | 7,374 | |
Interest expense | | | (7,862 | ) | | | (8,656 | ) | | | (8,883 | ) | | | (10,143 | ) | | | | | (11,914 | ) | | | | | (35,544 | ) | | | | | (55,049 | ) |
Compensation expenses | | | (3,216 | ) | | | (3,194 | ) | | | (3,529 | ) | | | (3,487 | ) | | | | | (6,275 | ) | | | | | (13,426 | ) | | | | | (18,437 | ) |
General and administrative expenses | | | (3,189 | ) | | | (3,233 | ) | | | (2,689 | ) | | | (2,705 | ) | | | | | (3,300 | ) | | | | | (11,816 | ) | | | | | (13,273 | ) |
Property management expenses | | | (2,081 | ) | | | (1,908 | ) | | | (2,651 | ) | | | (2,213 | ) | | | | | (2,240 | ) | | | | | (8,853 | ) | | | | | (9,479 | ) |
Acquisition and integration expenses | | | (159 | ) | | | (57 | ) | | | (67 | ) | | | (172 | ) | | | | | (248 | ) | | | | | (455 | ) | | | | | (624 | ) |
Provision for loan losses | | | (17,700 | ) | | | (5,516 | ) | | | (20,863 | ) | | | (1,535 | ) | | | | | (3,848 | ) | | | | | (45,614 | ) | | | | | (8,050 | ) |
Depreciation and amortization expense | | | (4,461 | ) | | | (6,139 | ) | | | (7,819 | ) | | | (9,754 | ) | | | | | (12,031 | ) | | | | | (28,173 | ) | | | | | (51,304 | ) |
IRT internalization and management transition expenses | | | - | | | | - | | | | - | | | | (736 | ) | | | | | (6,271 | ) | | | | | (736 | ) | | | | | (6,271 | ) |
Shareholder activism expenses | | | - | | | | (155 | ) | | | (1,615 | ) | | | (694 | ) | | | | | - | | | | | | (2,464 | ) | | | | | - | |
Employee separation expenses | | | - | | | | (575 | ) | | | - | | | | - | | | | | | - | | | | | | (575 | ) | | | | | - | |
Other income (expense) | | | (44 | ) | | | 283 | | | | (153 | ) | | | 14 | | | | | | (457 | ) | | | | | 100 | | | | | | (427 | ) |
Gains (loss) on assets | | | 644 | | | | 30 | | | | 10,759 | | | | 12,006 | | | | | | 29,461 | | | | | | 23,439 | | | | | | 53,272 | |
Gain (loss) on deconsolidation of properties | | | 25,837 | | | | (4,035 | ) | | | - | | | | (15,947 | ) | | | | | - | | | | | | 5,855 | | | | | | - | |
Asset impairment | | | (6,136 | ) | | | (3,121 | ) | | | (85,809 | ) | | | (7,424 | ) | | | | | (11,127 | ) | | | | | (102,490 | ) | | | | | (37,785 | ) |
Goodwill impairment | | | - | | | | - | | | | (8,342 | ) | | | - | | | | | | - | | | | | | (8,342 | ) | | | | | - | |
Gain (loss) on debt extinguishment | | | (456 | ) | | | (644 | ) | | | (1,598 | ) | | | 3,186 | | | | | | 333 | | | | | | 488 | | | | | | 1,331 | |
Change in fair value of financial instruments | | | 6,729 | | | | 4,753 | | | | 3,093 | | | | (1,153 | ) | | | | | 1,109 | | | | | | 13,422 | | | | | | (5,946 | ) |
Income tax benefit (provision) | | | 600 | | | | 34 | | | | (22 | ) | | | 249 | | | | | | (20,601 | ) | | | | | 861 | | | | | | (2,550 | ) |
Income from discontinued operations | | | - | | | | - | | | | - | | | | - | | | | | | 1,671 | | | | | | - | | | | | | 40,144 | |
Gain (loss) on disposal of discontinued operations | | | - | | | | - | | | | - | | | | - | | | | | | 47,808 | | | | | | - | | | | | | 47,808 | |
Net income (loss) | | $ | 2,463 | | | $ | (15,843 | ) | | $ | (116,884 | ) | | $ | (21,539 | ) | | | | $ | 24,731 | | | | | $ | (151,803 | ) | | | | $ | 50,073 | |
15
Total Gross Assets
Total gross assets equals total assets plus accumulated depreciation as these captions are reported on the consolidated balance sheet. The following table provides a reconciliation of total assets to total gross assets.
| As of | |
| December 31, 2017 | | | September 30, 2017 | | | June 30, 2017 | | | March 31, 2017 | | | December 31, 2016 | |
Total assets | $ | 1,791,833 | | | $ | 1,867,688 | | | $ | 2,041,773 | | | $ | 2,222,615 | | | $ | 2,406,843 | |
Plus: Accumulated depreciation (a) | | 28,768 | | | | 30,974 | | | | 35,359 | | | | 114,179 | | | | 138,214 | |
Plus: Accumulated amortization (b) (c) | | 4,111 | | | | 3,633 | | | | 4,499 | | | | 10,658 | | | | 11,245 | |
Total gross assets | $ | 1,824,712 | | | $ | 1,902,295 | | | $ | 2,081,631 | | | $ | 2,347,452 | | | $ | 2,556,302 | |
| | | | | | | | | | | | | | | | | | | |
| (a) | Includes accumulated depreciation from discontinued operations. |
| (b) | Includes accumulated amortization from discontinued operations. |
| (c) | Represents accumulated amortization of real estate-related intangible assets and liabilities. |
16