Q2 2018 EARNINGS CALL JULY 31, 2018 This information is as of the date indicated and, to our knowledge, was timely and accurate when presented. We are under no obligation to update or remove outdated information other than as required by applicable law or regulation.

INTRODUCTORY COMMENTS
HEADLINES 1. Record Quarterly Revenue and Earnings 3

HEADLINES 1. Record Quarterly Revenue and Earnings 2. Successfully Executing our Capital Recycling Strategy 4
HEADLINES 1. Record Quarterly Revenue and Earnings 2. Successfully Executing our Capital Recycling Strategy 3. Recent Results Reflect Strong Tenant Performance 5
HEADLINES 1. Record Quarterly Revenue and Earnings 2. Successfully Executing our Capital Recycling Strategy 3. Recent Results Reflect Strong Tenant Performance 4. Increasing Earnings Guidance 6

PORTFOLIO UPDATE

PORTFOLIO STATISTICS $6.7B+ 396 TOTAL PROPERTIES INVESTMENTS IN SERVICE 99% 1.77X RENT OCCUPANCY COVERAGE* $129.9M $236.9M Q2 INVESTMENT Q2 DISPOSITION SPENDING PROCEEDS * Coverage is weighted average for the segments. Theatres and Family Entertainment Centers data is TTM March 2018. Golf Entertainment Complexes and Other Recreation data is TTM March 2018. Ski Area data is TTM April 2018 and Attractions data is TTM August 30, 2017. Public Charter School data is TTM June 2017, Private school data is TTM June 2017 and Early Childhood Education data is TTM March 2018. 8
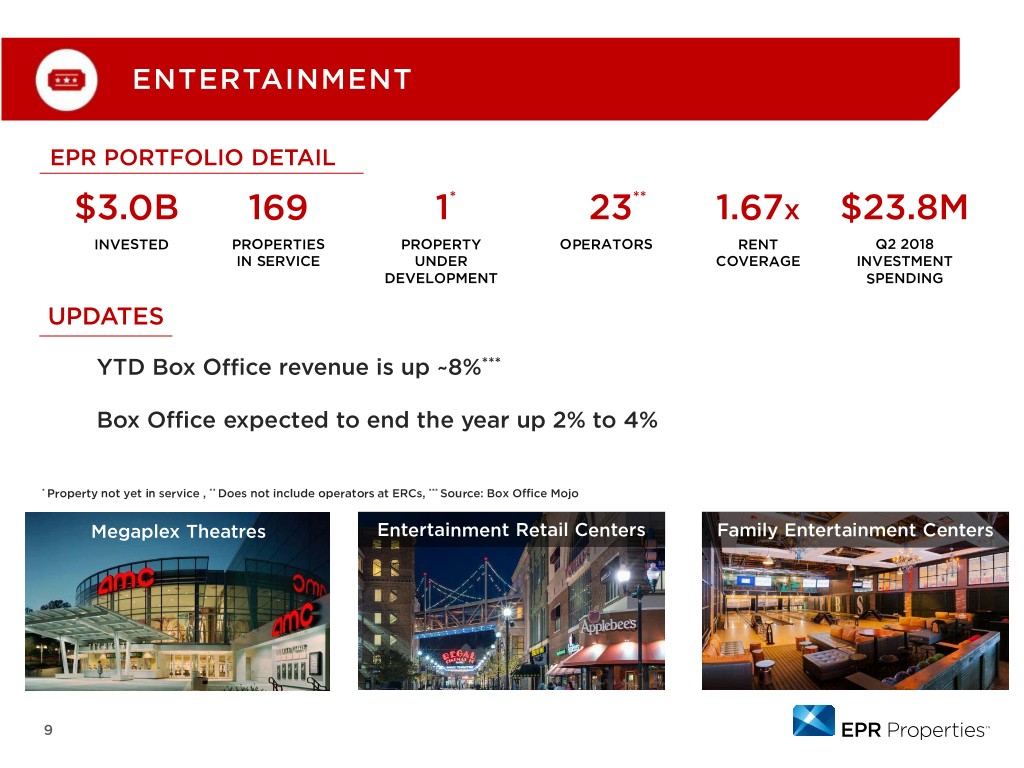
ENTERTAINMENT EPR PORTFOLIO DETAIL $3.0B 169 1* 23** 1.67x $23.8M INVESTED PROPERTIES PROPERTY OPERATORS RENT Q2 2018 IN SERVICE UNDER COVERAGE INVESTMENT DEVELOPMENT SPENDING UPDATES YTD Box Office revenue is up ~8%*** Box Office expected to end the year up 2% to 4% * Property not yet in service , ** Does not include operators at ERCs, *** Source: Box Office Mojo Megaplex Theatres Entertainment Retail Centers Family Entertainment Centers 9

RECREATION EPR PORTFOLIO DETAIL $2.1B 80 5* INVESTED PROPERTIES PROPERTIES IN SERVICE UNDER DEVELOPMENT 21 2.05x $88.6M OPERATORS RENT Q2 2018 COVERAGE INVESTMENT SPENDING *Properties not yet in service Golf Ski Attractions Other Recreation 10
RECREATION 11
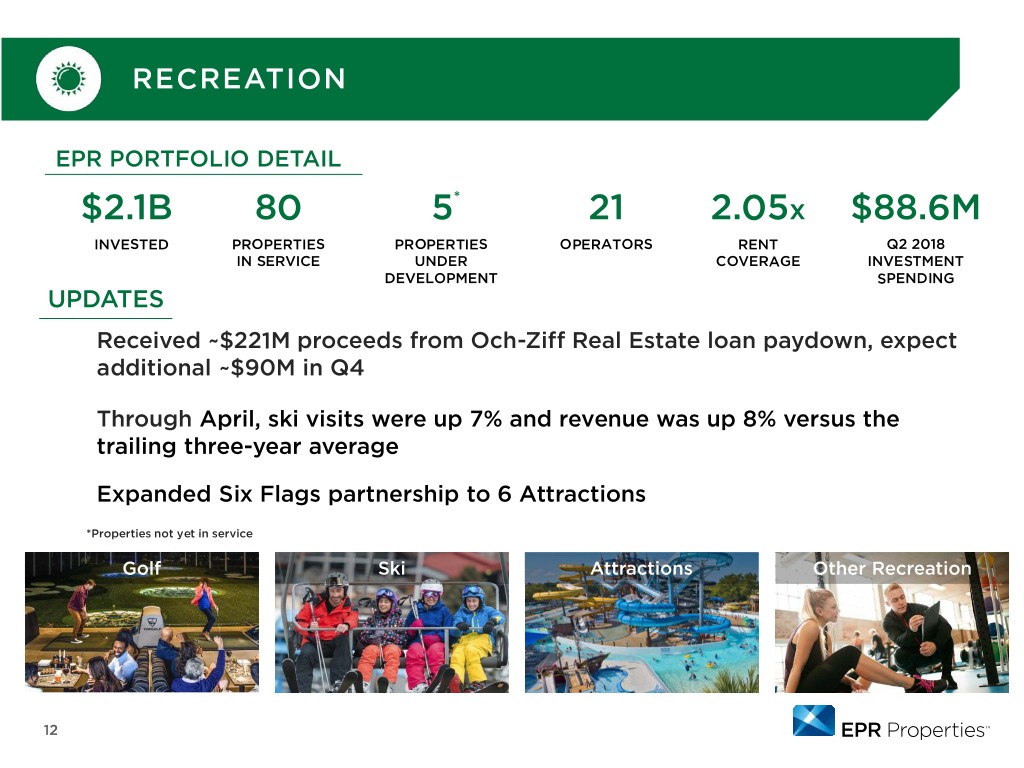
RECREATION EPR PORTFOLIO DETAIL $2.1B 80 5* 21 2.05x $88.6M INVESTED PROPERTIES PROPERTIES OPERATORS RENT Q2 2018 IN SERVICE UNDER COVERAGE INVESTMENT DEVELOPMENT SPENDING UPDATES Received ~$221M proceeds from Och-Ziff Real Estate loan paydown, expect additional ~$90M in Q4 Through April, ski visits were up 7% and revenue was up 8% versus the trailing three-year average Expanded Six Flags partnership to 6 Attractions *Properties not yet in service Golf Ski Attractions Other Recreation 12
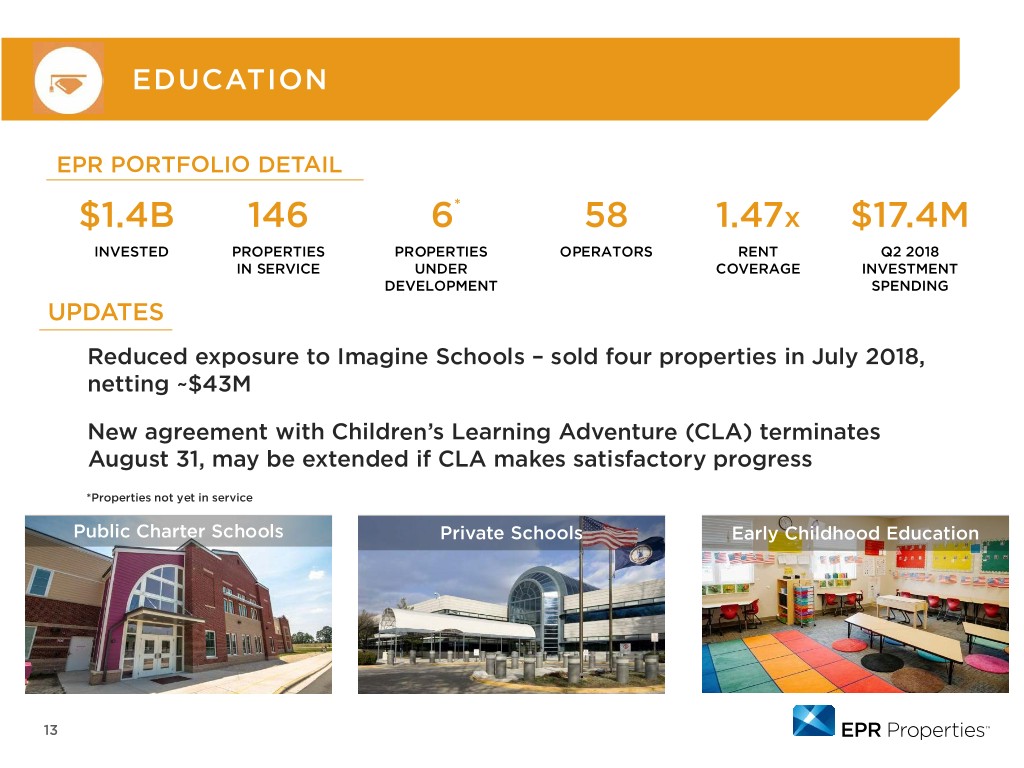
EDUCATION EPR PORTFOLIO DETAIL $1.4B 146 6* 58 1.47x $17.4M INVESTED PROPERTIES PROPERTIES OPERATORS RENT Q2 2018 IN SERVICE UNDER COVERAGE INVESTMENT DEVELOPMENT SPENDING UPDATES Reduced exposure to Imagine Schools – sold four properties in July 2018, netting ~$43M New agreement with Children’s Learning Adventure (CLA) terminates August 31, may be extended if CLA makes satisfactory progress *Properties not yet in service Public Charter Schools Private Schools Early Childhood Education 13
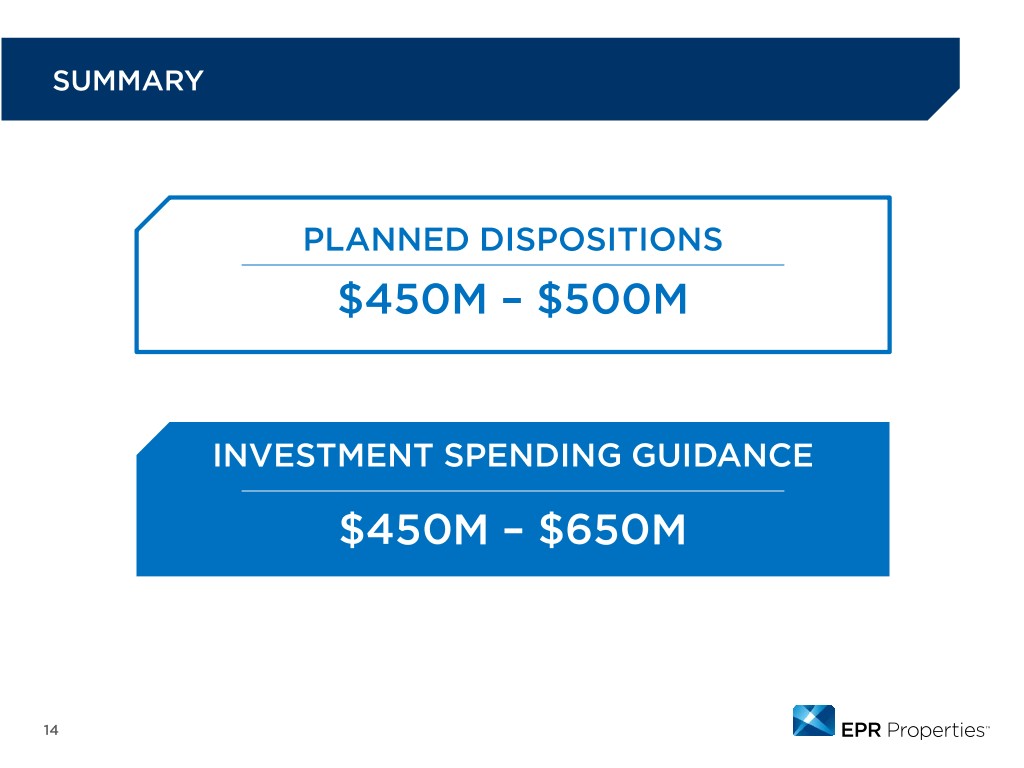
SUMMARY PLANNED DISPOSITIONS $450M – $500M INVESTMENT SPENDING GUIDANCE $450M – $650M 14
FINANCIAL REVIEW
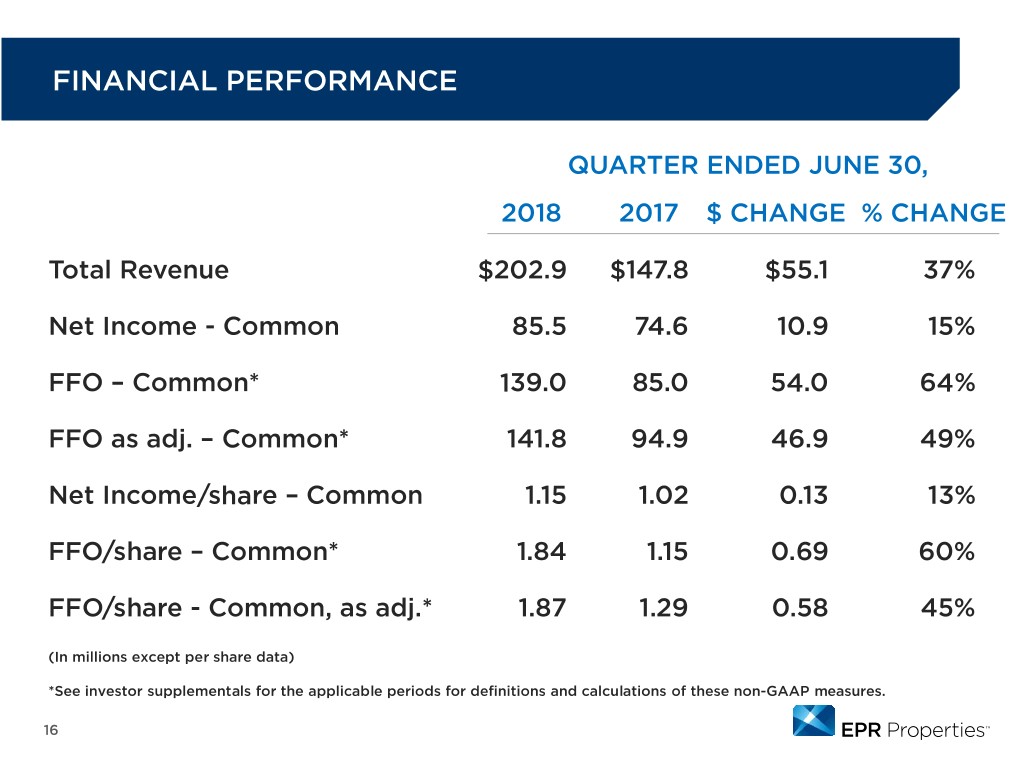
FINANCIAL PERFORMANCE QUARTER ENDED JUNE 30, 2018 2017 $ CHANGE % CHANGE Total Revenue $202.9 $147.8 $55.1 37% Net Income - Common 85.5 74.6 10.9 15% FFO – Common* 139.0 85.0 54.0 64% FFO as adj. – Common* 141.8 94.9 46.9 49% Net Income/share – Common 1.15 1.02 0.13 13% FFO/share – Common* 1.84 1.15 0.69 60% FFO/share - Common, as adj.* 1.87 1.29 0.58 45% (In millions except per share data) *See investor supplementals for the applicable periods for definitions and calculations of these non-GAAP measures. 16
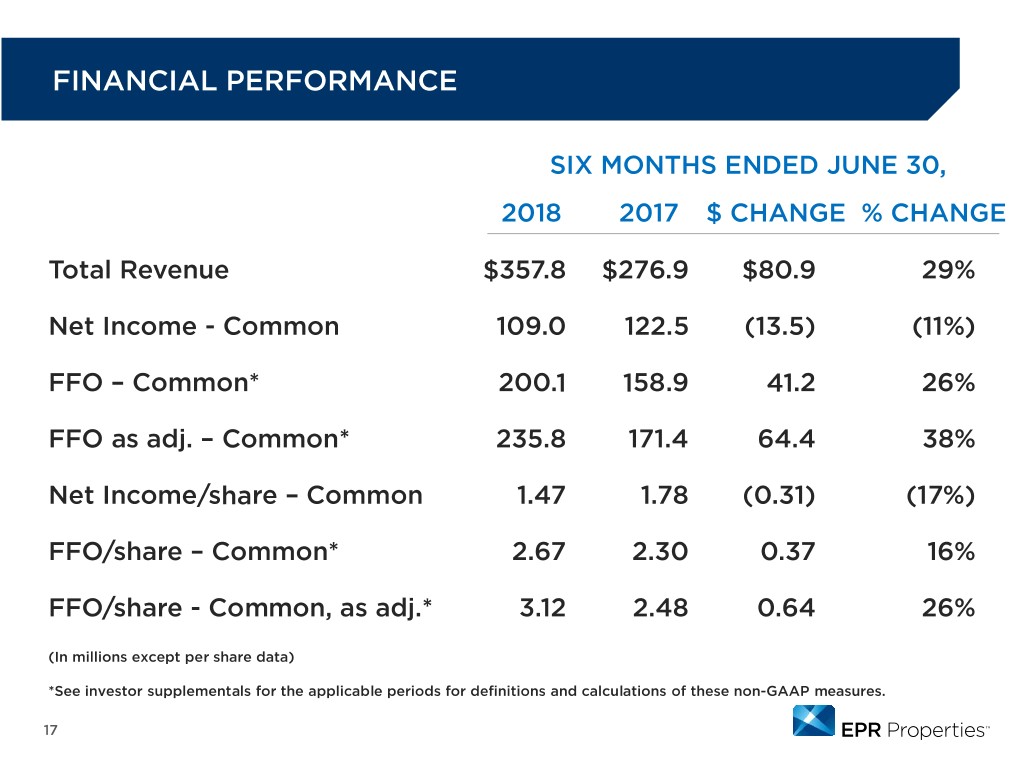
FINANCIAL PERFORMANCE SIX MONTHS ENDED JUNE 30, 2018 2017 $ CHANGE % CHANGE Total Revenue $357.8 $276.9 $80.9 29% Net Income - Common 109.0 122.5 (13.5) (11%) FFO – Common* 200.1 158.9 41.2 26% FFO as adj. – Common* 235.8 171.4 64.4 38% Net Income/share – Common 1.47 1.78 (0.31) (17%) FFO/share – Common* 2.67 2.30 0.37 16% FFO/share - Common, as adj.* 3.12 2.48 0.64 26% (In millions except per share data) *See investor supplementals for the applicable periods for definitions and calculations of these non-GAAP measures. 17
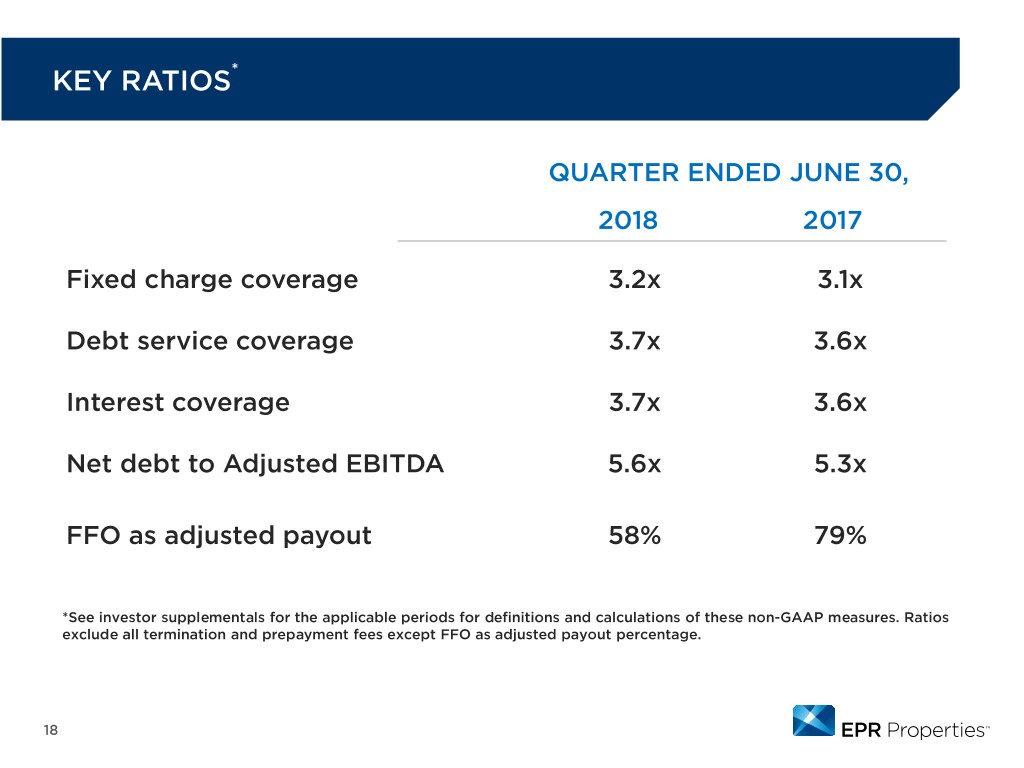
KEY RATIOS* QUARTER ENDED JUNE 30, 2018 2017 Fixed charge coverage 3.2x 3.1x Debt service coverage 3.7x 3.6x Interest coverage 3.7x 3.6x Net debt to Adjusted EBITDA 5.6x 5.3x FFO as adjusted payout 58% 79% *See investor supplementals for the applicable periods for definitions and calculations of these non-GAAP measures. Ratios exclude all termination and prepayment fees except FFO as adjusted payout percentage. 18

CAPITAL MARKETS AND LIQUIDITY UPDATE
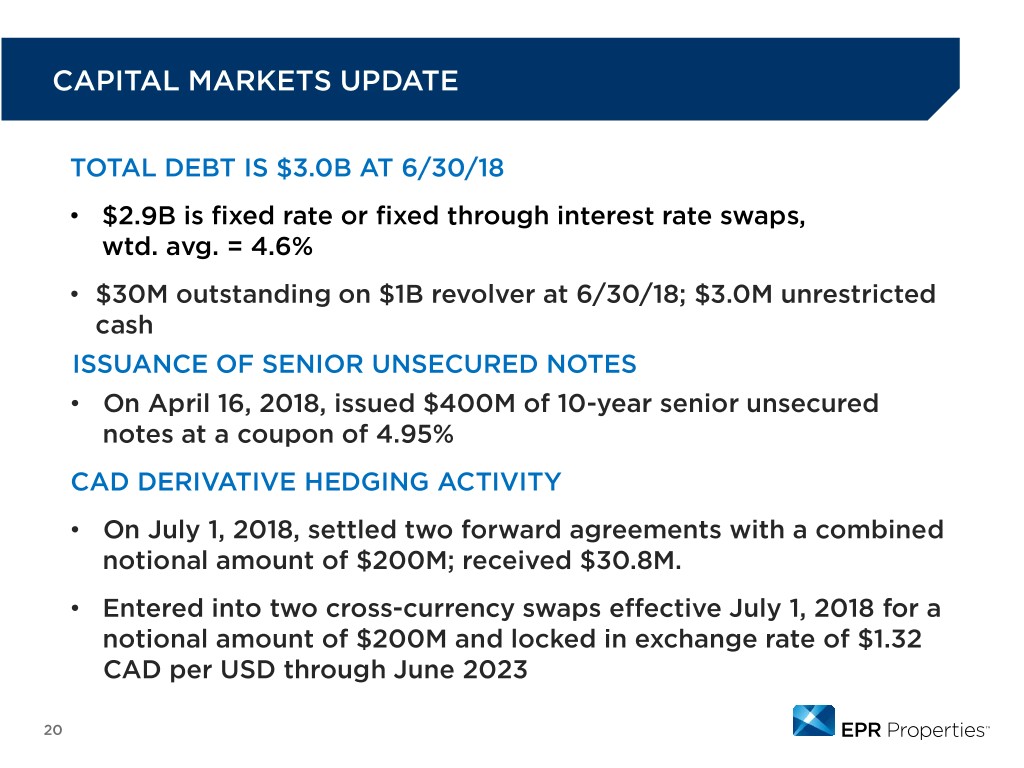
CAPITAL MARKETS UPDATE TOTAL DEBT IS $3.0B AT 6/30/18 • $2.9B is fixed rate or fixed through interest rate swaps, wtd. avg. = 4.6% • $30M outstanding on $1B revolver at 6/30/18; $3.0M unrestricted cash ISSUANCE OF SENIOR UNSECURED NOTES • On April 16, 2018, issued $400M of 10-year senior unsecured notes at a coupon of 4.95% CAD DERIVATIVE HEDGING ACTIVITY • On July 1, 2018, settled two forward agreements with a combined notional amount of $200M; received $30.8M. • Entered into two cross-currency swaps effective July 1, 2018 for a notional amount of $200M and locked in exchange rate of $1.32 CAD per USD through June 2023 20

2018 GUIDANCE FFO AS ADJUSTED PER SHARE Revised Guidance $5.97 - $6.07 Prior Guidance $5.75 - $5.90 INVESTMENT SPENDING Revised Guidance $450M - $650M Prior Guidance $400M - $700M DISPOSITION PROCEEDS Revised Guidance $450M - $500M Prior Guidance $350M - $450M 21
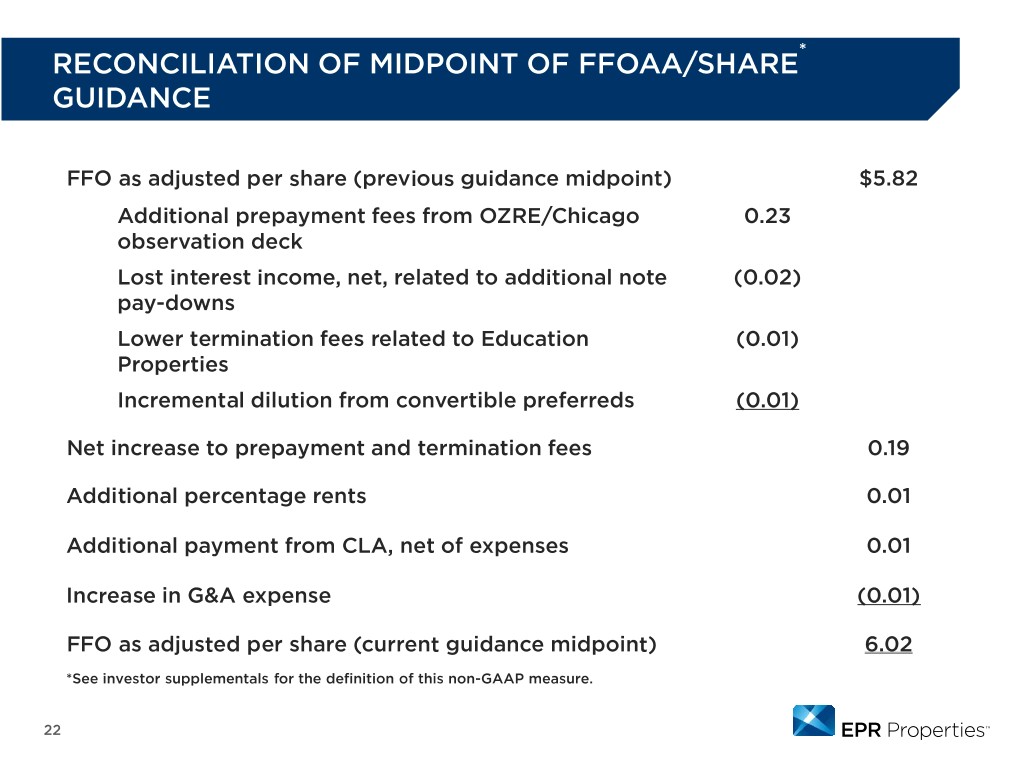
* RECONCILIATION OF MIDPOINT OF FFOAA/SHARE GUIDANCE FFO as adjusted per share (previous guidance midpoint) $5.82 Additional prepayment fees from OZRE/Chicago 0.23 observation deck Lost interest income, net, related to additional note (0.02) pay-downs Lower termination fees related to Education (0.01) Properties Incremental dilution from convertible preferreds (0.01) Net increase to prepayment and termination fees 0.19 Additional percentage rents 0.01 Additional payment from CLA, net of expenses 0.01 Increase in G&A expense (0.01) FFO as adjusted per share (current guidance midpoint) 6.02 *See investor supplementals for the definition of this non-GAAP measure. 22

CLOSING COMMENTS
EPR Properties 909 Walnut Street, Suite 200 Kansas City, MO 64106 www.eprkc.com (888) EPR REIT info@eprkc.com


