
Q1 2019 EARNINGS CALL APRIL 30, 2019
INTRODUCTORY COMMENTS This information is as of the date indicated and, to our knowledge, was timely and accurate when presented. We are under no obligation to update or remove outdated information other than as required by applicable law or regulation. 2
HEADLINES 1. Solid Fundamentals, Continued Investment Spending Momentum 3
HEADLINES 1. Solid Fundamentals, Continued Investment Spending Momentum 2. Investment Segments Remain Healthy 4
HEADLINES 1. Solid Fundamentals, Continued Investment Spending Momentum 2. Investment Segments Remain Healthy 3. New Leadership for Focused Growth 5
HEADLINES 1. Solid Fundamentals, Continued Investment Spending Momentum 2. Investment Segments Remain Healthy 3. New Leadership for Focused Growth 4. Significant Growth Capacity 6
PORTFOLIO UPDATE 7
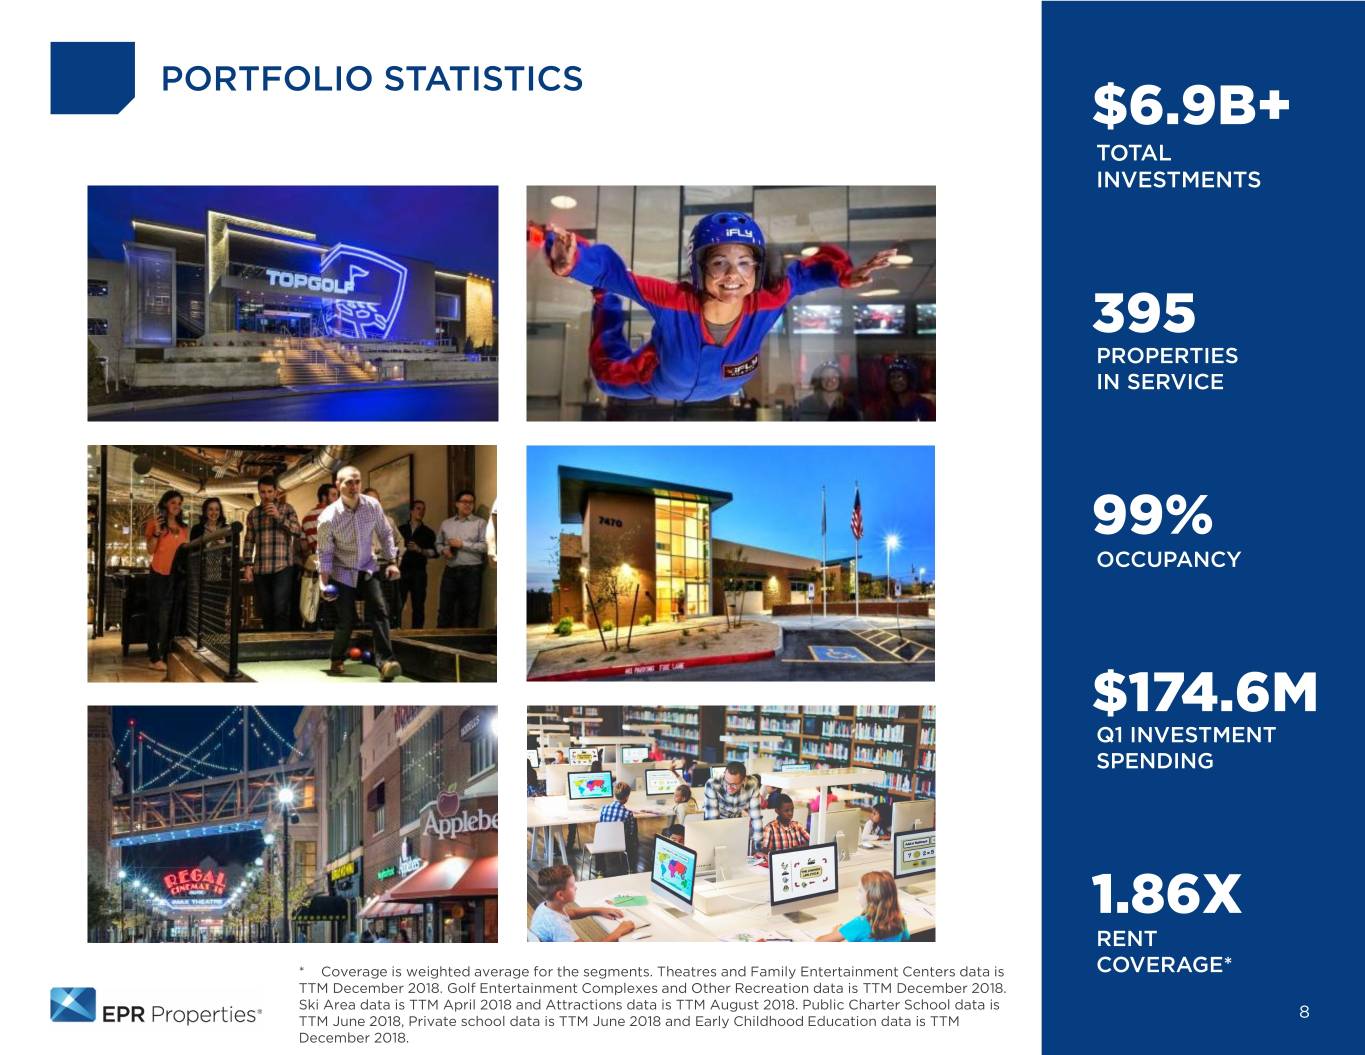
PORTFOLIO STATISTICS $6.9B+ TOTAL INVESTMENTS 395 PROPERTIES IN SERVICE 99% OCCUPANCY $174.6M Q1 INVESTMENT SPENDING 1.86X RENT * Coverage is weighted average for the segments. Theatres and Family Entertainment Centers data is COVERAGE* TTM December 2018. Golf Entertainment Complexes and Other Recreation data is TTM December 2018. Ski Area data is TTM April 2018 and Attractions data is TTM August 2018. Public Charter School data is 8 TTM June 2018, Private school data is TTM June 2018 and Early Childhood Education data is TTM December 2018.
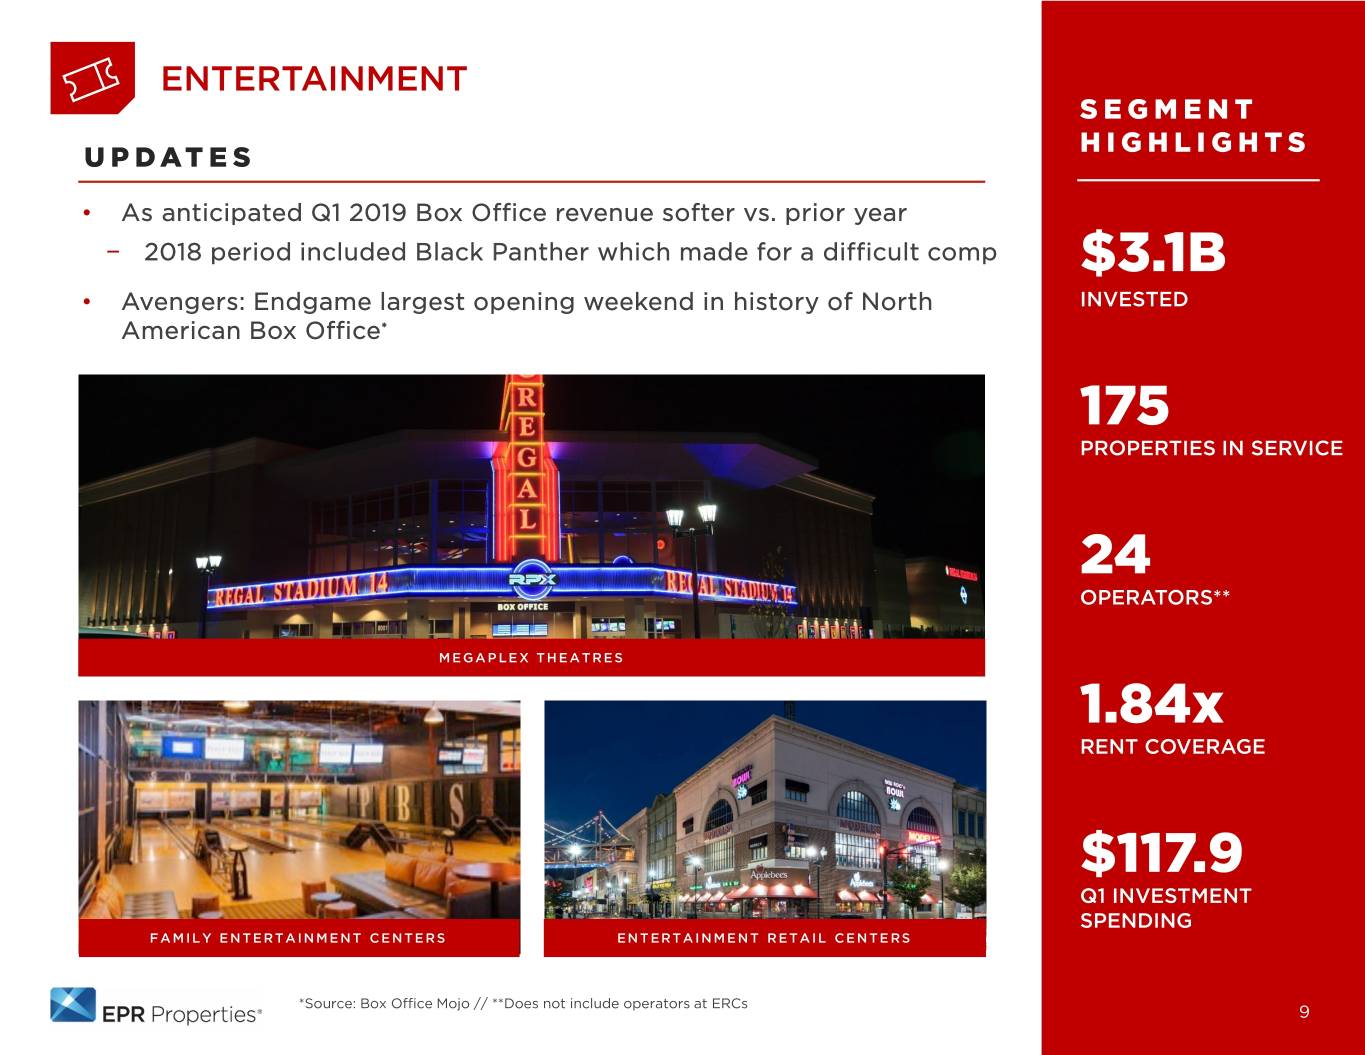
ENTERTAINMENT SEGMENT HIGHLIGHTS UPDATES • As anticipated Q1 2019 Box Office revenue softer vs. prior year − 2018 period included Black Panther which made for a difficult comp $3.1B • Avengers: Endgame largest opening weekend in history of North INVESTED American Box Office* 175 PROPERTIES IN SERVICE 24 OPERATORS** MEGAPLEX THEATRES 1.84x RENT COVERAGE $117.9 Q1 INVESTMENT SPENDING FAMILY ENTERTAINMENT CENTERS ENTERTAINMENT RETAIL CENTERS *Source: Box Office Mojo // **Does not include operators at ERCs 9
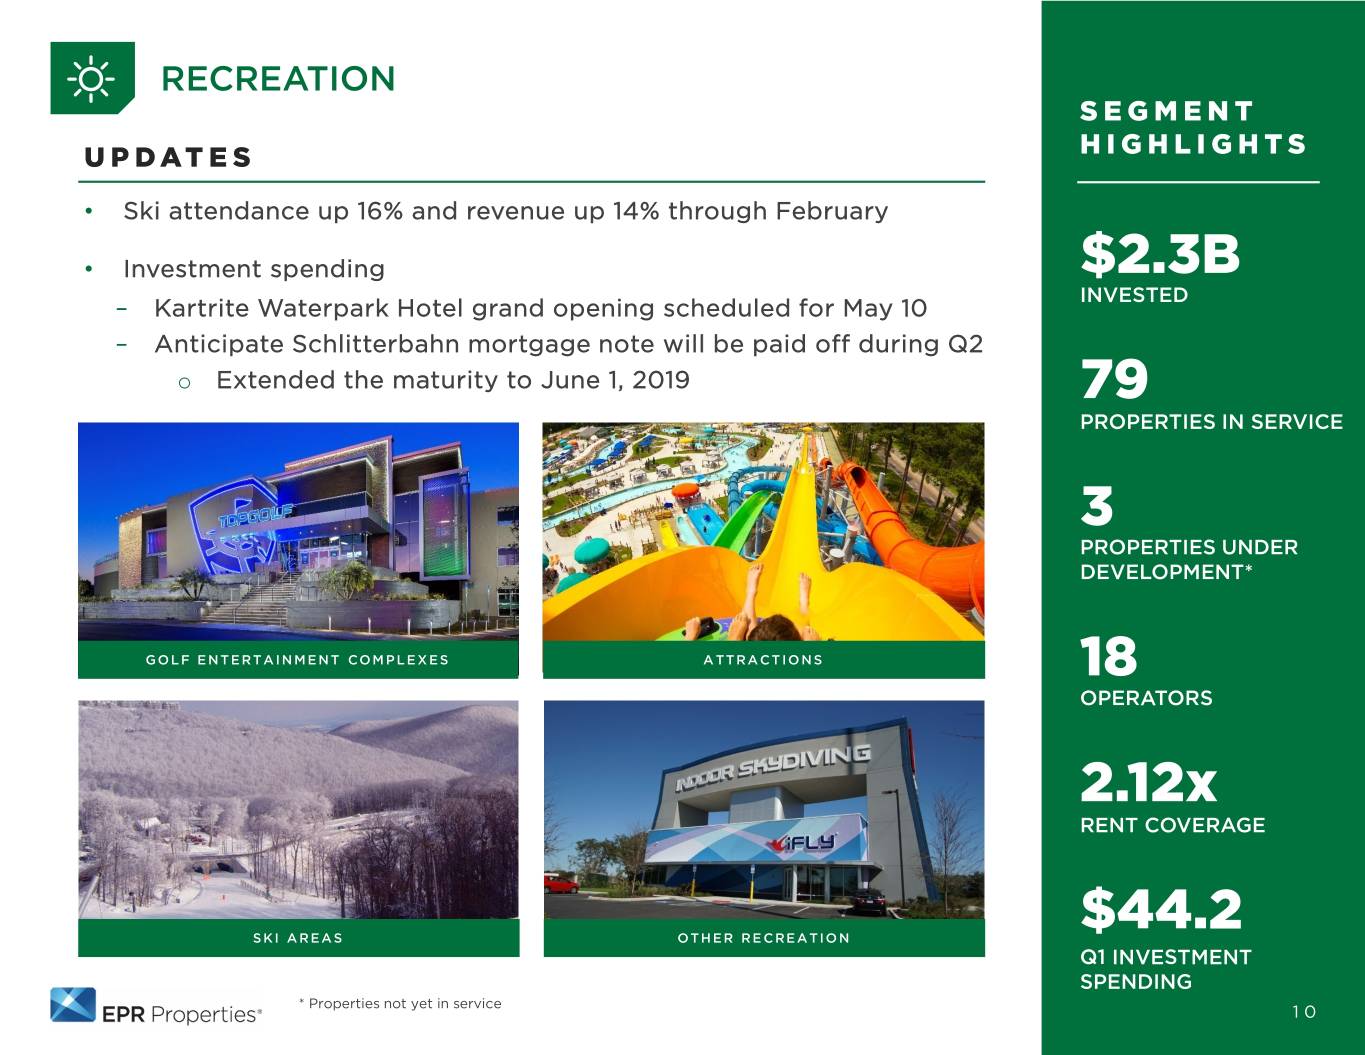
RECREATION SEGMENT UPDATES HIGHLIGHTS • Ski attendance up 16% and revenue up 14% through February • Investment spending $2.3B INVESTED – Kartrite Waterpark Hotel grand opening scheduled for May 10 – Anticipate Schlitterbahn mortgage note will be paid off during Q2 o Extended the maturity to June 1, 2019 79 PROPERTIES IN SERVICE 3 PROPERTIES UNDER DEVELOPMENT* GOLF ENTERTAINMENT COMPLEXES ATTRACTIONS 18 OPERATORS 2.12x RENT COVERAGE $44.2 SKI AREAS OTHER RECREATION Q1 INVESTMENT SPENDING * Properties not yet in service 10
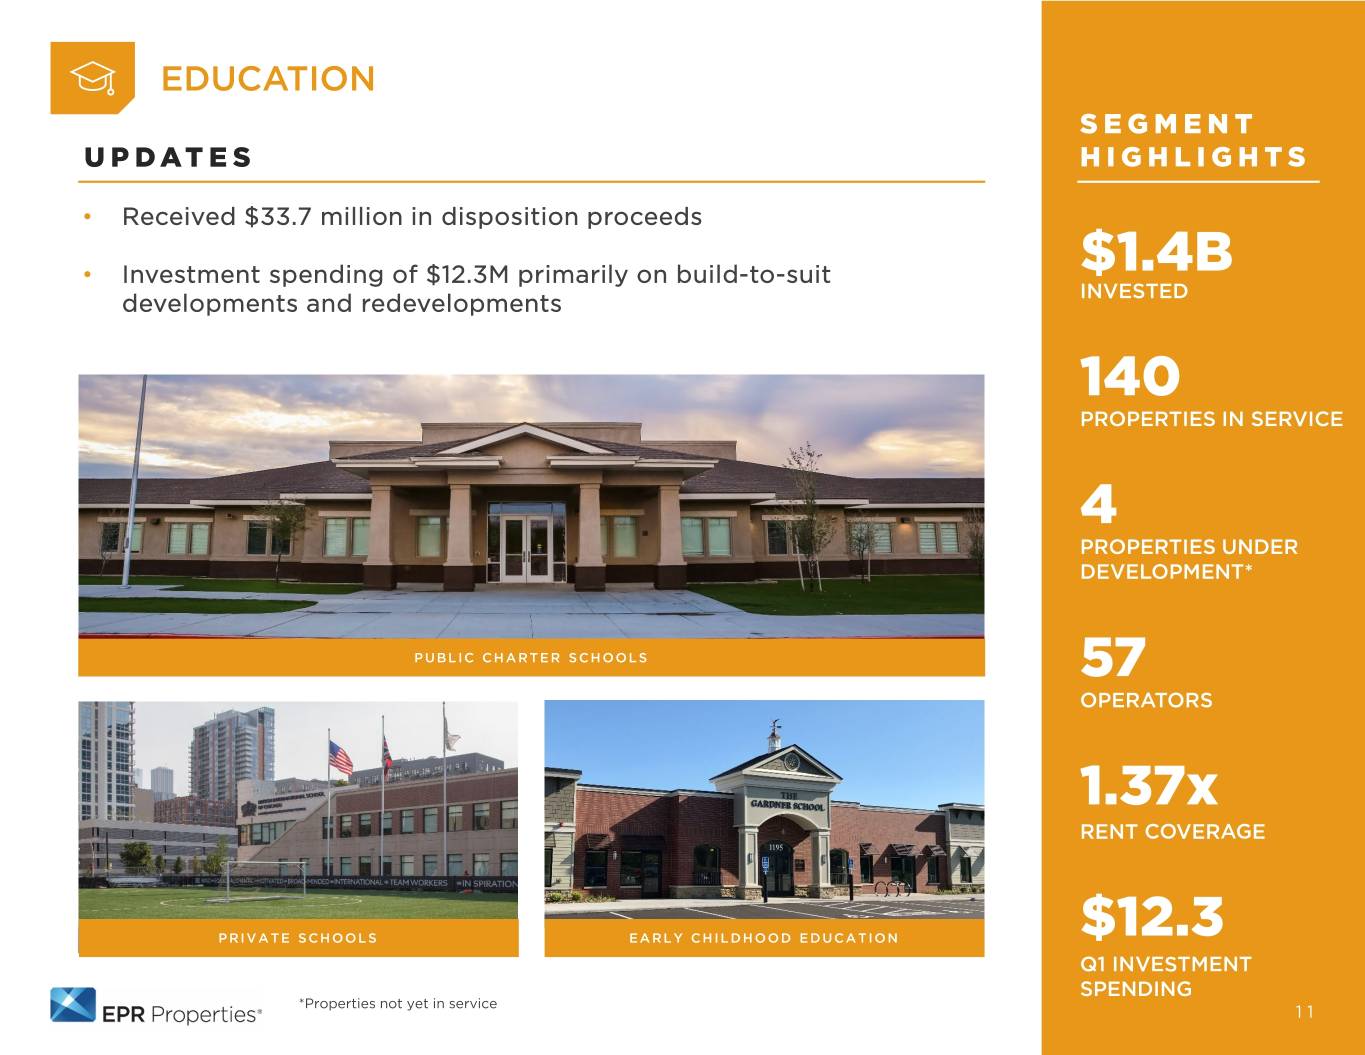
EDUCATION SEGMENT UPDATES HIGHLIGHTS • Received $33.7 million in disposition proceeds • Investment spending of $12.3M primarily on build-to-suit $1.4B developments and redevelopments INVESTED 140 PROPERTIES IN SERVICE 4 PROPERTIES UNDER DEVELOPMENT* PUBLIC CHARTER SCHOOLS 57 OPERATORS 1.37x RENT COVERAGE PRIVATE SCHOOLS EARLY CHILDHOOD EDUCATION $12.3 Q1 INVESTMENT SPENDING *Properties not yet in service 11
FINANCIAL REVIEW 12
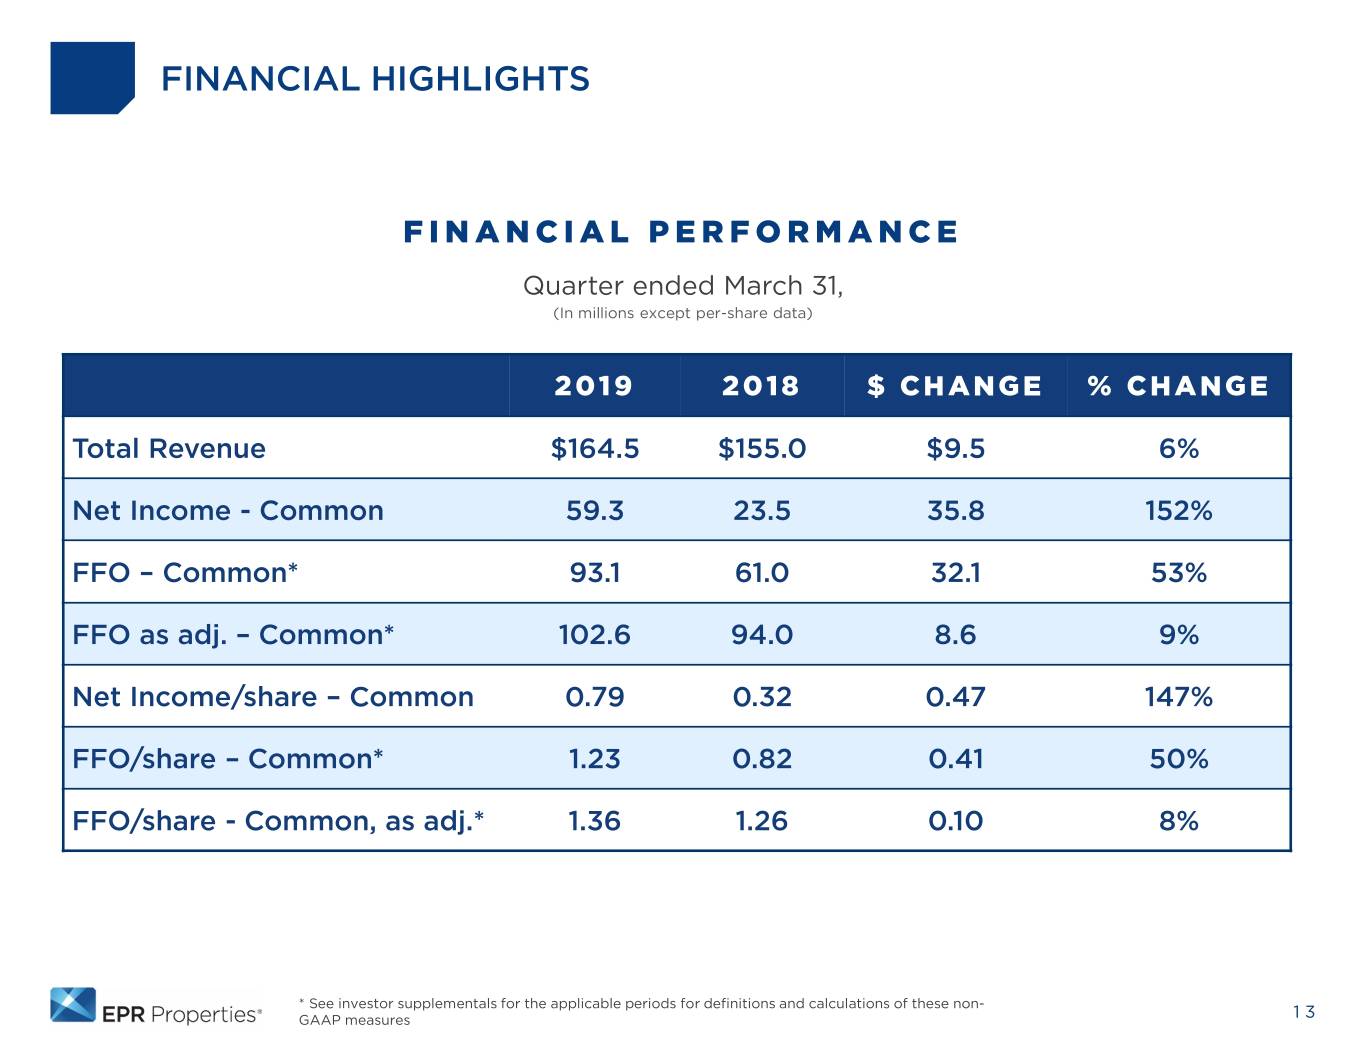
FINANCIAL HIGHLIGHTS FINANCIAL PERFORMANCE Quarter ended March 31, (In millions except per-share data) 2019 2018 $ CHANGE % CHANGE Total Revenue $164.5 $155.0 $9.5 6% Net Income - Common 59.3 23.5 35.8 152% FFO – Common* 93.1 61.0 32.1 53% FFO as adj. – Common* 102.6 94.0 8.6 9% Net Income/share – Common 0.79 0.32 0.47 147% FFO/share – Common* 1.23 0.82 0.41 50% FFO/share - Common, as adj.* 1.36 1.26 0.10 8% * See investor supplementals for the applicable periods for definitions and calculations of these non- GAAP measures 13
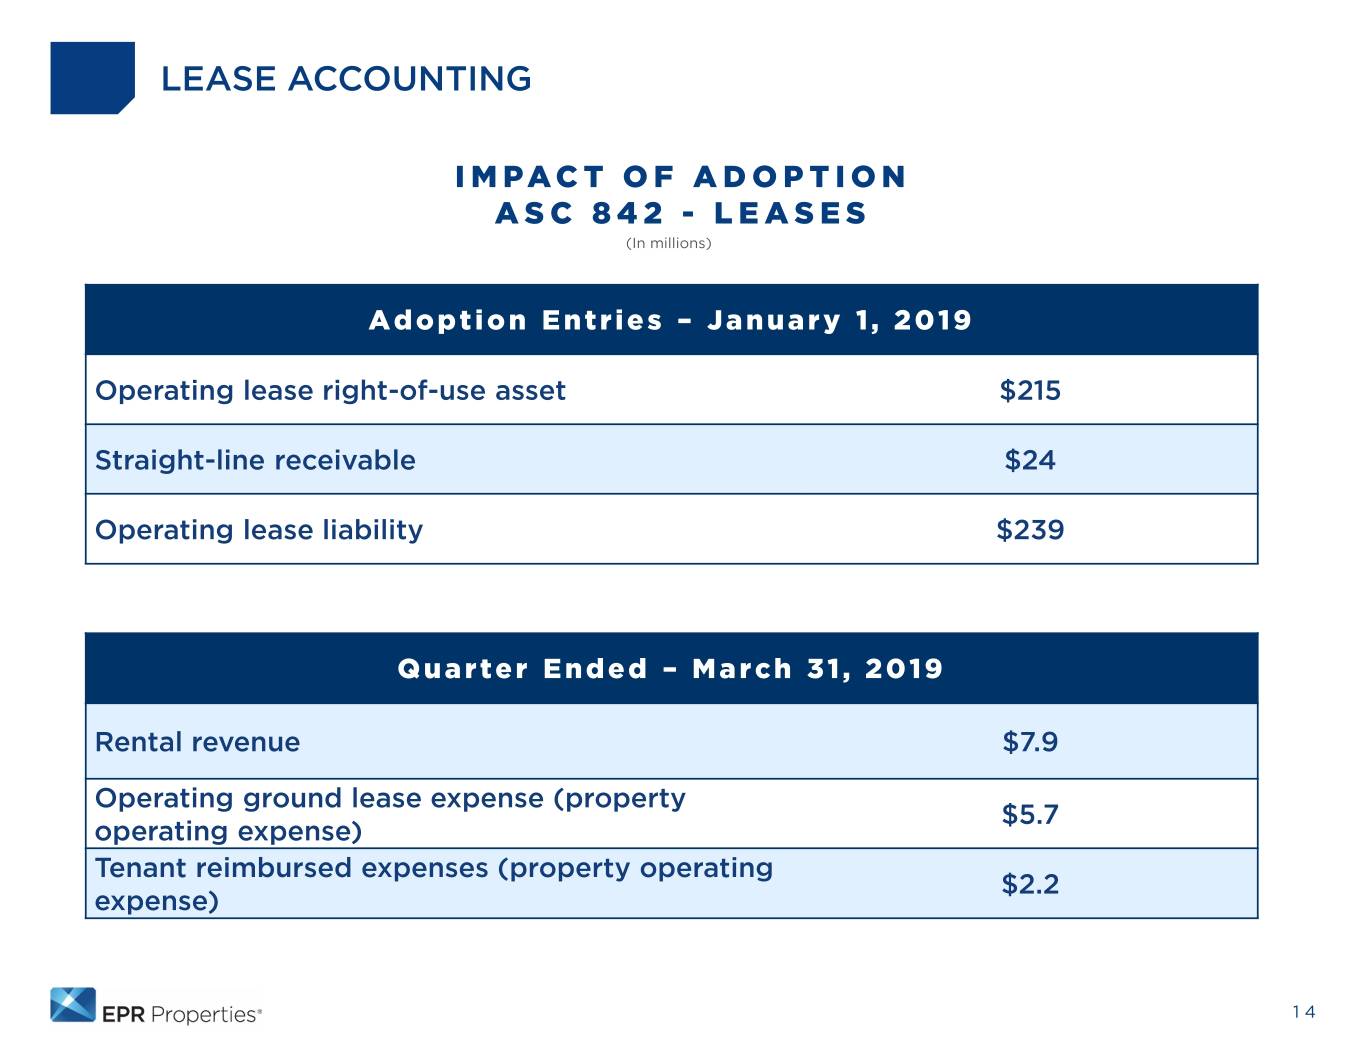
LEASE ACCOUNTING IMPACT OF ADOPTION ASC 842 - LEASES (In millions) Adoption Entries – January 1, 2019 Operating lease right-of-use asset $215 Straight-line receivable $24 Operating lease liability $239 Quarter Ended – March 31, 2019 Rental revenue $7.9 Operating ground lease expense (property $5.7 operating expense) Tenant reimbursed expenses (property operating $2.2 expense) 14
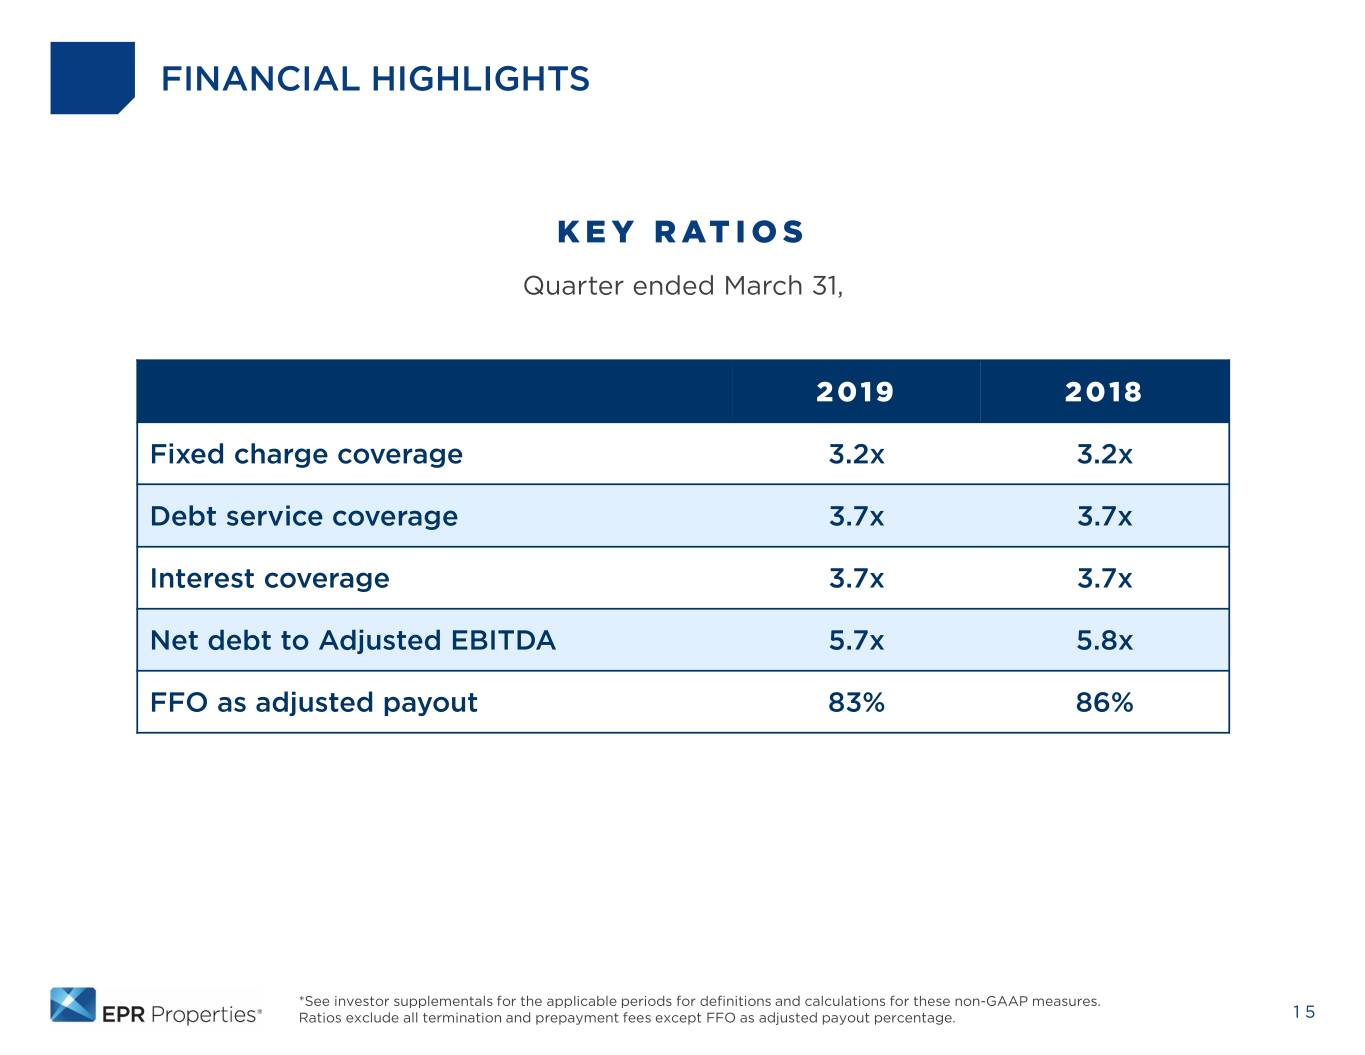
FINANCIAL HIGHLIGHTS KEY RATIOS Quarter ended March 31, 2019 2018 Fixed charge coverage 3.2x 3.2x Debt service coverage 3.7x 3.7x Interest coverage 3.7x 3.7x Net debt to Adjusted EBITDA 5.7x 5.8x FFO as adjusted payout 83% 86% *See investor supplementals for the applicable periods for definitions and calculations for these non-GAAP measures. Ratios exclude all termination and prepayment fees except FFO as adjusted payout percentage. 15

CAPITAL MARKETS & LIQUIDITY UPDATE 16
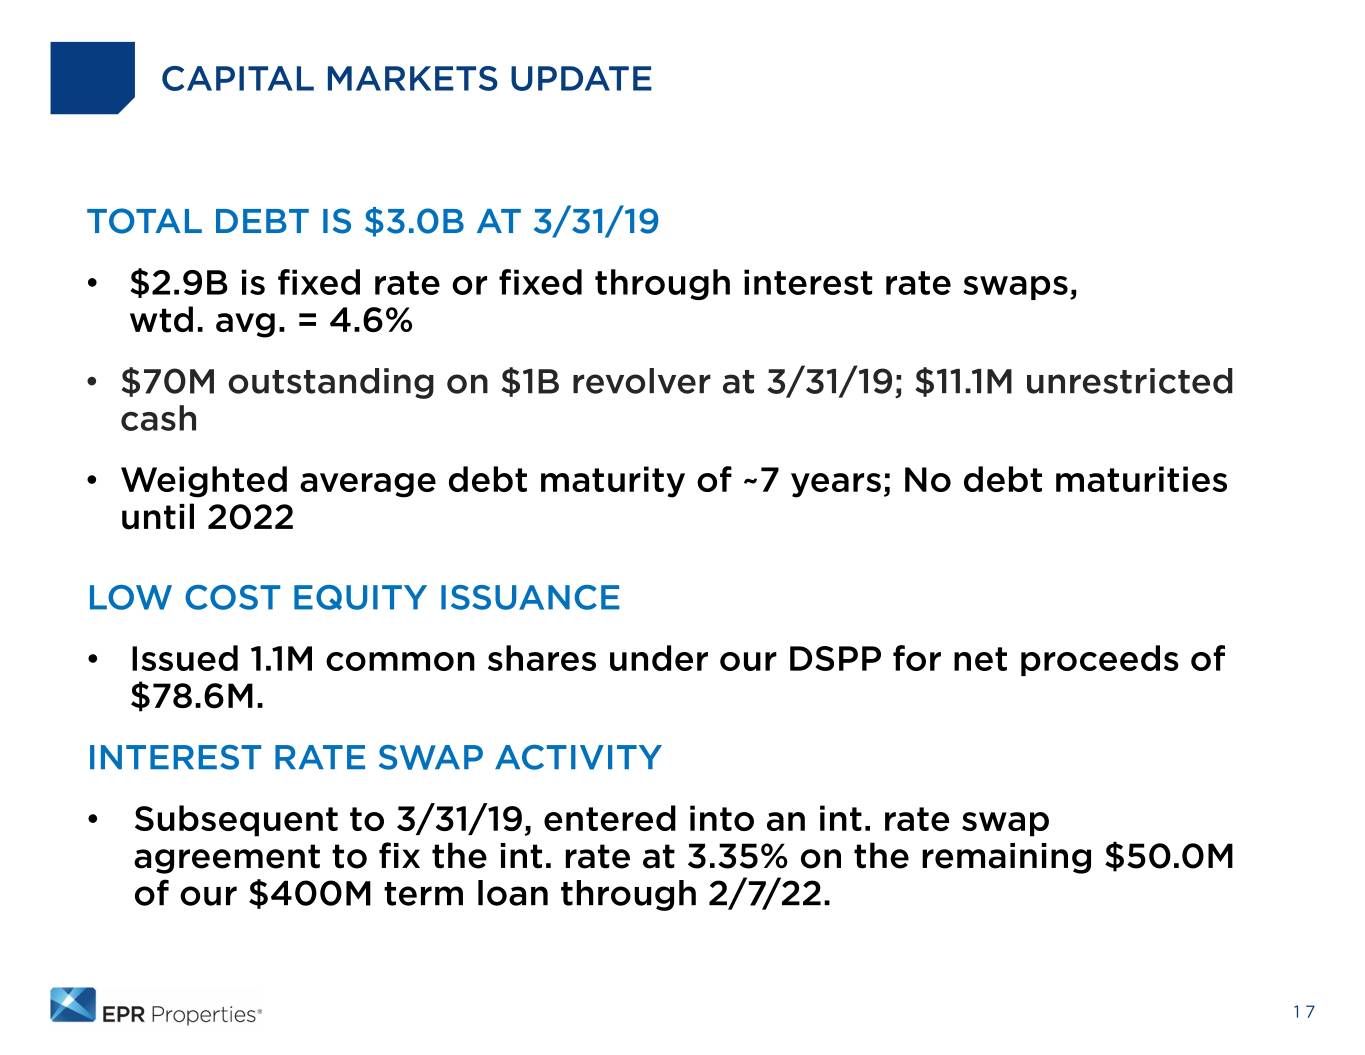
CAPITAL MARKETS UPDATE TOTAL DEBT IS $3.0B AT 3/31/19 • $2.9B is fixed rate or fixed through interest rate swaps, wtd. avg. = 4.6% • $70M outstanding on $1B revolver at 3/31/19; $11.1M unrestricted cash • Weighted average debt maturity of ~7 years; No debt maturities until 2022 LOW COST EQUITY ISSUANCE • Issued 1.1M common shares under our DSPP for net proceeds of $78.6M. INTEREST RATE SWAP ACTIVITY • Subsequent to 3/31/19, entered into an int. rate swap agreement to fix the int. rate at 3.35% on the remaining $50.0M of our $400M term loan through 2/7/22. 17
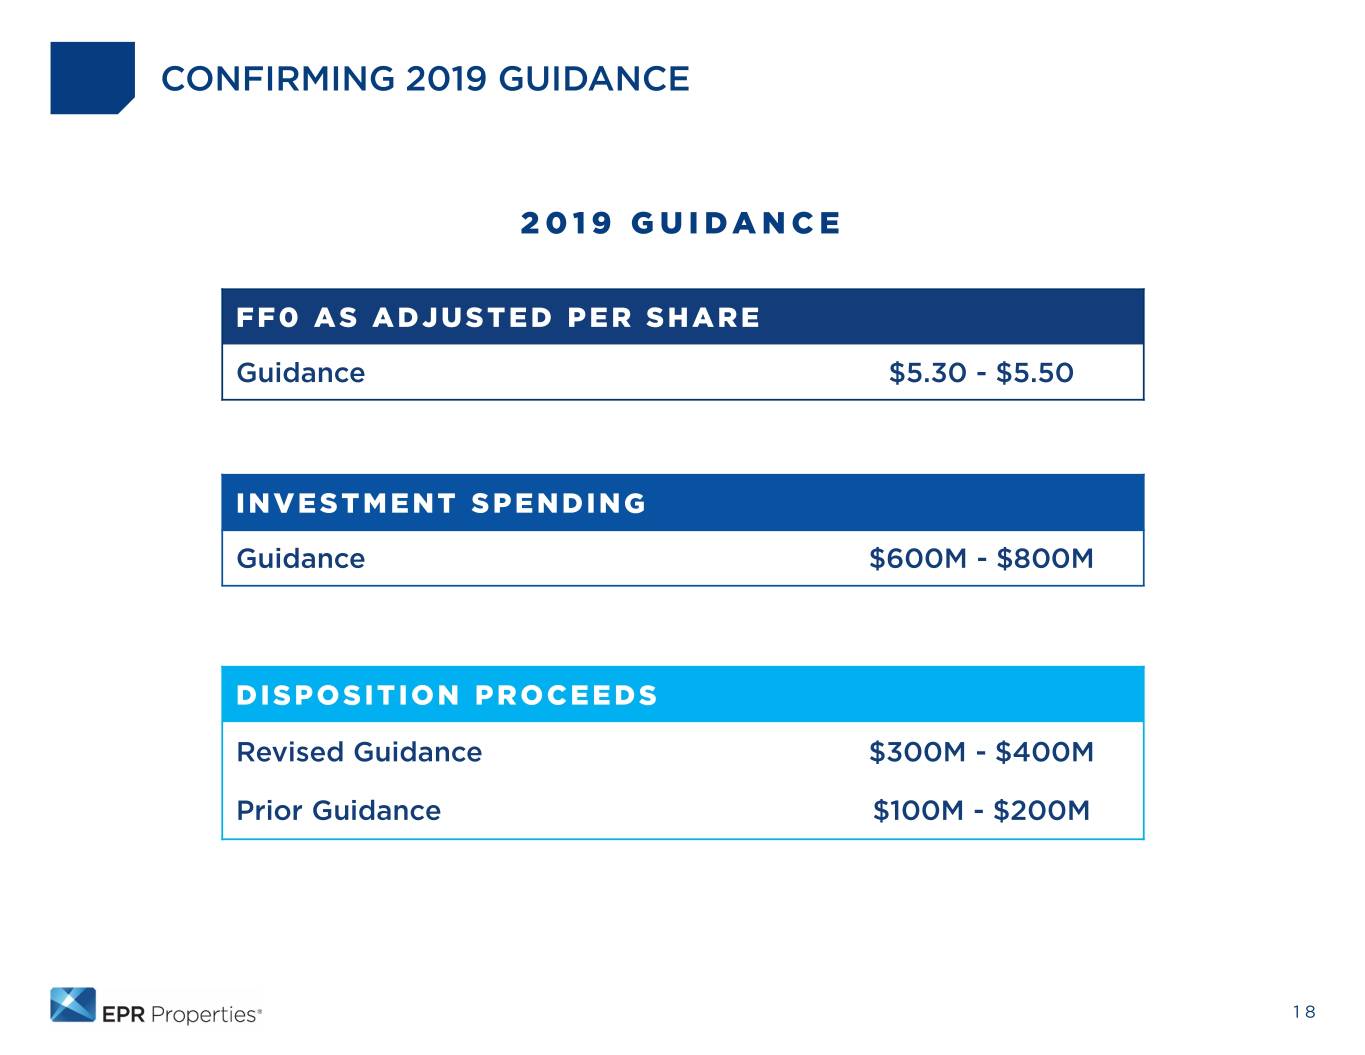
CONFIRMING 2019 GUIDANCE 2019 GUIDANCE FF0 AS ADJUSTED PER SHARE Guidance $5.30 - $5.50 INVESTMENT SPENDING Guidance $600M - $800M DISPOSITION PROCEEDS Revised Guidance $300M - $400M Prior Guidance $100M - $200M 18

CLOSING COMMENTS 19

EPR Properties 909 Walnut Street, Suite 200 Kansas City, MO 64106 www.eprkc.com 816-472-1700 info@eprkc.com


