CHARTER SCHOOL PORTFOLIO TRANSACTION ACTIVATING A STRATEGIC EXPERIENTIAL MIGRATION NOVEMBER 25, 2019
DISCLAIMER Statements made in this presentation may constitute "forward-looking statements" within the meaning of Section 27A of the Securities Act of 1933, as amended, and Section 21E of the Securities Exchange Act of 1934, as amended. Such forward-looking statements relate to, without limitation, the Company’s future economic performance, plans and objectives for future operations and projections of revenue and other financial items. Forward-looking statements can be identified by the use of words such as "may," "will," "plan," "should," "expect,” "anticipate," "estimate," "continue" or comparable terminology. Forward- looking statements are inherently subject to risks and uncertainties, many of which the Company cannot predict with accuracy and some of which the Company might not even anticipate. Although we believe that the expectations reflected in such forward-looking statements are based upon reasonable assumptions at the time made, we can give no assurance that such expectations will be achieved. Future events and actual results, financial and otherwise, may differ materially from the results discussed in the forward-looking statements. Readers are cautioned not to place undue reliance on these forward-looking statements and are advised to consider the factors listed under the headings "Risk Factors" in the Company’s Annual Report on Form 10-K, as may be supplemented or amended by the Company’s Quarterly Reports on Form 10-Q and Current Reports on Form 8-K. The Company assumes no obligation to update and supplement forward-looking statements that become untrue because of subsequent events, new information or otherwise. Definitions and reconciliations of the non-GAAP financial measures used in this presentation are available in our investor supplemental dated September 30, 2019 available on our website at www.eprkc.com. Footnotes for data provided in this presentation are in the Appendix. 2

CHARTER SCHOOL PORTFOLIO TRANSACTION EPR’s charter school investing life cycle culminates with $454M liquidity event • Sold 47 charter school assets for ~ $454M in gross cash consideration to a fund sponsored by Rosemawr Management • Key stats from charter school investment life cycle: o Ultimately invested ~$1.1 billion from 2006-2019; 10.5% unlevered IRR inclusive of final sale transaction o Total net gains and prepayment fees of $73M through Q3 2019 o Fourth quarter charter school sales are expected to result in a net loss of ~$19M, which includes the write-off of ~$26M in non-cash straight line rent and effective interest receivables • Sale closed on November 22, 2019 This transaction activates a deliberate strategic migration 3
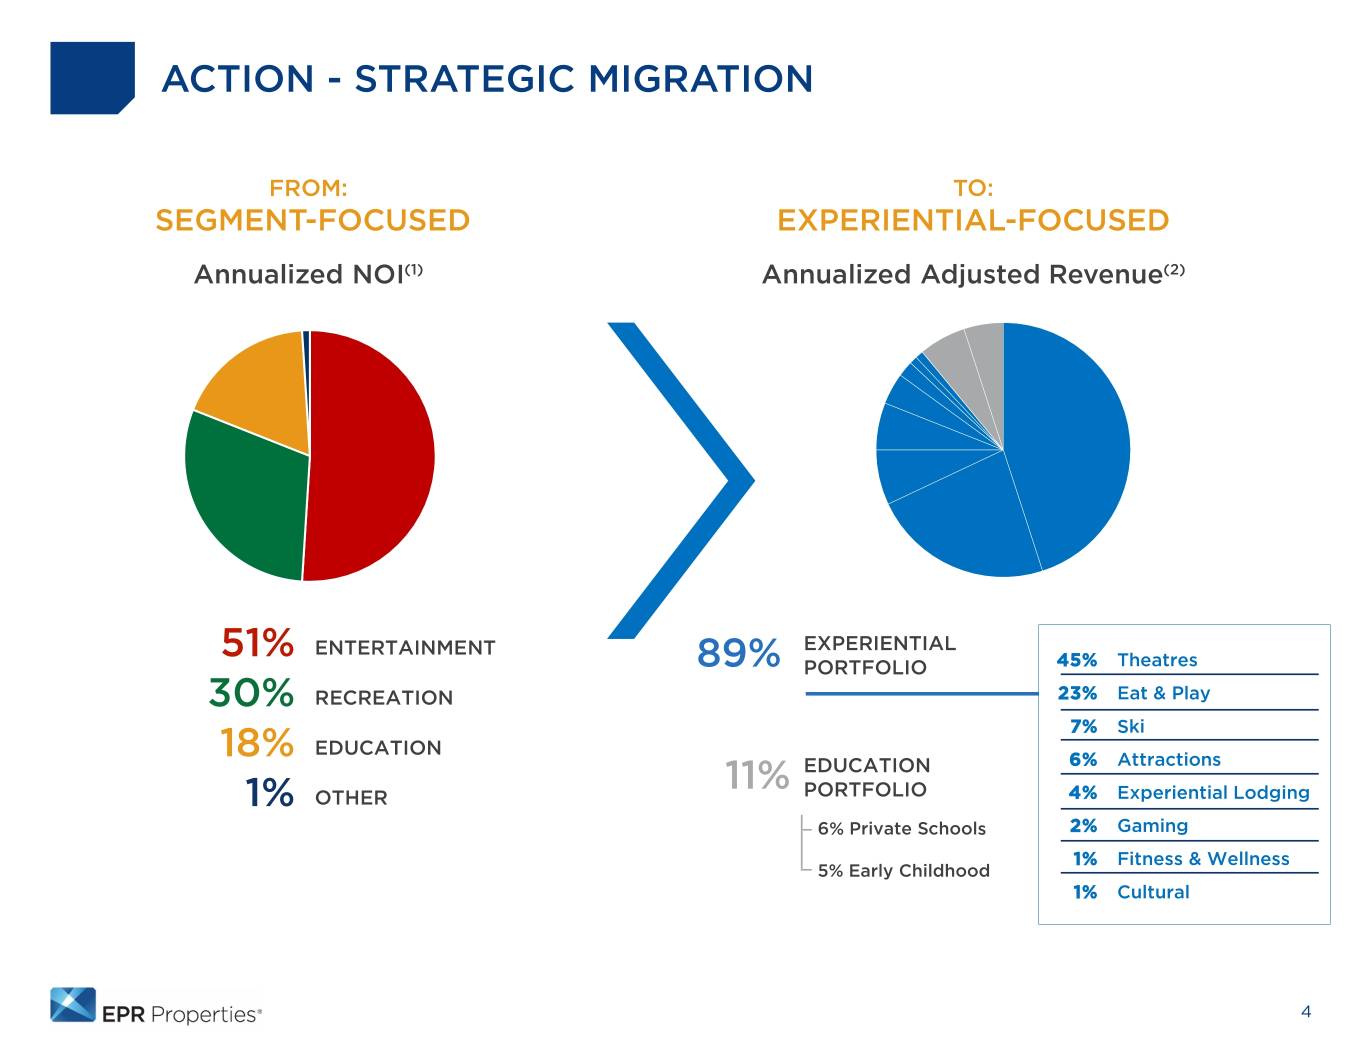
ACTION - STRATEGIC MIGRATION FROM: TO: SEGMENT-FOCUSED EXPERIENTIAL-FOCUSED Annualized NOI(1) Annualized Adjusted Revenue(2) 51% ENTERTAINMENT EXPERIENTIAL 89% PORTFOLIO 45% Theatres 30% RECREATION 23% Eat & Play 7% Ski 18% EDUCATION 11% EDUCATION 6% Attractions 1% OTHER PORTFOLIO 4% Experiential Lodging 6% Private Schools 2% Gaming 1% Fitness & Wellness 5% Early Childhood 1% Cultural 4
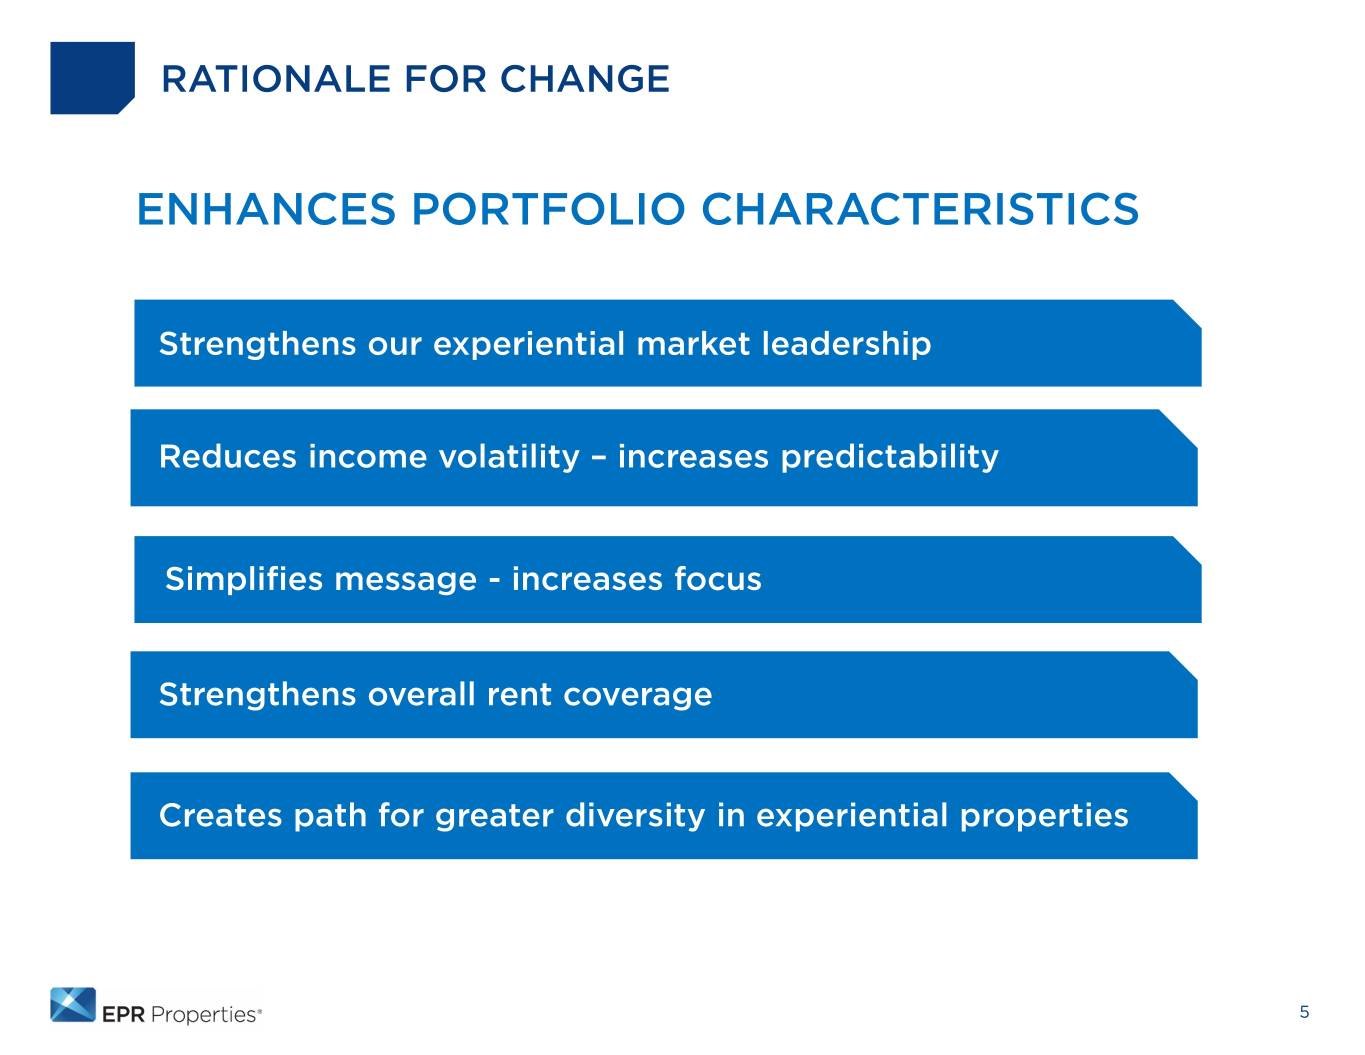
RATIONALE FOR CHANGE ENHANCES PORTFOLIO CHARACTERISTICS Strengthens our experiential market leadership Reduces income volatility – increases predictability Simplifies message - increases focus Strengthens overall rent coverage Creates path for greater diversity in experiential properties 5

WHY EXPERIENTIAL? Growth of Experience Economy • Anchored by Baby Boomers and Millennials, two largest population segments * o Baby Boomers control ~70% of disposable income o Millennials have strong orientation toward experiential lifestyles Leverages Institutionalized Knowledge • EPR has over 20 years of experience and knowledge in this type of real estate Creates Meaningful Market Distinction & Leadership • Moderate investment exposure and correlation in REITs today *Source: U.S. News and World Report: Baby Boomer Report, https://www.usnews.com/pubfiles/USNews_Market_Insights_Boomers2015.pdf 6
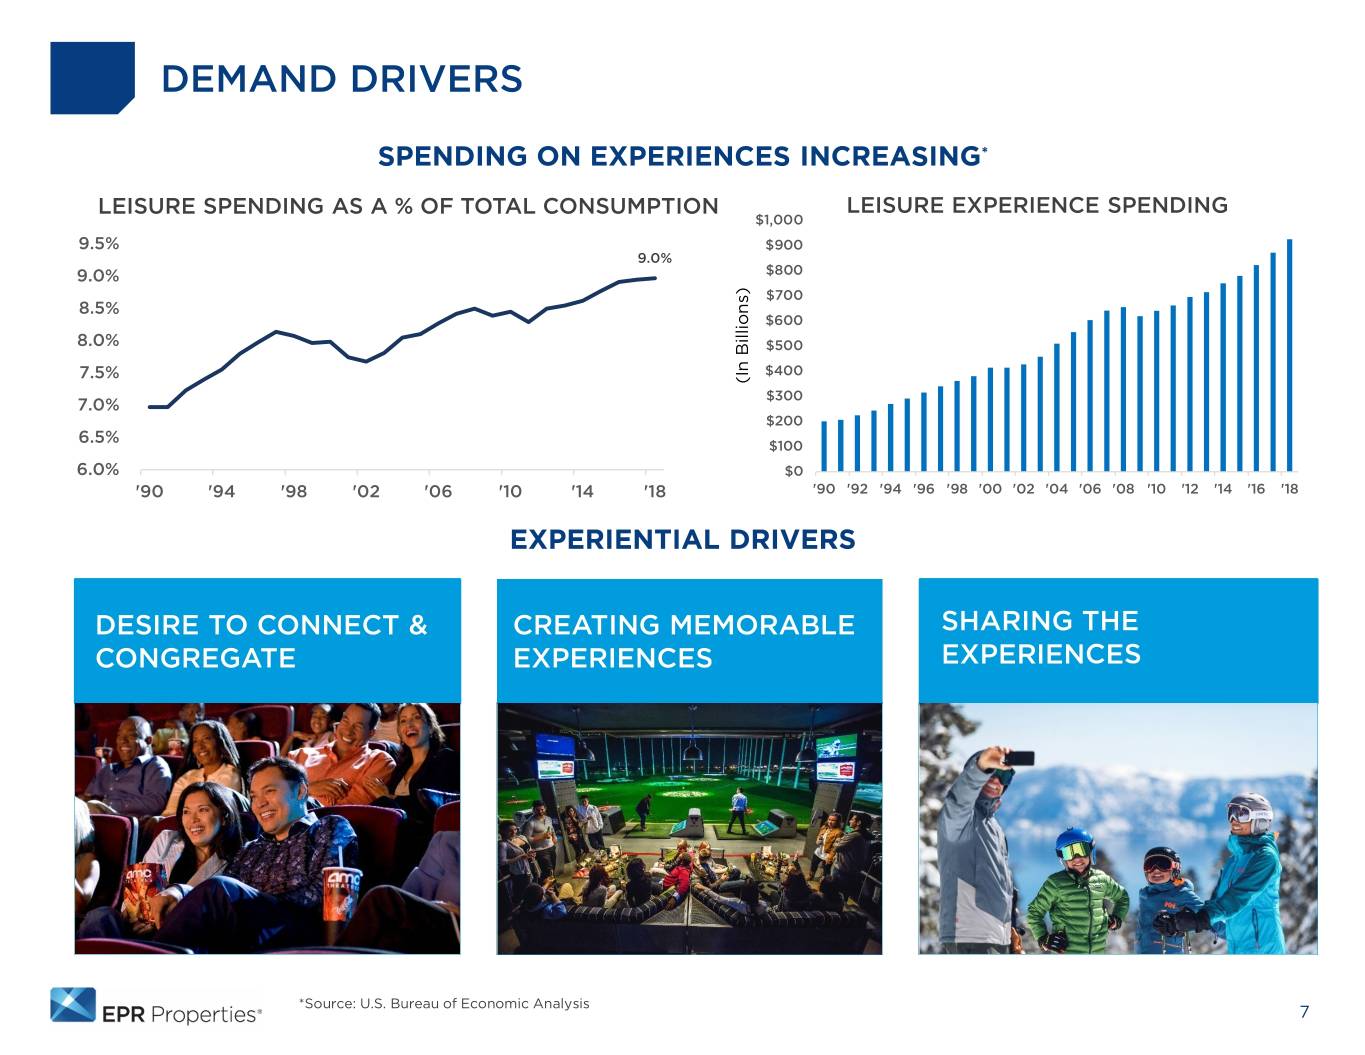
DEMAND DRIVERS SPENDING ON EXPERIENCES INCREASING* LEISURE SPENDING AS A % OF TOTAL CONSUMPTION LEISURE EXPERIENCE SPENDING $1,000 9.5% $900 9.0% 9.0% $800 $700 8.5% $600 8.0% $500 7.5% $400 (In Billions) (In $300 7.0% $200 6.5% $100 6.0% $0 '90 '94 '98 '02 '06 '10 '14 '18 '90 '92 '94 '96 '98 '00 '02 '04 '06 '08 '10 '12 '14 '16 '18 EXPERIENTIAL DRIVERS DESIRE TO CONNECT & CREATING MEMORABLE SHARING THE CONGREGATE EXPERIENCES EXPERIENCES *Source: U.S. Bureau of Economic Analysis 7
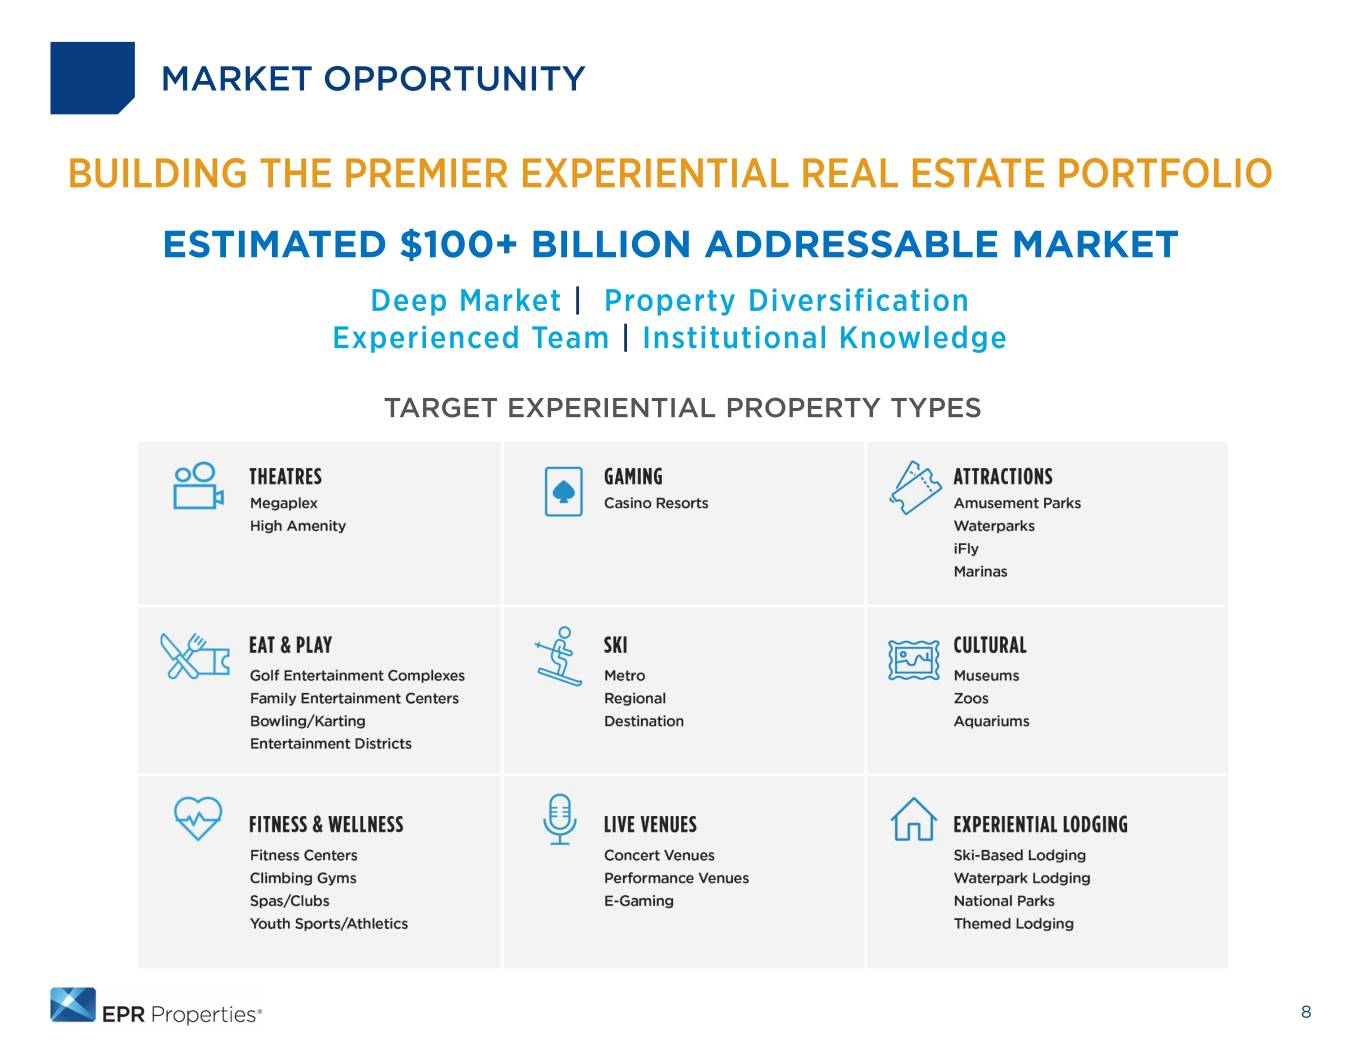
MARKET OPPORTUNITY BUILDING THE PREMIER EXPERIENTIAL REAL ESTATE PORTFOLIO ESTIMATED $100+ BILLION ADDRESSABLE MARKET Deep Market | Property Diversification Experienced Team | Institutional Knowledge TARGET EXPERIENTIAL PROPERTY TYPES 8
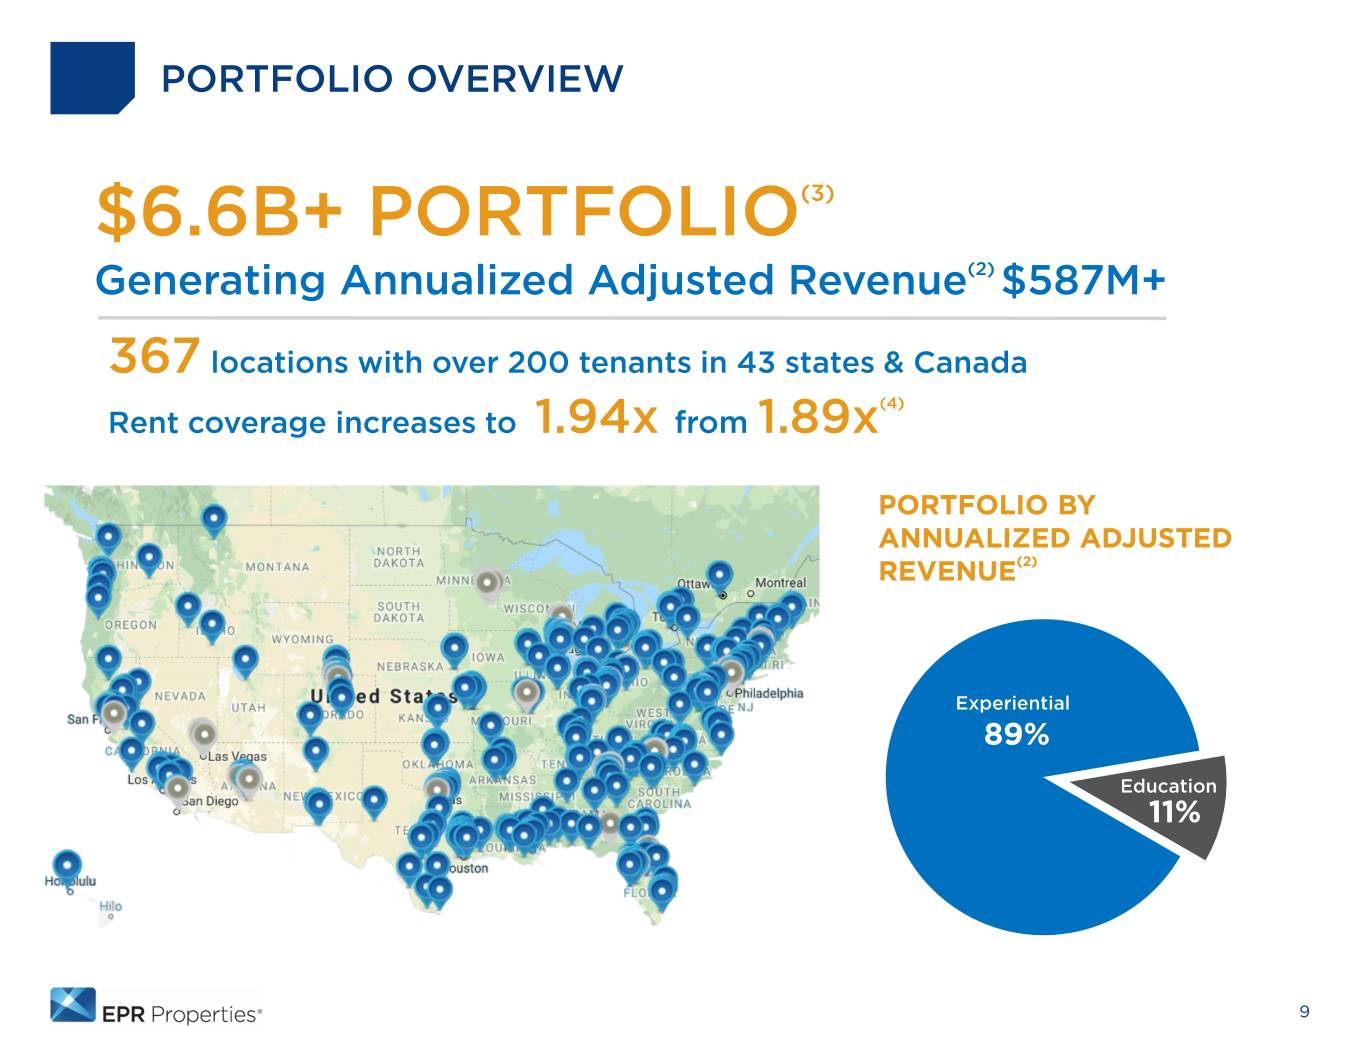
PORTFOLIO OVERVIEW $6.6B+ PORTFOLIO(3) Generating Annualized Adjusted Revenue(2) $587M+ 367 locations with over 200 tenants in 43 states & Canada (4) Rent coverage increases to 1.94x from 1.89x PORTFOLIO BY ANNUALIZED ADJUSTED REVENUE(2) Experiential 89% Education 11% 9
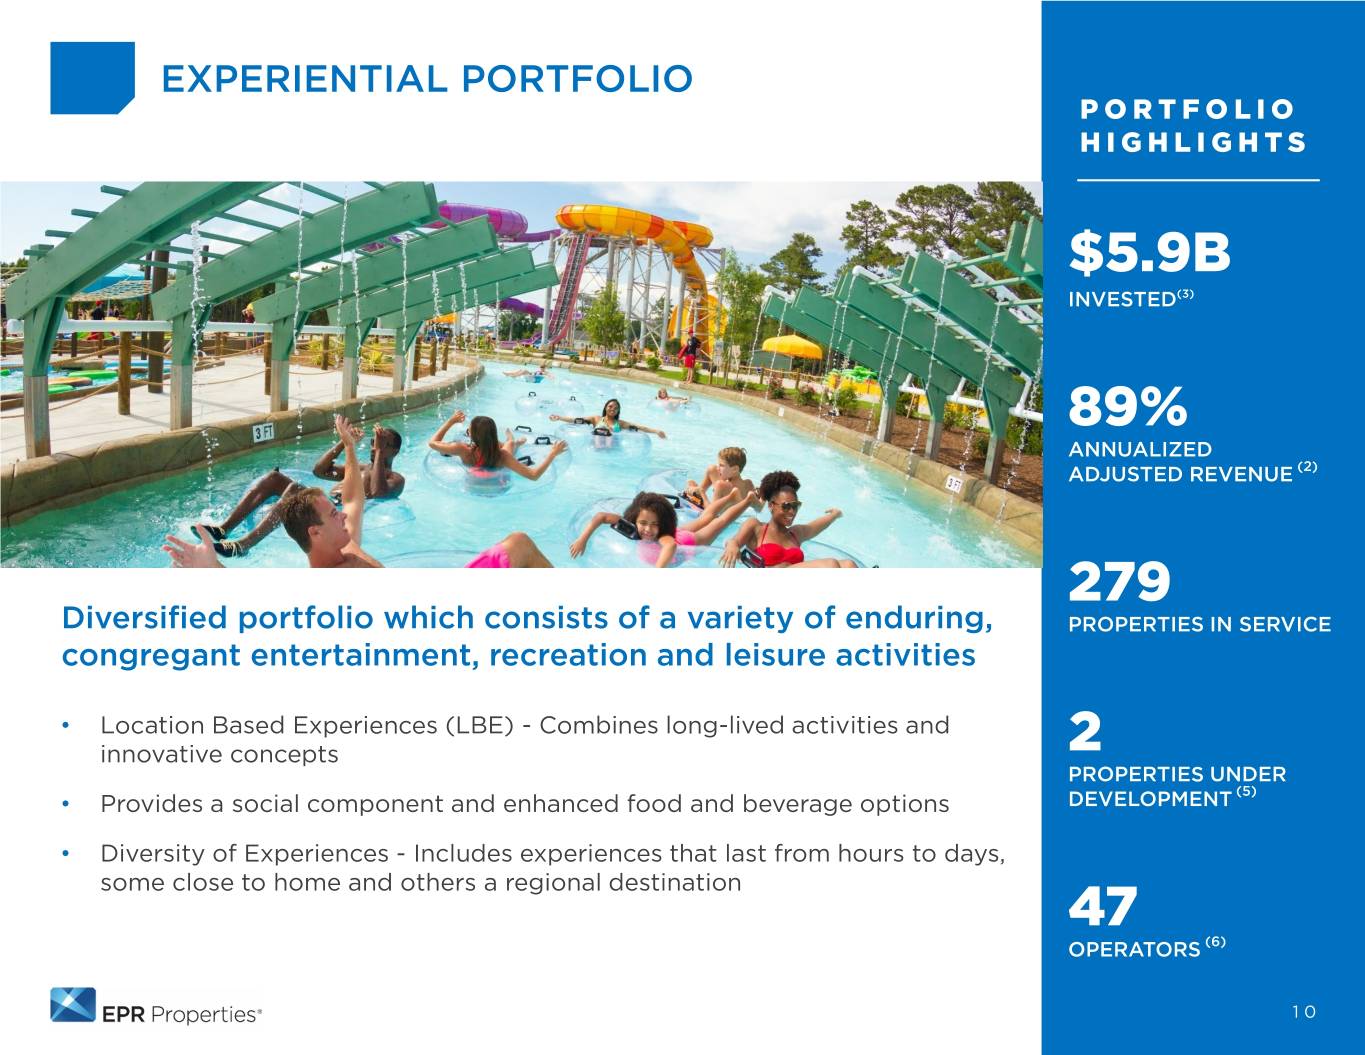
EXPERIENTIAL PORTFOLIO PORTFOLIO HIGHLIGHTS $5.9B INVESTED(3) 89% ANNUALIZED ADJUSTED REVENUE (2) 279 Diversified portfolio which consists of a variety of enduring, PROPERTIES IN SERVICE congregant entertainment, recreation and leisure activities • Location Based Experiences (LBE) - Combines long-lived activities and innovative concepts 2 PROPERTIES UNDER (5) • Provides a social component and enhanced food and beverage options DEVELOPMENT • Diversity of Experiences - Includes experiences that last from hours to days, some close to home and others a regional destination 47 OPERATORS (6) 10
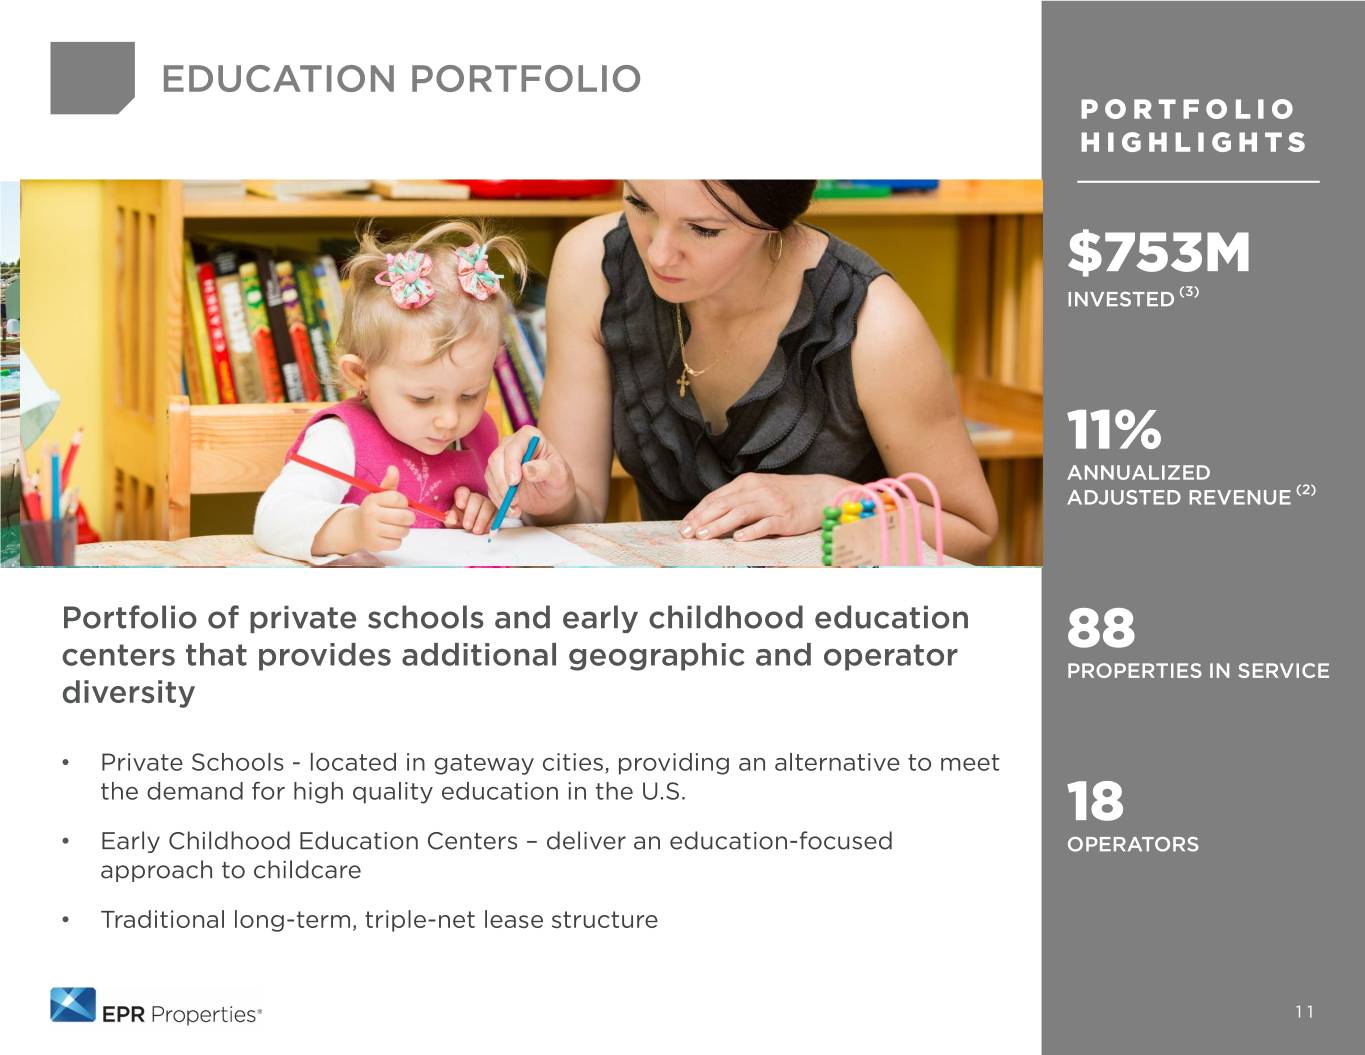
EDUCATION PORTFOLIO PORTFOLIO HIGHLIGHTS $753M INVESTED (3) 11% ANNUALIZED ADJUSTED REVENUE (2) Portfolio of private schools and early childhood education 88 centers that provides additional geographic and operator PROPERTIES IN SERVICE diversity • Private Schools - located in gateway cities, providing an alternative to meet the demand for high quality education in the U.S. 18 • Early Childhood Education Centers – deliver an education-focused OPERATORS approach to childcare • Traditional long-term, triple-net lease structure 11
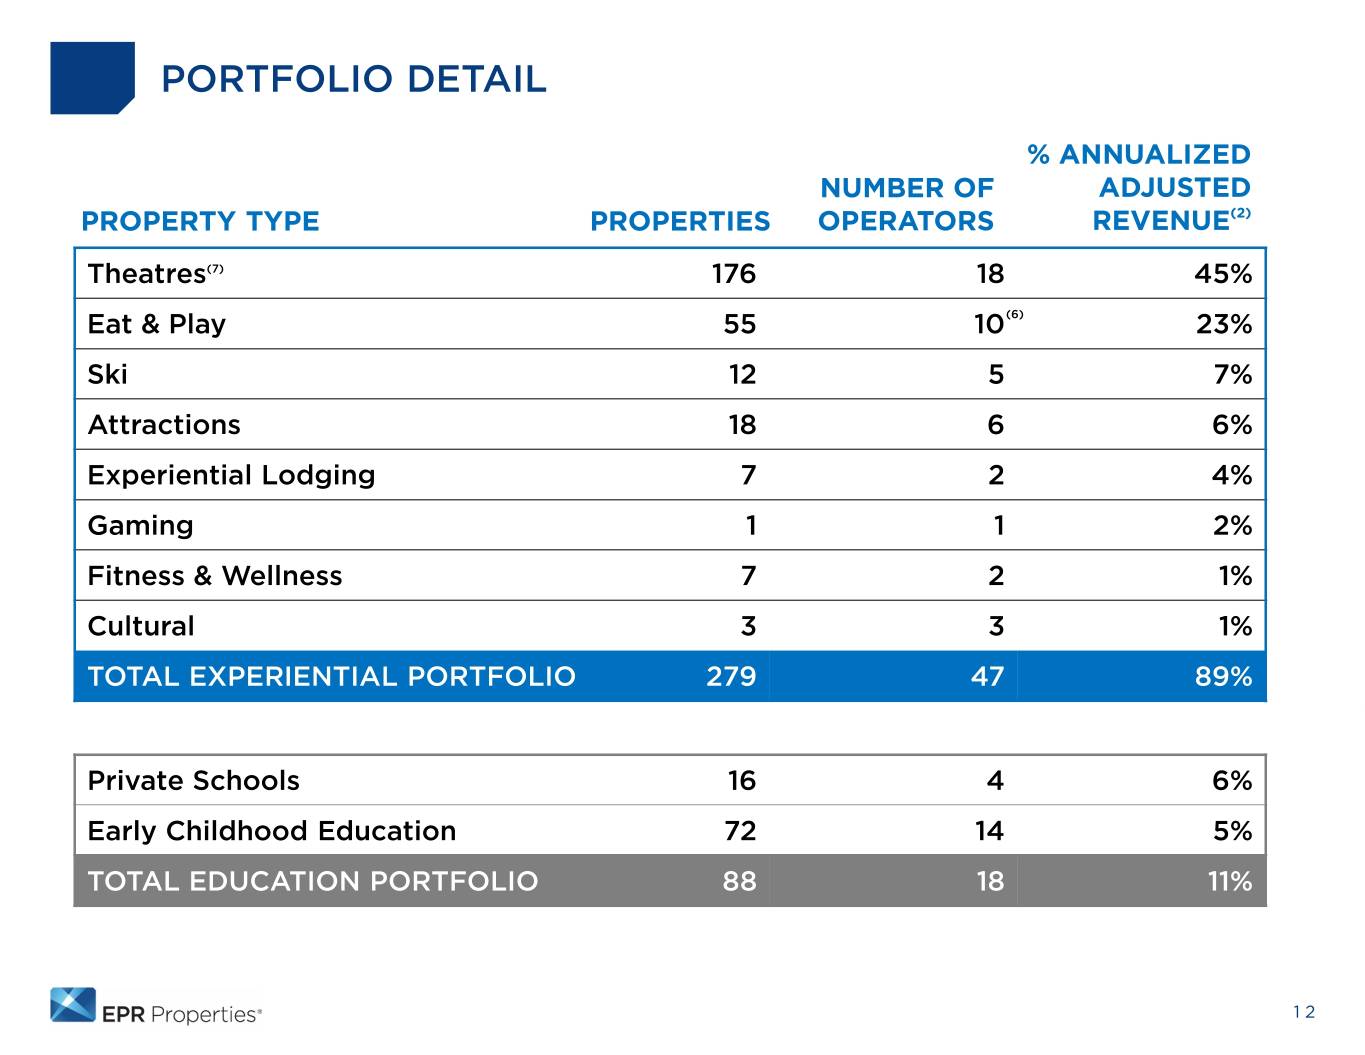
PORTFOLIO DETAIL % ANNUALIZED NUMBER OF ADJUSTED PROPERTY TYPE PROPERTIES OPERATORS REVENUE(2) Theatres(7) 176 18 45% Eat & Play 55 10(6) 23% Ski 12 5 7% Attractions 18 6 6% Experiential Lodging 7 2 4% Gaming 1 1 2% Fitness & Wellness 7 2 1% Cultural 3 3 1% TOTAL EXPERIENTIAL PORTFOLIO 279 47 89% Private Schools 16 4 6% Early Childhood Education 72 14 5% TOTAL EDUCATION PORTFOLIO 88 18 11% 12
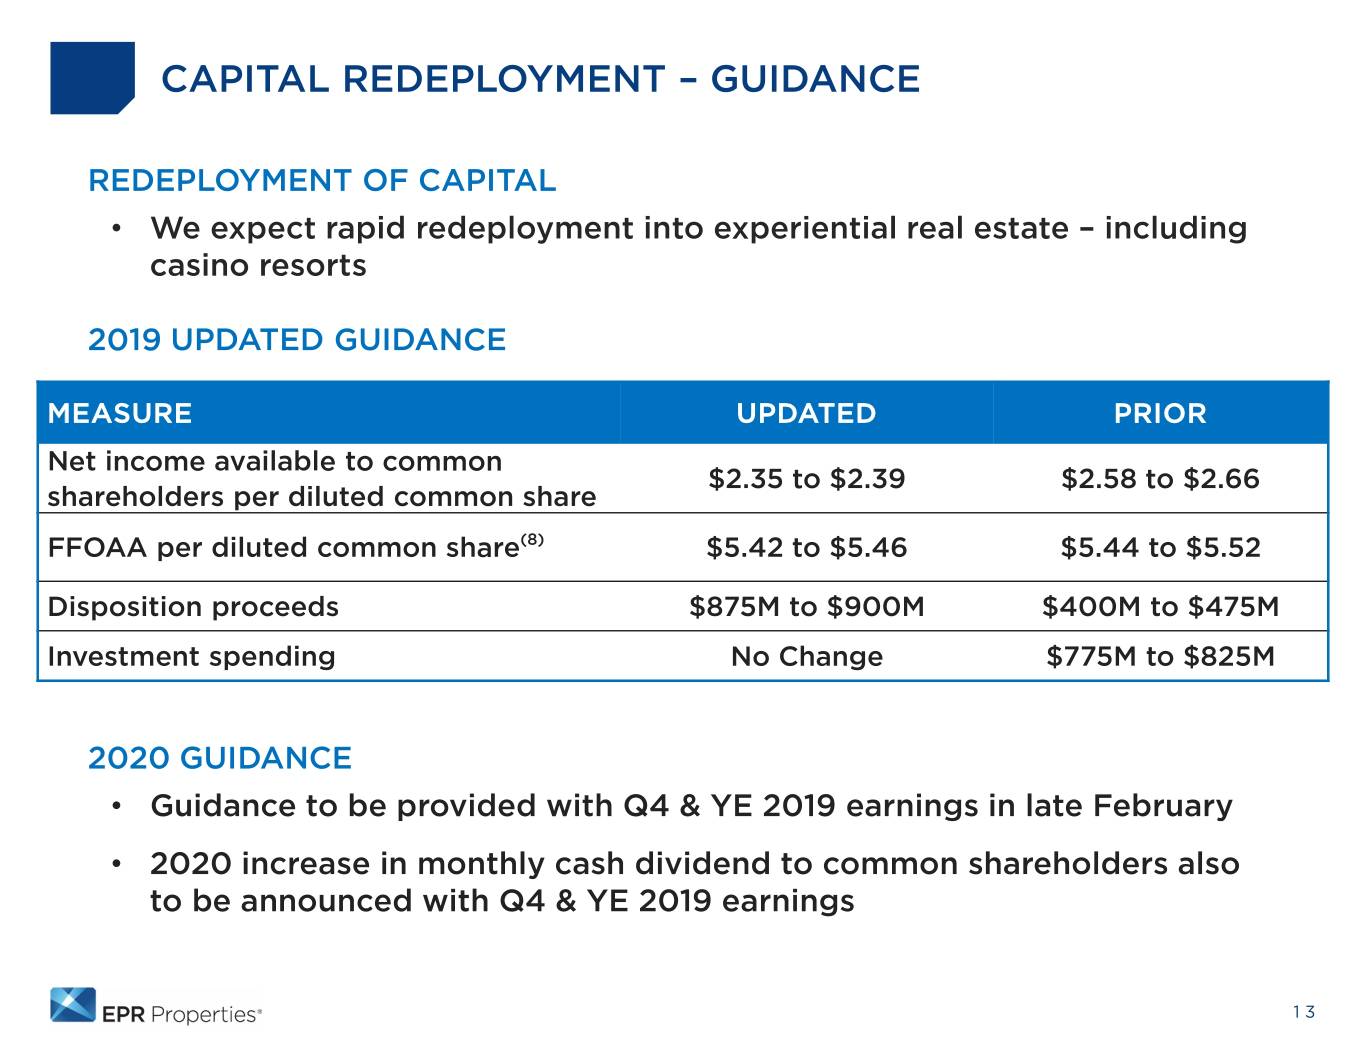
CAPITAL REDEPLOYMENT – GUIDANCE REDEPLOYMENT OF CAPITAL • We expect rapid redeployment into experiential real estate – including casino resorts 2019 UPDATED GUIDANCE MEASURE UPDATED PRIOR Net income available to common $2.35 to $2.39 $2.58 to $2.66 shareholders per diluted common share FFOAA per diluted common share(8) $5.42 to $5.46 $5.44 to $5.52 Disposition proceeds $875M to $900M $400M to $475M Investment spending No Change $775M to $825M 2020 GUIDANCE • Guidance to be provided with Q4 & YE 2019 earnings in late February • 2020 increase in monthly cash dividend to common shareholders also to be announced with Q4 & YE 2019 earnings 13
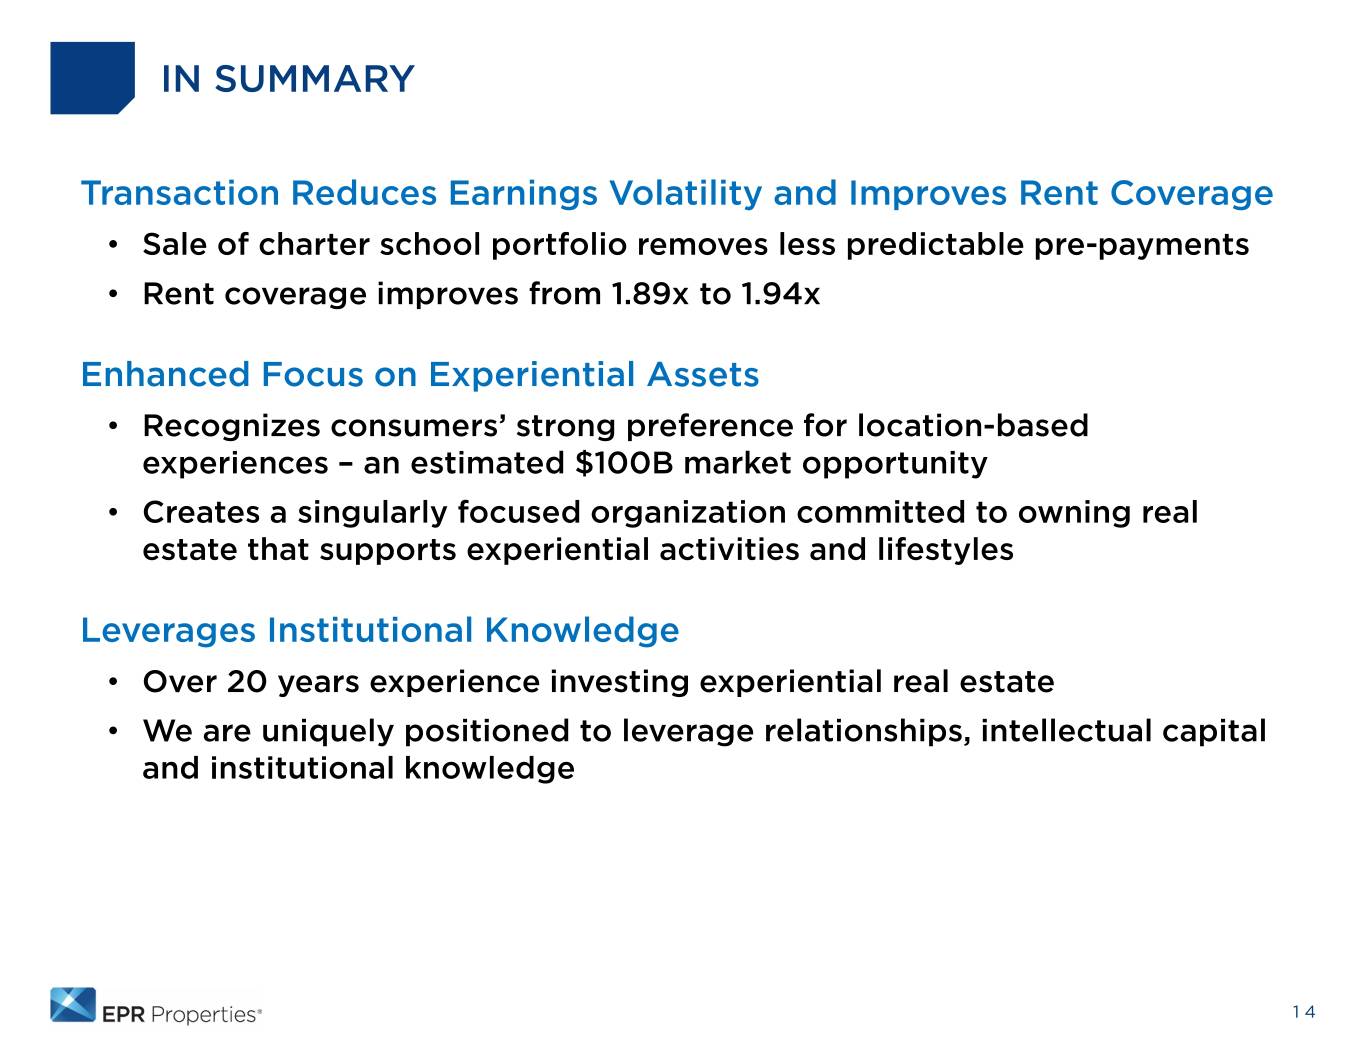
IN SUMMARY Transaction Reduces Earnings Volatility and Improves Rent Coverage • Sale of charter school portfolio removes less predictable pre-payments • Rent coverage improves from 1.89x to 1.94x Enhanced Focus on Experiential Assets • Recognizes consumers’ strong preference for location-based experiences – an estimated $100B market opportunity • Creates a singularly focused organization committed to owning real estate that supports experiential activities and lifestyles Leverages Institutional Knowledge • Over 20 years experience investing experiential real estate • We are uniquely positioned to leverage relationships, intellectual capital and institutional knowledge 14
APPENDIX 15
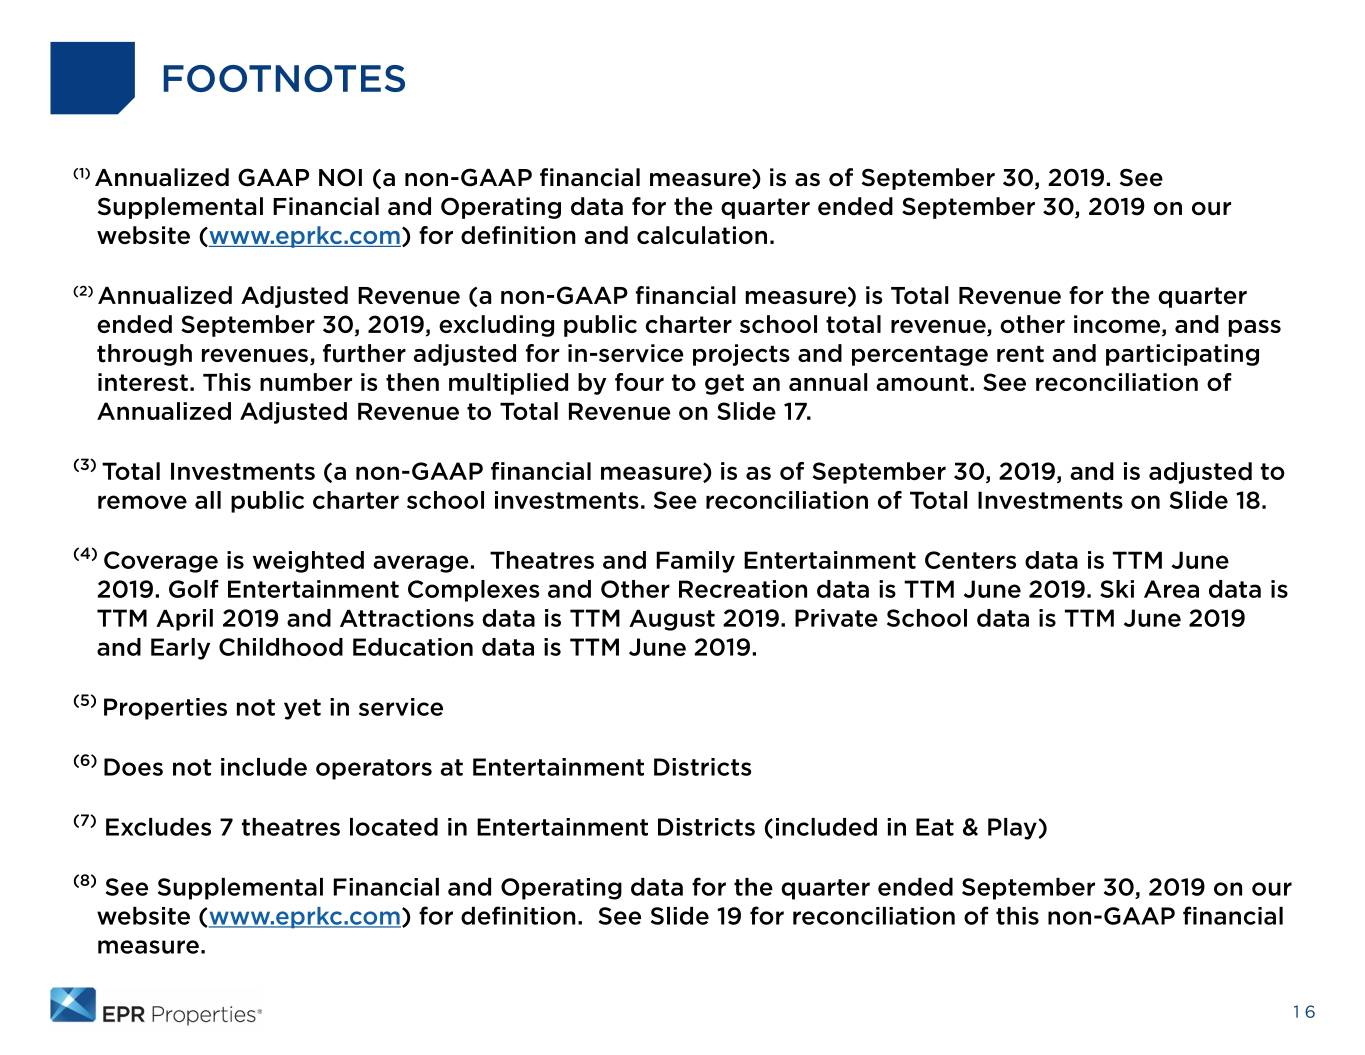
FOOTNOTES (1) Annualized GAAP NOI (a non-GAAP financial measure) is as of September 30, 2019. See Supplemental Financial and Operating data for the quarter ended September 30, 2019 on our website (www.eprkc.com) for definition and calculation. (2) Annualized Adjusted Revenue (a non-GAAP financial measure) is Total Revenue for the quarter ended September 30, 2019, excluding public charter school total revenue, other income, and pass through revenues, further adjusted for in-service projects and percentage rent and participating interest. This number is then multiplied by four to get an annual amount. See reconciliation of Annualized Adjusted Revenue to Total Revenue on Slide 17. (3) Total Investments (a non-GAAP financial measure) is as of September 30, 2019, and is adjusted to remove all public charter school investments. See reconciliation of Total Investments on Slide 18. (4) Coverage is weighted average. Theatres and Family Entertainment Centers data is TTM June 2019. Golf Entertainment Complexes and Other Recreation data is TTM June 2019. Ski Area data is TTM April 2019 and Attractions data is TTM August 2019. Private School data is TTM June 2019 and Early Childhood Education data is TTM June 2019. (5) Properties not yet in service (6) Does not include operators at Entertainment Districts (7) Excludes 7 theatres located in Entertainment Districts (included in Eat & Play) (8) See Supplemental Financial and Operating data for the quarter ended September 30, 2019 on our website (www.eprkc.com) for definition. See Slide 19 for reconciliation of this non-GAAP financial measure. 16
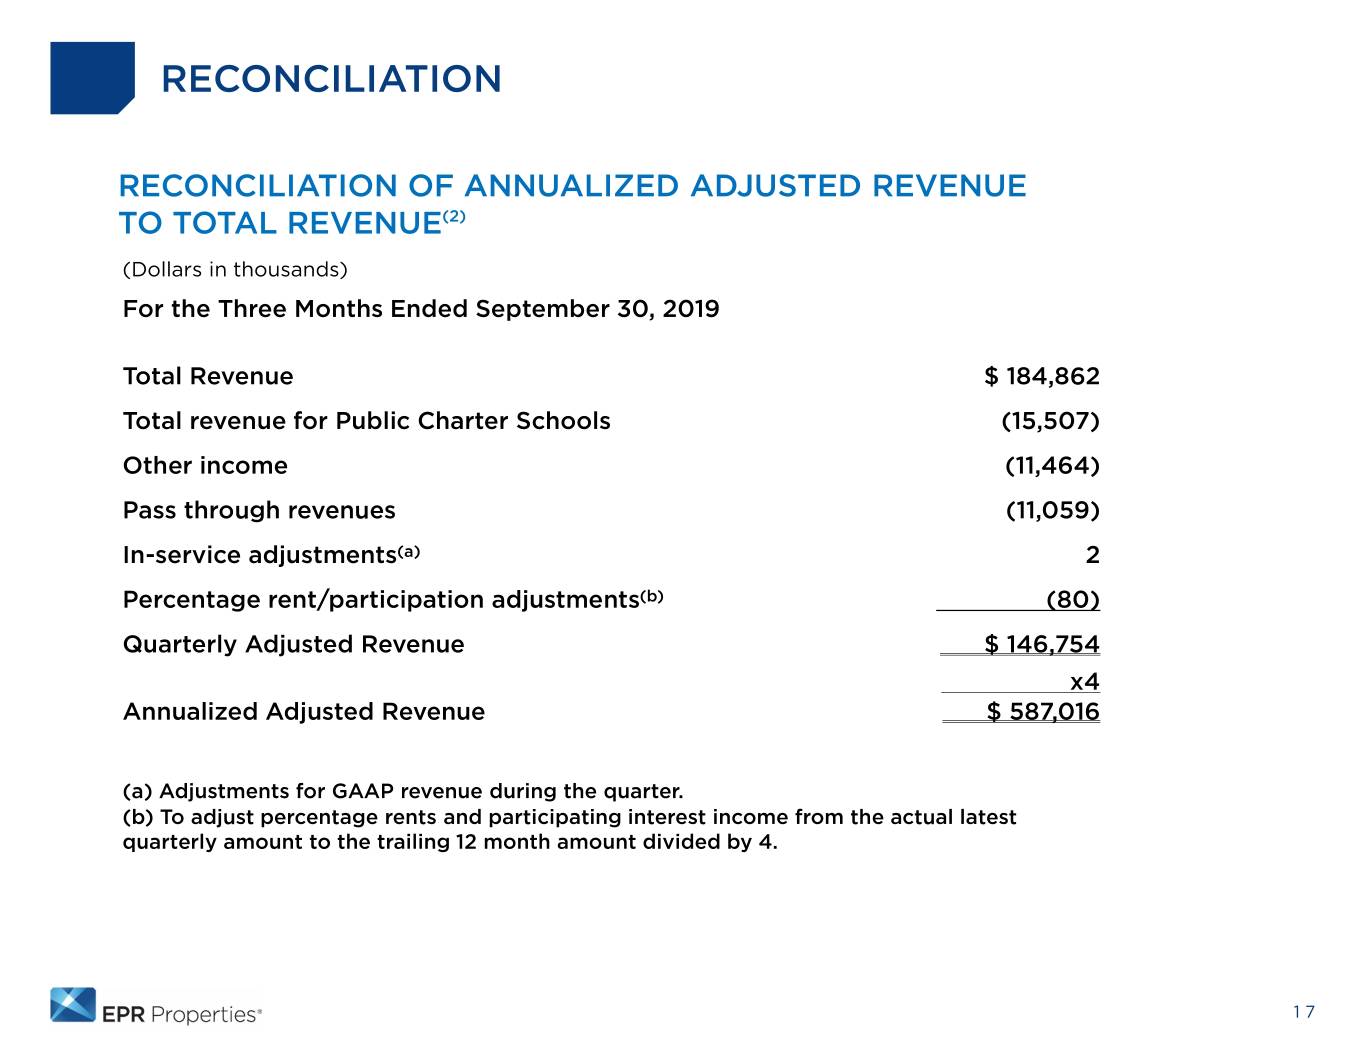
RECONCILIATION RECONCILIATION OF ANNUALIZED ADJUSTED REVENUE TO TOTAL REVENUE(2) (Dollars in thousands) For the Three Months Ended September 30, 2019 Total Revenue $ 184,862 Total revenue for Public Charter Schools (15,507) Other income (11,464) Pass through revenues (11,059) In-service adjustments(a) 2 Percentage rent/participation adjustments(b) (80) Quarterly Adjusted Revenue $ 146,754 x4 Annualized Adjusted Revenue $ 587,016 (a) Adjustments for GAAP revenue during the quarter. (b) To adjust percentage rents and participating interest income from the actual latest quarterly amount to the trailing 12 month amount divided by 4. 17
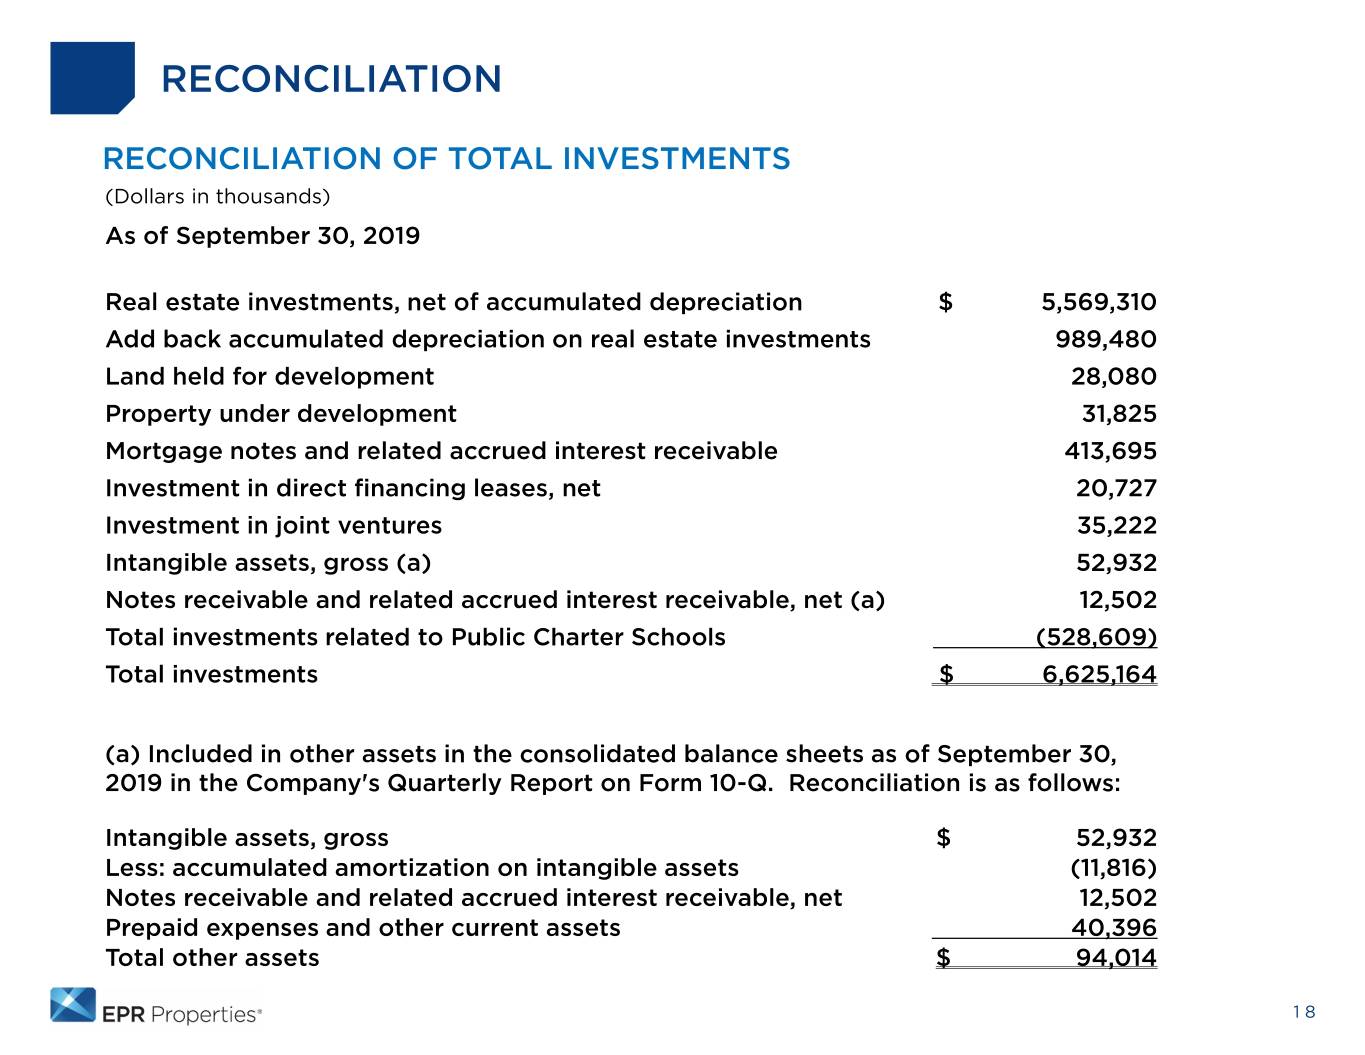
RECONCILIATION RECONCILIATION OF TOTAL INVESTMENTS (Dollars in thousands) As of September 30, 2019 Real estate investments, net of accumulated depreciation $ 5,569,310 Add back accumulated depreciation on real estate investments 989,480 Land held for development 28,080 Property under development 31,825 Mortgage notes and related accrued interest receivable 413,695 Investment in direct financing leases, net 20,727 Investment in joint ventures 35,222 Intangible assets, gross (a) 52,932 Notes receivable and related accrued interest receivable, net (a) 12,502 Total investments related to Public Charter Schools (528,609) Total investments $ 6,625,164 (a) Included in other assets in the consolidated balance sheets as of September 30, 2019 in the Company's Quarterly Report on Form 10-Q. Reconciliation is as follows: Intangible assets, gross $ 52,932 Less: accumulated amortization on intangible assets (11,816) Notes receivable and related accrued interest receivable, net 12,502 Prepaid expenses and other current assets 40,396 Total other assets $ 94,014 18
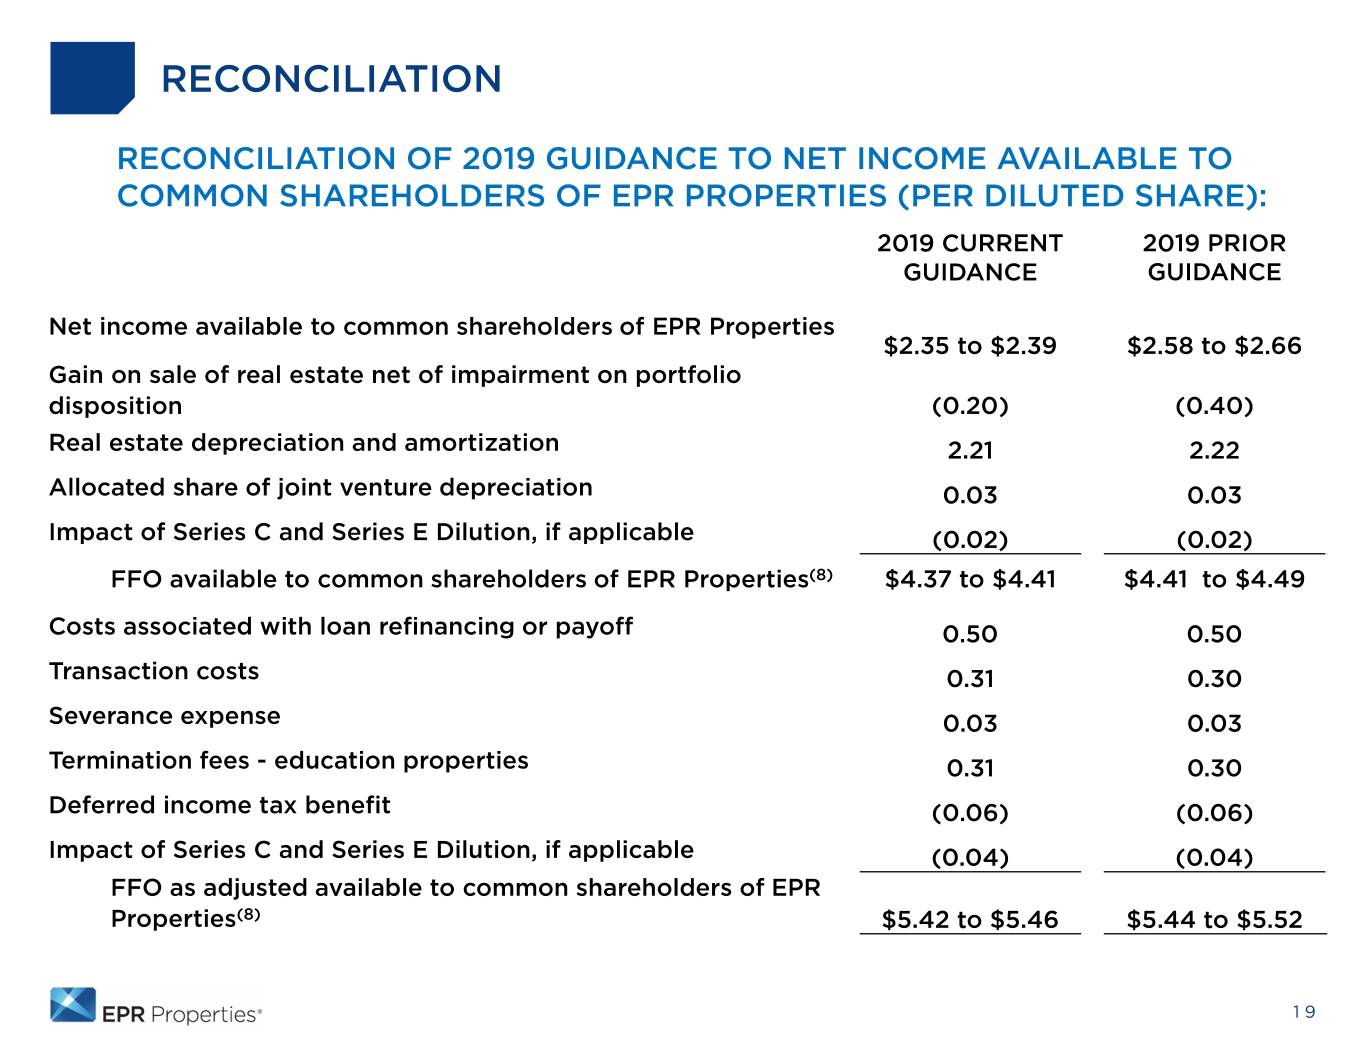
RECONCILIATION RECONCILIATION OF 2019 GUIDANCE TO NET INCOME AVAILABLE TO COMMON SHAREHOLDERS OF EPR PROPERTIES (PER DILUTED SHARE): 2019 CURRENT 2019 PRIOR GUIDANCE GUIDANCE Net income available to common shareholders of EPR Properties $2.35 to $2.39 $2.58 to $2.66 Gain on sale of real estate net of impairment on portfolio disposition (0.20) (0.40) Real estate depreciation and amortization 2.21 2.22 Allocated share of joint venture depreciation 0.03 0.03 Impact of Series C and Series E Dilution, if applicable (0.02) (0.02) FFO available to common shareholders of EPR Properties(8) $4.37 to $4.41 $4.41 to $4.49 Costs associated with loan refinancing or payoff 0.50 0.50 Transaction costs 0.31 0.30 Severance expense 0.03 0.03 Termination fees - education properties 0.31 0.30 Deferred income tax benefit (0.06) (0.06) Impact of Series C and Series E Dilution, if applicable (0.04) (0.04) FFO as adjusted available to common shareholders of EPR Properties(8) $5.42 to $5.46 $5.44 to $5.52 19

EPR Properties 909 Walnut Street, Suite 200 Kansas City, MO 64106 www.eprkc.com 816-472-1700 info@eprkc.com


