Fourth Quarter and Year End 2019 Earnings Call February 25, 2020
INTRODUCTORY COMMENTS This information is as of the date indicated and, to our knowledge, was timely and accurate when presented. We are under no obligation to update or remove outdated information other than as required by applicable law or regulation. 2
HEADLINES 1. Strategic Refocus Creates a Stronger Company 3
HEADLINES 1. Strategic Refocus Creates a Stronger Company 2. Experiential Opportunity Sets the Stage for Growth 4
HEADLINES 1. Strategic Refocus Creates a Stronger Company 2. Experiential Opportunity Sets the Stage for Growth 3. Seizing the Opportunity – Concerted Acquisition Process Begins Paying Off 5
HEADLINES 1. Strategic Refocus Creates a Stronger Company 2. Experiential Opportunity Sets the Stage for Growth 3. Seizing the Opportunity – Concerted Acquisition Process Begins Paying Off 4. Introducing Guidance for 2020 6

PORTFOLIO UPDATE 7
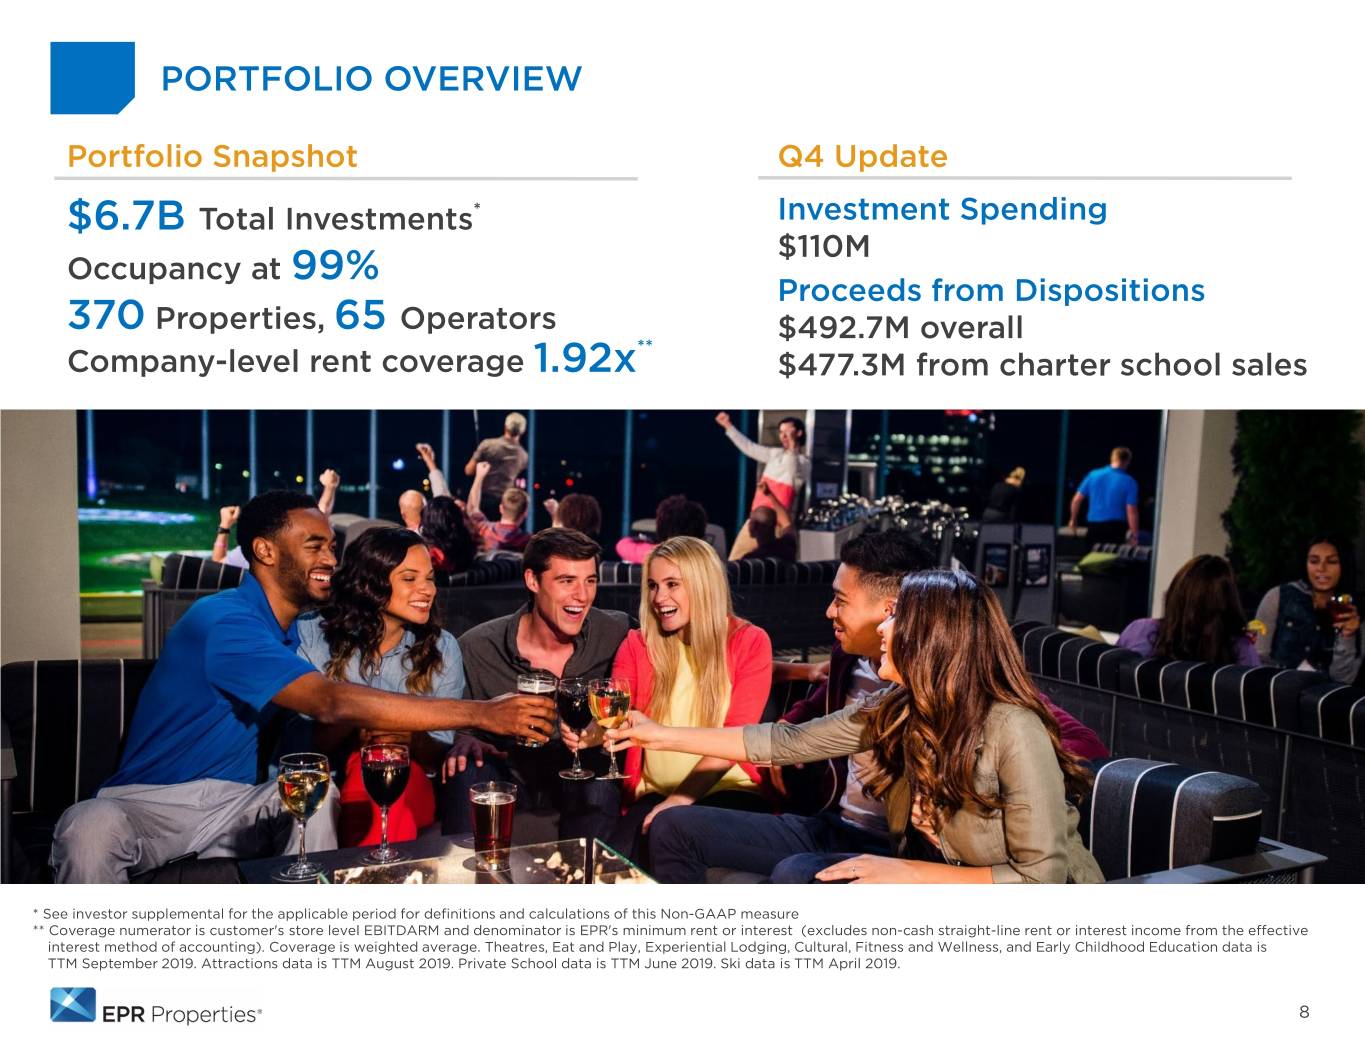
PORTFOLIO OVERVIEW Portfolio Snapshot Q4 Update $6.7B Total Investments* Investment Spending $110M Occupancy at 99% Proceeds from Dispositions 370 Properties, 65 Operators $492.7M overall ** Company-level rent coverage 1.92x $477.3M from charter school sales * See investor supplemental for the applicable period for definitions and calculations of this Non-GAAP measure ** Coverage numerator is customer's store level EBITDARM and denominator is EPR's minimum rent or interest (excludes non-cash straight-line rent or interest income from the effective interest method of accounting). Coverage is weighted average. Theatres, Eat and Play, Experiential Lodging, Cultural, Fitness and Wellness, and Early Childhood Education data is TTM September 2019. Attractions data is TTM August 2019. Private School data is TTM June 2019. Ski data is TTM April 2019. 8
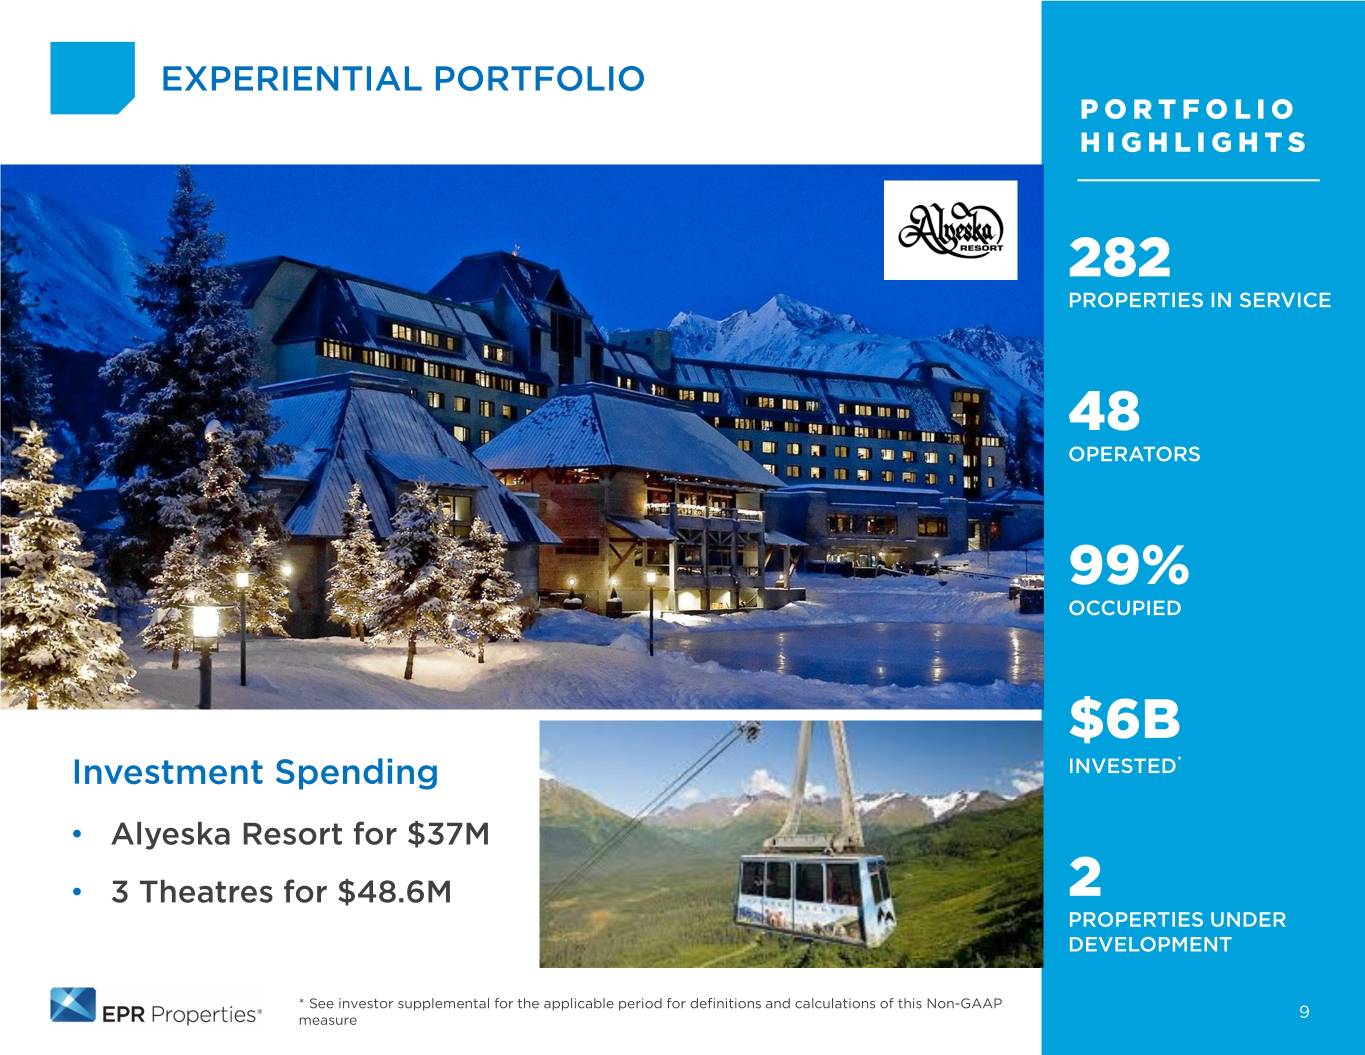
EXPERIENTIAL PORTFOLIO PORTFOLIO HIGHLIGHTS 282 PROPERTIES IN SERVICE 48 OPERATORS 99% OCCUPIED $6B Investment Spending INVESTED* • Alyeska Resort for $37M • 3 Theatres for $48.6M 2 PROPERTIES UNDER DEVELOPMENT * See investor supplemental for the applicable period for definitions and calculations of this Non-GAAP measure 9
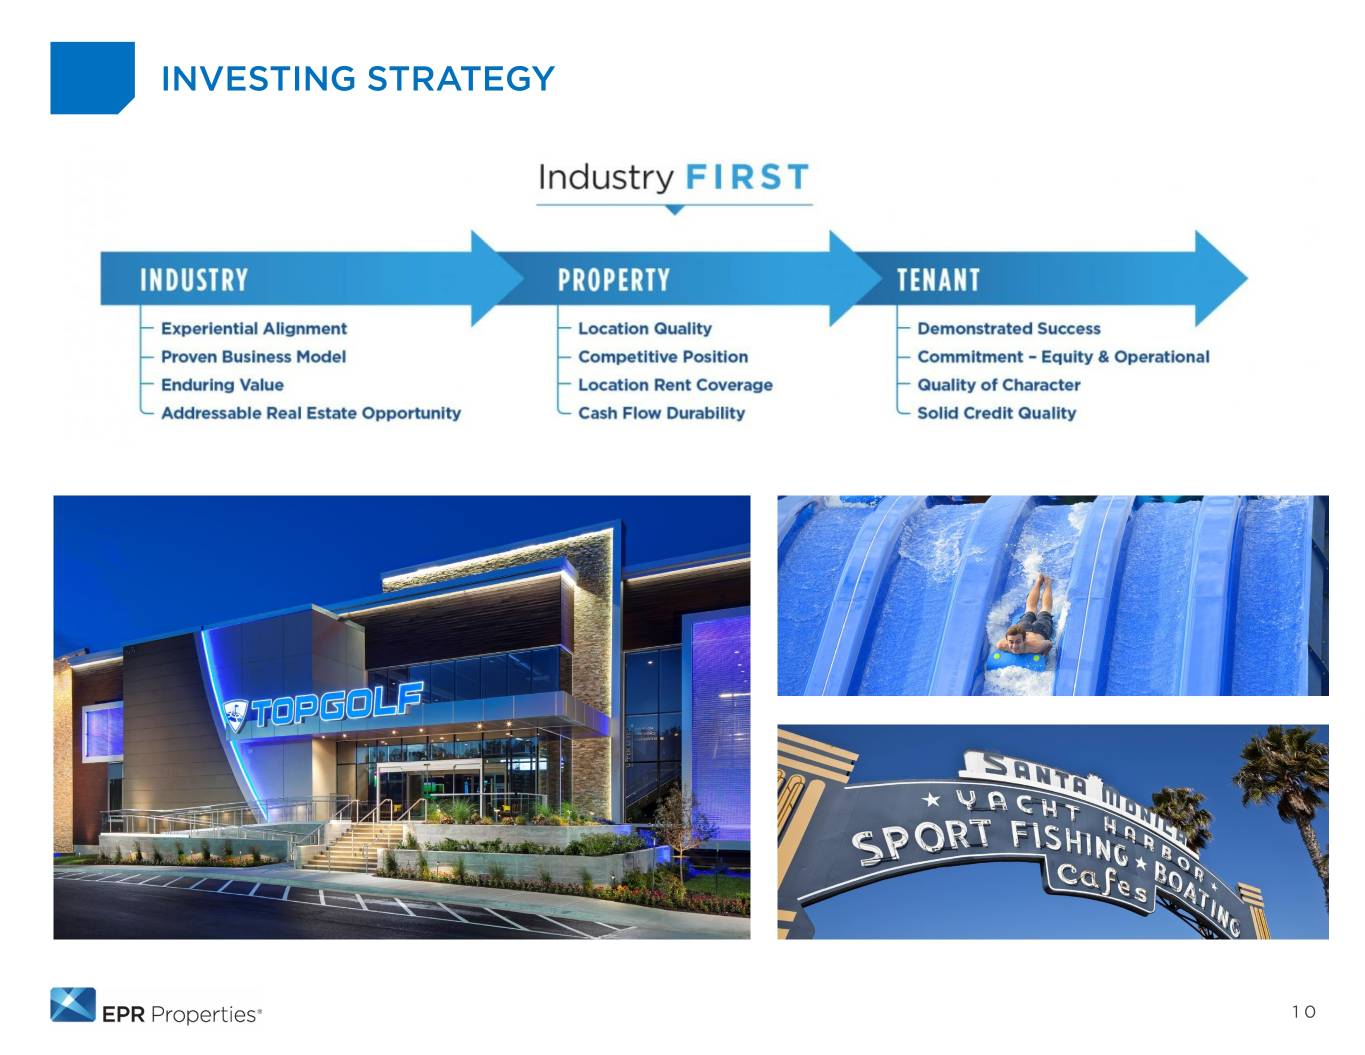
INVESTING STRATEGY 10
FINANCIAL REVIEW 11
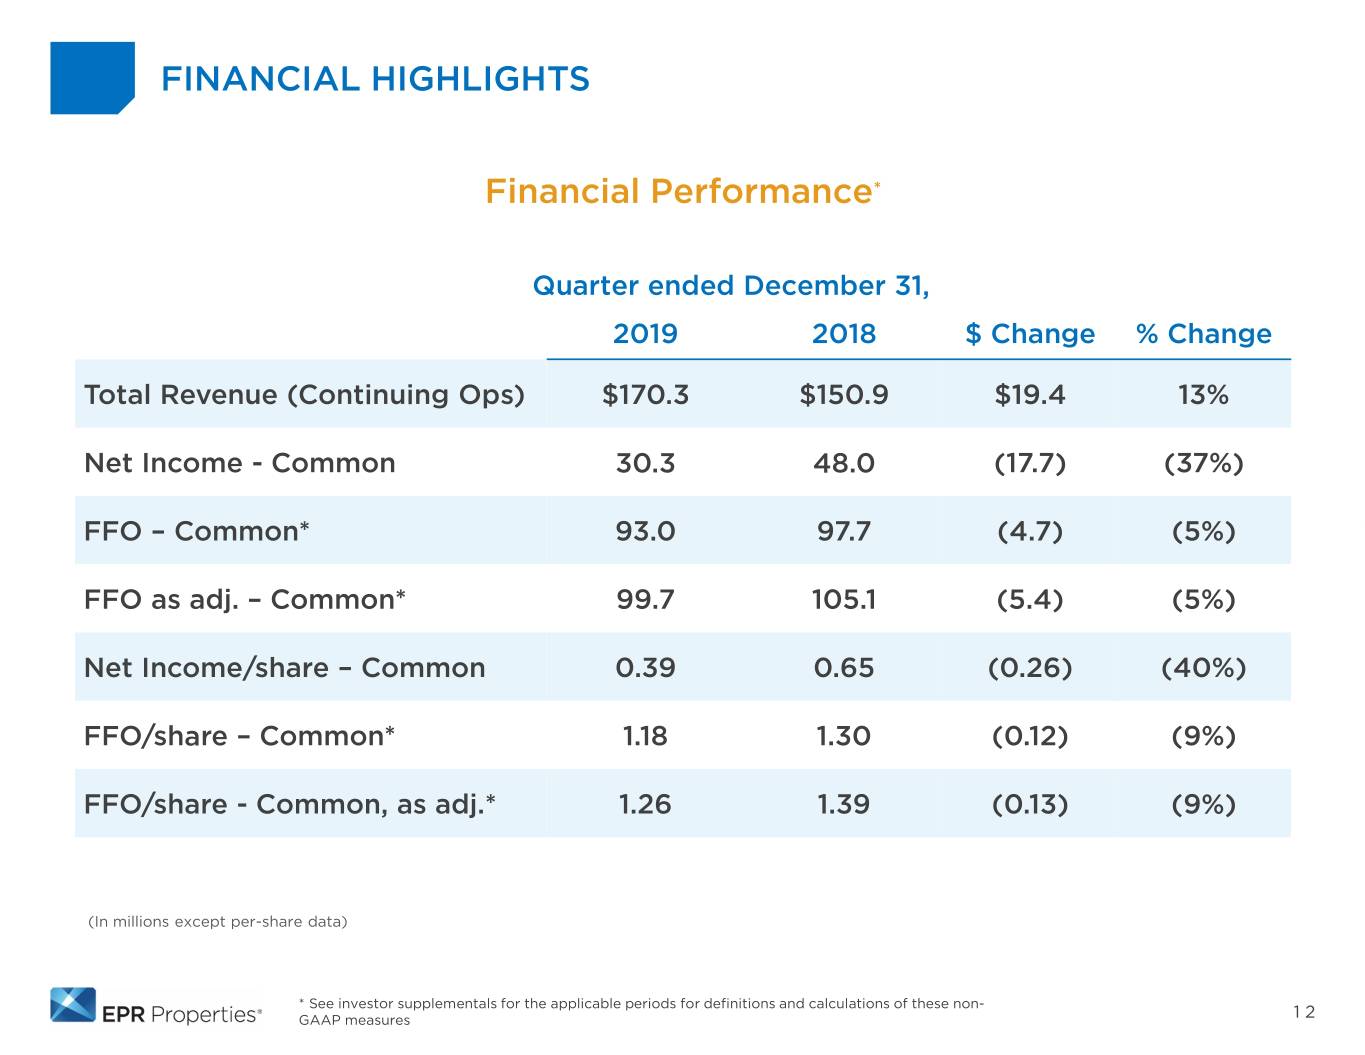
FINANCIAL HIGHLIGHTS Financial Performance* Quarter ended December 31, 2019 2018 $ Change % Change Total Revenue (Continuing Ops) $170.3 $150.9 $19.4 13% Net Income - Common 30.3 48.0 (17.7) (37%) FFO – Common* 93.0 97.7 (4.7) (5%) FFO as adj. – Common* 99.7 105.1 (5.4) (5%) Net Income/share – Common 0.39 0.65 (0.26) (40%) FFO/share – Common* 1.18 1.30 (0.12) (9%) FFO/share - Common, as adj.* 1.26 1.39 (0.13) (9%) (In millions except per-share data) * See investor supplementals for the applicable periods for definitions and calculations of these non- GAAP measures 12
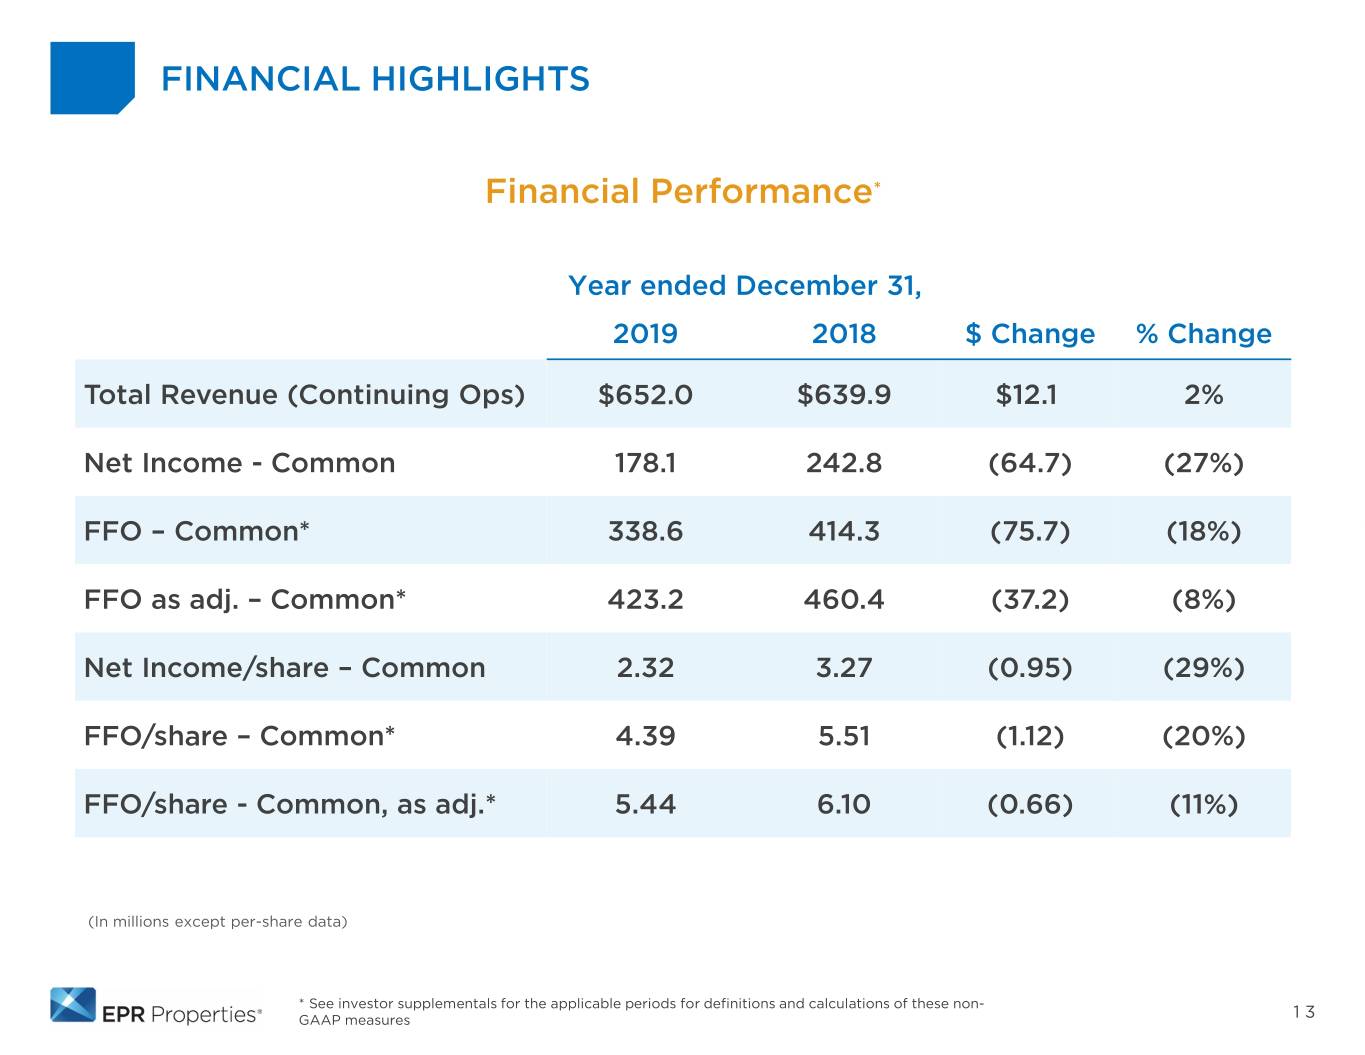
FINANCIAL HIGHLIGHTS Financial Performance* Year ended December 31, 2019 2018 $ Change % Change Total Revenue (Continuing Ops) $652.0 $639.9 $12.1 2% Net Income - Common 178.1 242.8 (64.7) (27%) FFO – Common* 338.6 414.3 (75.7) (18%) FFO as adj. – Common* 423.2 460.4 (37.2) (8%) Net Income/share – Common 2.32 3.27 (0.95) (29%) FFO/share – Common* 4.39 5.51 (1.12) (20%) FFO/share - Common, as adj.* 5.44 6.10 (0.66) (11%) (In millions except per-share data) * See investor supplementals for the applicable periods for definitions and calculations of these non- GAAP measures 13
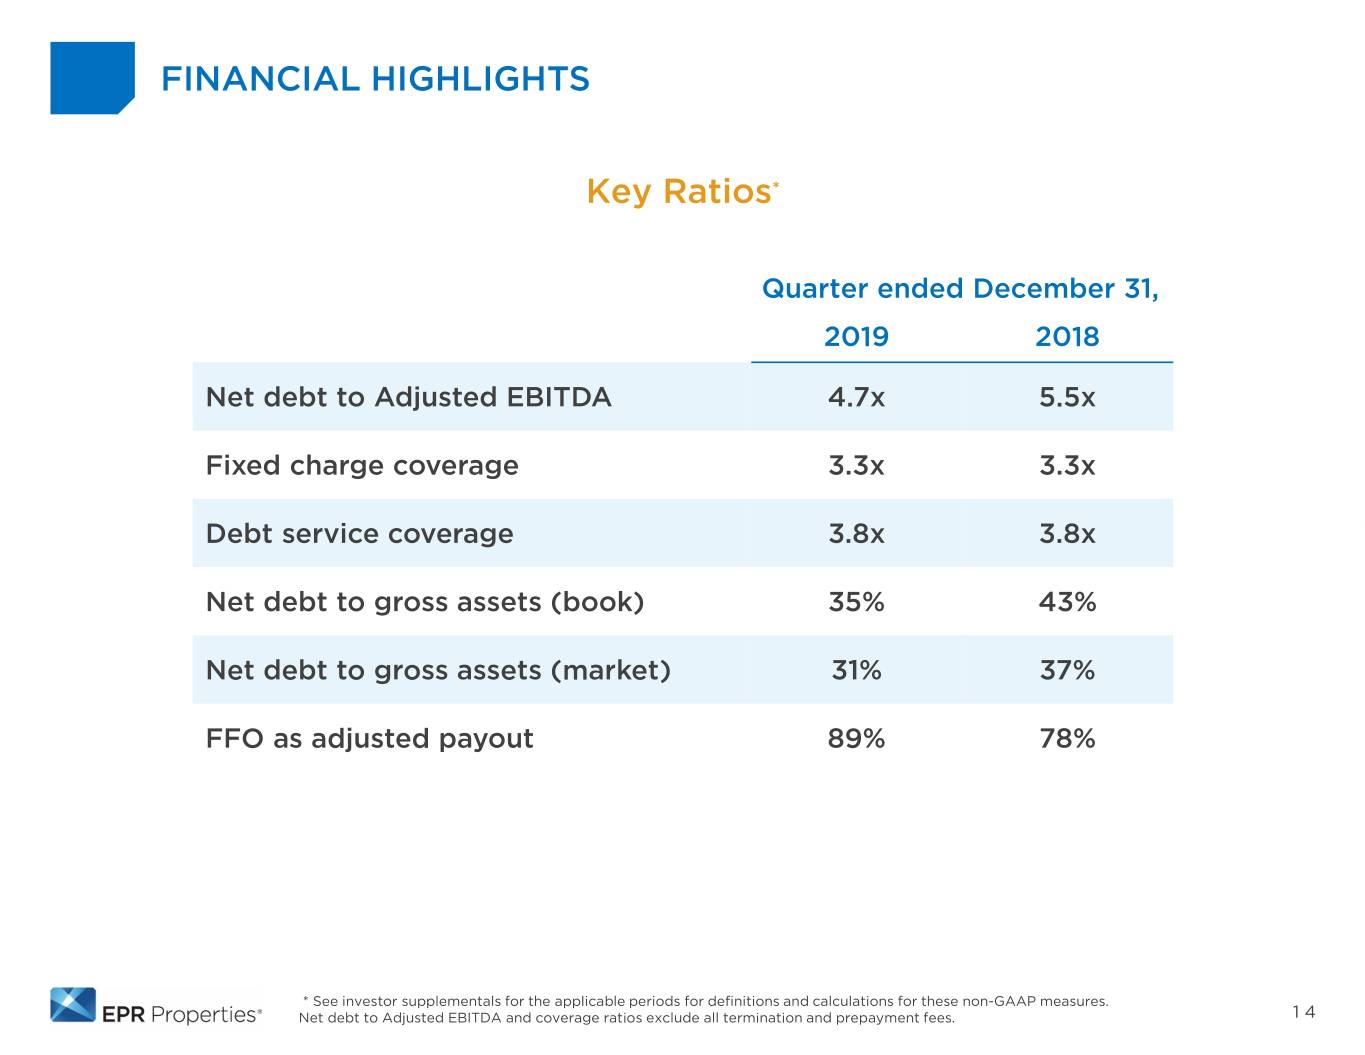
FINANCIAL HIGHLIGHTS Key Ratios* Quarter ended December 31, 2019 2018 Net debt to Adjusted EBITDA 4.7x 5.5x Fixed charge coverage 3.3x 3.3x Debt service coverage 3.8x 3.8x Net debt to gross assets (book) 35% 43% Net debt to gross assets (market) 31% 37% FFO as adjusted payout 89% 78% * See investor supplementals for the applicable periods for definitions and calculations for these non-GAAP measures. Net debt to Adjusted EBITDA and coverage ratios exclude all termination and prepayment fees. 14
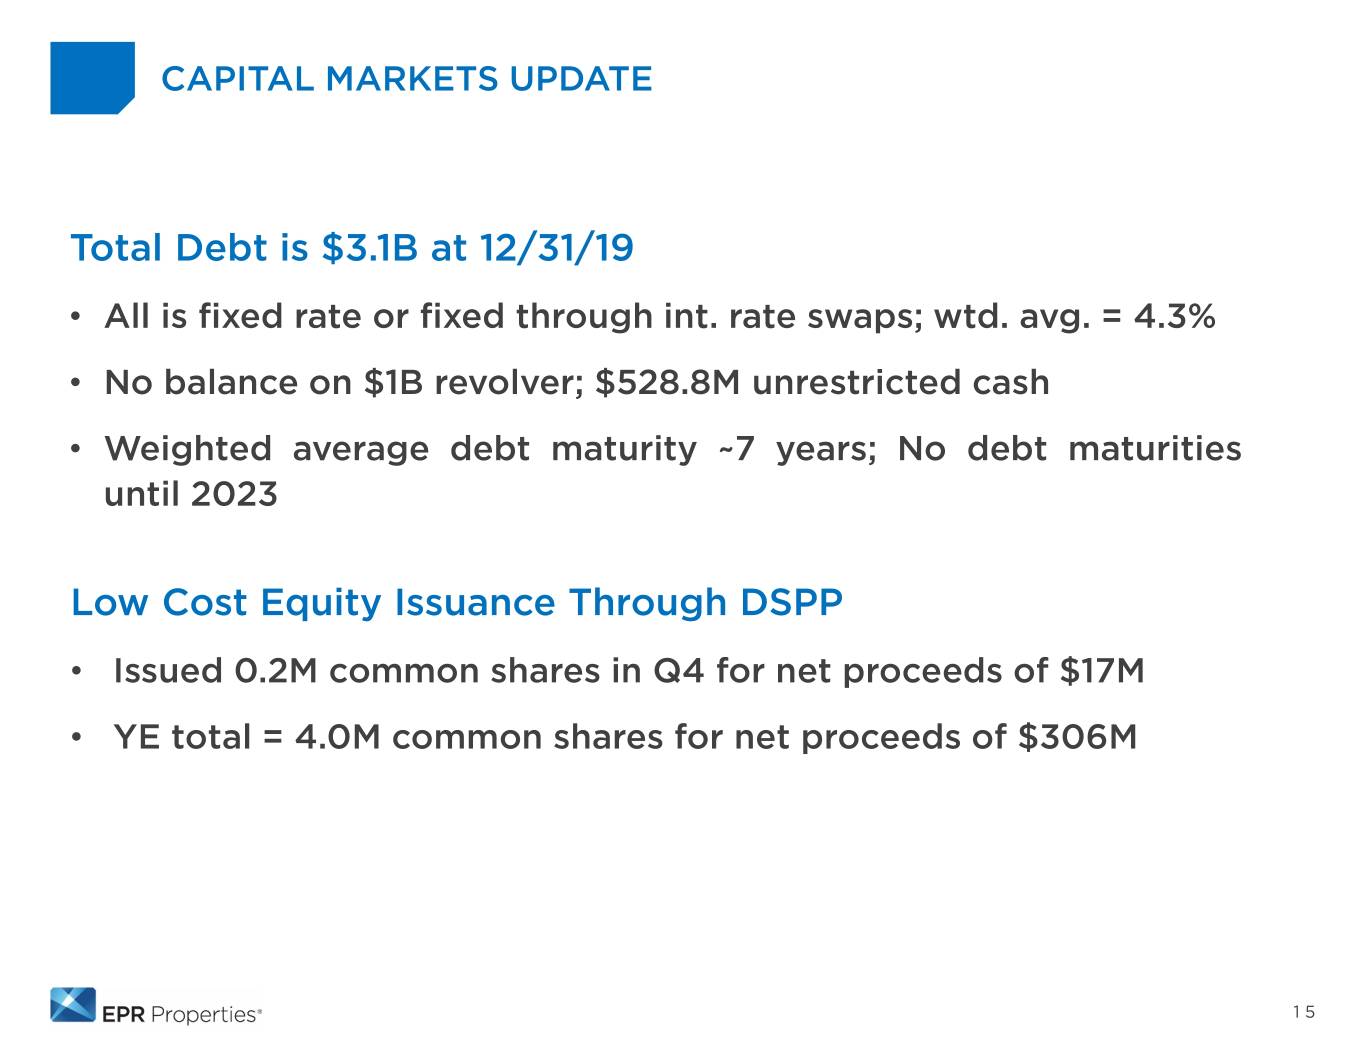
CAPITAL MARKETS UPDATE Total Debt is $3.1B at 12/31/19 • All is fixed rate or fixed through int. rate swaps; wtd. avg. = 4.3% • No balance on $1B revolver; $528.8M unrestricted cash • Weighted average debt maturity ~7 years; No debt maturities until 2023 Low Cost Equity Issuance Through DSPP • Issued 0.2M common shares in Q4 for net proceeds of $17M • YE total = 4.0M common shares for net proceeds of $306M 15
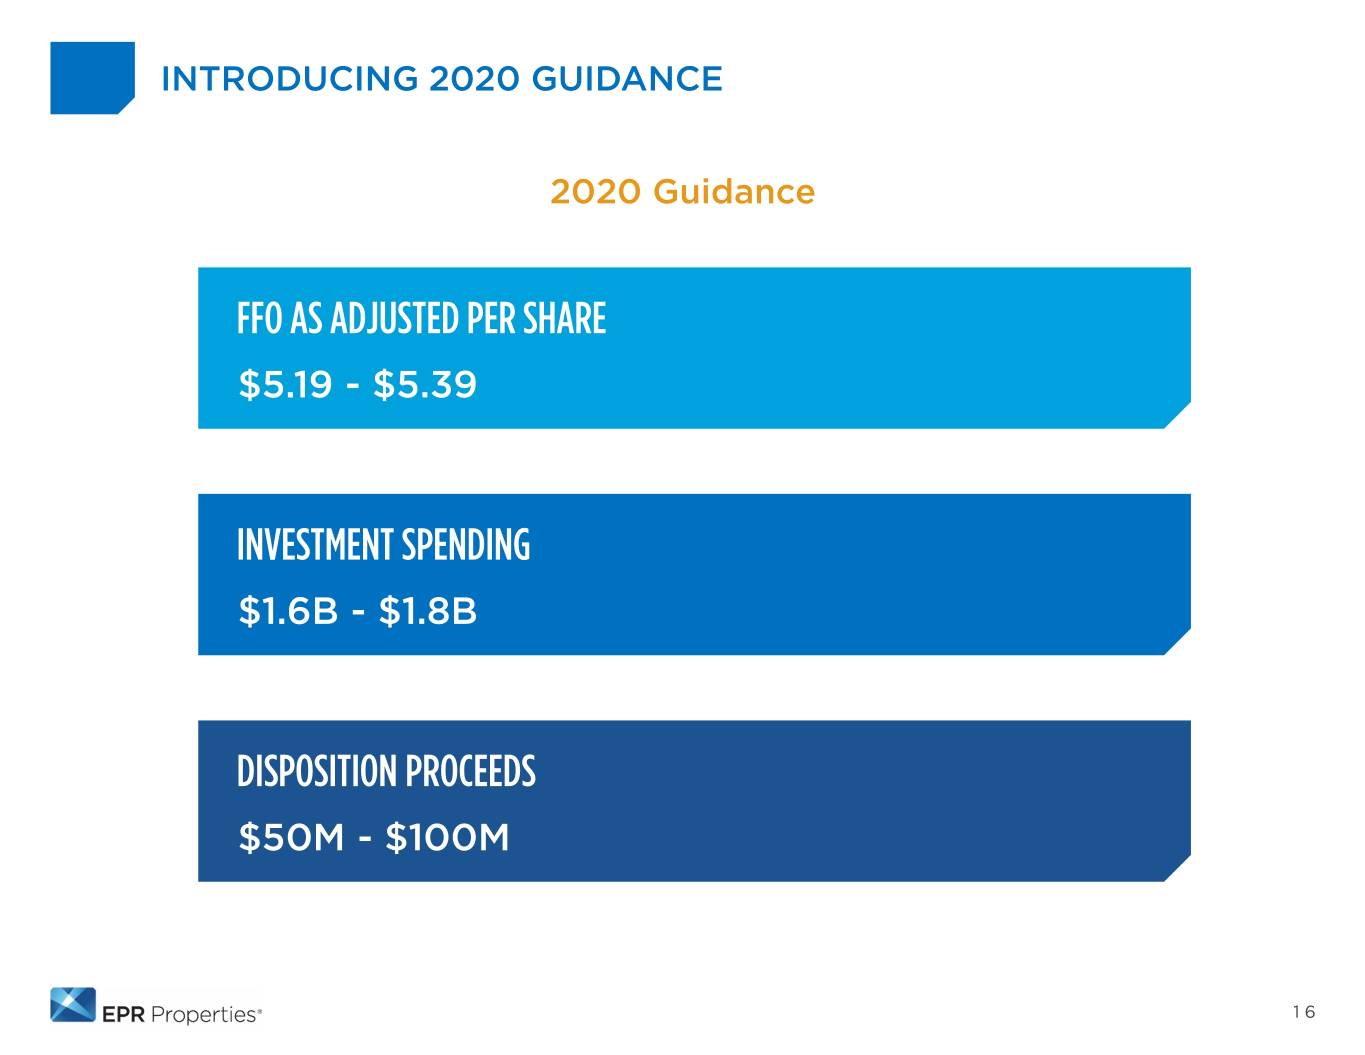
INTRODUCING 2020 GUIDANCE 2020 Guidance FFO AS ADJUSTED PER SHARE $5.19 - $5.39 INVESTMENT SPENDING $1.6B - $1.8B DISPOSITION PROCEEDS $50M - $100M 16
CLOSING COMMENTS 17

EPR Properties 909 Walnut Street, Suite 200 Kansas City, MO 64106 www.eprkc.com 816-472-1700 info@eprkc.com


