UNITED STATES
SECURITIES AND EXCHANGE COMMISSION
WASHINGTON, D.C. 20549
FORM N-CSR
CERTIFIED SHAREHOLDER REPORT OF REGISTERED
MANAGEMENT INVESTMENT COMPANIES
811-08411
(Investment Company Act file number)
James Advantage Funds
(Exact name of registrant as specified in charter)
1349 Fairground Road
Beavercreek, Ohio 45385
(Address of principal executive offices) (Zip code)
Barry R. James
P.O. Box 8
Alpha, Ohio 45301
(Name and address of agent for service)
Registrant’s telephone number, including area code: (937) 426-7640
Date of fiscal year end: June 30
Date of reporting period: July 1, 2012 – June 30, 2013
Item 1. Reports to Stockholders.
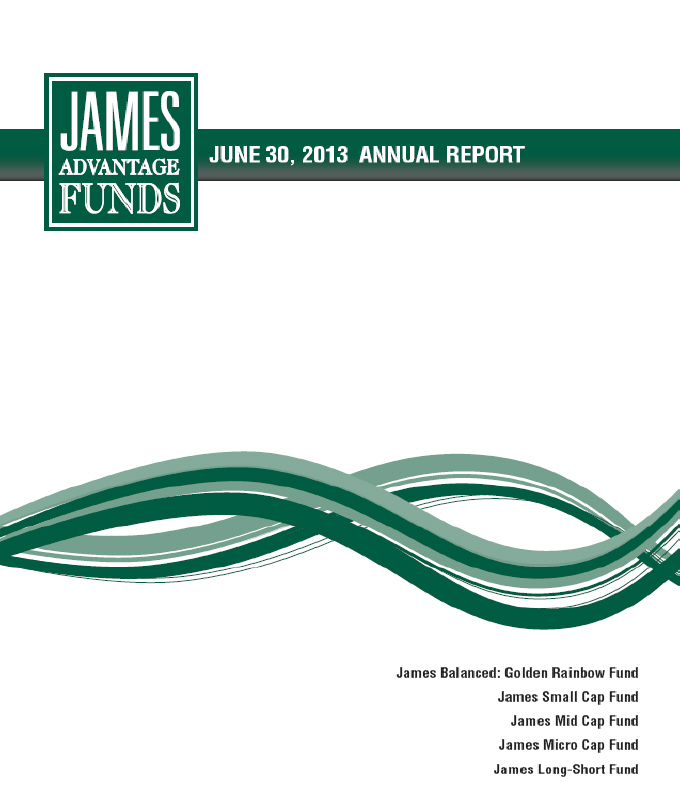
TABLE OF CONTENTS
| | |
| James Advantage Funds | | Shareholder Letter |
| | June 30, 2013 (Unaudited) |
Once again, I would like to thank you for helping us achieve another major milestone. This past year the James Balanced: Golden Rainbow Fund crossed the threshold of $2.0 billion in assets. As you know, this fund, as well as the James Small Cap Fund, received recognition from US News and World Report. The good news on the Golden Rainbow Fund is the higher assets have led to a drop in fees. The advisory fee rate has dropped for assets in excess of $500 million, $1 billion and now $2 billion.
In spite of worries about the US Presidential election, the fiscal cliff, sequestration and the possible end of Quantitative Easing, the US stock market made advances to record highs. At the same time, bonds, commodities and emerging market investments struggled. Here is this year’s Annual Report to the James Advantage Funds’ shareholders.
The Market Over the Past Year
Commonly used as a barometer of the stock market, the S&P 500 rose by 20.60% over the twelve months ended June 30, 2013, an exceptional year. The Dow Jones Industrials rose a little less, 18.87%, while smaller capitalization stocks, represented by the Russell 2000, rose an amazing 24.21%.
It was a pretty good year for Healthcare Facility stocks, Oil and Gas Refiner stocks and Automobile Manufacturer stocks. Education Service, Gold and Computer Hardware stocks didn’t do very well.
The bond market started the fiscal year strong but faded. Longer bonds took a significant tumble starting in April, as worries about the end of the Fed’s bond buying and the recent run up in stock prices brought about selling. The Barclay’s Intermediate Gov/Credit Index, a broad measure of high grade U.S. fixed income securities, only rose 0.28%. Longer term bonds fell, with the Barclay’s Long Gov/Credit Index actually losing 4.69%.
Investment Goals and Objectives
James Investment Research has a long history of value investing and we do not drift from our style because the markets are temporarily moving in one direction or another. We believe that value investing will outperform over the long run and that value stocks will hold up better than growth or speculative stocks in difficult markets.
The objectives of our Funds are stated in the Prospectus, and each Fund has a benchmark that the portfolio management team strives to beat. This is not always going to happen, but if we can outperform over the long run without deviating from our stated objectives and style, we believe we will be serving our shareholders well.
Investment Philosophy
We believe our research team is among the best in the business. We have a very sophisticated process that is both quantitative and qualitative. We have an investment committee that adds wisdom and experience to the quantitative work, and we have evolved a process that we believe is unparalleled in our profession. However, all this is built on a strong foundation of value investing. Our modeling and our fundamental analysis is premised on our conclusion that the preponderance of evidence shows value stocks outperform growth stocks over the long run.
Our strategy is premised on preserving capital in declining markets. The execution of this strategy includes holding undervalued stocks, which we call value stocks. We believe this strategy can provide consistent returns that will, over the long run, outperform the Funds’ benchmarks.
Fund Performance
The James Balanced: Golden Rainbow Fund Retail Class shares rose 9.98% over the twelve months ended June 30, 2013. Its benchmark, a blended index comprised of the Russell 2000 Index, the S&P 500 Index and the Barclays Intermediate Government/Credit Bond Index, rose by 10.93%. The Fund lagged its benchmark slightly as the bond holdings reduced the strong performance of the stock holdings. We did increase equity holdings after the Presidential election and later trimmed them in May and June after the strong stock market advance. Unfortunately, bonds fell during the latter part of the year and this diminished performance.
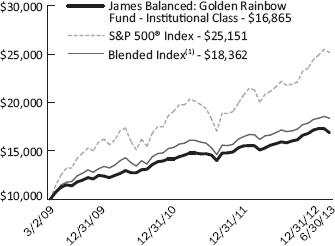
The James Small Cap Fund rose nicely, advancing 22.51% over the fiscal year versus a rise of 24.21% for the Russell 2000, its benchmark. Value oriented small cap stocks did well and the portfolio was helped by investments in Energy, Industrial and Technology stocks. Its REITs and Utility stocks rose in value but were laggards. The portfolio’s cash position, about 6 to 7% of assets for most of the year, was the major reason for the Fund’s underperformance relative to its benchmark.
The James Mid Cap Fund rose 21.68%, while its benchmark, the S&P 400 Mid Cap Value Index, rose 27.03%. All major industry sectors rose, but the fund was particularly aided by holdings in Consumer Non-Cyclical and Industrial stocks. The largest contributors to the fund lagging its benchmark
| | |
| | |
| Annual Report | June 30, 2013 | | 1 |
| | |
| Shareholder Letter | | James Advantage Funds |
June 30, 2013 (Unaudited) | | |
were lower returns in Dollar Tree, Stone Energy and Delek (all sold) and the fact the fund held its cash position between 5 and 7% of assets for most of the year.
The James Micro Cap Fund rose 20.64%, while its benchmark, the Russell Micro Cap Index rose 25.38%. This fund focuses on companies that are less than $250 million in size. The fund had excellent results in the Finance and Industrial sectors, but lagging performance in several securities in other sectors, as well as its cash position, about 7% of assets for most of the year, were the major reasons for the Fund’s underperformance relative to its benchmark.
The James Long/Short Fund rose 17.67%, while its benchmark, the S&P 500, rose 20.60%. This fund seeks to take advantage of volatile markets through the use of some leverage and some shorting of overpriced stocks. Given the Fund’s ability to leverage itself, to hold bonds, and to short securities, investors should not expect a tight correlation to the S&P 500. The Fund lagged its benchmark because we had some stocks which were sold short in a rapidly rising stock market and because the Fund’s cash position throughout the year was a drag on performance.
Please see the following charts for longer term comparisons for all our funds.
Expectations for the Future
After crossing many apparent hurdles, the stock market hit new highs and investor sentiment has followed the trend. Today we find many more bulls than bears, and a number of research teams are calling for yet more new highs. Investors are shifting from bonds and cash into equities, and signs of enthusiasm are abundant. In addition, many may have “missed” the market rally from its lows in 2009, and want to join in on the market advance.
However, pitfalls appear to have cropped up in a number of areas. Emerging markets, commodities and bonds have all experienced some significant corrections. Getting investors to take more risk seems to have been the goal of the Federal Reserve with its Quantitative Easing policy, but it is also putting more volatility into prices of all investments. As a result, many are facing a conundrum of how to invest.
Getting back to basics, the economy doesn’t look to make rapid gains. New regulations, higher taxes, weaker exports and a higher dollar all point to sluggish domestic growth. However, gains in housing and automobile sales have been encouraging and bring support in other areas of the economy. Still, consumers are not spending robustly and the job market is not creating a great deal of confidence. This doesn’t lead us to believe a major upturn in earnings is likely.
Bonds appear to be working through a transition period of low rates. We can expect volatility in bond prices, and a moderate approach to bonds is prudent. Stocks are not at the bargain levels they were in 2009 and may experience a correction in spite of their good recent progress. It makes sense to take a moderate approach to equity levels at this time as well. Nonetheless, we are optimistic and look forward to opportunities to add to equity levels in the future.

Barry R. James, CFA, CIC
President
You should carefully consider the investment objectives, potential risks, management fees, and charges and expenses of a Fund before investing. The Funds’ prospectuses contain this and other information. You may obtain a current copy of a Fund’s prospectus by calling 1-800-995-2637.
Past performance is no guarantee of future results. The investment return and principal value of an investment in any Fund will fluctuate so that an investor’s shares, when redeemed, may be worth more or less than their original cost.
Barry R. James is a registered representative of ALPS Distributors, Inc.
CFA® is a trademark owned by the CFA Institute.
The Dow Jones Industrial Average is a price-weighted overage of 30 actively traded Blue-Chip stocks.
| | |
| James Advantage Funds | | Growth of $10,000 Charts |
| | June 30, 2013 (Unaudited) |
Comparison of the Change in Value of a $10,000 Investment in the James Balanced: Golden Rainbow Fund – Retail Class
James Balanced: Golden Rainbow Fund – Retail, S&P 500® Index and Blended Index Average Annual Total Returns
| | | | | | | | |
| | | 1 Year | | 5
Years | | 10
Years | | Since
Inception(2) |
James Balanced: Golden
Rainbow – Retail Class | | 9.98% | | 6.61% | | 7.97% | | 8.26% |
S&P 500® Index | | 20.60% | | 7.01% | | 7.30% | | 9.00% |
Russell 2000® Index | | 24.21% | | 8.77% | | 9.53% | | 9.84% |
Barclays Capital Intermediate
Government/Credit Index | | 0.28% | | 4.57% | | 4.03% | | 6.01% |
Blended Index(1) | | 10.93% | | 6.87% | | 6.65% | | 8.16% |
| (1) | The Blended Index is comprised of a 25% weighting in the S&P 500® Index, a 25% weighting in the Russell 2000® Index and a 50% weighting in the Barclays Capital Intermediate Government/Credit Index. |
| (2) | Fund inception was July 1, 1991. |
The total annual operating expense ratio as stated in the fee table of the most recent prospectus, dated November 1, 2012, was 1.07%.
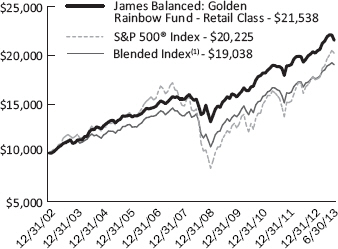
Comparison of the Change in Value of a $10,000 Investment in the James Balanced: Golden Rainbow Fund – Institutional Class
James Balanced: Golden Rainbow Fund – Institutional, S&P 500® Index and Blended Index Average Annual Total Returns
| | | | | | | | |
| | | 1 Year | | 5
Years | | 10
Years | | Since
Inception(2) |
James Balanced: Golden
Rainbow - Institutional Class | | 10.26% | | N/A | | N/A | | 12.83% |
S&P 500® Index | | 20.60% | | N/A | | N/A | | 23.75% |
Russell 2000® Index | | 24.21% | | N/A | | N/A | | 27.09% |
Barclays Capital Intermediate
Government/Credit Index | | 0.28% | | N/A | | N/A | | 4.58% |
Blended Index(1) | | 10.93% | | N/A | | N/A | | 15.07% |
| (1) | The Blended Index is comprised of a 25% weighting in the S&P 500® Index, a 25% weighting in the Russell 2000® Index and a 50% weighting in the Barclays Capital Intermediate Government/Credit Index. |
| (2) | Fund inception was March 2, 2009. |
The total annual operating expense ratio as stated in the fee table of the most recent prospectus, dated November 1, 2012, was 0.82%.
Past performance does not guarantee future results. The performance data quoted represents past performance and current returns may be lower or higher. The investment return and principal value will fluctuate so that an investor’s shares, when redeemed, may be worth more or less than the original cost. These performance figures do not reflect the deduction of taxes that a shareholder would pay on Fund distributions or the redemption of Fund shares. Please call 1-800-995-2637 for most recent month-end performance information.
The S&P 500® Index is an unmanaged index of 500 common stocks chosen for market size, liquidity and industry group representation.
The Russell 2000® Index is a widely recognized, unmanaged index comprised of the 2,000 smallest U.S. domiciled publicly-traded common stocks of the Russell 3000® Index, which represents approximately 8% of the total market capitalization of the Russell 3000® Index, an unmanaged index of the 3,000 largest U.S. domiciled publicly-traded common stocks by market capitalization.
The Barclays Capital Intermediate Government/Credit Index measures the performance of U.S. Dollar denominated U.S. Treasuries, government-related and investment grade U.S. corporate securities that have a remaining maturity of greater than one year and less than ten years.
The S&P 500® Index, Russell 2000® Index, Barclays Capital Intermediate Government/Credit Index, S&P Mid Cap 400® Index, and Russell Microcap® Index are widely recognized unmanaged indices of security prices and are representative of a broader market and range of securities than is found in the Fund’s portfolio. The Index returns do not reflect the deduction of expenses, which have been deducted from a Fund’s returns. The Index returns assume reinvestment of all distributions and do not reflect the deduction of taxes and fees. Individuals cannot invest directly in any Index; however, an individual can invest in exchange traded funds or other investment vehicles that attempt to track the performance of a benchmark index.
| | |
| | | |
| Annual Report | June 30, 2013 | | 3 |
| | |
| Growth of $10,000 Charts | | James Advantage Funds |
June 30, 2013 (Unaudited) | | |
Comparison of the Change in Value of a $10,000 Investment in the James Small Cap Fund
James Small Cap Fund and Russell 2000® Index Average Annual Total Returns
| | | | | | | | |
| | | 1 Year | | 5 Years | | 10 Years | | Since
Inception(1) |
James Small Cap Fund | | 22.51% | | 8.05% | | 9.16% | | 8.35% |
Russell 2000® Value
TR Index | | 24.77% | | 8.59% | | 9.30% | | 9.61% |
Russell 2000® TR | | 24.21% | | 8.77% | | 9.53% | | 8.64% |
| (1) | Fund inception was October 2, 1998. |
The total annual operating expense ratio as stated in the fee table of the most recent prospectus, dated November 1, 2012, was 1.50%.
Comparison of the Change in Value of a $10,000 Investment in the James Mid Cap Fund
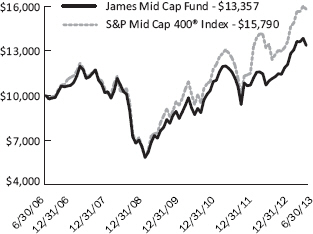
James Mid Cap Fund and S&P Mid Cap 400® Index Average Annual Total Returns
| | | | | | |
| | | 1 Year | | 5 Year | | Since
Inception(1) |
James Mid Cap Fund | | 21.68% | | 4.48% | | 4.22% |
S&P MidCap 400® Index | | 27.03% | | 8.94% | | 6.74% |
| (1) | Fund inception was June 30, 2006. |
The total annual operating expense ratio as stated in the fee table of the most recent prospectus, dated November 1, 2012, was 1.51%.
Past performance does not guarantee future results. The performance data quoted represents past performance and current returns may be lower or higher. The investment return and principal value will fluctuate so that an investor’s shares, when redeemed, may be worth more or less than the original cost. These performance figures do not reflect the deduction of taxes that a shareholder would pay on Fund distributions or the redemption of Fund shares. Please call 1-800-995-2637 for most recent month-end performance information.
Mid, Small and Micro Cap investing involve greater risk not associated with investing in more established companies, such as greater price volatility, business risk, less liquidity and increased competitive threat.
The Mid-Cap Fund invests in stocks of mid-cap companies which tend to be more volatile and can be less liquid than stocks of large-cap companies. Diversification does not guarantee a profit or protect against loss. Current and future portfolio holdings are subject to risk.
The Russell 2000® Value Index is a widely recognized, unmanaged index that measures the performance of those Russell 2000® Index companies with lower price-to-book ratios and lower forecasted growth values.
The Russell 2000® Index is a widely recognized, unmanaged index comprised of the 2,000 smallest U.S. domiciled publicly-traded common stocks of the Russell 3000® Index, which represents approximately 8% of the total market capitalization of the Russell 3000® Index, an unmanaged index of the 3,000 largest U.S. domiciled publicly-traded common stocks by market capitalization.
The S&P MidCap 400® Value Index is a recognized, unmanaged index of mid cap stocks considered to be value stocks using Standard and Poor’s methodology.
The S&P 500® Index, Russell 2000® Index, Barclays Capital Intermediate Government/Credit Index, S&P MidCap 400® Index, and Russell Microcap® Index are widely recognized unmanaged indices of security prices and are representative of a broader market and range of securities than is found in the Fund’s portfolio. The Index returns do not reflect the deduction of expenses, which have been deducted from a Fund’s returns. The Index returns assume reinvestment of all distributions and do not reflect the deduction of taxes and fees. Individuals cannot invest directly in any Index; however, an individual can invest in exchange traded funds or other investment vehicles that attempt to track the performance of a benchmark index.
| | |
| James Advantage Funds | | Growth of $10,000 Charts |
| | June 30, 2013 (Unaudited) |
Comparison of the Change in Value of a $10,000 Investment in the James Micro Cap Fund
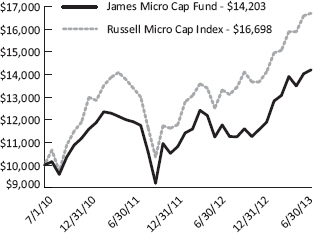
James Micro Cap Fund and Russell Microcap® Index Average Annual Total Returns
| | | | |
| | | 1 Year | | Since
Inception(1) |
James Micro Cap Fund | | 20.64% | | 12.42% |
Russell Microcap® Index | | 25.38% | | 18.66% |
| (1) | Fund inception was July 1, 2010. |
The total annual operating expense ratio as stated in the fee table of the most recent prospectus, dated November 1, 2012 was 1.50%.
Comparison of the Change in Value of a $10,000 Investment in the James Long-Short Fund
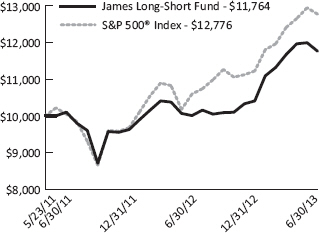
James Long-Short Fund and S&P 500® Index Average Annual Total Returns
| | | | |
| | | 1 Year | | Since
Inception(1) |
James Long-Short Fund | | 17.67% | | 8.07% |
S&P 500® Index | | 20.60% | | 12.35% |
| (1) | Fund inception was May 23, 2011. |
The total annual operating expense ratio as stated in the fee table of the most recent prospectus, dated November 1, 2012, was 2.67%.
Past performance does not guarantee future results. The performance data quoted represents past performance and current returns may be lower or higher. The investment return and principal value will fluctuate so that an investor’s shares, when redeemed, may be worth more or less than the original cost. These performance figures do not reflect the deduction of taxes that a shareholder would pay on Fund distributions or the redemption of Fund shares. Please call 1-800-995-2637 for most recent month-end performance information.
Mid, Small and Micro Cap investing involve greater risk not associated with investing in more established companies, such as greater price volatility, business risk, less liquidity and increased competitive threat.
Short selling incurs significant additional risk; theoretically, stocks sold short have unlimited upside risk potential. In addition, this strategy depends on the Adviser’s ability to correctly identify undervalued and overvalued stocks, and that the stock markets are reasonable and efficient. Periods of extreme volatility may harm the performance of this product. The Long-Short Fund may have a high portfolio turnover rate. A high portfolio turnover rate can result in increased brokerage commission costs and may expose taxable shareholders to potentially larger current tax liability.
The Russell Microcap® Index measures the performance of the microcap segment of the U.S. equity market. It makes up less than 3% of the U.S. equity market. It includes 1,000 of the smallest securities in the small cap Russell 2000® Index, plus the next smallest eligible securities by market cap.
The S&P 500® Index is an unmanaged index of 500 common stocks chosen for market size, liquidity and industry group representation.
The S&P 500® Index, Russell 2000® Index, Barclays Capital Intermediate Government/Credit Index, S&P MidCap 400® Index, and Russell Microcap® Index are widely recognized unmanaged indices of security prices and are representative of a broader market and range of securities than is found in the Fund’s portfolio. The Index returns do not reflect the deduction of expenses, which have been deducted from a Fund’s returns. The Index returns assume reinvestment of all distributions and do not reflect the deduction of taxes and fees. Individuals cannot invest directly in any Index; however, an individual can invest in exchange traded funds or other investment vehicles that attempt to track the performance of a benchmark index.
| | |
| | | |
| Annual Report | June 30, 2013 | | 5 |
| | |
| Representation of Schedules of Investments | | James Advantage Funds |
June 30, 2013 (Unaudited) | | |
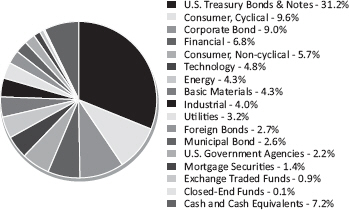
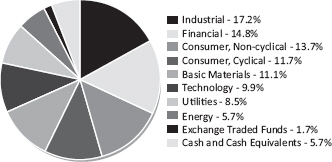
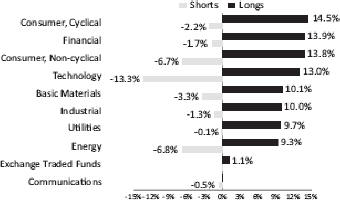
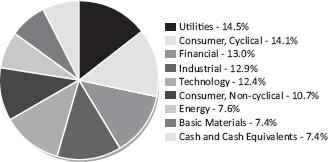
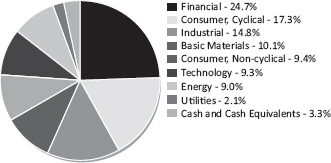
The illustrations below provide the industry sectors for the James Balanced: Golden Rainbow Fund, James Small Cap Fund, James Mid Cap Fund, James Micro Cap Fund, and James Long-Short Fund.
James Balanced: Golden Rainbow Fund - Industry Sector Allocation (% of Net Assets)
James Mid Cap Fund - Industry Sector Allocation
(% of Net Assets)
James Long-Short Fund - Industry Sector Allocation
(% of Net Assets)
(Cash and Cash Equivalents and Other Liabilities in Excess of Assets not included)
James Small Cap Fund - Industry Sector Allocation
(% of Net Assets)
James Micro Cap Fund - Industry Sector Allocation
(% of Net Assets)
| | |
| James Advantage Funds | | Disclosure of Fund Expenses |
| | June 30, 2013 (Unaudited) |
Example. As a shareholder of a Fund, you incur two types of costs: (1) transaction costs, including reinvested dividends or other distributions, and redemption fees; and (2) ongoing costs, including management fees, distribution (12b-1) fees, and other Fund expenses. This example is intended to help you understand your ongoing costs (in dollars) of investing in the Funds and to compare these costs with the ongoing costs of investing in other mutual funds.
The example is based on an investment of $1,000 invested at the beginning of the period and held for the entire period January 1, 2013 through June 30, 2013.
Actual Expenses. The first line of the table below provides information about actual account values and actual expenses. You may use the information in this line, together with the amount you invested, to estimate the expenses that you paid over the period. Simply divide your account value by $1,000 (for example, an $8,600 account value divided by $1,000 = 8.6), then multiply the result by the number in the first line under the heading “Expense Paid During Period” to estimate the expenses you paid on your account during this period.
Hypothetical Example for Comparison Purposes. The second line of the table below provides information about hypothetical account values and hypothetical expenses based on a Fund’s actual expense ratio and an assumed rate of return of 5% per year before expenses, which is not the Fund’s actual returns. The hypothetical account values and expenses may not be used to estimate the actual ending account balance or expenses you paid for the period. You may use this information to compare the ongoing costs of investing in a Fund and other mutual funds. To do so, compare this 5% hypothetical example with the 5% hypothetical examples that appear in the shareholder reports of the other funds.
Please note that expenses shown in the table are meant to highlight and help you compare ongoing costs only. The calculations assume no shares were bought or sold during the period. Your actual costs may have been higher or lower, depending on the amount of your investment and the timing of any purchases or redemptions.
| | | | | | | | | | | | | | | | | | | | | | |
| | | Net Expense
Ratio
Annualized
June 30, 2013(a) | | Beginning
Account Value
January 1, 2013 | | Ending
Account Value
June 30, 2013 | | Expense
Paid During
Period(b) | | |
James Balanced: Golden Rainbow Fund | | | | | | | | | | | | | | | | | | |
Retail Class Actual | | | | 1.03 | % | | | $ | 1,000.00 | | | | $ | 1,044.70 | | | | $ | 5.22 | | | |
Retail Class Hypothetical (5% return before expenses) | | | | 1.03 | % | | | $ | 1,000.00 | | | | $ | 1,019.69 | | | | $ | 5.16 | | | |
| | | | | |
Institutional Class Actual | | | | 0.78 | % | | | $ | 1,000.00 | | | | $ | 1,045.60 | | | | $ | 3.96 | | | |
Institutional Class Hypothetical (5% return before expenses) | | | | 0.78 | % | | | $ | 1,000.00 | | | | $ | 1,020.93 | | | | $ | 3.91 | | | |
| | | | | |
James Small Cap Fund | | | | | | | | | | | | | | | | | | | | | | |
Actual | | | | 1.50 | % | | | $ | 1,000.00 | | | | $ | 1,162.70 | | | | $ | 8.04 | | | |
Hypothetical (5% return before expenses) | | | | 1.50 | % | | | $ | 1,000.00 | | | | $ | 1,017.36 | | | | $ | 7.50 | | | |
| | | | | |
James Mid Cap Fund | | | | | | | | | | | | | | | | | | | | | | |
Actual | | | | 1.50 | % | | | $ | 1,000.00 | | | | $ | 1,105.70 | | | | $ | 7.83 | | | |
Hypothetical (5% return before expenses) | | | | 1.50 | % | | | $ | 1,000.00 | | | | $ | 1,017.36 | | | | $ | 7.50 | | | |
| | | | | |
James Micro Cap Fund | | | | | | | | | | | | | | | | | | | | | | |
Actual | | | | 1.50 | % | | | $ | 1,000.00 | | | | $ | 1,194.20 | | | | $ | 8.16 | | | |
Hypothetical (5% return before expenses) | | | | 1.50 | % | | | $ | 1,000.00 | | | | $ | 1,017.36 | | | | $ | 7.50 | | | |
| | | | | |
James Long-Short Fund | | | | | | | | | | | | | | | | | | | | | | |
Actual | | | | 2.63 | %(c) | | | $ | 1,000.00 | | | | $ | 1,130.40 | | | | $ | 13.89 | | | |
Hypothetical (5% return before expenses) | | | | 2.63 | %(c) | | | $ | 1,000.00 | | | | $ | 1,011.75 | | | | $ | 13.12 | | | |
| (a) | Annualized, based on the Fund’s most recent fiscal half year expenses. |
| (b) | Expenses are equal to the Fund’s annualized expense ratio multiplied by the average account value over the period, multiplied by the number of days in the most recent fiscal half year (181), divided by 365. |
| (c) | Dividend and interest expense on securities sold short and interest expense totaled 1.13% (annualized) of average net assets for the six months ended June 30, 2013. |
| | |
| | | |
| Annual Report | June 30, 2013 | | 7 |
| | |
| Schedule of Investments | | James Balanced: Golden Rainbow Fund |
June 30, 2013 | | |
| | | | | | |
| Shares or Principal Amount | | Value | |
COMMON STOCKS-42.7% | | | | |
| | Basic Materials-4.3% | | | | |
| 160,000 | | Barrick Gold Corp. | | | $2,518,400 | |
| 205,000 | | Buckeye Technologies, Inc. | | | 7,593,200 | |
| 112,500 | | CF Industries Holdings, Inc. | | | 19,293,750 | |
| 225,000 | | Cooper Tire & Rubber Co. | | | 7,463,250 | |
| 18,600 | | Eastman Chemical Co. | | | 1,302,186 | |
| 182,000 | | Huntsman Corp. | | | 3,013,920 | |
| 70,000 | | Innospec, Inc. | | | 2,812,600 | |
| 20,000 | | International Paper Co. | | | 886,200 | |
| 55,000 | | Newmont Mining Corp. | | | 1,647,250 | |
| 40,000 | | Olin Corp. | | | 956,800 | |
| 330,000 | | PH Glatfelter Co. | | | 8,283,000 | |
| 269,040 | | PolyOne Corp. | | | 6,666,811 | |
| 161,200 | | PPG Industries, Inc. | | | 23,601,292 | |
| 45,000 | | Terra Nitrogen Co. LP | | | 9,629,550 | |
| 10,500 | | Westlake Chemical Corp. | | | 1,012,305 | |
| 60,000 | | Worthington Industries, Inc. | | | 1,902,600 | |
| | | | | | |
| | | | | 98,583,114 | |
| | | | | | |
| | |
| | Consumer, Cyclical-9.6% | | | | |
| 694,600 | | Alaska Air Group, Inc. | | | 36,119,200 | |
| 14,500 | | CVS Caremark Corp. | | | 829,110 | |
| 203,100 | | Destination Maternity Corp. | | | 4,996,260 | |
| 288,800 | | Dillard’s, Inc., Class A | | | 23,672,936 | |
| 162,700 | | DIRECTV, Class A* | | | 10,025,574 | |
| 150,000 | | Foot Locker, Inc. | | | 5,269,500 | |
| 1,524,165 | | Ford Motor Co. | | | 23,578,832 | |
| 21,000 | | Haverty Furniture Cos., Inc. | | | 483,210 | |
| 40,000 | | LeapFrog Enterprises, Inc.* | | | 393,600 | |
| 25,000 | | Lennar Corp., Class A | | | 901,000 | |
| 627,800 | | Macy’s, Inc. | | | 30,134,400 | |
| 164,600 | | Moody’s Corp. | | | 10,029,078 | |
| 180,000 | | RR Donnelley & Sons Co. | | | 2,521,800 | |
| 740,315 | | Sinclair Broadcast Group, Inc., Class A | | | 21,750,455 | |
| 71,000 | | Southwest Airlines Co. | | | 915,190 | |
| 213,050 | | Target Corp. | | | 14,670,623 | |
| 135,000 | | TJX Cos., Inc. | | | 6,758,100 | |
| 163,500 | | Viacom, Inc., Class A | | | 11,189,940 | |
| 147,000 | | Viacom, Inc., Class B | | | 10,003,350 | |
| 87,000 | | Wal-Mart Stores, Inc. | | | 6,480,630 | |
| | | | | | |
| | | | | 220,722,788 | |
| | | | | | |
| | |
| | Consumer, Non-cyclical-5.7% | | | | |
| 215,500 | | Dean Foods Co.* | | | 2,159,310 | |
| 341,100 | | Eli Lilly & Co. | | | 16,754,832 | |
| 29,000 | | Grand Canyon Education, Inc.* | | | 934,670 | |
| 12,000 | | Hillshire Brands Co. | | | 396,960 | |
| 207,600 | | Ingredion, Inc. | | | 13,622,712 | |
| 272,000 | | Kroger Co. | | | 9,394,880 | |
| 449,200 | | Merck & Co., Inc. | | | 20,865,340 | |
| 608,000 | | Mylan, Inc.* | | | 18,866,240 | |
| 171,000 | | Newell Rubbermaid, Inc. | | | 4,488,750 | |
| 10,500 | | Omnicare, Inc. | | | 500,955 | |
| | |
| See Notes to Financial Statements. | | |
| 8 | | www.jamesfunds.com |
| | |
| James Balanced: Golden Rainbow Fund | | Schedule of Investments |
| | June 30, 2013 |
| | | | | | |
| Shares or Principal Amount | | Value | |
| | Consumer, Non-cyclical (continued) | | | | |
| 599,000 | | Pfizer, Inc. | | | $16,777,990 | |
| 2,850 | | Seaboard Corp. | | | 7,717,800 | |
| 3,000 | | Seneca Foods Corp., Class A* | | | 92,040 | |
| 30,000 | | Tupperware Brands Corp. | | | 2,330,700 | |
| 155,300 | | UnitedHealth Group, Inc. | | | 10,169,044 | |
| 12,000 | | USANA Health Sciences, Inc.* | | | 868,560 | |
| 31,075 | | WellPoint, Inc. | | | 2,543,178 | |
| 80,592 | | WhiteWave Foods Co., Class A* | | | 1,309,620 | |
| 114,779 | | WhiteWave Foods Co., Class B* | | | 1,744,641 | |
| | | | | | |
| | | | | 131,538,222 | |
| | | | | | |
| | |
| | Energy-4.3% | | | | |
| 156,970 | | Chevron Corp. | | | 18,575,830 | |
| 19,000 | | ConocoPhillips | | | 1,149,500 | |
| 110,000 | | Delek US Holdings, Inc. | | | 3,165,800 | |
| 98,300 | | Exxon Mobil Corp. | | | 8,881,405 | |
| 553,044 | | HollyFrontier Corp. | | | 23,659,222 | |
| 93,800 | | Plains All American Pipeline LP | | | 5,234,978 | |
| 552,500 | | Tesoro Corp. | | | 28,906,800 | |
| 248,000 | | Valero Energy Corp. | | | 8,622,960 | |
| | | | | | |
| | | | | 98,196,495 | |
| | | | | | |
| | |
| | Financial-6.8% | | | | |
| 304,000 | | American Financial Group, Inc. | | | 14,868,640 | |
| 170,900 | | AmTrust Financial Services, Inc. | | | 6,101,130 | |
| 301,000 | | Aspen Insurance Holdings, Ltd. | | | 11,164,090 | |
| 243,000 | | Brookfield Office Properties, Inc. | | | 4,053,240 | |
| 340,000 | | CBL & Associates Properties, Inc., REIT | | | 7,282,800 | |
| 1,041,000 | | Fifth Third Bancorp | | | 18,790,050 | |
| 8,600 | | Goldman Sachs Group, Inc. | | | 1,300,750 | |
| 404,250 | | JPMorgan Chase & Co. | | | 21,340,358 | |
| 993,000 | | KeyCorp | | | 10,962,720 | |
| 30,000 | | Montpelier Re Holdings Ltd. | | | 750,300 | |
| 36,000 | | National Financial Partners Corp.* | | | 911,160 | |
| 340,000 | | Nelnet, Inc., Class A | | | 12,270,600 | |
| 10,000 | | PNC Financial Services Group, Inc. | | | 729,200 | |
| 327,870 | | Protective Life Corp. | | | 12,593,487 | |
| 275,000 | | Rent-A-Center, Inc. | | | 10,326,250 | |
| 101,600 | | Torchmark Corp. | | | 6,618,224 | |
| 85,324 | | Travelers Cos., Inc. | | | 6,819,094 | |
| 282,025 | | Unum Group | | | 8,283,074 | |
| | | | | | |
| | | | | 155,165,167 | |
| | | | | | |
| | |
| | Industrial-4.0% | | | | |
| 117,800 | | AMERCO | | | 19,071,820 | |
| 357,000 | | American Axle & Manufacturing Holdings, Inc.* | | | 6,650,910 | |
| 55,000 | | American Railcar Industries, Inc. | | | 1,843,050 | |
| 37,000 | | CNH Global NV | | | 1,541,420 | |
| 20,000 | | Cummins, Inc. | | | 2,169,200 | |
| 7,000 | | Deere & Co. | | | 568,750 | |
| 60,000 | | Eaton Corp. PLC | | | 3,948,600 | |
| 12,600 | | Ingersoll-Rand PLC | | | 699,552 | |
| 180,000 | | Jarden Corp.* | | | 7,875,000 | |
| | |
| See Notes to Financial Statements. | | |
| Annual Report | June 30, 2013 | | 9 |
| | |
| Schedule of Investments | | James Balanced: Golden Rainbow Fund |
June 30, 2013 | | |
| | | | | | |
| Shares or Principal Amount | | Value | |
| | Industrial (continued) | | | | |
| 82,000 | | Magna International, Inc. | | | $5,840,040 | |
| 8,000 | | Republic Services, Inc. | | | 271,520 | |
| 320,000 | | Sturm Ruger & Co., Inc. | | | 15,372,800 | |
| 110,000 | | Timken Co. | | | 6,190,800 | |
| 289,625 | | TRW Automotive Holdings Corp.* | | | 19,242,685 | |
| 11,000 | | United Rentals, Inc.* | | | 549,010 | |
| | | | | | |
| | | | | 91,835,157 | |
| | | | | | |
| | |
| | Technology-4.8% | | | | |
| 36,500 | | Alliant Techsystems, Inc. | | | 3,005,045 | |
| 220,000 | | Amkor Technology, Inc.* | | | 926,200 | |
| 150,000 | | Arrow Electronics, Inc.* | | | 5,977,500 | |
| 165,000 | | Avnet, Inc.* | | | 5,544,000 | |
| 40,000 | | CSG Systems International, Inc.* | | | 868,000 | |
| 511,910 | | Deluxe Corp. | | | 17,737,682 | |
| 17,000 | | Equifax, Inc. | | | 1,001,810 | |
| 230,000 | | Intel Corp. | | | 5,570,600 | |
| 19,500 | | International Business Machines Corp. | | | 3,726,645 | |
| 45,000 | | Intersections, Inc. | | | 394,650 | |
| 280,500 | | Kulicke & Soffa Industries, Inc.* | | | 3,102,330 | |
| 62,000 | | Lexmark International, Inc., Class A | | | 1,895,340 | |
| 27,000 | | Lockheed Martin Corp. | | | 2,928,420 | |
| 112,740 | | Northrop Grumman Corp. | | | 9,334,872 | |
| 100,000 | | PDL BioPharma, Inc. | | | 772,000 | |
| 20,000 | | TE Connectivity, Ltd. | | | 910,800 | |
| 338,840 | | Triumph Group, Inc. | | | 26,819,186 | |
| 308,200 | | Western Digital Corp. | | | 19,136,138 | |
| | | | | | |
| | | | | 109,651,218 | |
| | | | | | |
| | |
| | Utilities-3.2% | | | | |
| 154,500 | | American Electric Power Co., Inc. | | | 6,918,510 | |
| 9,000 | | American States Water Co. | | | 483,030 | |
| 320,500 | | AT&T, Inc. | | | 11,345,700 | |
| 464,000 | | BCE, Inc. | | | 19,033,280 | |
| 10,000 | | Black Hills Corp. | | | 487,500 | |
| 146,840 | | DTE Energy Co. | | | 9,839,748 | |
| 67,000 | | El Paso Electric Co. | | | 2,365,770 | |
| 20,000 | | Laclede Group, Inc. | | | 913,200 | |
| 69,200 | | Pike Electric Corp. | | | 851,160 | |
| 60,000 | | Pinnacle West Capital Corp. | | | 3,328,200 | |
| 248,000 | | PNM Resources, Inc. | | | 5,503,120 | |
| 255,000 | | Portland General Electric Co. | | | 7,800,450 | |
| 28,000 | | Public Service Enterprise Group, Inc. | | | 914,480 | |
| 134,000 | | TELUS Corp. | | | 3,911,460 | |
| 15,000 | | Westar Energy, Inc. | | | 479,400 | |
| | | | | | |
| | | | | 74,175,008 | |
| | | | | | |
TOTAL COMMON STOCKS | | | | |
(Cost $730,998,719) | | | 979,867,169 | |
| | | | | | |
| | |
| See Notes to Financial Statements. | | |
| 10 | | www.jamesfunds.com |
| | |
| James Balanced: Golden Rainbow Fund | | Schedule of Investments |
| | June 30, 2013 |
| | | | | | |
| Shares or Principal Amount | | Value | |
CLOSED-END FUNDS-0.1% | | | | |
| 140,000 | | Eaton Vance Risk-Managed Diversified Equity Income Fund | | | $1,526,000 | |
| 11,500 | | Nuveen Ohio Quality Income Municipal Fund, Inc. | | | 171,235 | |
| 50,000 | | Nuveen Premium Income Municipal Fund 2 | | | 677,000 | |
| | | | | | |
| |
TOTAL CLOSED-END FUNDS | | | | |
(Cost $2,140,293) | | | 2,374,235 | |
| | | | | | |
| |
EXCHANGE TRADED FUNDS-0.9% | | | | |
| 10,000 | | iShares® Cohen & Steers Realty Majors Index Fund | | | 806,200 | |
| 55,000 | | iShares® MSCI Canada Index Fund | | | 1,441,000 | |
| 15,000 | | iShares® MSCI Germany Index Fund | | | 370,500 | |
| 15,000 | | iShares® MSCI Indonesia Investable Market Index Fund | | | 467,550 | |
| 15,000 | | iShares® MSCI Philippines Investable Market Index Fund | | | 525,600 | |
| 44,540 | | iShares® MSCI Poland Investable Market Index Fund | | | 1,083,213 | |
| 338,000 | | iShares® MSCI Singapore Index Fund | | | 4,323,020 | |
| 12,000 | | iShares® MSCI South Korea Index Fund | | | 638,400 | |
| 70,000 | | iShares® MSCI Switzerland Index Fund | | | 2,005,500 | |
| 10,000 | | iShares® S&P® National Municipal Bond Fund | | | 1,050,400 | |
| 122,900 | | SPDR® Nuveen Barclays Capital Short Term Municipal Bond ETF | | | 2,937,310 | |
| 181,450 | | SPDR® S&P® Homebuilders ETF | | | 5,338,259 | |
| | | | | | |
| |
TOTAL EXCHANGE TRADED FUNDS | | | | |
(Cost $20,430,033) | | | 20,986,952 | |
| | | | | | |
| |
CORPORATE BONDS-9.0% | | | | |
| | Basic Materials-0.5% | | | | |
| $5,000,000 | | BHP Billiton Finance USA, Ltd., 1.000%, 2/24/15 | | | 5,027,025 | |
| 5,000,000 | | E.I. du Pont de Nemours & Co., 2.750%, 4/1/16 | | | 5,226,590 | |
| 1,500,000 | | E.I. du Pont de Nemours & Co., 5.750%, 3/15/19 | | | 1,754,735 | |
| | | | | | |
| | | | | 12,008,350 | |
| | | | | | |
| | Communications-0.2% | | | | |
| 5,000,000 | | BellSouth Corp., 5.200%, 9/15/14 | | | 5,249,900 | |
| | | | | | |
| | |
| | Consumer, Cyclical-0.6% | | | | |
| 5,000,000 | | eBay, Inc., 2.600%, 7/15/22 | | | 4,655,620 | |
| 5,000,000 | | Home Depot, Inc., 5.950%, 4/1/41 | | | 5,962,980 | |
| 785,000 | | McDonald’s Corp., 5.700%, 2/1/39 | | | 928,581 | |
| 2,000,000 | | Wal-Mart Stores, Inc., 5.250%, 9/1/35 | | | 2,173,508 | |
| | | | | | |
| | | | | 13,720,689 | |
| | | | | | |
| | |
| | Consumer, Non-cyclical-1.1% | | | | |
| 5,000,000 | | Colgate-Palmolive Co., 3.150%, 8/5/15 | | | 5,260,160 | |
| 3,000,000 | | Hershey Co., 4.125%, 12/1/20 | | | 3,252,669 | |
| 5,475,000 | | Johnson & Johnson, 4.500%, 9/1/40 | | | 5,622,595 | |
| 5,000,000 | | PepsiCo, Inc., 0.800%, 8/25/14 | | | 5,014,335 | |
| 5,465,000 | | Wyeth LLC, 5.500%, 2/15/16 | | | 6,092,562 | |
| | | | | | |
| | | | | 25,242,321 | |
| | | | | | |
| | Energy-1.1% | | | | |
| 5,000,000 | | Apache Corp., 3.250%, 4/15/22 | | | 4,922,495 | |
| 5,000,000 | | BP Capital Markets PLC, 3.245%, 5/6/22 | | | 4,849,580 | |
| 5,000,000 | | Occidental Petroleum Corp., 1.750%, 2/15/17 | | | 4,994,565 | |
| 5,050,000 | | Shell International Finance BV, 2.375%, 8/21/22 | | | 4,716,215 | |
| | |
| See Notes to Financial Statements. | | |
| Annual Report | June 30, 2013 | | 11 |
| | |
| Schedule of Investments | | James Balanced: Golden Rainbow Fund |
June 30, 2013 | | |
| | | | | | |
| Shares or Principal Amount | | Value | |
| | Energy (continued) | | | | |
| $5,000,000 | | Shell International Finance BV, 6.375%, 12/15/38 | | | $6,448,125 | |
| | | | | | |
| | | | | 25,930,980 | |
| | | | | | |
| | |
| | Financial-3.2% | | | | |
| 5,000,000 | | Aflac, Inc., 2.650%, 2/15/17 | | | 5,117,895 | |
| 5,000,000 | | Bank of America Corp., 1.776%, 4/27/16(a) | | | 5,013,705 | |
| 5,000,000 | | Berkshire Hathaway, Inc., 3.750%, 8/15/21 | | | 5,153,295 | |
| 5,000,000 | | Citigroup, Inc., 4.450%, 1/10/17 | | | 5,352,495 | |
| 4,000,000 | | General Electric Capital Corp., 0.774%, 2/6/14(a) | | | 4,011,088 | |
| 10,000,000 | | General Electric Capital Corp., 1.082%, 4/15/20(a) | | | 9,921,920 | |
| 2,000,000 | | General Electric Capital Corp., 6.875%, 1/10/39 | | | 2,467,132 | |
| 15,000,000 | | JPMorgan Chase & Co., 2.600%, 1/15/16 | | | 15,314,685 | |
| 5,000,000 | | Morgan Stanley & Co., 3.450%, 11/2/15 | | | 5,158,610 | |
| 5,000,000 | | Morgan Stanley & Co., 4.750%, 3/22/17 | | | 5,301,775 | |
| 5,000,000 | | National City Corp., 4.900%, 1/15/15 | | | 5,300,050 | |
| 5,000,000 | | UBS AG, 5.875%, 12/20/17 | | | 5,749,355 | |
| | | | | | |
| | | | | 73,862,005 | |
| | | | | | |
| | Industrial-0.4% | | | | |
| 1,000,000 | | Caterpillar, Inc., 7.900%, 12/15/18 | | | 1,289,382 | |
| 1,000,000 | | Caterpillar, Inc., 8.250%, 12/15/38 | | | 1,503,787 | |
| 5,000,000 | | United Technologies Corp., 3.100%, 6/1/22 | | | 4,936,310 | |
| | | | | | |
| | | | | 7,729,479 | |
| | | | | | |
| | Technology-1.4% | | | | |
| 8,000,000 | | Google, Inc., 3.625%, 5/19/21 | | | 8,356,488 | |
| 5,000,000 | | Intel Corp., 3.300%, 10/1/21 | | | 5,015,750 | |
| 3,000,000 | | International Business Machines Corp., 1.950%, 7/22/16 | | | 3,074,550 | |
| 7,000,000 | | International Business Machines Corp., 1.875%, 8/1/22 | | | 6,255,879 | |
| 3,700,000 | | Microsoft Corp., 5.200%, 6/1/39 | | | 4,087,734 | |
| 5,000,000 | | Oracle Corp., 2.500%, 10/15/22 | | | 4,608,095 | |
| | | | | | |
| | | | | 31,398,496 | |
| | | | | | |
| | Utilities-0.5% | | | | |
| 5,000,000 | | Duke Energy Florida, Inc., 5.800%, 9/15/17 | | | 5,770,100 | |
| 4,600,000 | | San Diego Gas & Electric Co., 3.000%, 8/15/21 | | | 4,621,142 | |
| | | | | | |
| | | | | 10,391,242 | |
| | | | | | |
TOTAL CORPORATE BONDS | | | | |
(Cost $207,501,490) | | | 205,533,462 | |
| | | | | | |
| |
MORTGAGE BACKED SECURITIES-1.4% | | | | |
| | Federal Home Loan Mortgage Corporation-0.5% | | | | |
| 6,580,536 | | 3.000%, 11/1/26 | | | 6,766,601 | |
| 3,863,591 | | 3.500%, 5/1/42 | | | 3,917,090 | |
| | | | | | |
| | | | | 10,683,691 | |
| | | | | | |
| | Federal National Mortgage Association-0.6% | | | | |
| 3,348,490 | | 3.000%, 3/1/27, Pool #AB4726 | | | 3,445,201 | |
| 4,172,431 | | 3.000%, 4/1/27, Pool #AB4927 | | | 4,296,602 | |
| 5,388,658 | | 4.500%, 9/1/40, Pool #MA0547 | | | 5,534,206 | |
| | | | | | |
| | | | | 13,276,009 | |
| | | | | | |
| | |
| See Notes to Financial Statements. | | |
| 12 | | www.jamesfunds.com |
| | |
| James Balanced: Golden Rainbow Fund | | Schedule of Investments |
| | June 30, 2013 |
| | | | | | |
| Shares or Principal Amount | | Value | |
| | Government National Mortgage Association-0.3% | | | | |
| $6,994,325 | | 4.000%, 12/20/40, Pool #4882 | | | $7,379,426 | |
| | | | | | |
| |
TOTAL MORTGAGE BACKED SECURITIES | | | | |
(Cost $31,305,137) | | | 31,339,126 | |
| | | | | | |
| |
U.S. GOVERNMENT AGENCIES-2.2% | | | | |
| | Federal Farm Credit Banks-1.2% | | | | |
| 10,000,000 | | 1.750%, 5/28/20 | | | 9,623,060 | |
| 10,000,000 | | 2.380%, 5/15/23 | | | 9,440,800 | |
| 10,000,000 | | 3.220%, 3/26/31 | | | 9,189,870 | |
| | | | | | |
| | | | | 28,253,730 | |
| | | | | | |
| | Federal Home Loan Bank-0.8% | | | | |
| 5,000,000 | | 1.600%,10/22/20 | | | 4,750,360 | |
| 5,000,000 | | 1.250%, 7/25/22 (b) | | | 4,921,565 | |
| 10,000,000 | | 2.430%, 10/11/22 | | | 9,640,970 | |
| | | | | | |
| | | | | 19,312,895 | |
| | | | | | |
| | United States Department of Housing and Urban Development-0.2% | | | | |
| 5,000,000 | | 2.050%, 8/1/19 | | | 4,966,175 | |
| | | | | | |
| |
TOTAL U.S. GOVERNMENT AGENCIES | | | | |
(Cost $55,212,899) | | | 52,532,800 | |
| | | | | | |
| |
U.S. TREASURY BONDS & NOTES-31.2% | | | | |
| | U.S. Treasury Bonds-4.6% | | | | |
| 97,500,000 | | 3.875%, 8/15/40 | | | 105,498,023 | |
| | | | | | |
| | |
| | U.S. Treasury Inflation Indexed Notes-2.7% | | | | |
| 15,832,575 | | 2.500%,7/15/16 | | | 17,496,230 | |
| 12,764,885 | | 1.625%,1/15/18 | | | 13,967,580 | |
| 26,885,925 | | 1.375%,1/15/20 | | | 29,265,759 | |
| | | | | | |
| | | | | 60,729,569 | |
| | | | | | |
| | U.S. Treasury Notes-23.9% | | | | |
| 55,000,000 | | 2.625%,12/31/14 | | | 56,944,360 | |
| 70,000,000 | | 0.250%, 5/31/15 | | | 69,868,750 | |
| 50,000,000 | | 2.000%,1/31/16 | | | 51,875,000 | |
| 25,000,000 | | 0.250%, 5/15/16 | | | 24,730,475 | |
| 35,000,000 | | 1.000%, 9/30/16 | | | 35,226,940 | |
| 58,000,000 | | 4.625%, 2/15/17 | | | 65,648,750 | |
| 20,000,000 | | 1.500%, 8/31/18 | | | 20,050,000 | |
| 70,000,000 | | 2.750%, 2/15/19 | | | 74,467,960 | |
| 117,000,000 | | 2.625%, 11/15/20 | | | 121,835,376 | |
| 30,000,000 | | 1.750%, 5/15/23 | | | 28,078,140 | |
| | | | | | |
| | | | | 548,725,751 | |
| | | | | | |
TOTAL U.S. TREASURY BONDS & NOTES | | | | |
(Cost $706,473,834) | | | 714,953,343 | |
| | | | | | |
| |
FOREIGN BONDS-2.7% | | | | |
| | Australia Government-0.4% | | | | |
| AUD 10,000,000 | | 5.250%, 3/15/19 | | | 10,102,796 | |
| | | | | | |
| | |
| See Notes to Financial Statements. | | |
| Annual Report | June 30, 2013 | | 13 |
| | |
| Schedule of Investments | | James Balanced: Golden Rainbow Fund |
June 30, 2013 | | |
| | | | | | |
| Shares or Principal Amount | | Value | |
| | Canada Government-0.5% | | | | |
| CAD 5,000,000 | | 3.750%, 6/1/19 | | | $5,218,123 | |
| CAD 5,000,000 | | 3.500%, 6/1/20 | | | 5,168,631 | |
| | | | | | |
| | | | | 10,386,754 | |
| | | | | | |
| | Denmark Government-0.4% | | | | |
| DKK 56,000,000 | | 1.500%, 11/15/23 | | | 9,436,451 | |
| | | | | | |
| | |
| | International Bank for Reconstruction & Development-0.2% | | | | |
| TRY 8,000,000 | | 6.000%, 7/23/15 | | | 4,060,352 | |
| | | | | | |
| | |
| | Netherlands Government-0.2% | | | | |
| EUR 3,000,000 | | 4.000%, 7/15/19 | | | 4,504,889 | |
| | | | | | |
| | |
| | Norway Government-0.4% | | | | |
| NOK 21,000,000 | | 4.500%, 5/22/19 | | | 3,924,222 | |
| NOK 28,000,000 | | 2.000%, 5/24/23 | | | 4,393,267 | |
| | | | | | |
| | | | | 8,317,489 | |
| | | | | | |
| | |
| | Queensland Treasury Corp.-0.2% | | | | |
| AUD 5,000,000 | | 6.000%, 10/14/15 | | | 4,889,266 | |
| | | | | | |
| | |
| | Sweden Government-0.4% | | | | |
| SEK 52,000,000 | | 5.000%, 12/1/20 | | | 9,373,694 | |
| | | | | | |
| |
TOTAL FOREIGN BONDS | | | | |
(Cost $60,877,278) | | | 61,071,691 | |
| | | | | | |
| |
MUNICIPAL BONDS-2.6% | | | | |
| | California-0.0%(c) | | | | |
| 1,000,000 | | Citrus Community College District General Obligation Unlimited Bonds, Series B, 4.750%, 6/1/31 | | | 1,049,770 | |
| | | | | | |
| | |
| | Colorado-0.1% | | | | |
| 1,000,000 | | Adams County School District No. 14 General Obligation Unlimited Bonds,
5.000%, 12/1/26 | | | 1,135,970 | |
| | | | | | |
| | |
| | Connecticut-0.3% | | | | |
| 5,350,000 | | State of Connecticut, Series B, 5.000%, 11/1/25 | | | 6,069,789 | |
| | | | | | |
| | |
| | Florida-0.1% | | | | |
| 1,000,000 | | Florida State Board of Education Capital Outlay General Obligation Bonds, Series D, 5.000%, 6/1/38 | | | 1,085,930 | |
| | | | | | |
| | |
| | Georgia-0.1% | | | | |
| 3,000,000 | | State of Georgia General Obligation Unlimited Bonds, Series B, 4.500%, 1/1/29 | | | 3,272,430 | |
| | | | | | |
| | |
| | Illinois-0.1% | | | | |
| 500,000 | | Kane & DeKalb Counties Community Unit School District No. 302 Kaneland General Obligation Unlimited Bonds (School Building), 5.500%, 2/1/28 | | | 537,340 | |
| 1,000,000 | | Village of Bolingbrook General Obligation Unlimited Bonds, 5.000%, 1/1/37 | | | 1,045,790 | |
| | | | | | |
| | | | | 1,583,130 | |
| | | | | | |
| | Maryland-0.2% | | | | |
| 5,000,000 | | County of Montgomery MD, 3.000%, 11/1/29 | | | 4,543,850 | |
| | | | | | |
| | |
| See Notes to Financial Statements. | | |
| 14 | | www.jamesfunds.com |
| | |
| James Balanced: Golden Rainbow Fund | | Schedule of Investments |
| | June 30, 2013 |
| | | | | | |
| Shares or Principal Amount | | Value | |
| | Massachusetts-0.1% | | | | |
| $1,000,000 | | Commonwealth of Massachusetts General Obligation Limited Bonds, Series C, 5.250%, 8/1/22 | | | $1,162,860 | |
| | | | | | |
| | |
| | Michigan-0.0%(c) | | | | |
| 1,000,000 | | Marysville Public School District General Obligation Unlimited Bonds (School Building & Site), 5.000%, 5/1/32 | | | 1,030,100 | |
| | | | | | |
| | |
| | Ohio-0.8% | | | | |
| 4,620,000 | | Columbus City School District Taxable Facilities & Improvement Build America Bonds, Series B, 6.150%, 12/1/33 | | | 4,869,850 | |
| 5,000,000 | | County of Cuyahoga OH, 4.000%, 12/1/37 | | | 4,695,250 | |
| 1,100,000 | | Miamisburg City School District General Obligation Unlimited Bonds (School Facilities Construction & Improvement), 5.000%, 12/1/33 | | | 1,182,346 | |
| 500,000 | | Mount Healthy City School District General Obligation Unlimited Bonds (School Improvement), 5.000%, 12/1/26 | | | 535,420 | |
| 1,000,000 | | Ohio State University General Recipients Revenue Bonds, 4.910%, 6/1/40 | | | 981,360 | |
| 1,000,000 | | Ohio State University General Recipients Revenue Bonds, Series A, 5.000%, 12/1/28 | | | 1,100,760 | |
| 500,000 | | Springboro Community City School District General Obligation Unlimited Bonds, 5.250%, 12/1/23 | | | 592,570 | |
| 1,000,000 | | State of Ohio General Obligation Unlimited Bonds, Series A, 5.375%, 9/1/28 | | | 1,124,310 | |
| 2,000,000 | | State of Ohio General Obligation Unlimited Bonds, Series B, 5.000%, 2/1/22 | | | 2,055,160 | |
| 1,000,000 | | Wright State University Revenue Bonds, 4.000%, 5/1/18 | | | 1,087,730 | |
| | | | | | |
| | | | | 18,224,756 | |
| | | | | | |
| | |
| | Texas-0.4% | | | | |
| 1,000,000 | | Friendswood Independent School District General Obligation Unlimited Bonds (Schoolhouse), 5.000%, 2/15/37 | | | 1,081,110 | |
| 1,000,000 | | Judson Independent School District General Obligation Unlimited Bonds (School Building), 5.000%, 2/1/37 | | | 1,042,140 | |
| 500,000 | | Lamar Consolidated Independent School District General Obligation Unlimited Bonds (Schoolhouse), 5.000%, 2/15/38 | | | 537,925 | |
| 5,335,000 | | Port of Houston Authority General Obligation Unlimited Bonds, Series D-1, 5.000%, 10/1/35 | | | 5,839,317 | |
| 1,000,000 | | Tyler Independent School District General Obligation Unlimited Bonds (School Building), 5.000%, 2/15/34 | | | 1,058,150 | |
| | | | | | |
| | | | | 9,558,642 | |
| | | | | | |
| | |
| | Washington-0.2% | | | | |
| 5,000,000 | | State of Washington General Obligation Unlimited Bonds, Series D, 4.000%, 2/1/37 | | | 4,682,750 | |
| | | | | | |
| | |
| | Wisconsin-0.2% | | | | |
| 5,000,000 | | State of Wisconsin General Obligation Unlimited Bonds, Series C, 5.000%, 5/1/25 | | | 5,666,750 | |
| | | | | | |
| |
TOTAL MUNICIPAL BONDS | | | | |
(Cost $59,635,270) | | | 59,066,727 | |
| | | | | | |
| |
SHORT TERM INVESTMENTS-6.5% | | | | |
| | Mutual Funds-2.1% | | | | |
| 48,257,162 | | First American Government Obligations Fund, 7-Day Yield 0.016% | | | 48,257,162 | |
| | | | | | |
| | |
| | U.S. Government Agency Securities-4.4% | | | | |
| $100,000,000 | | United States Treasury Bills, 0.098%, 2/6/14(d) | | | 99,949,600 | |
| | | | | | |
| |
TOTAL SHORT TERM INVESTMENTS | | | | |
(Cost $148,197,579) | | | 148,206,762 | |
| | | | | | |
| | |
| See Notes to Financial Statements. | | |
| Annual Report | June 30, 2013 | | 15 |
| | |
| Schedule of Investments | | James Balanced: Golden Rainbow Fund |
June 30, 2013 | | |
| | | | |
TOTAL INVESTMENT SECURITIES-99.3% | | | | |
(Cost $2,022,772,532) | | $ | 2,275,932,267 | |
OTHER ASSETS IN EXCESS OF LIABILITIES-0.7% | | | 15,569,076 | |
| | | | |
NET ASSETS-100.0% | | $ | 2,291,501,343 | |
| | | | |
Percentages shown are based on Net Assets.
| * | Non-income producing security. |
| (a) | Variable rate security. Interest rate disclosed is that which is in effect at June 30, 2013. |
| (b) | Step bond. Coupon increases periodically based upon a predetermined schedule. Interest rate disclosed is that which is in effect at June 30, 2013. |
| (c) | Less than 0.05% of Net Assets |
| (d) | Rate shown represents the bond equivalent yield to maturity at date of purchase. |
AUD - Australian Dollar
BV - Besloten Vennootschap is the Dutch term for private limited liability company
CAD - Canadian Dollar
DKK - Danish Krone
ETF - Exchange Traded Fund
EUR - Euro
LLC - Limited Liability Company
LP - Limited Partnership
Ltd. - Limited
MSCI - Morgan Stanley Capital International
NOK - Norwegian Krone
NV - Naamloze Vennootschap is the Dutch term for a public limited liability corporation
PLC - Public Limited Company
REIT - Real Estate Investment Trust
S&P - Standard & Poor’s
SEK - Swedish Krona
SPDR - Standard & Poor’s Depositary Receipts
TRY - Turkish Lira
| | |
| Foreign Bonds Securities Allocation | | |
| | | % of Net Assets |
Europe | | 1.0% |
Europe - Euro | | 0.6% |
Asia - Pacific | | 0.6% |
North America | | 0.5% |
| | |
| | 2.7% |
| | |
| | |
| See Notes to Financial Statements. | | |
| 16 | | www.jamesfunds.com |
| | |
| James Small Cap Fund | | Schedule of Investments |
| | June 30, 2013 |
| | | | | | |
| Shares or Principal Amount | | Value | |
COMMON STOCKS-92.6% | | | | |
| | Basic Materials-7.4% | | | | |
| 38,545 | | Aceto Corp. | | | $536,932 | |
| 75,860 | | Cooper Tire & Rubber Co. | | | 2,516,276 | |
| 68,855 | | Innospec, Inc. | | | 2,766,594 | |
| 126,340 | | Lydall, Inc.* | | | 1,844,564 | |
| 50,376 | | Material Sciences Corp.* | | | 506,783 | |
| 22,194 | | Neenah Paper, Inc. | | | 705,103 | |
| 78,760 | | PH Glatfelter Co. | | | 1,976,876 | |
| 33,800 | | Worthington Industries, Inc. | | | 1,071,798 | |
| | | | | | |
| | | | | 11,924,926 | |
| | | | | | |
| | |
| | Consumer, Cyclical-14.1% | | | | |
| 46,060 | | 1-800-Flowers.com, Inc., Class A* | | | 285,111 | |
| 6,021 | | Bassett Furniture Industries, Inc. | | | 93,506 | |
| 11,960 | | Courier Corp. | | | 170,789 | |
| 26,500 | | Destination Maternity Corp. | | | 651,900 | |
| 36,830 | | Dorman Products, Inc. | | | 1,680,553 | |
| 14,511 | | Flexsteel Industries, Inc. | | | 353,778 | |
| 40,720 | | Fred’s, Inc., Class A | | | 630,753 | |
| 125,890 | | Haverty Furniture Cos., Inc. | | | 2,896,729 | |
| 38,750 | | Kona Grill, Inc.* | | | 454,150 | |
| 96,180 | | La-Z-Boy, Inc. | | | 1,949,569 | |
| 390,045 | | LeapFrog Enterprises, Inc.* | | | 3,838,043 | |
| 25,360 | | Meritage Homes Corp.* | | | 1,099,610 | |
| 125,730 | | Myers Industries, Inc. | | | 1,887,207 | |
| 37,830 | | PC Connection, Inc. | | | 584,473 | |
| 27,705 | | Rocky Brands, Inc. | | | 418,900 | |
| 176,725 | | Sinclair Broadcast Group, Inc., Class A | | | 5,192,180 | |
| 13,530 | | Susser Holdings Corp.* | | | 647,816 | |
| | | | | | |
| | | | | 22,835,067 | |
| | | | | | |
| | |
| | Consumer, Non-cyclical-10.7% | | | | |
| 12,765 | | Alico, Inc. | | | 512,004 | |
| 27,200 | | Andersons, Inc. | | | 1,446,768 | |
| 184,200 | | Carriage Services, Inc. | | | 3,122,190 | |
| 19,760 | | G&K Services, Inc., Class A | | | 940,576 | |
| 9,316 | | Libbey, Inc.* | | | 223,304 | |
| 109,195 | | LifePoint Hospitals, Inc.* | | | 5,333,084 | |
| 8,465 | | Nature’s Sunshine Products, Inc. | | | 138,403 | |
| 35,320 | | Seneca Foods Corp., Class A* | | | 1,083,618 | |
| 98,100 | | Toro Co. | | | 4,454,721 | |
| | | | | | |
| | | | | 17,254,668 | |
| | | | | | |
| | |
| | Energy-7.6% | | | | |
| 11,220 | | Adams Resources & Energy, Inc. | | | 772,946 | |
| 68,120 | | Alon USA Energy, Inc. | | | 985,015 | |
| 20,206 | | Blueknight Energy Partners LP | | | 171,145 | |
| 34,700 | | Calumet Specialty Products Partners LP | | | 1,262,386 | |
| 113,960 | | Delek US Holdings, Inc. | | | 3,279,769 | |
| 143,225 | | EPL Oil & Gas, Inc.* | | | 4,205,086 | |
| 35,509 | | Star Gas Partners LP | | | 173,639 | |
| 15,780 | | Sunoco Logistics Partners LP | | | 1,009,131 | |
| | |
| See Notes to Financial Statements. | | |
| Annual Report | June 30, 2013 | | 17 |
| | |
| Schedule of Investments | | James Small Cap Fund |
June 30, 2013 | | |
| | | | | | |
| Shares or Principal Amount | | Value | |
| | Energy (continued) | | | | |
| 53,836 | | TGC Industries, Inc. | | | $442,532 | |
| | | | | | |
| | | | | 12,301,649 | |
| | | | | | |
| | Financial-13.0% | | | | |
| 2,437 | | Altisource Asset Management Corp.* | | | 657,990 | |
| 8,124 | | Altisource Residential Corp., Class B* | | | 135,589 | |
| 89,250 | | American Financial Group, Inc. | | | 4,365,217 | |
| 13,080 | | AmTrust Financial Services, Inc. | | | 466,956 | |
| 11,150 | | BofI Holding, Inc.* | | | 510,893 | |
| 27,270 | | Coinstar, Inc.* | | | 1,599,931 | |
| 24,245 | | ePlus, Inc. | | | 1,452,033 | |
| 14,540 | | Federal Agricultural Mortgage Corp., Class C | | | 419,915 | |
| 14,893 | | HCI Group, Inc. | | | 457,513 | |
| 620 | | Investors Title Co. | | | 43,983 | |
| 39,090 | | MainSource Financial Group, Inc. | | | 524,979 | |
| 58,140 | | National Financial Partners Corp.* | | | 1,471,523 | |
| 23,265 | | Nicholas Financial, Inc. | | | 351,767 | |
| 24,960 | | Peoples Bancorp, Inc. | | | 526,157 | |
| 133,645 | | Rent-A-Center, Inc. | | | 5,018,370 | |
| 45,649 | | Southside Bancshares, Inc. | | | 1,090,092 | |
| 20,920 | | World Acceptance Corp.* | | | 1,818,785 | |
| | | | | | |
| | | | | 20,911,693 | |
| | | | | | |
| | |
| | Industrial-12.9% | | | | |
| 81,145 | | Alamo Group, Inc. | | | 3,312,339 | |
| 28,410 | | AMERCO | | | 4,599,579 | |
| 59,140 | | Celadon Group, Inc. | | | 1,079,305 | |
| 77,640 | | Dana Holding Corp. | | | 1,495,346 | |
| 49,850 | | Franklin Electric Co., Inc. | | | 1,677,453 | |
| 14,485 | | Park-Ohio Holdings Corp.* | | | 477,715 | |
| 23,922 | | SORL Auto Parts, Inc.* | | | 62,197 | |
| 12,465 | | Standex International Corp. | | | 657,529 | |
| 46,447 | | StealthGas, Inc.* | | | 510,917 | |
| 3,038 | | Strattec Security Corp. | | | 113,500 | |
| 132,057 | | Sturm Ruger & Co., Inc. | | | 6,344,018 | |
| 23,680 | | Supreme Industries, Inc., Class A* | | | 118,400 | |
| 17,634 | | UFP Technologies, Inc.* | | | 345,274 | |
| | | | | | |
| | | | | 20,793,572 | |
| | | | | | |
| | |
| | Technology-12.4% | | | | |
| 9,360 | | Alliant Techsystems, Inc. | | | 770,609 | |
| 11,610 | | Aware, Inc. | | | 60,372 | |
| 39,092 | | CalAmp Corp.* | | | 570,743 | |
| 21,780 | | CSG Systems International, Inc. | | | 472,626 | |
| 142,525 | | Deluxe Corp. | | | 4,938,491 | |
| 45,230 | | Gilat Satellite Networks, Ltd.* | | | 250,574 | |
| 95,190 | | Kulicke & Soffa Industries, Inc.* | | | 1,052,801 | |
| 86,271 | | Lionbridge Technologies, Inc.* | | | 250,186 | |
| 197,345 | | Mentor Graphics Corp. | | | 3,858,095 | |
| 28,470 | | NetSol Technologies, Inc.* | | | 286,408 | |
| 44,940 | | PDL BioPharma, Inc. | | | 346,937 | |
| 16,430 | | Perion Network, Ltd.* | | | 188,123 | |
| | |
| See Notes to Financial Statements. | | |
| 18 | | www.jamesfunds.com |
| | |
| James Small Cap Fund | | Schedule of Investments |
| | June 30, 2013 |
| | | | | | |
| Shares or Principal Amount | | Value | |
| | Technology (continued) | | | | |
| 87,150 | | Triumph Group, Inc. | | | $6,897,923 | |
| | | | | | |
| | | | | 19,943,888 | |
| | | | | | |
| | |
| | Utilities-14.5% | | | | |
| 115,550 | | Cleco Corp. | | | 5,364,986 | |
| 143,445 | | El Paso Electric Co. | | | 5,065,043 | |
| 56,140 | | Laclede Group, Inc. | | | 2,563,352 | |
| 65,995 | | NorthWestern Corp. | | | 2,633,201 | |
| 93,120 | | PNM Resources, Inc. | | | 2,066,333 | |
| 130,635 | | Portland General Electric Co. | | | 3,996,125 | |
| 8,894 | | Shenandoah Telecommunications Co. | | | 148,352 | |
| 538,170 | | Vonage Holdings Corp. * | | | 1,523,021 | |
| | | | | | |
| | | | | 23,360,413 | |
| | | | | | |
| |
TOTAL COMMON STOCKS | | | | |
(Cost $107,760,624) | | | 149,325,876 | |
| | | | | | |
| |
SHORT TERM INVESTMENTS-7.1% | | | | |
| | Mutual Funds-4.3% | | | | |
| 6,904,824 | | First American Government Obligations Fund, 7-Day Yield 0.016% | | | 6,904,824 | |
| | | | | | |
| | |
| | U.S. Government Agency Securities-2.8% | | | | |
| $4,500,000 | | United States Treasury Bills, 0.060%, 11/14/13(a) | | | 4,498,852 | |
| | | | | | |
| |
TOTAL SHORT TERM INVESTMENTS | | | | |
(Cost $11,403,804) | | | 11,403,676 | |
| | | | | | |
| |
TOTAL INVESTMENT SECURITIES-99.7% | | | | |
(Cost $119,164,428) | | | 160,729,552 | |
OTHER ASSETS IN EXCESS OF LIABILITIES-0.3% | | | 541,653 | |
| | | | | | |
NET ASSETS-100.0% | | | $161,271,205 | |
| | | | | | |
Percentages shown are based on Net Assets.
| * | Non-income producing security. |
| (a) | Rate shown represents the bond equivalent yield to maturity at date of purchase. |
LP - Limited Partnership
Ltd. - Limited
| | |
| See Notes to Financial Statements. | | |
| Annual Report | June 30, 2013 | | 19 |
| | |
| Schedule of Investments | | James Mid Cap Fund |
June 30, 2013 | | |
| | | | | | |
| Shares or Principal Amount | | Value | |
COMMON STOCKS-92.6% | | | | |
| | Basic Materials-11.1% | | | | |
| 7,500 | | Buckeye Technologies, Inc. | | | $277,800 | |
| 13,000 | | Huntsman Corp. | | | 215,280 | |
| 1,000 | | NewMarket Corp. | | | 262,560 | |
| 10,000 | | Olin Corp. | | | 239,200 | |
| 15,500 | | PolyOne Corp. | | | 384,090 | |
| 8,000 | | Worthington Industries, Inc. | | | 253,680 | |
| | | | | | |
| | | | | 1,632,610 | |
| | | | | | |
| | Consumer, Cyclical-11.7% | | | | |
| 8,250 | | Alaska Air Group, Inc. | | | 429,000 | |
| 5,000 | | Dillard’s, Inc., Class A | | | 409,850 | |
| 6,500 | | Foot Locker, Inc. | | | 228,345 | |
| 15,000 | | KB Home | | | 294,450 | |
| 10,000 | | RR Donnelley & Sons Co. | | | 140,100 | |
| 15,000 | | Steelcase, Inc., Class A | | | 218,700 | |
| | | | | | |
| | | | | 1,720,445 | |
| | | | | | |
| | Consumer, Non-cyclical-13.7% | | | | |
| 15,000 | | Dean Foods Co.* | | | 150,300 | |
| 4,125 | | Ingredion, Inc. | | | 270,683 | |
| 10,000 | | Newell Rubbermaid, Inc. | | | 262,500 | |
| 75 | | Seaboard Corp. | | | 203,100 | |
| 6,400 | | Toro Co. | | | 290,624 | |
| 7,225 | | Tupperware Brands Corp. | | | 561,310 | |
| 10,325 | | Tyson Foods, Inc., Class A | | | 265,146 | |
| | | | | | |
| | | | | 2,003,663 | |
| | | | | | |
| | Energy-5.7% | | | | |
| 8,250 | | HollyFrontier Corp. | | | 352,935 | |
| 9,300 | | Tesoro Corp. | | | 486,576 | |
| | | | | | |
| | | | | 839,511 | |
| | | | | | |
| | Financial-14.8% | | | | |
| 8,775 | | American Financial Group, Inc. | | | 429,185 | |
| 8,000 | | Aspen Insurance Holdings, Ltd. | | | 296,720 | |
| 4,125 | | Home Properties, Inc., REIT | | | 269,651 | |
| 11,350 | | Nelnet, Inc., Class A | | | 409,622 | |
| 6,825 | | Protective Life Corp. | | | 262,148 | |
| 13,425 | | Rent-A-Center, Inc. | | | 504,109 | |
| | | | | | |
| | | | | 2,171,435 | |
| | | | | | |
| | Industrial-17.2% | | | | |
| 7,225 | | AGCO Corp. | | | 362,622 | |
| 3,000 | | AMERCO | | | 485,700 | |
| 11,625 | | Jarden Corp.* | | | 508,594 | |
| 6,700 | | Timken Co. | | | 377,076 | |
| 6,000 | | Trinity Industries, Inc. | | | 230,640 | |
| 8,250 | | TRW Automotive Holdings Corp.* | | | 548,130 | |
| | | | | | |
| | | | | 2,512,762 | |
| | | | | | |
| | |
| See Notes to Financial Statements. | | |
| 20 | | www.jamesfunds.com |
| | |
| James Mid Cap Fund | | Schedule of Investments |
| | June 30, 2013 |
| | | | | | |
| Shares or Principal Amount | | Value | |
| | Technology-9.9% | | | | |
| 34,525 | | Amkor Technology, Inc.* | | | $145,350 | |
| 7,750 | | Arrow Electronics, Inc.* | | | 308,837 | |
| 13,950 | | Deluxe Corp. | | | 483,368 | |
| 25,500 | | LSI Corp.* | | | 182,070 | |
| 4,125 | | Triumph Group, Inc. | | | 326,494 | |
| | | | | | |
| | | | | 1,446,119 | |
| | | | | | |
| | |
| | Utilities-8.5% | | | | |
| 15,550 | | CMS Energy Corp. | | | 422,493 | |
| 4,975 | | DTE Energy Co. | | | 333,375 | |
| 8,000 | | Portland General Electric Co. | | | 244,720 | |
| 7,000 | | Vectren Corp. | | | 236,810 | |
| | | | | | |
| | | | | 1,237,398 | |
| | | | | | |
| |
TOTAL COMMON STOCKS | | | | |
(Cost $9,903,710) | | | 13,563,943 | |
| | | | | | |
| |
EXCHANGE TRADED FUNDS-1.7% | | | | |
| 3,100 | | iShares® Cohen & Steers Realty Majors Index Fund | | | 249,922 | |
| | | | | | |
| |
TOTAL EXCHANGE TRADED FUNDS | | | | |
(Cost $217,510) | | | 249,922 | |
| | | | | | |
| |
SHORT TERM INVESTMENTS-9.1% | | | | |
| | Mutual Funds-5.6% | | | | |
| 822,901 | | First American Government Obligations Fund, 7-Day Yield 0.016% | | | 822,901 | |
| | | | | | |
| | |
| | U.S. Government Agency Securities-3.5% | | | | |
| $500,000 | | United States Treasury Bills, 0.046%, 11/14/13(a) | | | 499,873 | |
| | | | | | |
| |
TOTAL SHORT TERM INVESTMENTS | | | | |
(Cost $1,322,813) | | | 1,322,774 | |
| | | | | | |
| |
TOTAL INVESTMENT SECURITIES-103.4% | | | | |
(Cost $11,444,033) | | | 15,136,639 | |
OTHER LIABILITIES IN EXCESS OF ASSETS-(3.4)% | | | (493,815) | |
| | | | | | |
NET ASSETS-100.0% | | | $14,642,824 | |
| | | | | | |
Percentages shown are based on Net Assets.
| * | Non-income producing security. |
| (a) | Rate shown represents the bond equivalent yield to maturity at date of purchase. |
Ltd. - Limited
REIT - Real Estate Investment Trust
| | |
| See Notes to Financial Statements. | | |
| Annual Report | June 30, 2013 | | 21 |
| | |
| Schedule of Investments | | James Micro Cap Fund |
June 30, 2013 | | |
| | | | | | |
| Shares | | | | Value | |
COMMON STOCKS-96.7% | | | | |
| | Basic Materials-10.1% | | | | |
| 26,220 | | Aceto Corp. | | | $365,245 | |
| 34,277 | | Material Sciences Corp.* | | | 344,827 | |
| 15,085 | | Neenah Paper, Inc. | | | 479,250 | |
| | | | | | |
| | | | | 1,189,322 | |
| | | | | | |
| | Consumer, Cyclical-17.3% | | | | |
| 31,340 | | 1-800-Flowers.com, Inc., Class A* | | | 193,995 | |
| 4,094 | | Bassett Furniture Industries, Inc. | | | 63,580 | |
| 8,180 | | Courier Corp. | | | 116,810 | |
| 9,874 | | Flexsteel Industries, Inc. | | | 240,728 | |
| 26,500 | | Kona Grill, Inc.* | | | 310,580 | |
| 25,715 | | PC Connection, Inc. | | | 397,297 | |
| 18,853 | | Rocky Brands, Inc. | | | 285,057 | |
| 9,202 | | Susser Holdings Corp.* | | | 440,592 | |
| | | | | | |
| | | | | 2,048,639 | |
| | | | | | |
| | Consumer, Non-cyclical-9.4% | | | | |
| 8,680 | | Alico, Inc. | | | 348,155 | |
| 30,781 | | Carriage Services, Inc. | | | 521,738 | |
| 6,386 | | Libbey, Inc.* | | | 153,072 | |
| 5,760 | | Nature’s Sunshine Products, Inc. | | | 94,176 | |
| | | | | | |
| | | | | 1,117,141 | |
| | | | | | |
| | Energy-9.0% | | | | |
| 7,620 | | Adams Resources & Energy, Inc. | | | 524,942 | |
| 13,809 | | Blueknight Energy Partners LP | | | 116,962 | |
| 24,290 | | Star Gas Partners LP | | | 118,778 | |
| 36,591 | | TGC Industries, Inc. | | | 300,778 | |
| | | | | | |
| | | | | 1,061,460 | |
| | | | | | |
| | Financial-24.7% | | | | |
| 7,580 | | BofI Holding, Inc.* | | | 347,315 | |
| 16,490 | | ePlus, Inc. | | | 987,586 | |
| 9,880 | | Federal Agricultural Mortgage Corp., Class C | | | 285,334 | |
| 10,128 | | HCI Group, Inc. | | | 311,132 | |
| 420 | | Investors Title Co. | | | 29,795 | |
| 26,560 | | MainSource Financial Group, Inc. | | | 356,701 | |
| 15,922 | | Nicholas Financial, Inc. | | | 240,741 | |
| 16,960 | | Peoples Bancorp, Inc. | | | 357,517 | |
| | | | | | |
| | | | | 2,916,121 | |
| | | | | | |
| | Industrial-14.8% | | | | |
| 9,860 | | Park-Ohio Holdings Corp.* | | | 325,183 | |
| 16,266 | | SORL Auto Parts, Inc.* | | | 42,291 | |
| 8,485 | | Standex International Corp. | | | 447,584 | |
| 31,598 | | StealthGas, Inc.* | | | 347,578 | |
| 2,066 | | Strattec Security Corp. | | | 77,186 | |
| 4,130 | | Sturm Ruger & Co., Inc. | | | 198,405 | |
| 16,101 | | Supreme Industries, Inc., Class A* | | | 80,505 | |
| | |
| See Notes to Financial Statements. | | |
| 22 | | www.jamesfunds.com |
| | |
| James Micro Cap Fund | | Schedule of Investments |
| | June 30, 2013 |
| | | | | | |
| Shares | | | | Value | |
| | Industrial (continued) | | | | |
| 12,004 | | UFP Technologies, Inc.* | | | $235,038 | |
| | | | | | |
| | | | | 1,753,770 | |
| | | | | | |
| | |
| | Technology-9.3% | | | | |
| 7,900 | | Aware, Inc. | | | 41,080 | |
| 26,592 | | CalAmp Corp.* | | | 388,243 | |
| 30,940 | | Gilat Satellite Networks, Ltd.* | | | 171,408 | |
| 58,701 | | Lionbridge Technologies, Inc.* | | | 170,233 | |
| 19,480 | | NetSol Technologies, Inc.* | | | 195,969 | |
| 11,180 | | Perion Network, Ltd.* | | | 128,011 | |
| | | | | | |
| | | | | 1,094,944 | |
| | | | | | |
| | |
| | Utilities-2.1% | | | | |
| 6,050 | | Shenandoah Telecommunications Co. | | | 100,914 | |
| 51,040 | | Vonage Holdings Corp.* | | | 144,443 | |
| | | | | | |
| | | | | 245,357 | |
| | | | | | |
| |
TOTAL COMMON STOCKS | | | | |
(Cost $ 7,614,326) | | | 11,426,754 | |
| | | | | | |
| |
SHORT TERM INVESTMENTS-3.4% | | | | |
| | Mutual Funds-3.4% | | | | |
| 398,855 | | First American Government Obligations Fund, 7-Day Yield 0.016% | | | 398,855 | |
| | | | | | |
| |
TOTAL SHORT TERM INVESTMENTS | | | | |
(Cost $ 398,855) | | | 398,855 | |
| | | | | | |
| |
TOTAL INVESTMENT SECURITIES-100.1% | | | | |
(Cost $ 8,013,181) | | | 11,825,609 | |
OTHER LIABILITIES IN EXCESS OF ASSETS-(0.1)% | | | (8,782) | |
| | | | | | |
NET ASSETS-100.0% | | | $11,816,827 | |
| | | | | | |
Percentages shown are based on Net Assets.
| * | Non-income producing security. |
LP - Limited Partnership
Ltd. - Limited
| | |
| See Notes to Financial Statements. | | |
| Annual Report | June 30, 2013 | | 23 |
| | |
| Schedule of Investments | | James Long-Short Fund |
June 30, 2013 | | |
| | | | | | |
| Shares | | | | Value | |
COMMON STOCKS-94.4% | | | | |
| | Basic Materials-10.1% | | | | |
| 16,230 | | Aceto Corp. | | | $226,084 | |
| 14,510 | | Buckeye Technologies, Inc.(a) | | | 537,451 | |
| 1,170 | | CF Industries Holdings, Inc.(a) | | | 200,655 | |
| 8,690 | | Cooper Tire & Rubber Co. | | | 288,247 | |
| 6,620 | | Olin Corp. | | | 158,350 | |
| 5,590 | | Worthington Industries, Inc. | | | 177,259 | |
| | | | | | |
| | | | | 1,588,046 | |
| | | | | | |
| | |
| | Consumer, Cyclical-14.5% | | | | |
| 5,110 | | Alaska Air Group, Inc. | | | 265,720 | |
| 5,310 | | Dillard’s, Inc., Class A(a) | | | 435,261 | |
| 15,150 | | LeapFrog Enterprises, Inc.* | | | 149,076 | |
| 20,045 | | Sinclair Broadcast Group, Inc., Class A(a) | | | 588,922 | |
| 13,720 | | Southwest Airlines Co. | | | 176,851 | |
| 2,705 | | Target Corp. | | | 186,266 | |
| 2,500 | | Viacom, Inc., Class A(a) | | | 171,100 | |
| 3,995 | | Wal-Mart Stores, Inc. | | | 297,588 | |
| | | | | | |
| | | | | 2,270,784 | |
| | | | | | |
| | |
| | Consumer, Non-cyclical-13.8% | | | | |
| 9,915 | | Eli Lilly & Co.(a) | | | 487,025 | |
| 3,560 | | Merck & Co., Inc. | | | 165,362 | |
| 19,475 | | Pfizer, Inc.(a) | | | 545,494 | |
| 3,280 | | Toro Co.(a) | | | 148,945 | |
| 8,500 | | UnitedHealth Group, Inc.(a) | | | 556,580 | |
| 3,710 | | USANA Health Sciences, Inc.* | | | 268,530 | |
| | | | | | |
| | | | | 2,171,936 | |
| | | | | | |
| | |
| | Energy-9.3% | | | | |
| 3,705 | | Chevron Corp.(a) | | | 438,450 | |
| 10,475 | | HollyFrontier Corp.(a) | | | 448,120 | |
| 10,915 | | Tesoro Cor.(a) | | | 571,073 | |
| | | | | | |
| | | | | 1,457,643 | |
| | | | | | |
| | |
| | Financial-13.9% | | | | |
| 5,280 | | CBL & Associates Properties, Inc., REIT | | | 113,098 | |
| 27,590 | | Fifth Third Bancorp | | | 497,999 | |
| 3,830 | | JPMorgan Chase & Co. | | | 202,186 | |
| 20,570 | | KeyCorp | | | 227,093 | |
| 5,760 | | PNC Financial Services Group, Inc.(a) | | | 420,019 | |
| 9,595 | | Protective Life Corp. | | | 368,544 | |
| 8,222 | | Southside Bancshares, Inc. | | | 196,336 | |
| 2,030 | | Travelers Cos., Inc. | | | 162,238 | |
| | | | | | |
| | | | | 2,187,513 | |
| | | | | | |
| | |
| | Industrial-10.1% | | | | |
| 3,790 | | AGCO Corp. | | | 190,220 | |
| 1,510 | | AMERCO(a) | | | 244,469 | |
| 1,040 | | NACCO Industries, Inc., Class A | | | 59,571 | |
| 11,445 | | Sturm Ruger & Co., Inc.(a) | | | 549,818 | |
| 2,265 | | Timken Co. | | | 127,474 | |
| | |
| See Notes to Financial Statements. | | |
| 24 | | www.jamesfunds.com |
| | |
| James Long-Short Fund | | Schedule of Investments |
| | June 30, 2013 |
| | | | | | |
| Shares | | | | Value | |
| | Industrial (continued) | | | | |
| 3,030 | | TRW Automotive Holdings Corp.* | | | $201,313 | |
| 4,070 | | United Rentals, Inc.* | | | 203,134 | |
| | | | | | |
| | | | | 1,575,999 | |
| | | | | | |
| | |
| | Technology-13.0% | | | | |
| 12,305 | | Deluxe Corp.(a) | | | 426,368 | |
| 19,755 | | Kulicke & Soffa Industries, Inc.*(a) | | | 218,491 | |
| 2,415 | | Lockheed Martin Corp.(a) | | | 261,931 | |
| 1,250 | | Northrop Grumman Corp.(a) | | | 103,500 | |
| 10,555 | | Symantec Corp.(a) | | | 237,171 | |
| 4,815 | | Triumph Group, Inc. | | | 381,107 | |
| 6,680 | | Western Digital Corp.(a) | | | 414,761 | |
| | | | | | |
| | | | | 2,043,329 | |
| | | | | | |
| | |
| | Utilities-9.7% | | | | |
| 7,645 | | AT&T, Inc.(a) | | | 270,633 | |
| 3,245 | | DTE Energy Co. | | | 217,447 | |
| 9,595 | | PNM Resources, Inc. | | | 212,913 | |
| 17,160 | | Portland General Electric Co.(a) | | | 524,924 | |
| 103,585 | | Vonage Holdings Corp.* | | | 293,146 | |
| | | | | | |
| | | | | 1,519,063 | |
| | | | | | |
| |
TOTAL COMMON STOCKS | | | | |
(Cost $12,437,228) | | | 14,814,313 | |
| | | | | | |
| |
EXCHANGE TRADED FUNDS-1.1% | | | | |
| 5,950 | | SPDR® S&P® Homebuilders ETF | | | 175,049 | |
| | | | | | |
| |
TOTAL EXCHANGE TRADED FUNDS | | | | |
(Cost $164,107) | | | 175,049 | |
| | | | | | |
| |
SHORT TERM INVESTMENTS-18.4% | | | | |
| | Mutual Funds-18.4% | | | | |
| 2,887,239 | | First American Government Obligations Fund, 7-Day Yield 0.016% | | | 2,887,239 | |
| | | | | | |
| |
TOTAL SHORT TERM INVESTMENTS | | | | |
(Cost $2,887,239) | | | 2,887,239 | |
| | | | | | |
| |
TOTAL INVESTMENT SECURITIES-113.9% | | | | |
(Cost $15,488,574) | | | 17,876,601 | |
SEGREGATED CASH WITH BROKERS-33.8% | | | 5,302,947 | |
SECURITIES SOLD SHORT-(36.0)% | | | | |
(Proceeds $5,622,877) | | | (5,652,634) | |
OTHER LIABILITIES IN EXCESS OF ASSETS-(11.7)% | | | (1,832,654) | |
| | | | | | |
NET ASSETS-100.0% | | | $15,694,260 | |
| | | | | | |
| | |
| See Notes to Financial Statements. | | |
| Annual Report | June 30, 2013 | | 25 |
| | |
| Schedule of Investments | | James Long-Short Fund |
June 30, 2013 | | |
| | | | | | |
| Shares | | | | Value | |
SCHEDULE OF SECURITIES SOLD SHORT | | | | |
COMMON STOCKS-(36.0)% | | | | |
| | Basic Materials-(3.3)% | | | | |
| (1,520) | | Agnico Eagle Mines, Ltd. | | | $(41,861 | ) |
| (1,650) | | ArcelorMittal | | | (18,480 | ) |
| (9,780) | | AuRico Gold, Inc. | | | (42,739 | ) |
| (1,750) | | Cemex SAB de CV, ADR | | | (18,515 | ) |
| (6,090) | | Eldorado Gold Corp. | | | (37,636 | ) |
| (1,170) | | First Quantum Minerals, Ltd. | | | (17,480 | ) |
| (1,570) | | Globe Specialty Metals, Inc. | | | (17,066 | ) |
| (1,010) | | Kraton Performance Polymers, Inc. | | | (21,412 | ) |
| (3,590) | | Molycorp, Inc. | | | (22,258 | ) |
| (2,560) | | Pretium Resources, Inc. | | | (16,896 | ) |
| (1,920) | | PVR Partners LP | | | (52,416 | ) |
| (2,620) | | Quanex Building Products Corp. | | | (44,121 | ) |
| (2,700) | | Sandstorm Gold, Ltd. | | | (15,795 | ) |
| (4,290) | | Seabridge Gold, Inc. | | | (40,455 | ) |
| (1,690) | | Solazyme, Inc. | | | (19,807 | ) |
| (1,430) | | Tahoe Resources, Inc. | | | (20,234 | ) |
| (990) | | Tronox, Ltd. | | | (19,948 | ) |
| (7,280) | | Turquoise Hill Resources, Ltd. | | | (43,170 | ) |
| | | | | | |
| | | | | (510,289 | ) |
| | | | | | |
| | |
| | Consumer, Cyclical-(2.2)% | | | | |
| (180) | | Amazon.com, Inc. | | | (49,984 | ) |
| (3,510) | | BioScrip, Inc. | | | (57,915 | ) |
| (5,660) | | Clear Channel Outdoor Holdings, Inc. | | | (42,224 | ) |
| (820) | | Expedia, Inc. | | | (49,323 | ) |
| (540) | | Five Below, Inc. | | | (19,850 | ) |
| (2,760) | | JC Penney Co., Inc. | | | (47,141 | ) |
| (1,170) | | Latam Airlines Group SA | | | (19,761 | ) |
| (2,640) | | Millennial Media, Inc. | | | (22,994 | ) |
| (660) | | Norwegian Cruise Line Holdings, Ltd. | | | (20,005 | ) |
| (820) | | Tile Shop Holdings, Inc. | | | (23,747 | ) |
| | | | | | |
| | | | | (352,944 | ) |
| | | | | | |
| | |
| | Consumer, Non-cyclical-(6.1)% | | | | |
| (2,980) | | Amarin Corp. PLC | | | (17,284 | ) |
| (2,650) | | Ariad Pharmaceuticals, Inc. | | | (46,348 | ) |
| (2,450) | | comScore, Inc. | | | (59,756 | ) |
| (430) | | CoStar Group, Inc. | | | (55,500 | ) |
| (3,830) | | Elan Corp. PLC, Sponsored ADR | | | (54,156 | ) |
| (1,910) | | Emeritus Corp. | | | (44,274 | ) |
| (3,610) | | Endologix, Inc. | | | (47,941 | ) |
| (1,290) | | Forest Laboratories, Inc. | | | (52,890 | ) |
| (4,940) | | InnerWorkings, Inc. | | | (53,599 | ) |
| (620) | | Intercept Pharmaceuticals, Inc. | | | (27,801 | ) |
| (3,930) | | MAKO Surgical Corp. | | | (47,356 | ) |
| (4,740) | | Merrimack Pharmaceuticals, Inc. | | | (31,900 | ) |
| (5,120) | | Nektar Therapeutics | | | (59,136 | ) |
| (3,480) | | NxStage Medical, Inc. | | | (49,694 | ) |
| (720) | | Pacira Pharmaceuticals, Inc. | | | (20,880 | ) |
| (2,340) | | Ritchie Bros Auctioneers, Inc. | | | (44,975 | ) |
| (1,390) | | Sotheby’s | | | (52,695 | ) |
| (1,910) | | Stonemor Partners LP | | | (48,056 | ) |
| | |
| See Notes to Financial Statements. | | |
| 26 | | www.jamesfunds.com |
| | |
| James Long-Short Fund | | Schedule of Investments |
| | June 30, 2013 |
| | | | | | |
| Shares | | | | Value | |
| | Consumer, Non-cyclical (continued) | | | | |
| (3,150) | | Student Transportation, Inc. | | | $(19,247 | ) |
| (1,320) | | Tornier NV | | | (23,100 | ) |
| (2,540) | | Volcano Corp. | | | (46,050 | ) |
| (1,940) | | Wright Medical Group, Inc. | | | (50,847 | ) |
| | | | | | |
| | | | | (953,485 | ) |
| | | | | | |
| | |
| | Energy-(6.8)% | | | | |
| (1,930) | | Approach Resources, Inc. | | | (47,420 | ) |
| (1,270) | | Baytex Energy Corp. | | | (45,771 | ) |
| (2,350) | | Bill Barrett Corp. | | | (47,517 | ) |
| (3,660) | | Clean Energy Fuels Corp. | | | (48,312 | ) |
| (800) | | Cobalt International Energy, Inc. | | | (21,256 | ) |
| (580) | | Concho Resources, Inc. | | | (48,558 | ) |
| (570) | | Crescent Point Energy Corp. | | | (19,420 | ) |
| (1,570) | | Crestwood Midstream Partners LP | | | (39,171 | ) |
| (760) | | Diamondback Energy, Inc. | | | (25,323 | ) |
| (5,740) | | Eagle Rock Energy Partners LP | | | (45,174 | ) |
| (1,150) | | EV Energy Partner LP | | | (42,975 | ) |
| (9,190) | | Halcon Resources Corp. | | | (52,107 | ) |
| (850) | | Inergy Midstream LP(a) | | | (18,904 | ) |
| (1,900) | | Kosmos Energy, Ltd. | | | (19,304 | ) |
| (1,180) | | Laredo Petroleum Holdings, Inc. | | | (24,261 | ) |
| (800) | | MarkWest Energy Partners LP | | | (53,480 | ) |
| (550) | | MPLX LP | | | (20,245 | ) |
| (990) | | NuStar Energy LP | | | (45,194 | ) |
| (1,760) | | NuStar GP Holdings LLC | | | (47,045 | ) |
| (1,010) | | PDC Energy, Inc. | | | (51,995 | ) |
| (9,440) | | Pengrowth Energy Corp. | | | (46,539 | ) |
| (4,760) | | Penn West Petroleum, Ltd. | | | (50,361 | ) |
| (950) | | Sanchez Energy Corp. | | | (21,812 | ) |
| (660) | | SEACOR Holdings, Inc. | | | (54,813 | ) |
| (460) | | SolarCity Corp. | | | (17,374 | ) |
| (4,220) | | Talisman Energy, Inc. | | | (48,235 | ) |
| (2,670) | | Tullow Oil PLC | | | (20,412 | ) |
| (1,290) | | Williams Cos, Inc. | | | (41,886 | ) |
| | | | | | |
| | | | | (1,064,864 | ) |
| | | | | | |
| | |
| | Financial-(1.7)% | | | | |
| (620) | | Alexander & Baldwin, Inc. | | | (24,645 | ) |
| (1,000) | | Beneficial Mutual Bancorp, Inc. | | | (8,400 | ) |
| (1,270) | | China Life Insurance Co., Ltd. | | | (44,297 | ) |
| (4,180) | | E*Trade Financial Corp. | | | (52,919 | ) |
| (1,150) | | National Bank Holdings Corp. | | | (22,655 | ) |
| (2,210) | | PICO Holdings, Inc. | | | (46,322 | ) |
| (400) | | Realogy Holdings Corp. | | | (19,216 | ) |
| (1,080) | | Saul Centers, Inc. | | | (48,017 | ) |
| | | | | | |
| | | | | (266,471 | ) |
| | | | | | |
| | |
| | Industrial-(0.9)% | | | | |
| (1,230) | | Nidec Corp. | | | (21,550 | ) |
| (380) | | Proto Labs, Inc. | | | (24,689 | ) |
| (1,660) | | Simpson Manufacturing Co., Inc. | | | (48,837 | ) |
| (3,060) | | UTi Worldwide, Inc. | | | (50,398 | ) |
| | | | | | |
| | | | | (145,474 | ) |
| | | | | | |
| | |
| See Notes to Financial Statements. | | |
| Annual Report | June 30, 2013 | | 27 |
| | |
| Schedule of Investments | | James Long-Short Fund |
June 30, 2013 | | |
| | | | | | |
| Shares | | | | Value | |
| | Technology-(14.9)% | | | | |
| (2,280) | | 21Vianet Group, Inc. | | | $(25,832 | ) |
| (1,390) | | Acorda Therapeutics, Inc. | | | (45,856 | ) |
| (1,160) | | Aixtron SE, Sponsored ADR | | | (19,465 | ) |
| (6,110) | | Applied Micro Circuits Corp. | | | (53,768 | ) |
| (6,360) | | Arena Pharmaceuticals, Inc. | | | (48,972 | ) |
| (2,260) | | Aruba Networks, Inc. | | | (34,714 | ) |
| (770) | | BioMarin Pharmaceutical, Inc. | | | (42,958 | ) |
| (750) | | BroadSoft, Inc. | | | (20,700 | ) |
| (1,770) | | Cogent Communications Group, Inc. | | | (49,825 | ) |
| (740) | | Comverse, Inc. | | | (22,022 | ) |
| (510) | | Cornerstone OnDemand, Inc. | | | (22,078 | ) |
| (620) | | Crown Castle International Corp. | | | (44,882 | ) |
| (4,790) | | Cypress Semiconductor Corp. | | | (51,397 | ) |
| (730) | | Demandware, Inc. | | | (30,959 | ) |
| (1,510) | | Diebold, Inc. | | | (50,872 | ) |
| (1,790) | | EZchip Semiconductor, Ltd. | | | (48,312 | ) |
| (850) | | Facebook, Inc. | | | (21,131 | ) |
| (1,080) | | Fortinet, Inc. | | | (18,900 | ) |
| (1,440) | | Fusion-io, Inc. | | | (20,506 | ) |
| (2,700) | | Groupon, Inc. | | | (22,950 | ) |
| (6,870) | | Halozyme Therapeutics, Inc. | | | (54,548 | ) |
| (1,980) | | HMS Holdings Corp. | | | (46,134 | ) |
| (690) | | HomeAway, Inc. | | | (22,315 | ) |
| (520) | | Imperva, Inc. | | | (23,421 | ) |
| (1,330) | | Informatica Corp. | | | (46,523 | ) |
| (5,240) | | InterMune, Inc. | | | (50,409 | ) |
| (6,110) | | Intersil Corp. | | | (47,780 | ) |
| (1,560) | | Ironwood Pharmaceuticals, Inc. | | | (15,522 | ) |
| (1,230) | | Jive Software, Inc. | | | (22,349 | ) |
| (1,530) | | KEYW Holding Corp. | | | (20,273 | ) |
| (5,250) | | LivePerson, Inc. | | | (47,014 | ) |
| (820) | | LogMeIn, Inc. | | | (20,057 | ) |
| (530) | | MicroStrategy, Inc., Class A | | | (46,089 | ) |
| (970) | | Mistras Group, Inc. | | | (17,053 | ) |
| (3,690) | | Momenta Pharmaceuticals, Inc. | | | (55,571 | ) |
| (550) | | NetSuite, Inc. | | | (50,457 | ) |
| (6,750) | | NII Holdings, Inc. | | | (45,023 | ) |
| (7,340) | | Opko Health, Inc. | | | (52,114 | ) |
| (3,260) | | Optimer Pharmaceuticals, Inc. | | | (47,172 | ) |
| (430) | | Palo Alto Networks, Inc. | | | (18,129 | ) |
| (1,200) | | Polypore International, Inc. | | | (48,360 | ) |
| (680) | | QLIK Technologies, Inc. | | | (19,224 | ) |
| (1,290) | | Rackspace Hosting, Inc. | | | (48,878 | ) |
| (1,090) | | RealPage, Inc. | | | (19,991 | ) |
| (1,160) | | Ruckus Wireless, Inc. | | | (14,860 | ) |
| (1,150) | | Salesforce.com, Inc. | | | (43,907 | ) |
| (1,370) | | Sarepta Therapeutics, Inc. | | | (52,129 | ) |
| (4,460) | | Scientific Games Corp. | | | (50,175 | ) |
| (570) | | ServiceNow, Inc. | | | (23,022 | ) |
| (3,510) | | ServiceSource International, Inc. | | | (32,713 | ) |
| (870) | | Sourcefire, Inc. | | | (48,328 | ) |
| (2,600) | | Spectranetics Corp. | | | (48,568 | ) |
| (440) | | Splunk, Inc. | | | (20,398 | ) |
| | |
| See Notes to Financial Statements. | | |
| 28 | | www.jamesfunds.com |
| | |
| James Long-Short Fund | | Schedule of Investments |
| | June 30, 2013 |
| | | | | | |
| Shares | | | | Value | |
| | Technology (continued) | | | | |
| (1,180) | | Synageva BioPharma Corp. | | | $(49,560 | ) |
| (5,060) | | Synta Pharmaceuticals Corp. | | | (25,249 | ) |
| (1,530) | | Tangoe, Inc. | | | (23,608 | ) |
| (610) | | TESARO, Inc. | | | (19,971 | ) |
| (2,340) | | Tessera Technologies, Inc. | | | (48,672 | ) |
| (2,280) | | TIBCO Software, Inc. | | | (48,792 | ) |
| (680) | | Trulia, Inc. | | | (21,141 | ) |
| (1,630) | | Universal Display Corp. | | | (45,819 | ) |
| (640) | | Vertex Pharmaceuticals, Inc. | | | (51,117 | ) |
| (880) | | VirnetX Holding Corp. | | | (17,591 | ) |
| (2,790) | | Vivus, Inc. | | | (35,098 | ) |
| (1,020) | | Youku, Inc., ADR | | | (19,574 | ) |
| (340) | | Zillow, Inc. | | | (19,142 | ) |
| | | | | | |
| | | | | (2,339,939 | ) |
| | | | | | |
| | |
| | Utilities-(0.1)% | | | | |
| (850) | | Dynegy, Inc. | | | (19,168 | ) |
| | | | | | |
| |
TOTAL COMMON STOCKS SOLD SHORT | | | (5,652,634 | ) |
| | | | | | |
| |
TOTAL SECURITIES SOLD SHORT-(36.0)% | | | | |
(Proceeds $5,622,877) | | | $(5,652,634 | ) |
| | | | | | |
Percentages shown are based on Net Assets.
| * | Non-income producing security. |
| (a) | Security position is either entirely or partially held in a segregated account as collateral for securities sold short, aggregating a total market value of $4,371,496. |
ADR - American Depositary Receipt
ETF - Exchange Traded Fund
LLC - Limited Liabilty Company
LP - Limited Partnership
Ltd. - Limited
NV - Naamloze Vennootschap is the Dutch term for a public limited liability corporation
PLC - Public Limited Company
REIT - Real Estate Investment Trust
SA - Generally designates corporations in various countries, mostly those employing the civil law
S&P - Standard & Poor’s
SPDR - Standard & Poor’s Depositary Receipts
| | |
| See Notes to Financial Statements. | | |
| Annual Report | June 30, 2013 | | 29 |
| | |
| Statements of Assets and Liabilities | | James Advantage Funds |
June 30, 2013 | | |
| | | | | | | | | | | | | | | | | | | | |
| | | James Balanced:
Golden Rainbow
Fund | | | James Small Cap
Fund | | | James Mid Cap
Fund | | | James Micro Cap
Fund | | | James Long-Short
Fund | |
| |
ASSETS: | | | | | | | | | | | | | | | | | | | | |
| | | | | |
Investment securities: | | | | | | | | | | | | | | | | | | | | |
At cost | | $ | 2,022,772,532 | | | $ | 119,164,428 | | | $ | 11,444,033 | | | $ | 8,013,181 | | | $ | 15,488,574 | |
| | | | |
At value | | $ | 2,275,932,267 | | | $ | 160,729,552 | | | $ | 15,136,639 | | | $ | 11,825,609 | | | $ | 17,876,601 | |
Segregated cash with brokers | | | – | | | | – | | | | – | | | | – | | | | 5,302,947 | |
Cash | | | 36,432 | | | | 2,373 | | | | 1,535 | | | | 1,624 | | | | – | |
Dividends and interest receivable | | | 10,934,657 | | | | 156,374 | | | | 23,158 | | | | 2,182 | | | | 16,862 | |
Receivable for securities sold | | | 1,688,196 | | | | – | | | | – | | | | – | | | | – | |
Receivable for capital shares sold | | | 6,850,945 | | | | 676,170 | | | | – | | | | 2,006 | | | | 148,480 | |
Other assets | | | 118,374 | | | | – | | | | – | | | | – | | | | – | |
| |
Total Assets | | | 2,295,560,871 | | | | 161,564,469 | | | | 15,161,332 | | | | 11,831,421 | | | | 23,344,890 | |
| |
| | | | | |
LIABILITIES: | | | | | | | | | | | | | | | | | | | | |
| | | | | |
Payable for securities sold short (proceeds $5,622,877) | | | – | | | | – | | | | – | | | | – | | | | 5,652,634 | |
Payable for dividends on securities sold short | | | – | | | | – | | | | – | | | | – | | | | 3,594 | |
Payable for capital shares redeemed | | | 2,037,424 | | | | 95,321 | | | | – | | | | – | | | | 4,742 | |
Payable for securities purchased | | | – | | | | – | | | | 499,911 | | | | – | | | | 1,971,658 | |
Accrued expenses: | | | | | | | | | | | | | | | | | | | | |
Management fees | | | 1,260,310 | | | | 164,901 | | | | 15,491 | | | | 14,594 | | | | 14,995 | |
12b-1 distribution and service fees | | | 354,470 | | | | 33,042 | | | | 3,106 | | | | – | | | | 3,007 | |
Other payables | | | 407,324 | | | | – | | | | – | | | | – | | | | – | |
| |
Total Liabilities | | | 4,059,528 | | | | 293,264 | | | | 518,508 | | | | 14,594 | | | | 7,650,630 | |
| |
Net Assets | | $ | 2,291,501,343 | | | $ | 161,271,205 | | | $ | 14,642,824 | | | $ | 11,816,827 | | | $ | 15,694,260 | |
| |
| | | | | |
NET ASSETS CONSIST OF: | | | | | | | | | | | | | | | | | | | | |
| | | | | |
Paid-in capital | | $ | 2,014,794,455 | | | $ | 158,645,711 | | | $ | 10,459,679 | | | $ | 9,209,612 | | | $ | 14,413,672 | |
Accumulated net investment income/(loss) | | | (56,459) | | | | 3,261,972 | | | | 44,964 | | | | (27,089) | | | | (27,971) | |
Accumulated net realized gain/(loss) on investments, securities sold short and translation of assets and liabilities denominated in foreign currency | | | 23,642,497 | | | | (42,201,602) | | | | 445,575 | | | | (1,178,124) | | | | (1,049,711) | |
Net unrealized appreciation on investments, securities sold short andtranslation of assets and liabilities denominated in foreign currency | | | 253,120,850 | | | | 41,565,124 | | | | 3,692,606 | | | | 3,812,428 | | | | 2,358,270 | |
| |
Net Assets | | $ | 2,291,501,343 | | | $ | 161,271,205 | | | $ | 14,642,824 | | | $ | 11,816,827 | | | $ | 15,694,260 | |
| |
| | |
| See Notes to Financial Statements. | | |
| 30 | | www.jamesfunds.com |
| | |
| James Advantage Funds | | Statements of Assets and Liabilities |
| | June 30, 2013 |
| | | | | | | | | | | | | | | | | | | | |
| | | James Balanced:
Golden Rainbow
Fund | | | James Small Cap
Fund | | | James Mid Cap Fund | | | James Micro Cap
Fund | | | James Long-Short
Fund | |
| |
PRICING OF RETAIL CLASS SHARES(a): | | | | | | | | | | | | | |
| | | | | |
Net assets | | $ | 1,735,735,714 | | | $ | 161,271,205 | | | $ | 14,642,824 | | | $ | 11,816,827 | | | $ | 15,694,260 | |
Shares of beneficial interest outstanding (unlimited number of shares authorized, no par) | | | 76,985,289 | | | | 5,627,177 | | | | 1,129,391 | | | | 846,643 | | | | 1,341,242 | |
| |
Net assets value, offering price and redemption price per share | | $ | 22.55 | | | $ | 28.66 | | | $ | 12.97 | | | $ | 13.96 | | | $ | 11.70 | |
| |
| | | |
PRICING OF INSTITUTIONAL CLASS SHARES: | | | | | | | | | | | | | |
| | | | | |
Net assets | | $ | 555,765,629 | | | | N/A | | | | N/A | | | | N/A | | | | N/A | |
Shares of beneficial interest outstanding (unlimited number of shares authorized, no par) | | | 24,866,471 | | | | N/A | | | | N/A | | | | N/A | | | | N/A | |
| |
Net assets value, offering price and redemption price per share | | $ | 22.35 | | | | N/A | | | | N/A | | | | N/A | | | | N/A | |
| |
| (a) | James Small Cap Fund, James Mid Cap Fund, James Micro Cap Fund, and James Long-Short Fund do not have a share class and will be presented as Retail Class shares throughout this annual report for financial reporting presentation purposes only. |
| | |
| See Notes to Financial Statements. | | |
| Annual Report | June 30, 2013 | | 31 |
| | |
| Statements of Operations | | James Advantage Funds |
For the Year Ended June 30, 2013 | | |
| | | | | | | | | | | | | | | | | | | | |
| | | James Balanced:
Golden Rainbow
Fund | | | James Small Cap Fund | | | James Mid Cap
Fund | | | James Micro Cap
Fund | | | James Long-Short
Fund | |
| |
INVESTMENT INCOME: | | | | | | | | | | | | | | | | | | | | |
| | | | | |
Dividends (Net of withholding taxes of $255,605, $6,167, $1,084, $3,898 and $746, respectively) | | $ | 26,308,832 | | | $ | 4,051,648 | | | $ | 302,583 | | | $ | 286,487 | | | $ | 323,247 | |
Interest | | | 19,781,005 | | | | 30 | | | | – | | | | – | | | | – | |
| |
Total Investment Income | | | 46,089,837 | | | | 4,051,678 | | | | 302,583 | | | | 286,487 | | | | 323,247 | |
| |
| | | | | |
EXPENSES: | | | | | | | | | | | | | | | | | | | | |
| | | | | |
Management fees | | | 12,689,936 | | | | 1,747,532 | | | | 176,298 | | | | 163,757 | | | | 131,765 | |
12b-1 distribution and service fees - Retail Class | | | 3,586,054 | | | | 350,566 | | | | 35,366 | | | | – | | | | 26,429 | |
Dividend and interest expense on securities sold short | | | – | | | | – | | | | – | | | | – | | | | 118,621 | |
Administration fee | | | 805,792 | | | | – | | | | – | | | | – | | | | – | |
Transfer agent fee | | | 245,583 | | | | – | | | | – | | | | – | | | | – | |
Interest expense | | | – | | | | – | | | | – | | | | – | | | | 8,588 | |
Custodian fees | | | 166,345 | | | | – | | | | – | | | | – | | | | – | |
Professional fees | | | 175,299 | | | | – | | | | – | | | | – | | | | – | |
Trustee fees | | | 68,102 | | | | 5,318 | | | | 530 | | | | 409 | | | | 382 | |
Registration fees | | | 189,167 | | | | – | | | | – | | | | – | | | | – | |
Shareholder report printing and mailing | | | 157,610 | | | | – | | | | – | | | | – | | | | – | |
Other expenses | | | 85,521 | | | | – | | | | – | | | | – | | | | – | |
| |
Total Expenses | | | 18,169,409 | | | | 2,103,416 | | | | 212,194 | | | | 164,166 | | | | 285,785 | |
| |
Net Investment Income | | | 27,920,428 | | | | 1,948,262 | | | | 90,389 | | | | 122,321 | | | | 37,462 | |
| |
| | |
REALIZED AND UNREALIZED GAIN ON INVESTMENTS: | | | | | | | | | |
| | | | | |
Net realized gain/(loss) from: | | | | | | | | | | | | | | | | | | | | |
Investments | | | 37,169,315 | | | | 4,647,983 | | | | 641,430 | | | | (218,660) | | | | 266,157 | |
Securities sold short | | | – | | | | – | | | | – | | | | – | | | | (585,802) | |
Foreign currency transactions | | | (414,265) | | | | – | | | | – | | | | – | | | | – | |
Net change in unrealized appreciation on investments | | | 93,170,225 | | | | 21,553,320 | | | | 2,031,821 | | | | 2,177,958 | | | | 1,838,165 | |
Net change in unrealized appreciation on securities sold short | | | – | | | | – | | | | – | | | | – | | | | 32,153 | |
Net change in unrealized depreciation on foreign currency translation | | | (30,284) | | | | – | | | | – | | | | – | | | | – | |
| |
Net Realized and Unrealized Gain on Investments | | | 129,894,991 | | | | 26,201,303 | | | | 2,673,251 | | | | 1,959,298 | | | | 1,550,673 | |
| |
Net Increase in Net Assets Resulting from Operations | | $ | 157,815,419 | | | $ | 28,149,565 | | | $ | 2,763,640 | | | $ | 2,081,619 | | | $ | 1,588,135 | |
| |
| | |
| See Notes to Financial Statements. | | |
| 32 | | www.jamesfunds.com |
| | |
| James Balanced: Golden Rainbow Fund | | Statements of Changes in Net Assets |
| | |
| | | | | | | | |
| | | For the Year Ended
June 30, 2013 | | | For the Year Ended
June 30, 2012 | |
| |
| | |
FROM OPERATIONS: | | | | | | | | |
| | |
Net investment income | | $ | 27,920,428 | | | $ | 17,230,048 | |
Net realized gain/(loss) from investments and foreign currency transactions | | | 36,755,050 | | | | (595,416) | |
Net change in unrealized appreciation on investments and foreign currency translation | | | 93,139,941 | | | | 36,098,881 | |
| |
Net Increase in net assets resulting from operations | | | 157,815,419 | | | | 52,733,513 | |
| |
| | |
DISTRIBUTIONS TO SHAREHOLDERS: | | | | | | | | |
| | |
Retail Class: | | | | | | | | |
From net investment income | | | (19,795,813) | | | | (12,661,724) | |
From net realized gain on investments | | | (9,278,093) | | | | (15,647,688) | |
Institutional Class: | | | | | | | | |
From net investment income | | | (8,557,617) | | | | (3,948,993) | |
From net realized gain on investments | | | (2,721,986) | | | | (2,791,260) | |
| |
Decrease in net assets from distributions to shareholders | | | (40,353,509) | | | | (35,049,665) | |
| |
| | |
CAPITAL SHARE TRANSACTIONS: | | | | | | | | |
| | |
Retail Class Shares: | | | | | | | | |
Proceeds from shares sold | | | 720,893,867 | | | | 604,816,423 | |
Net asset value of shares issued in reinvestment of distributions to shareholders | | | 27,565,964 | | | | 26,684,112 | |
Payments for shares redeemed | | | (356,189,244) | | | | (335,396,377) | |
| |
Net Increase in net assets from Retail Class capital share transactions | | | 392,270,587 | | | | 296,104,158 | |
| |
| | |
Institutional Class Shares: | | | | | | | | |
Proceeds from shares sold | | | 309,550,391 | | | | 204,374,890 | |
Net asset value of shares issued in reinvestment of distributions to shareholders | | | 6,079,749 | | | | 3,955,677 | |
Payments for shares redeemed | | | (87,819,543) | | | | (36,726,831) | |
| |
Net Increase in net assets from Institutional Class capital share transactions | | | 227,810,597 | | | | 171,603,736 | |
| |
Total Increase in Net Assets | | | 737,543,094 | | | | 485,391,742 | |
| |
| | |
NET ASSETS: | | | | | | | | |
| | |
Beginning of year | | | 1,553,958,249 | | | | 1,068,566,507 | |
| |
End of year | | $ | 2,291,501,343 | | �� | $ | 1,553,958,249 | |
| |
Accumulated Net Investment Income/(Loss) | | $ | (56,459) | | | $ | 64,329 | |
| | |
| See Notes to Financial Statements. | | |
| Annual Report | June 30, 2013 | | 33 |
| | |
| Statements of Changes in Net Assets | | James Balanced: Golden Rainbow Fund |
| | |
| | | | | | | | |
| | | For the Year Ended
June 30, 2013 | | | For the Year Ended
June 30, 2012 | |
| |
| | |
SUMMARY OF CAPITAL SHARE ACTIVITY: | | | | | | | | |
| | |
Retail Class Shares: | | | | | | | | |
Shares sold | | | 32,075,023 | | | | 29,231,626 | |
Shares issued in reinvestment of distributions to shareholders | | | 1,257,838 | | | | 1,304,568 | |
Shares redeemed | | | (16,030,864) | | | | (16,248,512) | |
| |
Net Increase in shares outstanding | | | 17,301,997 | | | | 14,287,682 | |
| |
Shares outstanding, beginning of year | | | 59,683,292 | | | | 45,395,610 | |
| |
Shares outstanding, end of year | | | 76,985,289 | | | | 59,683,292 | |
| |
| | |
Institutional Class Shares: | | | | | | | | |
Shares sold | | | 13,915,324 | | | | 9,870,813 | |
Shares issued in reinvestment of distributions to shareholders | | | 277,752 | | | | 193,157 | |
Shares redeemed | | | (3,966,673) | | | | (1,774,556) | |
| |
Net Increase in shares outstanding | | | 10,226,403 | | | | 8,289,414 | |
| |
Shares outstanding, beginning of year | | | 14,640,068 | | | | 6,350,654 | |
| |
Shares outstanding, end of year | | | 24,866,471 | | | | 14,640,068 | |
| |
| | |
| See Notes to Financial Statements. | | |
| 34 | | www.jamesfunds.com |
| | |
| James Small Cap Fund | | Statements of Changes in Net Assets |
| | |
| | | | | | | | |
| | | For the Year Ended
June 30, 2013 | | | For the Year Ended
June 30, 2012 | |
| |
| | |
FROM OPERATIONS: | | | | | | | | |
| | |
Net investment income | | $ | 1,948,262 | | | $ | 744,697 | |
Net realized gain from investments | | | 4,647,983 | | | | 4,787,214 | |
Net change in unrealized appreciation/(depreciation) on investments | | | 21,553,320 | | | | (2,924,326) | |
| |
Net Increase in net assets resulting from operations | | | 28,149,565 | | | | 2,607,585 | |
| |
| | |
DISTRIBUTIONS TO SHAREHOLDERS: | | | | | | | | |
| | |
Retail Class: | | | | | | | | |
From net investment income | | | (2,605,549) | | | | (159,992) | |
| |
Decrease in net assets from distributions to shareholders | | | (2,605,549) | | | | (159,992) | |
| |
| | |
CAPITAL SHARE TRANSACTIONS: | | | | | | | | |
| | |
Retail Class Shares: | | | | | | | | |
Proceeds from shares sold | | | 57,572,635 | | | | 134,731,715 | |
Net asset value of shares issued in reinvestment of distributions to shareholders | | | 2,207,916 | | | | 148,116 | |
Payments for shares redeemed | | | (58,780,402) | | | | (84,105,197) | |
| |
Net Increase in net assets from Retail Class capital share transactions | | | 1,000,149 | | | | 50,774,634 | |
| |
Total Increase in Net Assets | | | 26,544,165 | | | | 53,222,227 | |
| |
| | |
NET ASSETS: | | | | | | | | |
| | |
Beginning of year | | | 134,727,040 | | | | 81,504,813 | |
| |
End of year | | $ | 161,271,205 | | | $ | 134,727,040 | |
| |
Accumulated Net Investment Income | | $ | 3,261,972 | | | $ | 630,546 | |
| | |
SUMMARY OF CAPITAL SHARE ACTIVITY: | | | | | | | | |
| | |
Retail Class Shares: | | | | | | | | |
Shares sold | | | 2,172,515 | | | | 5,809,465 | |
Shares issued in reinvestment of distributions to shareholders | | | 91,615 | | | | 6,268 | |
Shares redeemed | | | (2,276,226) | | | | (3,590,131) | |
| |
Net Increase/(Decrease) in shares outstanding | | | (12,096) | | | | 2,225,602 | |
| |
Shares outstanding, beginning of year | | | 5,639,273 | | | | 3,413,671 | |
| |
Shares outstanding, end of year | | | 5,627,177 | | | | 5,639,273 | |
| |
| | |
| See Notes to Financial Statements. | | |
| Annual Report | June 30, 2013 | | 35 |
| | |
| Statements of Changes in Net Assets | | James Mid Cap Fund |
| | |
| | | | | | | | |
| | | For the Year Ended
June 30, 2013 | | | For the Year Ended
June 30, 2012 | |
| |
| | |
FROM OPERATIONS: | | | | | | | | |
| | |
Net investment income | | $ | 90,389 | | | $ | 40,374 | |
Net realized gain from investments | | | 641,430 | | | | 322,442 | |
Net change in unrealized appreciation/(depreciation) on investments | | | 2,031,821 | | | | (1,147,310) | |
| |
Net Increase/(Decrease) in net assets resulting from operations | | | 2,763,640 | | | | (784,494) | |
| |
| | |
DISTRIBUTIONS TO SHAREHOLDERS: | | | | | | | | |
| | |
Retail Class: | | | | | | | | |
From net investment income | | | (40,000) | | | | (106,000) | |
| |
Decrease in net assets from distributions to shareholders | | | (40,000) | | | | (106,000) | |
| |
| | |
CAPITAL SHARE TRANSACTIONS: | | | | | | | | |
| | |
Retail Class Shares: | | | | | | | | |
Proceeds from shares sold | | | 2,503,329 | | | | 1,692,640 | |
Net asset value of shares issued in reinvestment of distributions to shareholders | | | 37,264 | | | | 101,121 | |
Payments for shares redeemed | | | (3,278,601) | | | | (1,649,016) | |
| |
Net Increase/(Decrease) in net assets from Retail Class capital share transactions | | | (738,008) | | | | 144,745 | |
| |
Total Increase/(Decrease) in Net Assets | | | 1,985,632 | | | | (745,749) | |
| |
| | |
NET ASSETS: | | | | | | | | |
| | |
Beginning of year | | | 12,657,192 | | | | 13,402,941 | |
| |
End of year | | $ | 14,642,824 | | | $ | 12,657,192 | |
| |
Accumulated Net Investment Income/(Loss) | | $ | 44,964 | | | $ | (432) | |
| | |
SUMMARY OF CAPITAL SHARE ACTIVITY: | | | | | | | | |
| | |
Retail Class Shares: | | | | | | | | |
Shares sold | | | 211,092 | | | | 156,783 | |
Shares issued in reinvestment of distributions to shareholders | | | 3,238 | | | | 9,640 | |
Shares redeemed | | | (268,737) | | | | (160,582) | |
| |
Net Increase/(Decrease) in shares outstanding | | | (54,407) | | | | 5,841 | |
| |
Shares outstanding, beginning of year | | | 1,183,798 | | | | 1,177,957 | |
| |
Shares outstanding, end of year | | | 1,129,391 | | | | 1,183,798 | |
| |
| | |
| See Notes to Financial Statements. | | |
| 36 | | www.jamesfunds.com |
| | |
| James Micro Cap Fund | | Statements of Changes in Net Assets |
| | |
| | | | | | | | |
| | | For the Year Ended
June 30, 2013 | | | For the Year Ended
June 30, 2012 | |
| |
| | |
FROM OPERATIONS: | | | | | | | | |
| | |
Net investment income/(loss) | | $ | 122,321 | | | $ | (12,345) | |
Net realized loss from investments | | | (218,660) | | | | (983,050) | |
Net change in unrealized appreciation on investments | | | 2,177,958 | | | | 629,089 | |
| |
Net Increase/(Decrease) in net assets resulting from operations | | | 2,081,619 | | | | (366,306) | |
| |
| | |
DISTRIBUTIONS TO SHAREHOLDERS: | | | | | | | | |
| | |
Retail Class: | | | | | | | | |
From net investment income | | | (119,999) | | | | – | |
From net realized gain on investments | | | – | | | | (40,981) | |
| |
Decrease in net assets from distributions to shareholders | | | (119,999) | | | | (40,981) | |
| |
| | |
CAPITAL SHARE TRANSACTIONS: | | | | | | | | |
| | |
Retail Class Shares: | | | | | | | | |
Proceeds from shares sold | | | 2,469,575 | | | | 2,542,578 | |
Net asset value of shares issued in reinvestment of distributions to shareholders | | | 111,984 | | | | 40,846 | |
Payments for shares redeemed, net of redemption fees | | | (2,899,165) | | | | (1,748,137) | |
| |
Net Increase/(Decrease) in net assets from Retail Class capital share transactions | | | (317,606) | | | | 835,287 | |
| |
Total Increase in Net Assets | | | 1,644,014 | | | | 428,000 | |
| |
| | |
NET ASSETS: | | | | | | | | |
| | |
Beginning of year | | | 10,172,813 | | | | 9,744,813 | |
| |
End of year | | $ | 11,816,827 | | | $ | 10,172,813 | |
| |
Accumulated Net Investment Loss | | $ | (27,089) | | | $ | (2,197) | |
| | |
SUMMARY OF CAPITAL SHARE ACTIVITY: | | | | | | | | |
| | |
Retail Class Shares: | | | | | | | | |
Shares sold | | | 203,697 | | | | 220,196 | |
Shares issued in reinvestment of distributions to shareholders | | | 9,780 | | | | 3,928 | |
Shares redeemed | | | (235,683) | | | | (173,160) | |
| |
Net Increase/(Decrease) in shares outstanding | | | (22,206) | | | | 50,964 | |
| |
Shares outstanding, beginning of year | | | 868,849 | | | | 817,885 | |
| |
Shares outstanding, end of year | | | 846,643 | | | | 868,849 | |
| |
| | |
| See Notes to Financial Statements. | | |
| Annual Report | June 30, 2013 | | 37 |
| | |
| Statements of Changes in Net Assets | | James Long-Short Fund |
| | |
| | | | | | | | |
| | | For the Year Ended
June 30, 2013 | | | For the Year Ended
June 30, 2012 | |
| |
| | |
FROM OPERATIONS: | | | | | | | | |
| | |
Net investment income/(loss) | | $ | 37,462 | | | $ | (36,630) | |
Net realized loss from investments | | | (319,645) | | | | (711,602) | |
Net change in unrealized appreciation on investments and securities sold short | | | 1,870,318 | | | | 383,024 | |
| |
Net Increase/(Decrease) in net assets resulting from operations | | | 1,588,135 | | | | (365,208) | |
| |
| | |
DISTRIBUTIONS TO SHAREHOLDERS: | | | | | | | | |
| | |
Retail Class: | | | | | | | | |
From net investment income | | | (35,250) | | | | (12,000) | |
| |
Decrease in net assets from distributions to shareholders | | | (35,250) | | | | (12,000) | |
| |
| | |
CAPITAL SHARE TRANSACTIONS: | | | | | | | | |
| | |
Retail Class Shares: | | | | | | | | |
Proceeds from shares sold | | | 6,372,569 | | | | 2,452,796 | |
Net asset value of shares issued in reinvestment of distributions to shareholders | | | 34,844 | | | | 12,000 | |
Payments for shares redeemed | | | (1,425,602) | | | | (3,646,342) | |
| |
Net Increase/(Decrease) in net assets from Retail Class capital share transactions | | | 4,981,811 | | | | (1,181,546) | |
| |
Total Increase/(Decrease) in Net Assets | | | 6,534,696 | | | | (1,558,754) | |
| |
| | |
NET ASSETS: | | | | | | | | |
| | |
Beginning of year | | | 9,159,564 | | | | 10,718,318 | |
| |
End of year | | $ | 15,694,260 | | | $ | 9,159,564 | |
| |
Accumulated Net Investment Loss | | $ | (27,971) | | | $ | (40,345) | |
| | |
SUMMARY OF CAPITAL SHARE ACTIVITY: | | | | | | | | |
| | |
Retail Class Shares: | | | | | | | | |
Shares sold | | | 559,409 | | | | 246,899 | |
Shares issued in reinvestment of distributions to shareholders | | | 3,433 | | | | 1,241 | |
Shares redeemed | | | (138,688) | | | | (391,935) | |
| |
Net Increase/(Decrease) in shares outstanding | | | 424,154 | | | | (143,795) | |
| |
Shares outstanding, beginning of year | | | 917,088 | | | | 1,060,883 | |
| |
Shares outstanding, end of year | | | 1,341,242 | | | | 917,088 | |
| |
| | |
| See Notes to Financial Statements. | | |
| 38 | | www.jamesfunds.com |
| | |
| James Balanced: Golden Rainbow Fund – Retail Class | | Financial Highlights |
| For a share outstanding throughout the periods indicated. |
| | | | | | | | | | | | | | | | | | | | |
| | | For the Year Ended
June 30, 2013 | | | For the Year Ended
June 30, 2012 | | | For the
Year Ended
June 30, 2011 | | | For the
Year Ended
June 30, 2010 | | | For the
Year Ended
June 30, 2009 | |
| | | | | |
Net asset value - beginning of year | | $ | 20.93 | | | $ | 20.66 | | | $ | 18.32 | | | $ | 16.69 | | | $ | 18.09 | |
Income/(Loss) from investment operations: | | | | | | | | | |
Net investment income | | | 0.32 | (a) | | | 0.25 | | | | 0.24 | | | | 0.30 | | | | 0.28 | |
Net realized and unrealized gain/(loss) | | | 1.75 | | | | 0.55 | | | | 2.50 | | | | 1.63 | | | | (1.40) | |
Total from investment operations | | | 2.07 | | | | 0.80 | | | | 2.74 | | | | 1.93 | | | | (1.12) | |
| | | | | |
Less distributions: | | | | | | | | | | | | | | | | | | | | |
From net investment income | | | (0.30) | | | | (0.23) | | | | (0.24) | | | | (0.30) | | | | (0.28) | |
From net realized gain on investments | | | (0.15) | | | | (0.30) | | | | (0.16) | | | | – | | | | (0.00) | (b) |
Total distributions | | | (0.45) | | | | (0.53) | | | | (0.40) | | | | (0.30) | | | | (0.28) | |
Net asset value at end of year | | $ | 22.55 | | | $ | 20.93 | | | $ | 20.66 | | | $ | 18.32 | | | $ | 16.69 | |
| | | | | | | | | | | | | | | | | | | | | |
| | | | | |
Total return | | | 9.98 | % | | | 3.98 | % | | | 15.01 | % | | | 11.60 | % | | | (6.19 | )% |
| | | | | |
Net assets, end of year
(in thousands) | | $ | 1,735,736 | | | $ | 1,249,228 | | | $ | 937,696 | | | $ | 572,484 | | | $ | 537,358 | |
| | | | | |
Ratios/Supplemental Data: | | | | | | | | | | | | | | | | | | | | |
Ratio of net expenses to average net assets | | | 1.04 | % | | | 1.07 | % | | | 1.12 | % | | | 1.19 | % | | | 1.16 | % |
Ratio of net investment income to average net assets | | | 1.45 | % | | | 1.26 | % | | | 1.27 | % | | | 1.68 | % | | | 1.68 | % |
Portfolio turnover rate | | | 58 | % | | | 36 | % | | | 36 | % | | | 31 | % | | | 72 | % |
| (a) | Calculated using the average shares method. |
| (b) | Amount rounds to less than $(0.005) per share. |
| | |
| See Notes to Financial Statements. | | |
| Annual Report | June 30, 2013 | | 39 |
| | |
| Financial Highlights | | James Balanced: Golden Rainbow Fund – Institutional Class |
For a share outstanding throughout the periods indicated. |
| | | | | | | | | | | | | | | | | | | | |
| | | For the
Year Ended
June 30, 2013 | | | For the
Year Ended
June 30, 2012 | | | For the
Year Ended
June 30, 2011 | | | For the
Year Ended
June 30, 2010 | | | For the
Period Ended
June 30, 2009 (a) | |
| | | | | |
Net asset value - beginning of year | | $ | 20.81 | | | $ | 20.61 | | | $ | 18.33 | | | $ | 16.69 | | | $ | 14.80 | |
Income from investment operations: | | | | | | | | | |
Net investment income | | | 0.38 | (b) | | | 0.33 | | | | 0.32 | | | | 0.34 | | | | 0.09 | |
Net realized and unrealized gain | | | 1.73 | | | | 0.52 | | | | 2.47 | | | | 1.65 | | | | 1.94 | |
Total from investment operations | | | 2.11 | | | | 0.85 | | | | 2.79 | | | | 1.99 | | | | 2.03 | |
| | | | | |
Less distributions: | | | | | | | | | | | | | | | | | | | | |
From net investment income | | | (0.42) | | | | (0.35) | | | | (0.35) | | | | (0.35) | | | | (0.14) | |
From net realized gain on investments | | | (0.15) | | | | (0.30) | | | | (0.16) | | | | – | | | | – | |
Total distributions | | | (0.57) | | | | (0.65) | | | | (0.51) | | | | (0.35) | | | | (0.14) | |
Paid-in capital from redemption fees | | | 0.00 | (c) | | | – | | | | – | | | | – | | | | – | |
Net asset value at end of year | | $ | 22.35 | | | $ | 20.81 | | | $ | 20.61 | | | $ | 18.33 | | | $ | 16.69 | |
| | | | | | | | | | | | | | | | | | | | | |
| | | | | |
Total return | | | 10.26 | % | | | 4.22 | % | | | 15.27 | % | | | 11.94 | % | | | 13.75 | %(d) |
| | | | | |
Net assets, end of year
(in thousands) | | $ | 555,766 | | | $ | 304,731 | | | $ | 130,870 | | | $ | 60,693 | | | $ | 115 | |
| | | | | |
Ratios/Supplemental Data: | | | | | | | | | | | | | | | | | | | | |
Ratio of net expenses to average net assets | | | 0.79 | % | | | 0.82 | % | | | 0.87 | % | | | 1.06 | % | | | 0.95 | %(e) |
Ratio of net investment income to average net assets | | | 1.71 | % | | | 1.52 | % | | | 1.52 | % | | | 2.06 | % | | | 1.63 | %(e) |
Portfolio turnover rate | | | 58 | % | | | 36 | % | | | 36 | % | | | 31 | % | | | 72 | %(d) |
| (a) | Share class commenced operations on March 2, 2009. |
| (b) | Calculated using the average shares method. |
| (c) | Amount rounds to less than $0.005 per share. |
| | |
| See Notes to Financial Statements. | | |
| 40 | | www.jamesfunds.com |
| | |
| James Small Cap Fund | | Financial Highlights |
| For a share outstanding throughout the periods indicated. |
| | | | | | | | | | | | | | | | | | | | |
| | | For the
Year Ended
June 30, 2013 | | | For the
Year Ended
June 30, 2012 | | | For the
Year Ended
June 30, 2011 | | | For the
Year Ended
June 30, 2010 | | | For the
Year Ended
June 30, 2009 | |
| | | | | |
Net asset value - beginning of year | | $ | 23.89 | | | $ | 23.88 | | | $ | 17.51 | | | $ | 14.18 | | | $ | 20.04 | |
Income/(Loss) from investment operations: | | | | | |
Net investment income | | | 0.36 | (a) | | | 0.15 | | | | 0.05 | | | | 0.02 | | | | 0.06 | |
Net realized and unrealized gain/(loss) | | | 4.92 | | | | (0.11) | | | | 6.35 | | | | 3.33 | | | | (5.86) | |
Total from investment operations | | | 5.28 | | | | 0.04 | | | | 6.40 | | | | 3.35 | | | | (5.80) | |
| | | | | |
Less distributions: | | | | | | | | | | | | | | | | | | | | |
From net investment income | | | (0.51) | | | | (0.03) | | | | (0.03) | | | | – | | | | (0.06) | |
From net tax return of capital | | | – | | | | – | | | | – | | | | (0.02) | | | | – | |
Total distributions | | | (0.51) | | | | (0.03) | | | | (0.03) | | | | (0.02) | | | | (0.06) | |
Net asset value at end of year | | $ | 28.66 | | | $ | 23.89 | | | $ | 23.88 | | | $ | 17.51 | | | $ | 14.18 | |
| | | | | | | | | | | | | | | | | | | | | |
| | | | | |
Total return | | | 22.51 | % | | | 0.16 | % | | | 36.59 | % | | | 23.61 | % | | | (28.91 | )% |
| | | | | |
Net assets, end of year
(in thousands) | | $ | 161,271 | | | $ | 134,727 | | | $ | 81,505 | | | $ | 65,443 | | | $ | 99,801 | |
| | | | | |
Ratios/Supplemental Data: | | | | | | | | | | | | | | | | | | | | |
Ratio of net expenses to average net assets | | | 1.50 | % | | | 1.50 | % | | | 1.50 | % | | | 1.50 | % | | | 1.50 | % |
Ratio of net investment income to average net assets | | | 1.39 | % | | | 0.58 | % | | | 0.23 | % | | | 0.08 | % | | | 0.37 | % |
Portfolio turnover rate | | | 41 | % | | | 89 | % | | | 60 | % | | | 38 | % | | | 46 | % |
| (a) | Calculated using the average shares method. |
| | |
| See Notes to Financial Statements. | | |
| Annual Report | June 30, 2013 | | 41 |
| | |
| Financial Highlights | | James Mid Cap Fund |
For a share outstanding throughout the periods indicated. |
| | | | | | | | | | | | | | | | | | | | |
| | | For the
Year Ended
June 30, 2013 | | | For the
Year Ended
June 30, 2012 | | | For the
Year Ended
June 30, 2011 | | | For the
Year Ended
June 30, 2010 | | | For the
Year Ended
June 30, 2009 | |
| | | | | |
Net asset value - beginning of year | | $ | 10.69 | | | $ | 11.38 | | | $ | 8.59 | | | $ | 7.05 | | | $ | 10.66 | |
Income/(Loss) from investment operations: | | | | | |
Net investment income | | | 0.08 | (a) | | | 0.04 | | | | 0.01 | | | | 0.02 | | | | 0.03 | |
Net realized and unrealized gain/(loss) | | | 2.23 | | | | (0.64) | | | | 2.82 | | | | 1.54 | | | | (3.61) | |
Total from investment operations | | | 2.31 | | | | (0.60) | | | | 2.83 | | | | 1.56 | | | | (3.58) | |
| | | | | |
Less distributions: | | | | | | | | | | | | | | | | | | | | |
From net investment income | | | (0.03) | | | | (0.09) | | | | (0.04) | | | | (0.02) | | | | (0.03) | |
Total distributions | | | (0.03) | | | | (0.09) | | | | (0.04) | | | | (0.02) | | | | (0.03) | |
Net asset value at end of year | | $ | 12.97 | | | $ | 10.69 | | | $ | 11.38 | | | $ | 8.59 | | | $ | 7.05 | |
| | | | | | | | | | | | | | | | | | | | | |
| | | | | |
Total return | | | 21.68 | % | | | (5.26 | )% | | | 32.97 | % | | | 22.13 | % | | | (33.51 | )% |
| | | | | |
Net assets, end of year
(in thousands) | | $ | 14,643 | | | $ | 12,657 | | | $ | 13,403 | | | $ | 9,497 | | | $ | 4,438 | |
| | | | | |
Ratios/Supplemental Data: | | | | | | | | | | | | | | | | | | | | |
Ratio of net expenses to average net assets | | | 1.50 | % | | | 1.50 | % | | | 1.50 | % | | | 1.50 | % | | | 1.50 | % |
Ratio of net investment income to average net assets | | | 0.64 | % | | | 0.32 | % | | | 0.13 | % | | | 0.24 | % | | | 0.48 | % |
Portfolio turnover rate | | | 26 | % | | | 36 | % | | | 56 | % | | | 37 | % | | | 38 | % |
| (a) | Calculated using the average shares method. |
| | |
| See Notes to Financial Statements. | | |
| 42 | | www.jamesfunds.com |
| | |
| James Micro Cap Fund | | Financial Highlights |
| For a share outstanding throughout the periods indicated. |
| | | | | | | | | | | | |
| | | For the
Year Ended
June 30, 2013 | | | For the
Year Ended
June 30, 2012 | | | For the
Year Ended
June 30, 2011 (a) | |
| | | |
Net asset value - beginning of year | | $ | 11.71 | | | $ | 11.91 | | | $ | 10.00 | |
Income/(Loss) from investment operations: | | | | | |
Net investment income/(loss) | | | 0.14 | (b) | | | (0.01) | | | | (0.03) | |
Net realized and unrealized gain/(loss) | | | 2.25 | | | | (0.13) | | | | 1.94 | |
Total from investment operations | | | 2.39 | | | | (0.14) | | | | 1.91 | |
| | | |
Less distributions: | | | | | | | | | | | | |
From net investment income | | | (0.14) | | | | – | | | | – | |
From net realized gain on investments | | | – | | | | (0.06) | | | | – | |
Total distributions | | | (0.14) | | | | (0.06) | | | | – | |
Paid-in capital from redemption fees | | | 0.00 | (c) | | | 0.00 | (c) | | | – | |
Net asset value at end of year | | $ | 13.96 | | | $ | 11.71 | | | $ | 11.91 | |
| | | | | | | | | | | | | |
| | | |
Total return | | | 20.64 | % | | | (1.15 | )% | | | 19.10 | % |
| | | |
Net assets, end of year
(in thousands) | | $ | 11,817 | | | $ | 10,173 | | | $ | 9,745 | |
| | | |
Ratios/Supplemental Data: | | | | | | | | | | | | |
Ratio of net expenses to average net assets | | | 1.50 | % | | | 1.50 | % | | | 1.50 | % |
Ratio of net investment income/(loss) to average net assets | | | 1.12 | % | | | (0.14 | )% | | | (0.31 | )% |
Portfolio turnover rate | | | 46 | % | | | 85 | % | | | 69 | % |
| (a) | Fund commenced operations on July 1, 2010. |
| (b) | Calculated using the average shares method. |
| (c) | Amount rounds to less than $0.005 per share. |
| | |
| See Notes to Financial Statements. | | |
| Annual Report | June 30, 2013 | | 43 |
| | |
| Financial Highlights | | James Long-Short Fund |
For a share outstanding throughout the periods indicated. | | |
| | | | | | | | | | | | |
| | | For the
Year Ended
June 30, 2013 | | | For the
Year Ended
June 30, 2012 | | | For the
Period Ended
June 30, 2011 (a) | |
| | | |
Net asset value - beginning of year | | $ | 9.99 | | | $ | 10.10 | | | $ | 10.00 | |
Income/(Loss) from investment operations: | | | | | |
Net investment income/(loss) | | | 0.04 | (b) | | | (0.04) | | | | (0.00) | (c) |
Net realized and unrealized gain/(loss) | | | 1.71 | | | | (0.05) | | | | 0.10 | |
Total from investment operations | | | 1.75 | | | | (0.09) | | | | 0.10 | |
| | | |
Less distributions: | | | | | | | | | | | | |
From net investment income | | | (0.04) | | | | (0.02) | | | | – | |
Total distributions | | | (0.04) | | | | (0.02) | | | | – | |
Net asset value at end of year | | $ | 11.70 | | | $ | 9.99 | | | $ | 10.10 | |
| | | | | | | | | | | | | |
| | | |
Total return | | | 17.57 | % | | | (0.93 | )% | | | 1.00 | %(d) |
| | | |
Net assets, end of year
(in thousands) | | $ | 15,694 | | | $ | 9,160 | | | $ | 10,718 | |
| | | |
Ratios/Supplemental Data: | | | | | | | | | | | | |
Ratio of net expenses to average net assets(e) | | | 2.70 | % | | | 2.66 | % | | | 1.73 | %(f) |
Ratio of net investment income/(loss) to average net assets | | | 0.35 | % | | | (0.44 | )% | | | (1.03 | )%(f) |
Portfolio turnover rate | | | 58 | % | | | 159 | % | | | 0 | %(d) |
| (a) | Fund commenced operations on May 23, 2011. |
| (b) | Calculated using the average shares method. |
| (c) | Amount rounds to less than $0.005 per share. |
| (e) | Dividend and interest expense on securities sold short and interest expense totaled 1.20%, 1.15% and 0.23% (annualized) of average net assets for the years ended June 30, 2013 and June 30, 2012 and for the period ended June 30, 2011, respectively. |
| | |
| See Notes to Financial Statements. | | |
| 44 | | www.jamesfunds.com |
| | |
| James Advantage Funds | | Notes to Financial Statements |
| | June 30, 2013 |
1. ORGANIZATION
The James Advantage Funds (the “Trust”) is an open-end management investment company that was organized as an Ohio business trust on August 29, 1997. The Trust is registered under the Investment Company Act of 1940, as amended (the “1940 Act”). James Balanced: Golden Rainbow Fund, James Small Cap Fund, James Mid Cap Fund and James Micro Cap Fund are each a diversified series of the Trust, and James Long-Short Fund is a non-diversified series of the Trust (individually a “Fund,” collectively the “Funds”). James Balanced: Golden Rainbow Fund was originally organized as a series of the Flagship Admiral Funds Inc., a Maryland corporation. On June 26, 1998, pursuant to an Agreement and Plan of Reorganization, James Balanced: Golden Rainbow Fund was restructured through a tax-free reorganization as a series of the Trust. The James Small Cap Fund commenced its public offering of shares on October 2, 1998. The James Mid Cap Fund commenced its public offering of shares on June 30, 2006. Effective March 2, 2009, James Balanced: Golden Rainbow began offering a new class of shares: the Institutional Class. The initial class of shares is now referred to as the Retail Class. Each class of James Balanced: Golden Rainbow Fund represents an interest in the same portfolio of investments and has the same rights, but differs primarily in distribution fees and shareholder features. The Retail Class shares are subject to distribution (12b-1) fees but have a lower minimum investment requirement and offer certain shareholder services not available to Institutional Class shareholders. The Institutional Class shares are not subject to distribution (12b-1) fees and are available only through investment advisers and bank trust departments that have made arrangements for shares of all of their clients investing in the Fund to be held in an omnibus account (as well as other entities that are approved by management of the Trust). The James Micro Cap Fund commenced its public offering of shares on July 1, 2010. The James Long-Short Fund commenced its public offering of shares on May 23, 2011.
James Balanced: Golden Rainbow Fund seeks to provide total return through a combination of growth and income and preservation of capital in declining markets. The Fund seeks to achieve its objective by investing primarily in common stocks and/or debt securities that the Fund’s adviser, James Investment Research, Inc. (“James” or the “Adviser”), believes are undervalued.
James Small Cap Fund seeks to provide long-term capital appreciation. The Fund seeks to achieve its objective by investing primarily in common stocks of small capitalization companies. The Adviser defines small capitalization as those companies with market capitalizations at the time of purchase no larger than the stocks in the Fund’s benchmark, the Russell 2000® Index.
James Mid Cap Fund seeks to provide long-term capital appreciation. The Fund seeks to achieve its objective by investing primarily in common stocks of mid capitalization companies. The Adviser defines mid capitalization companies as those with market capitalizations at the time of purchase as $1 billion to $8 billion.
James Micro Cap Fund seeks to provide long-term capital appreciation. The Fund seeks to achieve its objective by investing
primarily in common stocks of micro capitalization companies. Micro capitalization companies are defined as those companies with market capitalizations at the time of purchase no larger than $250 million.
James Long-Short Fund seeks to provide long-term capital appreciation. The Fund seeks to achieve its objective by investing primarily in foreign and domestic equity securities that the Adviser believes are undervalued and more likely to appreciate, and by selling short equity securities that the Adviser believes are overvalued and more likely to depreciate. The Fund also may take long positions in domestic and foreign fixed income securities that the Adviser believes are more likely to appreciate in the interest rate and spread environment anticipated by the Adviser, and short positions in fixed income securities that the Adviser believes are more likely to depreciate in the interest rate and spread environment anticipated by the Adviser. The Fund seeks to achieve positive returns on both the long positions and short positions that it takes in various securities.
2. SIGNIFICANT ACCOUNTING POLICIES
The following is a summary of significant accounting policies followed by the Funds in preparation of their financial statements, in accordance with accounting principles generally accepted in the United States of America (“GAAP”).
Share Valuation
The net asset value per share of each Fund, other than the James Balanced: Golden Rainbow Fund, is calculated daily by dividing the total value of the Fund’s assets, less liabilities, by the number of shares outstanding. The net asset value per share of each class of shares of the James Balanced: Golden Rainbow Fund is calculated daily by dividing the total value of the Fund’s assets attributable to that class, less liabilities attributable to that class, by the number of outstanding shares of that class. The offering price and redemption price per share is equal to the net asset value per share, except that shares of the James Micro Cap Fund are subject to a redemption fee of 2% if redeemed within 180 days of purchase. Redemption fees received by the James Micro Cap Fund were $183 and $135 for years ended June 30, 2012 and June 30, 2013, respectively. The redemption fee is reflected in the “Payment for shares redeemed, net of redemption fees” in the Statements of Changes in Net Assets.
Securities Valuation
Securities are valued at fair value. The Funds’ portfolio securities, including short positions, are valued as of the close of the New York Stock Exchange (“NYSE”) (generally, 4:00 p.m., Eastern time) on each day that the NYSE is open for business. Equity securities that are traded on any exchange, including closed-end funds and exchange-traded funds, are valued at the last quoted sale price on the exchange or market in which such securities are principally traded. Lacking a last sale price, a security is valued at its last bid price except when, in James’s opinion, the last bid price does not accurately reflect the current value of the security. Securities that are traded on the NASDAQ® over-the-counter market are valued at their NASDAQ® Official Closing Price (“NOCP”) for all NASDAQ® National Market (“NNM”) and NASDAQ® Capital Market® securities. When market
| | |
| | | |
| Annual Report | June 30, 2013 | | 45 |
| | |
| Notes to Financial Statements | | James Advantage Funds |
June 30, 2013 | | |
quotations are not readily available, if an event occurs after the close of the trading market (but before the time as of which a Fund calculates its net asset value) that materially affects a security’s value, when James determines that the market quotation does not accurately reflect the current value or when a non-144A restricted security is being valued, that security will be valued at its fair value as determined in good faith in conformity with guidelines adopted by and subject to review of the Board of Trustees. The Funds may use pricing services to determine market value for securities. Fixed income securities will be valued at evaluated prices provided by an independent, recognized pricing service, which determines valuations based upon market transactions for normal, institutional-size trading units of securities or a matrix method which considers yield or price of comparable bonds provided by a pricing service. If the Adviser decides that a price provided by the pricing service does not accurately reflect the fair market value of the securities or when prices are not readily available from a pricing service, those securities will be priced at fair value as determined in good faith by the Adviser. Short-term investments in fixed-income securities with maturities of less than 60 days when acquired, or which subsequently are within 60 days of maturity, are valued by using the amortized cost method of valuation, which the Board of Trustees has determined will approximate fair value. Shares of open-end investment companies are valued at net asset value.
For valuation purposes, quotations of foreign securities in a foreign currency are converted to U.S. dollar equivalents at the time of pricing the Funds. In computing the net asset value of the Funds by the fund accounting service provider, ALPS Fund Services, Inc., the values of foreign portfolio securities are generally based upon market quotations which, depending upon the exchange or market, may be last sale price, last bid price or the average of the last bid and asked prices as of, in each case, the close of the appropriate exchange or another designated time.
The calculation of the share price of each Fund that holds foreign securities in its portfolio does not take place contemporaneously with the determination of the values of many of the foreign portfolio securities used in such calculation. Events affecting the values of foreign portfolio securities that occur between the time their prices are determined and the calculation of a Fund’s share price will be taken into account by the Adviser, subject to review by the Board of Trustees, in the determination of the value of those securities.
In accordance with the Trust’s good faith pricing guidelines, James is required to consider all appropriate factors relevant to the value of securities for which it has determined other pricing sources are not available or reliable as described above. There is no single standard for determining fair value, since fair value depends upon the circumstances of each individual case. As a general principle, the current fair value of an issue of securities being valued by the Adviser would appear to be the amount that the owner might reasonably expect to receive for them upon their current sale. Methods which are in accordance with this principle may, for example, be based on (i) a multiple of earnings, (ii) a discount from market of a similar freely traded security (including a derivative security or a basket of securities traded on other markets, exchanges or among dealers), or (iii) yield to maturity with respect to debt issues, or a combination of these and other methods.
Various inputs are used in determining the value of the Funds’ investments. These inputs are summarized in the three broad levels listed below:
| | |
Level 1 - | | Unadjusted quoted prices in active markets for identical, unrestricted assets or liabilities that a Fund has the ability to access at the measurement date; |
Level 2 - | | Quoted prices which are not active, quoted prices for similar assets or liabilities in active markets or inputs other than quoted prices that are observable (either directly or indirectly) for substantially the full term of the asset or liability; and |
Level 3 - | | Significant unobservable prices or inputs (including a Fund’s own assumptions in determining the fair value of investments) where there is little or no market activity for the asset or liability at the measurement date. |
The inputs or methodologies used for valuing securities are not necessarily an indication of the risk associated with investing in those securities. For example, securities maturing within 60 days of the reporting date are valued using amortized cost, in accordance with rules under the 1940 Act. Generally, amortized cost approximates the current fair value of a security, but since the value is not obtained from a quoted price in an active market, such securities are reflected as Level 2.
| | |
| James Advantage Funds | | Notes to Financial Statements |
| | June 30, 2013 |
The following is a summary of the inputs used to value the Funds’ investments as of June 30, 2013:
James Balanced: Golden Rainbow Fund
| | | | | | | | | | | | | | | | |
| | | Valuation Inputs | | | | | |
Investments in Securities at Value* | | | Level 1 | | | | Level 2 | | | | Level 3 | | | | Total | |
Common Stocks | | $ | 979,867,169 | | | $ | – | | | $ | – | | | $ | 979,867,169 | |
Closed-End Funds | | | 2,374,235 | | | | – | | | | – | | | | 2,374,235 | |
Exchange Traded Funds | | | 20,986,952 | | | | – | | | | – | | | | 20,986,952 | |
Corporate Bonds | | | – | | | | 205,533,462 | | | | – | | | | 205,533,462 | |
Mortgage Backed Securities | | | – | | | | 31,339,126 | | | | – | | | | 31,339,126 | |
U.S. Government Agencies | | | – | | | | 52,532,800 | | | | – | | | | 52,532,800 | |
U.S. Treasury Bonds & Notes | | | 714,953,343 | | | | – | | | | – | | | | 714,953,343 | |
Foreign Bonds | | | – | | | | 61,071,691 | | | | – | | | | 61,071,691 | |
Municipal Bonds | | | – | | | | 59,066,727 | | | | – | | | | 59,066,727 | |
Short Term Investments | | | 148,206,762 | | | | – | | | | – | | | | 148,206,762 | |
Total | | $ | 1,866,388,461 | | | $ | 409,543,806 | | | $ | – | | | $ | 2,275,932,267 | |
| | | | | | | | | | | | | | | | | |
| | | | |
James Small Cap Fund | | | | | | | | | | | | | | | | |
| | | Valuation Inputs | | | | | |
Investments in Securities at Value* | | | Level 1 | | | | Level 2 | | | | Level 3 | | | | Total | |
Common Stocks | | $ | 149,325,876 | | | $ | – | | | $ | – | | | $ | 149,325,876 | |
Short Term Investments | | | 11,403,676 | | | | – | | | | – | | | | 11,403,676 | |
Total | | $ | 160,729,552 | | | $ | – | | | $ | – | | | $ | 160,729,552 | |
| | | | | | | | | | | | | | | | | |
| | | | |
James Mid Cap Fund | | | | | | | | | | | | | | | | |
| | | Valuation Inputs | | | | | |
Investments in Securities at Value* | | | Level 1 | | | | Level 2 | | | | Level 3 | | | | Total | |
Common Stocks | | $ | 13,563,943 | | | $ | – | | | $ | – | | | $ | 13,563,943 | |
Exchange Traded Funds | | | 249,922 | | | | – | | | | – | | | | 249,922 | |
Short Term Investments | | | 1,322,774 | | | | – | | | | – | | | | 1,322,774 | |
Total | | $ | 15,136,639 | | | $ | – | | | $ | – | | | $ | 15,136,639 | |
| | | | | | | | | | | | | | | | | |
| | | | |
James Micro Cap Fund | | | | | | | | | | | | | | | | |
| | | Valuation Inputs | | | | | |
Investments in Securities at Value* | | | Level 1 | | | | Level 2 | | | | Level 3 | | | | Total | |
Common Stocks | | $ | 11,426,754 | | | $ | – | | | $ | – | | | $ | 11,426,754 | |
Short Term Investments | | | 398,855 | | | | – | | | | – | | | | 398,855 | |
Total | | $ | 11,825,609 | | | $ | – | | | $ | – | | | $ | 11,825,609 | |
| | | | | | | | | | | | | | | | | |
| | | | |
James Long-Short Fund | | | | | | | | | | | | | | | | |
| | | Valuation Inputs | | | | | |
Investments in Securities at Value* | | | Level 1 | | | | Level 2 | | | | Level 3 | | | | Total | |
Common Stocks | | $ | 14,814,313 | | | $ | – | | | $ | – | | | $ | 14,814,313 | |
Exchange Traded Funds | | | 175,049 | | | | – | | | | – | | | | 175,049 | |
Short Term Investments | | | 2,887,239 | | | | – | | | | – | | | | 2,887,239 | |
Total | | $ | 17,876,601 | | | $ | – | | | $ | – | | | $ | 17,876,601 | |
| | | | | | | | | | | | | | | | | |
| | |
| | | |
| Annual Report | June 30, 2013 | | 47 |
| | |
| Notes to Financial Statements | | James Advantage Funds |
June 30, 2013 | | |
| | | | | | | | | | | | | | | | |
| | | Valuation Inputs | | | | | |
Other Financial Instruments* | | | Level 1 | | | | Level 2 | | | | Level 3 | | | | Total | |
Liabilities | | | | | | | | | | | | | | | | |
Securities Sold Short | | | | | | | | | | | | | | | | |
Common Stocks | | $ | (5,652,634 | ) | | $ | – | | | $ | – | | | $ | (5,652,634 | ) |
TOTAL | | $ | (5,652,634 | ) | | $ | – | | | $ | – | | | $ | (5,652,634 | ) |
| | | | | | | | | | | | | | | | | |
* For Detailed descriptions of sector and industry, see the accompanying Schedule of Investments.
For the year ended June 30, 2013, the Funds did not have any significant transfers between Level 1 and Level 2 securities.
For the year ended June 30, 2013, the Funds did not have any securities which used significant unobservable inputs (Level 3) used in determining fair value.
Investment Transactions
Investment transactions are recorded on a trade date basis. Gains and losses are determined using the specific identification method, which liquidates all losses first, before any gains. Securities purchased or sold on a when-issued or delayed delivery basis may have extended settlement periods. Any securities so purchased are subject to market fluctuation during this period. The James Balanced: Golden Rainbow Fund will instruct its custodian to segregate assets in a separate account with a current value at least equal to the amount of its when-issued and delayed delivery purchase commitments. As of June 30, 2013, the Funds did not hold when-issued securities or delayed delivery purchase commitments.
Withholding taxes on foreign dividends have been provided for in accordance with the Trust’s understanding of the applicable country’s tax rules and rates.
Foreign Currency Translation
The market value of investment securities and other assets and liabilities denominated in foreign currencies are translated into U.S. dollars at the current exchange rate, provided by WM Reuters, at the close of each business day. Purchases and sales of securities, income receipts and expense payments are translated into U.S. dollars based at the exchange rate on the date of the transaction.
Reported net realized foreign exchange gains or losses arise from sales and maturities of short-term securities, sales of foreign currencies, currency gains or losses realized and between the trade and settlement dates on securities transactions, and the difference between the amounts of dividends, interest, and foreign withholding taxes recorded on the Funds’ books and the U.S. dollar equivalent of the amounts actually received or paid. Net unrealized foreign exchange gains and losses arise from the changes in the value of assets and liabilities including investments in securities at the reporting period, resulting from changes in the exchange rate.
Short Sales and Segregated Cash
The James Long-Short Fund may actively sell short equity and fixed income securities. Short sales are transactions in which the Fund sells a security it does not own in anticipation of a decline in the market value of that security. To complete such a transaction, the Fund must borrow the security to deliver to the buyer upon the short sale; the Fund is then obligated to replace the security borrowed by purchasing it in the open market at some later date.
The Fund will incur a loss if the market price of the security increases between the date of the short sale and the date on which the Fund replaces the borrowed security. The Fund will realize a gain if the
security declines in value between those dates. If a security sold short pays a dividend while the Fund is short that security, the Fund will pay the dividend to the prime broker and record that amount as an expense.
All short sales are collateralized, as required by the Fund’s prime broker. The Fund maintains the collateral in segregated accounts consisting of cash and/or high-grade liquid assets sufficient to collateralize the market value of its short positions.
Investment Income
Dividend income and dividend expense on long securities and securities sold short are recorded on the ex-dividend date. Interest income is determined on the basis of interest accrued, adjusted for amortization of premiums and accretion of discounts on all debt securities. Amortization and accretion is calculated using the effective yield method.
Dividend income includes dividends earned on Real Estate Investment Trusts (“REITS”), which may include a return of capital. As such, important taxation issues may arise, which the Funds account for when information is provided by the issuing REIT.
Due to the actual character of dividends paid by REITs not being available until the end of the calendar year, the net investment income and long-term capital gains of the Funds can be different on the tax return compared to this annual report. Substantial unanticipated levels of return of capital may affect the Funds’ earnings and profits from which distributions are made.
Distributions received from Limited Partnership investments of a Fund are usually recorded as a return of capital and are excluded from available income in the calculation of distributions paid by the Funds. Return of capital is recorded as a reduction to the cost of investments in the Statements of Assets and Liabilities and in the Schedule of Investments.
Dividends and Distributions to Shareholders
Net investment income, if any, is generally declared and distributed to shareholders of each Fund on at least an annual basis. Net realized capital gains from security transactions, if any, are distributed to shareholders not less frequently than annually. Furthermore, capital gains are distributed only to the extent they exceed available capital loss carryforwards. Distributions to shareholders of net investment income and net realized capital gains are recorded on the ex-dividend date. The amount and timing of distributions are determined in accordance with federal income tax regulations, which may differ from GAAP.
| | |
| James Advantage Funds | | Notes to Financial Statements |
| | June 30, 2013 |
Allocation of Income and Expense
Investment income earned, realized capital gains and losses, and unrealized appreciation and depreciation for the James Balanced: Golden Rainbow Fund is allocated daily to each class of shares based upon its proportionate share of total net assets of the Fund. Class-specific expenses are charged directly to the class incurring the expense. Common expenses, which are not attributable to a specific class, are allocated daily to each class of shares based upon its proportionate share of total net assets of the Fund. Expenses not directly billed to a particular Fund are allocated proportionally among all Funds daily in relation to net assets of each Fund or another reasonable measure.
Use of Estimates
The preparation of financial statements in conformity with GAAP requires management to make estimates and assumptions that affect the reported amounts of assets and liabilities and disclosure of contingent assets and liabilities at the date of the financial statements and the reported amounts of increases and decreases in net assets from operations during the reporting period. Actual results could differ from those estimates.
Federal Income Taxes
The Funds generally intend to distribute all taxable income and capital gains to shareholders, if any, and to otherwise continue to comply with the requirements of Subchapter M of the Internal Revenue Code of 1986, as amended, applicable to regulated investment companies. Therefore, no federal tax provision is required.
As of and during the year ended June 30, 2013, the Funds did not have a liability for any unrecognized tax benefits. The Funds file U.S. federal, state, and local tax returns as required. The Funds’ tax returns are subject to examination by the relevant tax authorities until expiration of the applicable statute of limitations, which is generally three years after the filing of the tax return for federal purposes and four years for most state returns. Tax returns for open years have incorporated no uncertain tax positions that require a provision for income taxes.
The following information is computed on a tax basis for each item as of June 30, 2013:
| | | | | | | | | | | | | | | | | | | | |
| | | James Balanced:
Golden Rainbow Fund | | | James Small Cap
Fund | | | James Mid Cap
Fund | | | James Micro Cap
Fund | | | James Long-Short
Fund | |
Tax cost of portfolio investments | | $ | 2,023,603,154 | | | $ | 119,194,855 | | | $ | 11,444,033 | | | $ | 8,051,886 | | | $ | 15,707,781 | |
| | | | | | | | | | | | | | | | | | | | | |
Gross unrealized appreciation | | $ | 285,183,422 | | | $ | 43,765,516 | | | $ | 3,906,244 | | | $ | 3,880,937 | | | $ | 2,770,038 | |
Gross unrealized depreciation | | | (32,854,309) | | | | (2,230,819) | | | | (213,638) | | | | (107,214) | | | | (601,218) | |
Net depreciation of foreign currency and derivatives | | | (38,885) | | | | – | | | | – | | | | – | | | | (29,757) | |
Net unrealized appreciation | | | 252,290,228 | | | | 41,534,697 | | | | 3,692,606 | | | | 3,773,723 | | | | 2,139,063 | |
Accumulated capital gains/(losses) | | | 24,473,119 | | | | (42,225,789) | | | | 445,575 | | | | (1,180,862) | | | | (830,504) | |
Accumulated net investment income | | | – | | | | 3,316,586 | | | | 44,964 | | | | 14,354 | | | | – | |
Other cumulative differences | | | (56,459) | | | | – | | | | – | | | | – | | | | (27,971) | |
Accumulated earnings | | $ | 276,706,888 | | | $ | 2,625,494 | | | $ | 4,183,145 | | | $ | 2,607,215 | | | $ | 1,280,588 | |
| | | | | | | | | | | | | | | | | | | | | |
The difference between the cost of portfolio investments on a tax basis and financial statement cost for the Funds is due primarily to the deferral of wash sale losses and to the differing treatment of certain investments under income tax regulations and GAAP.
The tax character of distributions paid for the year ended June 30, 2013 was as follows:
| | | | | | | | | | | | | | | | | | | | |
| | | James Balanced:
Golden Rainbow
Fund | | | James Small Cap
Fund | | | James Mid Cap
Fund | | | James Micro Cap
Fund | | | James Long-Short
Fund | |
Ordinary Income | | $ | 28,110,016 | | | $ | 2,605,549 | | | $ | 40,000 | | | $ | 119,999 | | | $ | 35,250 | |
Long-Term Capital Gains | | | 12,243,493 | | | | – | | | | – | | | | – | | | | – | |
Total | | $ | 40,353,509 | | | $ | 2,605,549 | | | $ | 40,000 | | | $ | 119,999 | | | $ | 35,250 | |
| | | | | | | | | | | | | | | | | | | | | |
| | |
| | | |
| Annual Report | June 30, 2013 | | 49 |
| | |
| Notes to Financial Statements | | James Advantage Funds |
June 30, 2013 | | |
The tax character of distributions paid for the year ended June 30, 2012 was as follows:
| | | | | | | | | | | | | | | | | | | | |
| | | James Balanced:
Golden Rainbow
Fund | | | James Small Cap
Fund | | | James Mid Cap
Fund | | | James Micro Cap
Fund | | | James Long-Short Fund | |
| |
From Ordinary Income | | $ | 16,610,717 | | | $ | 159,992 | | | $ | 106,000 | | | $ | 38,453 | | | $ | 12,000 | |
From Long-Term Capital Gains | | | 18,438,948 | | | | – | | | | – | | | | 2,528 | | | | – | |
| |
Total | | $ | 35,049,665 | | | $ | 159,992 | | | $ | 106,000 | | | $ | 40,981 | | | $ | 12,000 | |
| |
| |
Reclassification of Capital Accounts
Reclassifications result primarily from the differences in the book and tax treatment of certain investments such as partnerships, Passive Foreign Investment Companies (“PFICs”), and grantor trusts, as well as distributions in excess of net investment income. The following reclassifications have been made on the Statements of Assets and Liabilities and have no impact on the net assets or net asset value of the Funds:
| | | | | | | | | | | | | | | | | | | | |
| | | James Balanced:
Golden Rainbow
Fund | | | James Small Cap
Fund | | | James Mid Cap
Fund | | | James Micro Cap
Fund | | | James Long-Short
Fund | |
| |
Paid-in capital | | $ | 752,034 | | | $ | (1,161 | ) | | $ | (14 | ) | | $ | – | | | $ | (327 | ) |
Accumulated net investment income/(loss) | | | 312,214 | | | | 3,288,713 | | | | (4,993 | ) | | | (27,214 | ) | | | 10,162 | |
Accumulated net realized gain/(loss) | | | (1,064,248 | ) | | | (3,287,552 | ) | | | 5,007 | | | | 27,214 | | | | (9,835 | ) |
Post-Enactment Capital Losses
The Regulated Investment Company Modernization Act of 2010 (the “Act”) eliminated the eight-year limit on the use of capital loss carryforwards that arise in taxable years beginning after its enactment date of December 22, 2010. Consequently, capital losses incurred in the Funds’ taxable years beginning before the taxable year ended June 30, 2012 with an expiration date may not be used to offset capital gains until all net capital losses incurred in taxable years beginning with the taxable year ended June 30, 2012 without an expiration date have been utilized. As a result, post-enactment capital loss carryforwards will retain their character as either short-term or long-term capital losses instead of as short-term capital losses as under prior law. The Funds’ ability to utilize capital loss carryforwards in the future may be limited under the Internal Revenue Code and related regulations based on the results of future transactions.
During the year ended June 30, 2013, James Balanced: Golden Rainbow Fund and James Mid Cap Fund each utilized capital loss carryovers in the amount of $265,503 and $142,502, respectively.
Capital losses deferred to next tax year under the provisions of the Act were as follows:
| | | | | | | | |
| | | Short Term | | | Long Term | |
| |
James Small Cap Fund | | $ | 1,170,293 | | | $ | – | |
James Micro Cap Fund | | | 897,692 | | | | – | |
James Long-Short Fund | | | 599,538 | | | | 24,006 | |
The Funds elect to defer to the period ending June 30, 2014 capital losses recognized during the period November 1, 2012 through June 30, 2013 in the amount of:
| | | | |
| | | Amount | |
| |
James Small Cap Fund | | $ | 532,678 | |
James Micro Cap Fund | | | 283,170 | |
James Long-Short Fund | | | 206,960 | |
The Funds elect to defer to the period ending June 30, 2014 late year ordinary losses in the amount of:
| | | | |
| | | Amount | |
| |
James Long-Short Fund | | $ | 27,971 | |
The capital loss carryforwards remaining as of June 30, 2013 in the table below expire as follows:
| | | | | | | | |
| | | Amount | | | Expiration Date | |
| |
James Small Cap Fund | | $ | 18,052,132 | | | | June 30, 2017 | |
James Small Cap Fund | | | 22,470,686 | | | | June 30, 2018 | |
The capital loss carryforwards may be utilized in future years to offset net realized capital gains, if any, prior to distributing such gains to shareholders.
| | |
| James Advantage Funds | | Notes to Financial Statements |
| | June 30, 2013 |
3. INVESTMENT TRANSACTIONS
Purchases and sales (including maturities) of investments in long-term U.S. Government obligations for the year ended June 30, 2013 were as follows:
| | | | | | | | |
| | | Purchases | | | Sales | |
| |
James Balanced: | | | | | | | | |
Golden Rainbow Fund | | $ | 888,149,748 | | | $ | 669,746,606 | |
| |
Purchases and sales (including maturities) of investments in other long-term securities for the year ended June 30, 2013 were as follows:
| | | | | | | | |
| | | Purchases | | | Sales | |
| |
James Balanced: | | | | | | | | |
Golden Rainbow Fund | | $ | 607,957,741 | | | $ | 359,039,012 | |
| |
James Small Cap Fund | | | 54,782,773 | | | | 59,865,867 | |
| |
James Mid Cap Fund | | | 3,496,986 | | | | 4,100,246 | |
| |
James Micro Cap Fund | | | 4,685,176 | | | | 4,738,646 | |
| |
James Long-Short Fund | | | 9,802,990 | | | | 6,019,358 | |
| |
For the year ended June 30, 2013, the cost of securities purchased to cover short sales and the proceeds from securities sold short were $20,486,320 and $19,671,858, respectively, for the Long-Short Fund.
| 4. | MANAGEMENT FEE AND OTHER TRANSACTIONS WITH AFFILIATES |
Investment Management Agreement
The Funds retain James to manage the Funds’ investments. The investment decisions for the Funds are made by a committee of James’ personnel, which is primarily responsible for the day-to-day management of each Fund’s portfolio. James Balanced: Golden Rainbow Fund is authorized to pay James a fee equal to an annual rate of 0.74% of its average daily net assets for assets up to and including $500 million; at the annual rate of 0.70% of the average daily net assets for assets from $500 million up to and including $1 billion; at the annual rate of 0.65% of the average daily net assets for assets from $1 billion up to and including $2 billion; and at the annual rate of 0.60% of the average daily net assets for assets over $2 billion.
James is authorized to receive a fee equal to an annual rate of 1.25% of the average daily net assets of the James Small Cap Fund, James Mid Cap Fund and the James Long-Short Fund, respectively, for net assets up to and including $500 million; 1.20% of average daily assets for net assets from $500 million up to and including $1 billion; 1.15% of the average daily assets for net assets from $1 billion to and including $2 billion; and 1.10% of the daily average net assets over $2 billion. James is authorized to receive a fee equal to 1.50% of James Micro Cap Fund average daily assets for net assets up to and including $500 million and 1.45% of average daily assets for net assets over $500 million. Advisory fees for the James Small Cap, James Mid Cap Fund, James Micro Cap Fund and James Long-Short Fund are reduced by the fees and expenses of the non-interested person trustees incurred by the applicable Fund.
James is responsible for the payment of all operating expenses of the James Small Cap Fund, James Mid Cap Fund, James Micro Cap Fund and James Long-Short Fund, except for brokerage fees and commissions, taxes, interest (including dividend expense on securities sold short), fees and expenses of non-interested person trustees, 12b-1 expenses and extraordinary expenses.
Administrative Services Agreement
ALPS Fund Services, Inc. (“ALPS” or the “Administrator”) serves as administrator to the Funds. ALPS receives a monthly fee paid by James Balanced: Golden Rainbow Fund, for itself, and paid by James for the James Small Cap Fund, James Mid Cap Fund, James Micro Cap Fund and James Long-Short Fund, subject to a minimum monthly fee. Pursuant to an administrative agreement, ALPS will provide operational services to the Funds including, but not limited to fund accounting and fund administration and generally assist in each Fund’s operations.
Transfer Agency and Services Agreement
ALPS, pursuant to a Transfer Agency and Services Agreement with the Trust, serves as Transfer Agent for the Funds. Under the Transfer Agency and Services Agreement, ALPS receives an annual minimum fee, a fee based upon the number of shareholder accounts, and is also reimbursed for out-of-pocket expenses. These fees and reimbursements for out of pocket expenses are paid and reimbursed by James Balanced: Golden Rainbow Fund, for itself, and by James, for the James Small Cap Fund, James Mid Cap Fund, James Micro Cap Fund and James Long-Short Fund.
Plans of Distribution
Each Fund (only the Retail Class of the James Balanced: Golden Rainbow Fund), other than the James Micro Cap Fund, has adopted a plan pursuant to Rule 12b-1 under the 1940 Act (collectively, the “Plans”) under which each Fund may incur expenses related to distribution of its shares and for services provided to shareholders. Payments under a Plan are made to James, which uses them to pay distribution and shareholder service expenses on behalf of and as agent of the Fund. The amount payable by each Fund (the Retail Class of the James Balanced: Golden Rainbow Fund), other than the James Micro Cap Fund, under its Plan is 0.25% of its average daily net assets for the year. The Plans are compensation plans, which means that payments are made to James regardless of 12b-1 expenses actually incurred. Therefore, payments under a Plan may exceed distribution and shareholder service expenses incurred pursuant to the Plan, and James is permitted to retain the excess. It is also possible that 12b-1 expenses paid by James for a period will exceed the payments received by James, in which case James may pay such excess expenses out of its own resources. Payments received by James under the Plans are in addition to the fees paid to James pursuant to the Management Agreements. The Plans require that James act in the Funds’ best interests in expending the payments it receives from the Funds and use payments solely for the purpose of paying distribution and shareholder services expenses on behalf of the Funds. The Funds’ Distributor, ALPS Distributors, Inc., validates all payment amounts to be made to brokers that have properly executed dealer agreements with the Funds before James will make such payments. The expenses of the Funds’ Plans are reflected as 12b-1 distribution and service fees – Retail Class on the Statements of Operations.
| | |
| | | |
| Annual Report | June 30, 2013 | | 51 |
| | |
| Notes to Financial Statements | | James Advantage Funds |
June 30, 2013 | | |
| 5. | COMMITMENTS AND CONTINGENCIES |
The Funds indemnify the Trust’s officers and trustees for certain liabilities that might arise from their performance of their duties to the Funds. Additionally, in the normal course of business, the Funds enter into contracts that contain a variety of representations and warranties and that provide general indemnifications. The Funds’ maximum exposure under these arrangements is unknown, as this would involve future claims that may be made against the Funds that have not yet occurred. However, based on experience, the Funds expect the risk of loss to be remote.
Each Fund has a revolving line of credit agreement with U.S. Bank, N.A. (the “Bank”). Borrowings under these arrangements are secured by investments held in the Funds’ portfolios as notated on the Schedules of Investments and bear interest at the Bank’s prime rate. For the year ended June 30, 2013, only the James Long-Short Fund utilized its line of credit. The average amount of borrowings was $2,265,000 over 42 days with a weighted-average interest rate of 3.25%. As of June 30, 2013, the James Long-Short Fund did not have an outstanding balance with respect to the line of credit. Interest on funded and unfunded loans can be found under interest expense on the Statements of Operations. The remaining funds entered into individual line of credit agreements on March 8, 2013. There were no borrowings on these lines during the year. The terms of the agreements can be characterized as follows:
| | | | | | | | | | |
| Fund | | Maximum
Balance
Available | | | Interest
Rate | | Expiration
Date | |
| |
James Balanced: | | | | | | | | | | |
Golden Rainbow Fund | | $ | 50,000,000 | | | Prime Rate* | | | July 15, 2013 | |
| |
James Small Cap Fund | | $ | 6,500,000 | | | Prime Rate* | | | July 15, 2013 | |
| |
James Mid Cap Fund | | $ | 715,000 | | | Prime Rate* | | | July 15, 2013 | |
| |
James Micro Cap Fund | | $ | 540,000 | | | Prime Rate* | | | July 15, 2013 | |
| |
James Long-Short Fund | | $ | 3,000,000 | | | Prime Rate* | | | July 15, 2013 | |
| |
*The rate at which the Bank announces as its prime lending rate.
| 7 | . NEW ACCOUNTING PRONOUNCEMENTS |
In December 2011, FASB issued ASU No. 2011-11, “Disclosures about Offsetting Assets and Liabilities” (“ASU 2011-11”). These disclosure requirements are intended to help investors and other financial statement users to better assess the effect or potential effect of offsetting arrangements on a fund’s financial position. They also improve transparency in the reporting of how companies mitigate credit risk, including disclosure of related collateral pledged or received. In addition, ASU 2011-11 facilities comparison between those reporting entities that prepare their financial statements on the basis of U.S. GAAP and those reporting entities that prepare their financial statements on the basis of IFRS. Specifically, ASU 2011-11 requires reporting entities to disclose 1) both gross and net information about both instruments and transactions eligible for offset in the financial statements and 2) instruments and transactions subject to an agreement similar to a master netting
agreement. The effective date of ASU 2011-11 is for interim and annual periods beginning on or after January 1, 2013. At this time, management is evaluating the implications of this requirement and the impact it will have on the Funds’ financial statement disclosures.
| | |
| James Advantage Funds | | Report of Independent Registered Public Accounting Firm |
| | |
To the Board of Trustees and Shareholders of the James Advantage Funds:
We have audited the accompanying statements of assets and liabilities, including the schedules of investments, of the James Advantage Funds (the “Trust”), comprised of James Balanced: Golden Rainbow Fund, James Small Cap Fund, James Mid Cap Fund, James Micro Cap Fund, and James Long-Short Fund, as of June 30, 2013, and the related statements of operations for the year then ended, the statements of changes in net assets for each of the two years in the period then ended, and the financial highlights for each of the periods presented. These financial statements and financial highlights are the responsibility of the Trust’s management. Our responsibility is to express an opinion on these financial statements and financial highlights based on our audits.
We conducted our audits in accordance with the standards of the Public Company Accounting Oversight Board (United States). Those standards require that we plan and perform the audit to obtain reasonable assurance about whether the financial statements and financial highlights are free of material misstatement. The Trust is not required to have, nor were we engaged to perform, an audit of its internal control over financial reporting. Our audits included consideration of internal control over financial reporting as a basis for designing audit procedures that are appropriate in the circumstances, but not for the purpose of expressing an opinion on the effectiveness of the Trust’s internal control over financial reporting. Accordingly, we express no such opinion. An audit also includes examining, on a test basis, evidence supporting the amounts and disclosures in the financial statements, assessing the accounting principles used and significant estimates made by management, as well as evaluating the overall financial statement presentation. Our procedures included confirmation of securities owned as of June 30, 2013, by correspondence with the custodian and brokers. We believe that our audits provide a reasonable basis for our opinion.
In our opinion, the financial statements and financial highlights referred to above present fairly, in all material respects, the financial position of each of the funds constituting the James Advantage Funds as of June 30, 2013, the results of their operations for the year then ended, the changes in their net assets for each of the two years in the period then ended, and the financial highlights for each of the periods presented, in conformity with accounting principles generally accepted in the United States of America.
/s/ DELOITTE & TOUCHE LLP
Cincinnati, Ohio
August 29, 2013
| | |
| | | |
| Annual Report | June 30, 2013 | | 53 |
| | |
| Additional Information | | James Advantage Funds |
June 30, 2013 (Unaudited) | | |
PROXY VOTING GUIDELINES
James is responsible for exercising the voting rights associated with the securities purchased and held by the Funds. A description of the policies and procedures that James uses in fulfilling this responsibility and information regarding how those proxies were voted during the most recent 12-month period ended June 30 are available without charge upon request by calling toll free 1-800-995-2637. These items are also available on the Securities and Exchange Commission’s website at http://www.sec.gov.
QUARTERLY PORTFOLIO DISCLOSURE
James files a complete listing of portfolio holdings for each Fund as of the end of the first and third quarters of each fiscal year on Form N-Q. The complete listing (i) is available on the Commission’s website; (ii) may be reviewed and copied at the Commission’s Public Reference Room in Washington, DC; and (iii) will be made available to shareholders upon request by calling 1-800-995-2637. Information on the operation of the Public Reference Room may be obtained by calling 1-800-SEC-0330.
ADVISORY AGREEMENT APPROVAL
The Board of Trustees, including a majority of the Trustees who are not “interested persons” of the Trust (the “Independent Trustees”), approved the continuation of the Management Agreements with James Investment Research, Inc. (the “Adviser”) for The James Balanced: Golden Rainbow Fund, The James Small Cap Fund, The James Long-Short Fund, The James Mid Cap Fund and The James Micro Cap Fund at a meeting on February 20, 2013.
The Independent Trustees were assisted by experienced independent legal counsel throughout the contract review process. They discussed the proposed continuances in executive session with such counsel at which no representatives of management or the Adviser were present. The Independent Trustees relied upon the advice of independent legal counsel and their own business judgment in determining the material factors to be considered in evaluating each Management Agreement and the weight to be given to each such factor. Among other factors, the Trustees considered for each Fund the Fund’s performance; the nature, extent and quality of the services provided; the costs of the services provided; any profits realized by the Adviser; the Adviser’s compliance policies; the extent to which economies of scale will be realized as the Fund grows; and whether fees reflect those economies of scale. The conclusions reached by the Independent Trustees were based on a comprehensive evaluation of all of the information provided and were not the result of any one factor. Moreover, each Independent Trustee may have afforded different weight to the various factors in reaching his conclusions with respect to each Agreement.
At the February 20, 2013 Board meeting, a representative of the Adviser referred the Trustees to the materials that had been provided to them for purposes of their consideration of the Management Agreements for the Funds. He reviewed the services
provided by the Adviser to the Funds, as well as a comparison of the advisory services provided to other clients. He noted that the Adviser spends more time servicing the Funds’ shareholders than many other mutual fund advisers do. He reported that there were no material changes in the structure or relationships of the Adviser.
The representative next reviewed with the Trustees the average total returns of each Fund through December 31, 2012 (one year, three years, five years and ten years (or inception, to the extent applicable)), and the expense ratios and management fees of each Fund through June 30, 2012, with a peer group of funds with the same, or very similar, investment objectives and strategies. September 30 is the fiscal year-end for the Adviser and was deemed the appropriate date on which to measure expenses and revenues of the Adviser. He reminded the Trustees that the peer groups were the same peer groups as had been used for comparison purposes at prior Board meetings, noting that each peer group had been selected based on the investment style and strategies employed by the Funds, as well as by asset size. He also reviewed comparisons of the Funds’ performance with their respective benchmarks.
The Trustees then discussed each Fund’s performance. With respect to The James Balanced: Golden Rainbow Fund, they noted that the Fund’s Retail Class had outperformed its peer group average and its benchmark for the three-, five- and ten-year periods (but underperformed for the one-year period), and continues to be one of the better performing funds in the Morningstar Conservative Allocation Category over the longer term. For The James Small Cap Fund, the Trustees noted that the Fund had outperformed its peer group average and its benchmark for the three- and ten-year periods, but underperformed its peer group average and benchmark for the one- and five-year periods. The Trustees then noted that The Long-Short Fund had outperformed its peer group average for the one-year period and the period from inception (May 23, 2011), but underperformed its benchmark for the same periods. The Trustees determined that these periods were too short to be meaningful. The Trustees then noted that the Mid Cap Fund had underperformed its peer group average and its benchmark for the one-year, three-year, five-year and since-inception (June 30, 2006) periods. However, they pointed out that the Fund’s performance for the since-inception period only trailed its peer group average by 13 basis points. For The James Micro Cap Fund, the Trustees noted that the Fund had underperformed its peer group average and its benchmark for the one-year period and since inception (July 1, 2010). They considered that much of the Fund’s underperformance during its first year was due to the timing of new money coming into the Fund during the Fund’s initial six months and resultant cash that took time to invest in a rising market. The Trustees also noted that, with the exception of The Long-Short Fund, each of the Funds had underperformed its peer group average for the one-year period, in some cases by significant margins. The representative indicated that the Adviser’s methodology had been out of favor during the first half of the year, but pointed out, as discussed in the shareholder letter in the semi-annual report, that the Funds’ across-the-board outperformance in the second half of the year was strong evidence that its methodology is back in favor. The Trustees emphasized that
| | |
| James Advantage Funds | | Additional Information |
| | June 30, 2013 (Unaudited) |
they were focusing more on the longer-term performance which, for each Fund that has at least three years of operations, they considered to be in an acceptable range. The Trustees also noted that, while they acknowledged that performance relative to benchmarks and peer groups was important, they were more focused on how successful a fund is in meeting its investment objectives over the long term. At the conclusion of their review of the above Funds’ performance, the Trustees noted that the Adviser regularly analyzes each Fund’s performance, and may make changes in the weight it gives certain factors as a result of the analysis.
A representative of the Adviser then reviewed a description of the other services provided to the Funds. He reviewed the marketing services provided, noting that the cost of these services was, in part, reimbursed through the Funds’ 12b-1 plans and emphasized that the Adviser is fully committed to marketing the Funds. The independent legal counsel noted, and the Trustees acknowledged, that the Trustees could not take into consideration any marketing expenses incurred by the Adviser in determining whether the management fee for any Fund is reasonable. The representative reminded the Trustees that an employee of an affiliate of the Adviser serves as the CCO of the Funds and that the Adviser pays the CCO costs of the Funds pursuant to the Management Agreements. He also noted that the Adviser monitors the expenses of each Fund and gives careful attention to the allocation of expenses among the Funds. The representative further noted that the Adviser provides substantial individualized attention to the Funds’ shareholders.
The representative then reviewed the management fee and expense ratio for each Fund and compared the fee and expense ratio with the average management fee and expense ratio of the Fund’s respective peer group. He noted that the expense ratio was more meaningful than the actual management fee for all of the Funds, except The James Balanced: Golden Rainbow Fund, because they have a universal fee structure where the Adviser pays all of the expenses of the Fund and is compensated with a higher management fee. The representative further noted that most of the funds in the peer group comparisons do not share this structure. In this regard, the Trustees noted that, instead of comparing actual management fees, it was more appropriate to compare for all of the Funds, except The James Balanced: Golden Rainbow Fund, total expense ratios, due to the fact that they each had a universal fee structure. The Trustees further noted that some of the funds in the peer groups were one class of a fund that had many classes and, thus, benefit from economies of scale provided by the other classes. The representative then reviewed with the Trustees the calculation of the net adjusted management fee for each of the universal fee Funds (the fee after deduction of all direct expenses, other than distribution-related expenses, paid by the Adviser). The Trustees noted that the comparison of the net adjusted management fee with the average management fee for its peer group was extremely helpful in their analysis, as expense ratios are affected by a number of factors other than management fees. They remarked that for each of the Long-Short Fund and the Micro Cap Fund the net management fee was substantially less than the average management fee for its peer group, and that for each of the Small
Cap and Mid Cap Funds the net fee was much closer to the average fee for its peer group.
The Trustees also took into account that most of the advisers to peer group funds do not do their own research and therefore do not have the costs or expenditure of time that the Adviser has in performing its advisory services. The representative of the Adviser represented this as significant justification for the Adviser to have higher fees than average, as compared to other advisers. In particular, in considering the Balanced: Golden Rainbow Fund management fee, the Independent Trustees recognized the significant extra time and effort involved in the Adviser doing its own research and noted that, in general, the Fund has outperformed as a result. Based on their review, the Trustees concluded that the management fees for each of the Funds appeared reasonable. The Trustees then discussed the management fees of the Funds compared to the fees charged by the Adviser for similar private accounts.
The Independent Trustees indicated that they had reviewed an analysis of the Adviser’s profitability with respect to the Funds during their executive session held earlier today, as well as information from a 2011 Lipper profitability analysis of 26 investment managers comprising nearly one quarter of total investment company assets, giving median (and the range of) profitability margins with and without distribution and marketing expenses. The Trustees reviewed the expense and profitability information and, after discussion with representatives of the Adviser, concluded that the information provided was adequate for them to determine whether the overall profitability was reasonable. The Independent Trustees noted that their review of the analysis in executive session included a calculation of profitability without deduction of distribution-related expenses, as well as a consideration of the appropriate level of wage expenses to be included. They also stated that they had considered the proper allocation of common expenses, indicating that they had determined it was more appropriate to allocate expenses pro rata, based on assets, than to allocate them equally among the Funds. In this regard, they noted that the Balanced: Golden Rainbow Fund holds municipal bonds, corporate bonds, TIPS, mortgage-backed bonds and international bonds (which require foreign currency transactions). A representative of the Adviser pointed out that the portfolio management time, accounting peculiarities, trading and clearing functions are considerable for those types of investments, which are not used by the other Funds.
While the Trustees indicated their belief that distribution expenses paid by the Adviser should be taken into account in considering the Adviser’s profitability, they indicated that their review of profitability without deduction of distribution expenses reflected an acceptable level of profitability with respect to each Fund, particularly when wages were included at a level that would reflect the cost of hiring an equivalent team of portfolio managers that do their own research. They emphasized the difficulty of looking at profitability on an objective basis, noting that profitability was an uncertain determination and that an adviser should not be penalized for being more efficient (and thus more profitable). After further discussion, the
| | |
| | | |
| Annual Report | June 30, 2013 | | 55 |
| | |
| Additional Information | | James Advantage Funds |
June 30, 2013 (Unaudited) | | |
Trustees acknowledged that the profitability levels of those Funds that were profitable to the Adviser were in the acceptable range.
A representative of the Adviser then reminded the Trustees that the Adviser had added breakpoints in the management fee for each of the Funds. The Trustees acknowledged that the Adviser was entitled to reasonable profits and indicated that the existing breakpoints should pass on the benefits of economies of scale to shareholders.
The Trustees then reviewed other benefits that might be realized by the Adviser as a result of its relationship with the Funds. A representative of the Adviser noted that the Adviser does not have any soft dollar arrangements with broker-dealers. He acknowledged that the Adviser benefits from its association with the Funds and that it currently benefits from favorable press generated by the Funds.
At this point, the Trustees indicated that it was their consensus that the information presented and the discussion of the information were adequate for making a determination regarding the renewal of the Management Agreements. The Trustees stated that they were satisfied with the Adviser’s and each Fund’s performance, and they complimented the Adviser on its adherence to its basic methodology, particularly when it was out of favor. The Trustees then concluded that, based on their review of the management fees and overall expense comparisons, as well as all information relating to the profitability of the Adviser, that the management fees for each Fund were reasonable and that the arrangements were not generating excessive profits to the Adviser. The Trustees further concluded that the existing fee breakpoints would make each Fund’s management fee reflective of economies of scale.
As to the nature, extent and quality of services provided by the Adviser, the Trustees expressed their common opinion that the Adviser’s personnel are highly qualified, that the Adviser provides excellent services to the Funds and that the extent of the services is consistent with the Board’s expectations. In this regard, the Trustees noted that they had discussed each Fund’s possible investment in exchange-traded funds, such as iShares funds and similar products, which would be used to gain exposure to particular investment products, indexes or sectors of a market or index. After discussion, it was their unanimous conclusion that the fees to be paid to the Adviser are based on services provided that are in addition to, rather than duplicative of, the services provided under the advisory agreements of the ETFs and similar products. The Trustees also indicated that they believed, based on their quarterly meetings in executive session with the Adviser’s (and the Funds’) CCO, that the Adviser had maintained an appropriate compliance program through the reporting period.
After further discussion, and based upon all of the above-mentioned factors and their related conclusions, with no single factor or conclusion being determinative and with each Trustee not necessarily attributing the same weight to each factor, the Trustees unanimously determined that the continuation of each Management Agreement for an additional year was in the best interests of the applicable Fund and its shareholders.
TAX DESIGNATIONS
Qualified Dividend Income
The percentage of ordinary income dividends distributed during the calendar year ended December 31, 2012 are designated as qualified dividend income (QDI) as defined in Section 1(h)(11) of the Internal Revenue Code in the following percentages:
| | | | | | |
| | | Amount | | | |
James Balanced: Golden Rainbow Fund | | | 81.09% | | | |
James Small Cap Fund | | | 100.00% | | | |
James Mid Cap Fund | | | 100.00% | | | |
James Micro Cap Fund | | | 100.00% | | | |
James Long-Short Fund | | | 100.00% | | | |
Dividends Received Deduction
For corporate shareholders, the following ordinary dividends paid during the calendar year ended December 31, 2012 qualify for the corporate dividends received deduction:
| | | | | | |
| | | Amount | | | |
James Balanced: Golden Rainbow Fund | | | 80.51% | | | |
James Small Cap Fund | | | 100.00% | | | |
James Mid Cap Fund | | | 100.00% | | | |
James Micro Cap Fund | | | 100.00% | | | |
James Long-Short Fund | | | 100.00% | | | |
Pursuant to Section 852(b)(3) of the Internal Revenue Code, James Balanced: Golden Rainbow Fund designated $12,243,493 as long-term capital gains dividend.
| | |
| James Advantage Funds | | Trustees and Officers |
| | June 30, 2013 (Unaudited) |
| | | | | | | | |
INTERESTED TRUSTEES | | | | |
| Name/Address/Age | | Position(s) With Fund/ Time Served | | Principal Occupation by Trustee | | Number of Portfolios in
Fund Complex Overseen | | Other Directorships Held
by Trustee Outside During the
Past 5 Years |
| | | | |
Barry R. James, CFA James Investment Research, Inc. 1349 Fairground Road Beavercreek, OH 45385 Age: 56 | | President &Trustee since 1997 | | President and CEO, James Investment Research (2005- Present), Executive Vice President James Investment Research (2000-2006), CEO, James Capital Alliance (2005-Present) and Director (1992- Present) | | 5 | | Director, Heart to Honduras Director, FAIR Foundation (2010 – Present), Owner – www.mrmicrobusiness.com |
| | |
INDEPENDENT TRUSTEES | | | | |
| Name/Address*/Age | | Position(s) With Fund/
Time Served | | Principal Occupation by Trustee | | Number of Portfolios in
Fund Complex Overseen | | Other Directorships Held
by Trustee Outside During the
Past 5 Years |
| | | | |
Anthony P. D’Angelo Age: 83 | | Trustee since 1997 | | Retired, Professor Emeritus, Graduate School of Logistics and Acquisitions Management, Air Force Institute of Technology, Wright-Patterson AFB, Ohio (Retired since 1999) | | 5 | | None |
| | | | |
Leslie L. Brandon Age: 70 | | Trustee since 2003 | | Retired partner, Ernst & Young LLP, Columbus, OH (1966-2000) | | 5 | | None |
| | | | |
Richard C. Russell Age: 66 | | Trustee since 2003 | | Consultant, Danis Companies (construction and real estate development firm), (2002-present) | | 5 | | Director, Excellence in Motivation (1994-present); Director, Dayton Reliable Tool (1999-present) |
* All Trustees may be contacted at c/o The James Advantage Funds, Attn: Secretary, 1349 Fairground Road, Beavercreek, OH 45385.
| | | | |
OFFICERS | | | | |
| Name/Address/Age | | Position(s) With Fund/Time Served | | Principal Occupation by Officer |
Thomas L. Mangan James Investment Research, Inc. 1349 Fairground Road Beavercreek, OH 45385 Age: 63 | | Vice President, Secretary and Chief Financial Officer since 1997 | | Senior Vice President, James Investment Research, Inc. |
Richard Brian Culpepper James Investment Research, Inc. 1349 Fairground Road Beavercreek, OH 45385 Age: 41 | | Assistant Secretary since 2011 | | First Vice President, James Investment Research, Inc. |
JoEllen L. Legg c/o ALPS Fund Services, Inc. 1290 Broadway, Ste. 1100 Denver, CO 80203 Age: 51 | | Assistant Secretary since 2010 | | Vice President and Assistant General Counsel of ALPS Fund Services, Inc., ALPS Advisors Inc., ALPS Distributors Inc. and ALPS Portfolio Solutions Distributor Inc. Ms. Legg is also the Secretary of ALPS Series Trust, Assistant Secretary of the Stone Harbor Investment Funds, Stone Harbor Emerging Markets Income Fund, Stone Harbor Emerging Markets Total Income Fund, and WesMark Funds. |
| | |
| | | |
| Annual Report | June 30, 2013 | | 57 |
| | |
| Trustees and Officers | | James Advantage Funds |
June 30, 2013 (Unaudited) | | |
| | | | |
OFFICERS (CONTINUED) | | | | |
| Name/Address/Age | | Position(s) With Fund/Time Served | | Principal Occupation by Officer |
Amy Broerman James Investment Research, Inc. 1349 Fairground Road Beavercreek, OH 45385 Age: 41 | | Treasurer since 2012 | | Assistant Vice President of Operations, James Investment Research, Inc. |
John Moore c/o ALPS Fund Services, Inc. 1290 Broadway, Ste. 1100 Denver, CO 80203 Age: 44 | | Assistant Treasurer since 2012 | | Fund Controller of ALPS Fund Services, Inc. |
Lesley Ott James Investment Research, Inc. 1349 Fairground Road Beavercreek, OH 45385 Age: 30 | | Chief Compliance Officer since 2012 | | Chief Compliance Officer of James Investment Research, Inc., Chief Compliance Officer of James Capital Alliance, Inc. |
| | |
| James Advantage Funds | | Privacy Policy |
| | June 30, 2013 (Unaudited) |
Facts
What does James Advantage Funds do with your personal information?
Why?
Financial companies choose how they share your personal information. Federal law gives consumers the right to limit some, but not all sharing. Federal law also requires us to tell you how we collect, share, and protect your personal information. Please read this notice carefully to understand what we do.
What?
The types of personal information we collect and share depends on the product or service that you have with us. This information can include:
| | • | | Social Security number and wire transfer instructions |
| | • | | account transactions and transaction history |
| | • | | investment experience and purchase history |
When you are no longer our customer, we continue to share your information as described in this notice.
How?
All financial companies need to share customers’ personal information to run their everyday business. In the section below, we list the reasons financial companies can share their customers’ personal information; the reasons James Advantage Funds chooses to share; and whether you can limit this sharing.
| | | | |
| Reasons we can share your personal information: | | Does James Advantage Funds
share information? | | Can you limit this sharing? |
| For our everyday business purposes - such as to process your transactions, maintain your account(s), respond to court orders and legal investigations, or report to credit bureaus. | | YES | | NO |
| For our marketing purposes - to offer our products and services to you. | | YES | | NO |
| For joint marketing with other financial companies. | | NO | | We don’t share |
| For our affiliates’ everyday business purposes - information about your transactions and records. | | NO | | We don’t share |
| For our affiliates’ everyday business purposes - information about your credit worthiness. | | NO | | We don’t share |
| For our affiliates to market to you | | NO | | We don’t share |
For non-affiliates to market to you | | NO | | We don’t share |
Questions? Call 1-800-99 James
| | |
What we do: | | |
| How does James Advantage Funds protect my personal information? | | To protect your personal information from unauthorized access and use, we use security measures that comply with federal law. These measures include computer safeguards and secured files and buildings. Our service providers are held accountable for adhering to strict policies and procedures to prevent any misuse of your nonpublic personal information. |
| How does James Advantage Funds collect my personal information? | | We collect your personal information, for example, when you • open an account or deposit money • direct us to buy securities or direct us to sell your securities • seek advice about your investments We also collect your personal information from others, such as credit bureaus, affiliates, or other companies. |
| Why can’t I limit all sharing? | | Federal law gives you the right to limit only: • sharing for affiliates’ everyday business purposes – information about your creditworthiness. • affiliates from using your information to market to you. • sharing for nonaffiliates to market to you. State laws and individual companies may give you additional rights to limit sharing. |
| |
Definitions | | |
| Affiliates | | Companies related by common ownership or control. They can be financial and non-financial companies. • Our affiliates include financial companies, such as James Investment Research, Inc. and James Capital Alliance. |
| Non-affiliates | | Companies not related by common ownership or control. They can be financial and non-financial companies. • James Advantage Funds does not share with nonaffiliates so they can market to you. |
| Joint marketing | | A formal agreement between nonaffiliated financial companies that together market financial products or services to you. • James Advantage Funds does not jointly market. |
| | |
| | | |
| Annual Report | June 30, 2013 | | 59 |
| | |
| Notes | | James Advantage Funds |

Item 2. Code of Ethics.
| (a) | As of the end of the period covered by this report, the registrant has adopted a code of ethics that applies to the registrant’s principal executive officer, principal financial officer, principal accounting officer or controller, or persons performing similar functions, regardless of whether these individuals are employed by the registrant or a third party. |
| (b) | For purposes of this item, “code of ethics” means written standards that are reasonably designed to deter wrongdoing and to promote: |
| | (1) | Honest and ethical conduct, including the ethical handling of actual or apparent conflicts of interest between personal and professional relationships; |
| | (2) | Full, fair, accurate, timely, and understandable disclosure in reports and documents that a registrant files with, or submits to, the Commission and in other public communications made by the registrant; |
| | (3) | Compliance with applicable governmental laws, rules, and regulations; |
| | (4) | The prompt internal reporting of violations of the code to an appropriate person or persons identified in the code; and |
| | (5) | Accountability for adherence to the code. |
| (c) | Amendments: During the period covered by this report, there were no amendments to the provisions of the code of ethics. |
| (d) | Waivers: During the period covered by this report, the registrant has not granted any express or implicit waivers from the provisions of the code of ethics. |
| (e) | Not applicable to this report. |
| (f) | The Registrant’s Code of Ethics is attached as an Exhibit hereto. |
Item 3. Audit Committee Financial Expert.
| (a) | The registrant’s board of trustees has determined that Leslie L. Brandon is an audit committee financial expert. Mr. Brandon is independent for purposes of this Item 3. |
| (b) | For purposes of this Item, an “audit committee financial expert” means a person who has the following attributes: |
| | (1) | An understanding of generally accepted accounting principles and financial statements; |
| | (2) | The ability to assess the general application of such principles in connection with the accounting for estimates, accruals, and reserves; |
| | (3) | Experience preparing, auditing, analyzing, or evaluating financial statements that present a breadth and level of complexity of accounting issues that are generally comparable to the breadth and complexity of issues that can reasonably be expected to be raised by the registrant’s financial statements, or experience actively supervising one or more persons engaged in such activities; |
| | (4) | An understanding of internal control over financial reporting; and |
| | (5) | An understanding of audit committee functions. |
| (c) | A person shall have acquired such attributes through: |
| | (1) | Education and experience as a principal financial officer, principal accounting officer, controller, public accountant, or auditor or experience in one or more positions that involve the performance of similar functions; |
| | (2) | Experience actively supervising a principal financial officer, principal accounting officer, controller, public accountant, auditor, or person performing similar functions; |
| | (3) | Experience overseeing or assessing the performance of companies or public accountants with respect to the preparation, auditing, or evaluation of financial statements; or |
| | (4) | Other relevant experience. |
| | (1) | A person who is determined to be an audit committee financial expert will not be deemed an “expert” for any purpose, including without limitation for purposes of Section 11 of the Securities Act of 1933 (15 U.S.C. 77k), as a result of being designated or identified as an audit committee financial expert pursuant to this Item. |
| | (2) | The designation or identification of a person as an audit committee financial expert pursuant to this Item does not impose on such person any duties, obligations, or liability that are greater than the duties, obligations, and liability imposed on such person as a member of the audit committee and board of directors in the absence of such designation or identification. |
| | (3) | The designation or identification of a person as an audit committee financial expert pursuant to this Item does not affect the duties, obligations, or liability of any other member of the audit committee or board of directors. |
Item 4. Principal Accountant Fees and Services.
| | |
June 30, 2013 | | June 30, 2012 |
$83,000 | | $80,000 |
Such audit fees represent the aggregate fees billed for the fiscal years ended June 30, 2013 and June 30, 2012 for professional services rendered by Deloitte & Touche LLP for the audit of the registrant’s annual financial statements.
| | | | |
| | | Registrant | | Adviser |
| June 30, 2013 | | $0 | | $0 |
| June 30, 2012 | | $0 | | $0 |
Neither the registrant nor the adviser was billed any fees by Deloitte & Touche LLP for the fiscal years ended June 30, 2013 and June 30, 2012 for assurance and related services that were reasonably related to the performance of the audit of the registrant’s financial statement and not otherwise included under “Audit Fees” above.
| | | | |
| | | Registrant | | Adviser |
| June 30, 2013 | | $11,500 | | $0 |
| June 30, 2012 | | $11,100 | | $0 |
“Tax fees” shown in the table above were for services provided by Deloitte & Touche LLP in relation to the preparation of excise filings and income tax returns for the registrant.
| | | | |
| | | Registrant | | Adviser |
| June 30, 2013 | | $0 | | $0 |
| June 30, 2012 | | $0 | | $0 |
The registrant was not billed any fees by Deloitte & Touche LLP for products and services provided by Deloitte & Touche LLP, other than the services reported above in items (a) - (c), for the fiscal years ended June 30, 2013 and June 30, 2012.
| (e) | Pre-Approval Policies and Procedures. |
| | (1) | Pursuant to the registrant’s Audit Committee Charter (the “Charter”), the Audit Committee is directly responsible for the appointment, termination, compensation, and oversight of the work of any registered public accounting firm employed by the registrant. In addition, the Charter provides that the Audit Committee is responsible for reviewing and approving in advance any and all proposals under which the independent auditor would provide “permissible non-audit services” (as defined in the Charter) to the registrant or to the investment adviser to the registrant (not including any sub-adviser whose role is primarily portfolio management and that is sub-contracted or overseen by the investment |
| | adviser to the registrant) or any entity controlling, controlled by, or under common control with the investment adviser that provides ongoing services to the registrant if those permissible non-audit services relate directly to the operations and financial reporting of the registrant. In determining whether to pre-approve non-audit services, the Audit Committee considers whether such services are consistent with the independent auditor’s independence. |
(2)
| | | | |
| | | Registrant | | Adviser |
| Audit Related | | 100% | | n/a |
| Tax Fees | | 100% | | n/a |
| Other Fees | | n/a | | n/a |
| (f) | Not applicable to the registrant. |
| (g) | Aggregate non-audit fees billed by the registrant’s accountant: |
| | | | |
| | | Registrant | | Adviser |
| June 30, 2013 | | $11,500 | | $0 |
| June 30, 2012 | | $11,100 | | $0 |
| (h) | The registrant’s audit committee of the board of trustees has considered that the provision of non-audit services that were rendered to an entity controlling, controlled by, or under common control with the registrant’s investment adviser that provides ongoing services to the registrant for the fiscal years ended June 30, 2013 and June 30, 2012, as identified above, that were not pre-approved pursuant to paragraph (c)(7)(ii) of Rule 2-01 of Regulation S-X, are compatible with maintaining Deloitte & Touche LLP’s independence. |
Item 5. Audit Committee of Listed Registrants.
Not applicable to the registrant.
Item 6. Investments.
| (a) | The Schedule of Investments is included as part of the report to shareholders filed under Item 1 of this Form. |
| (b) | Not applicable to the registrant. |
Item 7. Disclosure of Proxy Voting Policies and Procedures for Closed-End Management Investment Companies.
Not applicable to the registrant.
Item 8. Portfolio Managers of Closed-End Management Investment Companies.
Not applicable to the registrant.
Item 9. Purchases of Equity Securities by Closed-End Management Investment Company and Affiliates Purchasers.
Not applicable to the registrant.
Item 10. Submission of Matters to a Vote of Security Holders.
The registrant has not adopted procedures by which shareholders may recommend nominees to the registrant’s board of trustees.
Item 11. Controls and Procedures.
| (a) | Based on an evaluation of the registrant’s disclosure controls and procedures (as defined in Rule 30a-3(c) under the 1940 Act), the registrant’s principal executive officer and principal financial officer have concluded that the registrant’s disclosure controls and procedures are effective as of a date within 90 days of the filing date of this report. |
| (b) | There were no significant changes in the registrant’s internal control over financial reporting that occurred during the registrant’s last fiscal half-year that have materially affected, or are reasonably likely to materially affect, the registrant’s internal control over financial reporting. |
Item 12. Exhibits.
| | |
| (a)(1) | | Registrant’s Code of Ethics for Principal Executive and Principal Financial Officers, which is the subject of the disclosure required by Item 2 of Form N-CSR, is attached hereto as Exhibit 12(a)(1). |
| |
| (a)(2) | | Certifications required by Item 12(a)(2) of Form N-CSR are filed herewith as Exhibit 99.CERT. |
| |
| (b) | | Certifications required by Item 12(b) of Form N-CSR are filed herewith as EX-99.906CERT. |
SIGNATURES
Pursuant to the requirements of the Securities Exchange Act of 1934 and the Investment Company Act of 1940, the registrant has duly caused this report to be signed on its behalf by the undersigned, thereunto duly authorized.
(Registrant) James Advantage Funds
By (Signature and Title)
/s/ Barry R. James
Barry R. James
President
Date: September 9, 2013
Pursuant to the requirements of the Securities Exchange Act of 1934 and the Investment Company Act of 1940, this report has been signed below by the following persons on behalf of the registrant and in the capacities and on the dates indicated.
By (Signature and Title)
/s/ Barry R. James
Barry R. James
President
Date: September 9, 2013
By (Signature and Title)
/s/ Thomas L. Mangan
Thomas L. Mangan
Chief Financial Officer
Date: September 9, 2013